Brine Generation Study
|
|
|
- Candace Charles
- 5 years ago
- Views:
Transcription

1 DOE/WIPP Brine Generation Study April 2000 Waste Isolation Pilot Plant Carlsbad, New Mexico Processing and final preparation of this report was performed by the Waste Isolation Pilot Plant Management and Operating Contractor for the U. S. Department of Energy under Contract No. DE-AC04-86AL31950
2 TABLE OF CONTENTS LIST OF FIGURES... ii 1.0 INTRODUCTION Background Objectives Scope Data Presentation VENTILATION RELATIVE HUMIDITY CATCH BASIN FLOW PRECIPITATION DISCUSSION CONCLUSION... 28
3 LIST OF FIGURES Figure Exhaust Shaft Airflow, June 1, October 31, Figure Exhaust Shaft Airflow, June 1 - October 31, Figure Exhaust Shaft Airflow, May 1 - August 1, Figure Hours of No Airflow and Reduced Airflow, June 1, October 31, Figure Average, Minimum, and Maximum Relative Humidity Values, June 1, October 31, Figure Average, Minimum, and Maximum Relative Humidity Values, June 1 - October 31, Figure Average, Minimum, and Maximum Relative Humidity Values, May 1 - August1, Figure Volume of Fluid Removed from the Catch Basin, June 1, October 31, Figure WIPP Site Precipitation, June 1, October 31, Figure Comparison of Ventilation, Precipitation, and Catch Basin Data, June 1 - October 31, Figure Hours of No Airflow, Reduced Airflow, Precipitation, and Catch Basin Data, June 1 - October 31, Figure Comparison of Relative Humidity, Precipitation, and Catch Basin Data, June 1 - October 31, Figure Airflow, Hours No Flow, Reduced Airflow, Precipitation, and Catch Basin Data, May 1 - August 1, Figure Relative Humidity, Precipitation, and Catch Basin Data, May 1 - August 1, Figure Airflow and Catch Basin Data, June 1, October 31, Figure Airflow, Catch Basin, and Precipitation Data, November 1, April 30, Figure Relative Humidity, Precipitation, and Catch Basin Data, November 1, April 30, ii
4 1.0 INTRODUCTION 1.1 Background In a May 1995 inspection of the WIPP-site Exhaust Shaft indicated that water was seeping through the shaft's concrete liner at depths of 50 to 85 feet below ground surface. In March 1996 a catch basin was installed at the base of the Exhaust Shaft to intercept and prevent fluid from entering the repository horizon. Analyses of fluid samples collected from the catch basin indicated that some samples had concentration levels that exceeded U.S. Environmental Protection Agency (EPA) toxicity characteristics for lead under Title 40 Code of Federal Regulations (CFR) Ventilation system operations, weather conditions, and seepage into the Exhaust Shaft have resulted in operational problems. First, increased moisture in the shaft has affected air filters on sampling probes located near the top of the Exhaust Shaft, thus preventing analysis of air samples. Second, production of fluid in the shaft reporting to the catch basin created a disposal problem of the fluid which has been classified as a hazardous material under 40 CFR for lead. Though these problems do not effect the stability of the shaft they are a nuisance in that they increase operational costs and impact operation of the Exhaust Shaft air-monitoring system. 1.2 Objectives The objective of this report is to examine those factors effecting the quantity of fluid reporting to the Exhaust Shaft Catch Basin; determine their relative importance; and determine what measures can be implemented to reduce operational problems in the Exhaust Shaft. 1.3 Scope Five parameters (airflow, ventilation system operation, relative humidity, precipitation, and the quantity of fluid reporting to the catch basin) were examined over a 17-month period extending from June 1998 through October Plots of the data were intended to provide sufficient detail to establish trends between parameters. There are, however, limitations in the data due to the data availability, the sampling frequency, and the extreme variability of some parameter values over short intervals of time (e.g., relative humidity) and correlating the data to specific events. 1.4 Data Presentation Data is presented in several formats. Air ventilation data, based on entries manually recorded in the WIPP-site Central Monitoring Room (CMR) logbook are presented as daily average flow rates in units of cubic feet per minute (CFM). Ventilation system operations examines the number of hours during the course of a day during which there is either no airflow or reduced airflow conditions in the Exhaust Shaft. Prolonged periods of no and/or reduced airflow increases the probability of fluid reporting to the catch basin. Relative humidity data are measured at the WIPP site Weather Station and presented in the form of high-low-close plots providing the average and the minimum and maximum relative humidity values for each day. Since the relative 1
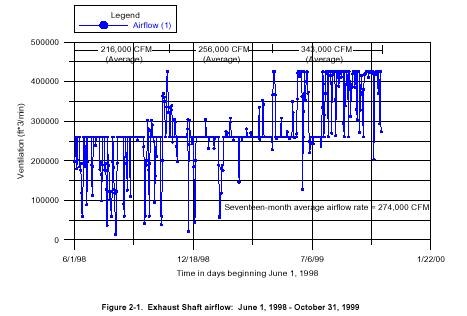
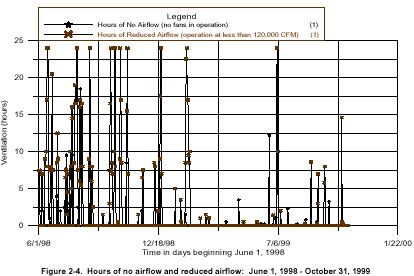
5 humidity can vary by as much as 80 percent or more over the course of a 24-hour period, daily average relative humidity values do not adequately portray the conditions in the shaft at any given time. Therefore, relative humidity values include not only the average but also the high-low values for each day. The volume of fluid removed from the catch basin is measured and recorded in units of gallons. Fluid is removed from the catch basin Monday through Friday, if required. Care must be taken in examining and interpreting catch-basin data in that there may be a multi-day lag time between the time fluid reports to the catch basin and the time in which the fluid is actually removed. Precipitation is the last of the five variables presented. Precipitation is measured at the WIPP site Weather Station and reported in units of millimeters of rainfall per day. For this report precipitation is presented in English units of inches. 2.0 VENTILATION This section discusses Exhaust Shaft airflow measurements collected between June 1, 1998, and October 31, Measurements were collected by Central Monitoring Room personnel at the WIPP and recorded in the CMR logbook. Data is based on the following fan operations: one 700 fan operating at 260,000 CFM, two 700 fans operating at 425,000 CFM, one 860 fan operating at 60,000 CFM, and two 860 fans operating at 120,000 CFM. Figure 2-1 is a plot of airflow versus time for the period extending from June 1998 through October The average daily airflow rate for the 17-month period was 274,000 CFM. The plot is divided into three time intervals extending from June 1, 1998, through October 31, 1998; November 1, 1998, through April 30, 1999; and May 1 through October 31, The daily average airflow rate for each of the three periods was 216, 000, 256,000 and 343,000 CFM, respectively. Figures 2-2 and 2-3 are plots of average daily airflow versus time for the periods extending from June 1 through October 31, 1998, and May 1 through August 1, 1999, respectively. These two periods are of particular interest in that 95 percent of the total volume of fluid that reported to the catch basin during the seventeen-month period occurred during these two windows of time. It is clear from Figures 2-2 and 2-3 that the most common ventilation mode was 260,000 CFM (referred to as alternate mode). Figure 2-2 shows that there were 58 days during the June through October 1998 time period where the average airflow rate dropped below 200,000 CFM. Figure 2-3 shows that there was only one day during the May through August 1999 time period when the airflow dropped below 200,000 CFM. Figure 2-3 also shows that there were significant periods of time where the shaft ventilation system was operating with two 700-fans at 425,000 CFM. A second way of viewing Exhaust Shaft ventilation data is to examine the number of hours during the day in which there was either no airflow or reduced airflow conditions in the shaft. Reduced airflow is when the ventilation system is operating on one or two 860 fans (60,000 or 120,000 CFM, respectively). Extended periods of no airflow provide favorable conditions for fluid seeping into the Exhaust Shaft to migrate down the shaft walls unabated and report to the catch basin. Reduced airflow conditions result in a decrease in the capacity of the air to carry and to remove fluid from the shaft. 2
6 Therefore, extended periods of reduced airflow can also provide favorable conditions for fluid to report to the catch basin. Figure 2-4 is a plot of hours of no airflow and reduced airflow verses time for the entire seventeen-month period. The plot identifies over 30 no airflow and 90 reduced airflow events ranging from ½-hour to 24-hours in duration. Approximately 60 percent of the events occurred between June 1 and October 31, Another 30 percent occurred between November 1, 1998, and April 30, 1999, with the remaining 10 percent occurring between May 1 and October 31,
7 4
8 5
9 6
10 7
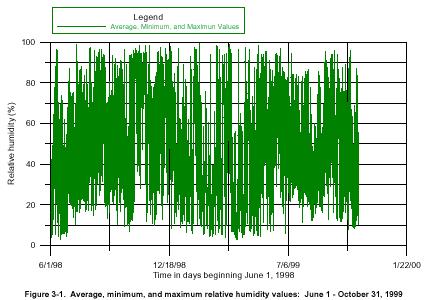
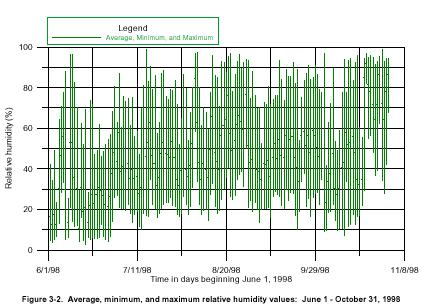
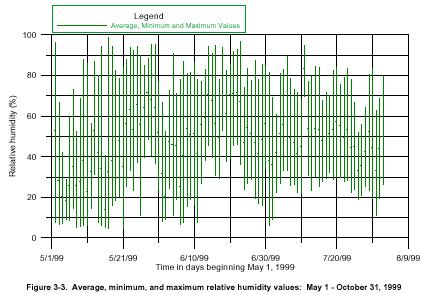
11 3.0 RELATIVE HUMIDITY Relative humidity measurements were collected from the WIPP site Weather Station. Relative humidity values were measured at fifteen-minute intervals and averaged over 24-hour periods. Daily averages and daily high and low values are presented in Figure 3-1 for the period extending from June 1, 1998 through October 31, Due to the density of the data only high and low values can be distinguished from the plot. The data is so dense that the average values cannot be distinguished. Figures 3-2 and 3-3 provide a more detailed plot of the average, high and low values for the periods extending from June 1 through October 31, 1998, and May 1 through August 1, 1999, respectively. The figures show that relative humidity values can vary by as much as 80 percent for a 24-hour period. Therefore, care must be taken in using just average relative humidity as a measure of the conditions in the shaft because it does not portray the variability experienced at the site. Daily averages tend to mask discrete high humidity events, like thunderstorms, where the humidity may be high for only a brief period of time. High-low plots are useful in that they not only provide the average relative humidity, but also define conditions of high humidity when precipitation is likely to occur. Between June 1 and October 31, 1998, there were 38 days out of 152 where the relative humidity exceeded 90 percent during the course of the day. Between May 30 and August 1, 1999, there were 18 days out of 93 when the relative humidity exceeded 90 percent. During prolonged periods of high humidity the shaft wall moisture content increases. As the walls saturate, less fluid is absorbed making more fluid available to report to the catch basin and/or be removed through the ventilation system. On the other hand, during periods of low humidity the shaft walls decrease in moisture content increasing the capacity of the walls to store fluid. The capacity of the shaft walls to absorb and lose water can result in a time lag for fluid reporting to the catch basin that is difficult to quantify. 8
12 9
13 10
14 11
15 4.0 CATCH BASIN FLOW Water enters the Exhaust Shaft through three paths. First, water enters the Exhaust Shaft through cracks or construction joints in the shaft liner. Depending on operating conditions, this water can migrate down the shaft walls into the catch basin, be absorbed into the shaft wall, or be captured in the airflow and expelled into the atmosphere through the fans. A second source of water in the shaft involves the cooling of warm, moisture-laden air from the WIPP underground facility as it rises up the Exhaust Shaft. Under certain temperature and humidity conditions water may precipitate. Again, this water can flow down the shaft wall, rain into the catch basin, be absorbed into the shaft wall, or removed through the ventilation system. Third, a small amount of geologic water may be entering the shaft. The sources of these waters have been grouted off and if geologic waters are present they are undetectable and being masked totally by the other two sources. When fluid was detected seeping into the Exhaust Shaft in 1995, a catch basin was designed and installed at the base of the Exhaust Shaft to intercept and prevent water from draining into the Waste Shaft sump. The catch basin consists of two 1' x 9' x 28' polyethylene reservoirs at the base of the Exhaust Shaft. Fluid has been removed on an as-needed basis from the Exhaust Shaft Catch Basin since March Figure 4-1 is a plot of the volume of fluid removed from the catch basin between June 1, 1998, and October 31, The plot indicates there were 33 events in which fluid was removed from the catch basin. The total volume of fluid removed during the 17-month period amounted to over 14,000 gallons. Twenty events occurred between June 1 and October 31, 1998, resulting in the removal of 9,715 gallons. Three events occurred between November 1, 1998 and April 30, 1999, resulting in the removal of 605 gallons. Thirteen events occurred between May 1 and October 31, 1999, resulting in the removal of 4,730 gallons. Care must be taken in interpreting catch basin data in that no underground work activity is performed in the repository on weekends. Therefore, it is possible that fluid can report to the catch basin as early as Friday, or even earlier, which would not be removed from the catch basin until the following Monday or until sufficient fluid is present to allow its removal by pumping. 12
16 13
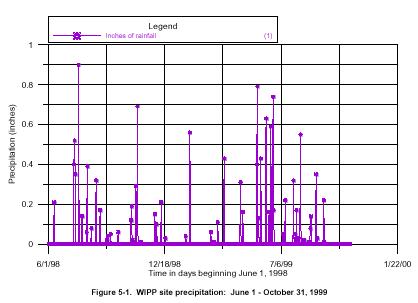
17 5.0 PRECIPITATION Precipitation data is collected daily from the WIPP Weather Station. Figure 5-1 is a plot of the precipitation measured in inches of rainfall for the period extending from June 1, 1998, to October 31, The plot identifies 59 days in which rainfall occurred ranging in magnitude from 0.01 to 0.90 inches. Twenty-one events occurred between June 1 and October 31, 1998, resulting in a total accumulation of 5.0 inches of rain. Thirteen events occurred between November 1, 1998, and April 30, 1999, resulting in a total accumulation of 2.2 inches of rain. Twenty-five events occurred between May 1 and October 31, 1999, resulting in 6.3 inches of rain. Precipitation cannot fall directly into the Exhaust Shaft, but is relative here in so much as it can increase the relative humidity. 14
18 15
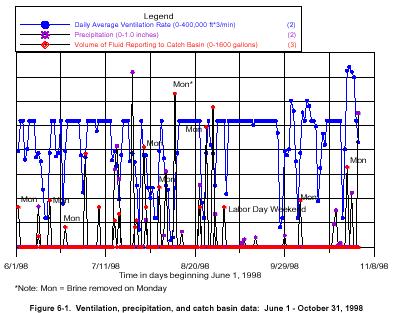
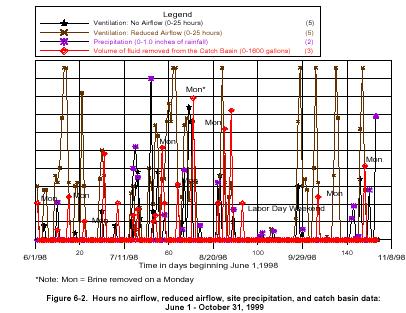
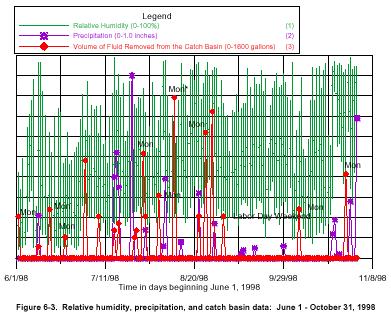
19 6.0 DISCUSSION Sections 2.0 through 5.0 summarize factors effecting the reporting of fluid to the Exhaust Shaft Catch Basin over a 17-month period extending from June 1, 1998, through October 31, Section 6.0 attempts to clarify under what conditions fluid reports to the catch basin and what factors control fluid production. Examination of the data from Sections 2.0 through 5.0 indicates that airflow is the primary factor controlling the quantity of the fluid reporting to the Exhaust Shaft Catch Basin. At the same time, relative humidity and ventilation system operations are secondary factors that can have a significant effect on fluid production depending on the present conditions in the shaft. Figure 2-1 identifies three airflow periods: (1) June through October 1998, (2) November 1998 through April 1999, and (3) May through October The average airflow for those periods was 216,000, 256,000, and 343,000 CFM, respectively. During June through October 1998 the Exhaust Shaft Ventilation was impacted by major reductions in airflow. During the 152-day period there were 68 days of reduced airflow resulting in a reduction in the average airflow rate to 44,000 CFM/day. Figure 6-1 is a plot of airflow, precipitation, and volume of fluid removed from the catch basin. There were 20 days on which an estimated 9,715 gallons of fluid were removed from the catch basin. All 20 days were associated with reductions in airflow. This may not be intuitively obvious from the plot, but remember that fluid collected on a Monday may be the result of fluid reporting to the catch basin as much as 72-hours or more earlier. In addition, any fluid reporting to the catch basin would be affected by ventilation operations until it is removed. When correlating airflow and catch basin data, the airflow rate over the previous few days must be taken into consideration. Figure 6-2 is a plot of hours of no airflow, reduced airflow, precipitation and catch basin data. This system's operation plot is helpful in that it defines windows of reduced airflow when fluid is more likely to report to the catch basin. At the same time, the plot also reveals periods of reduced airflow in which no fluid reports to the catch basin. As mentioned earlier, all 20 incidences of fluid reporting to the catch basin are associated with periods of reduced airflow. There are, however, several periods of reduced airflow in September and October 1998 where no fluid reported to the catch basin. This suggests that other factors, such as, humidity and ventilation operation, play contributing roles of varying importance. Figure 6-3 is a plot of humidity, precipitation and catch basin flow data. As noted earlier, there were 20 days on which fluid was removed from the catch basin. Of those, only six exceeded 90 percent relative humidity. On the other hand, there were 32 days where the relative humidity exceeded 90 percent with no fluid apparently reporting to the catch basin. High humidity or extended periods of high humidity do not guarantee that fluid will report to the catch basin. For example, in late October there were twelve consecutive days with relative humidity values greater than 90 percent, and yet the only incident of fluid reporting to the catch basin was associated with reduced airflow. Airflow is the primary controlling factor regulating the production and reporting of fluid to the catch basin. June 14 and June 22 provide examples illustrating the relative 16
20 importance of airflow. Both cases are characterized by an extended period of reduced airflow and low relative humidity averaging less than 30 percent, leading up to fluid reporting to the catch basin. In both incidences the average airflow rate dropped to below 100,000 CFM. Careful examination of Figure 6-1 indicates that there were ten periods in which the average airflow rate decreased to below 100,000 CFM. Seven of the ten periods resulted in fluid reporting to the catch basin. Three did not. Why? The data suggests that the answer involves ventilation operation. Of the seven periods that resulted in fluid reporting to the catch basin all seven periods were preceded by a variable history of airflow dominated by extended periods of low airflow (less than 100,000 CFM). On the other hand, the three no-fluid reporting events that occurred in late September and early October 1999 are preceded by 22 days of alternate airflow (260,000 CFM). This suggests that extended periods of alternate airflow may increase the capacity of the Exhaust Shaft to absorb or otherwise divert fluid from the catch basin during periods of reduced airflow. A reasonable conceptual model must include a variety of mechanisms and behaviors. One, fluid seeps into the shaft from cracks in the shaft liner providing a relatively constant input. This fluid is absorbed into the shaft wall (depending on moisture content of the wall and host rock), taken up by the airflow, or reports to the catch basin. Two, air of varying humidity is pumped underground and then vented to the surface through the Exhaust Shaft. Depending on the velocity and the relative humidity of the air several possible scenarios can arise. If airflow is in alternate mode (260,000 CFM) or more and the relative humidity is low no fluid is likely to report to the catch basin and the moisture content of the walls would decrease or at least stabilize. An airflow rate of 260,000 CFM or greater appears to have the capacity consistently to prevent any fluid from reporting to the catch basin. If the relative humidity increases, the moisture content of the shaft wall will also likely increase. Even so, the example of the twelve-day period of high humidity in late October 1999 suggests that as long as the airflow is sustained at 260,000 CFM or higher, the ventilation system has the capacity to prevent most fluid from reporting to the catch basin. On the other hand, if the humidity is high and the airflow is reduced to below 100,000 CFM, there is a high probability that fluid will report to the catch basin. Therefore, management of the ventilation-system operation, the decision-making process of deciding when to reduce airflow and under what conditions, is an important factor to reducing the volume of fluid generated. The question may arise with regards as to why more fluid is produced on some days than others, when the apparent conditions might suggest otherwise. As noted earlier, part of the answer lies in the condition of the shaft in the period leading up to an event. Prolonged periods of high airflow and low humidity followed by several days of airflow below 100,000 CFM may generate little, if any fluid because of the initially low moisture content of the shaft walls. However, if the humidity in the shaft has been high for an extended period of time, as it was in late September and October 1998, then the airflow may only have to be reduced slightly for a few hours to generate a very large quantity. Therefore, trying to predict or gage the relative amount of fluid that will be generated as a function of airflow, and humidity is difficult because it is a complex nonlinear, multi parameter relationship. In addition, there are other factors such as moisture content of the shaft walls and the salt in the shaft and the effects of salt dust from underground mine operations that vary in time and space that can have a significant impact on the 17
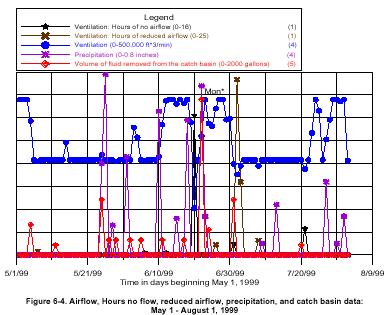
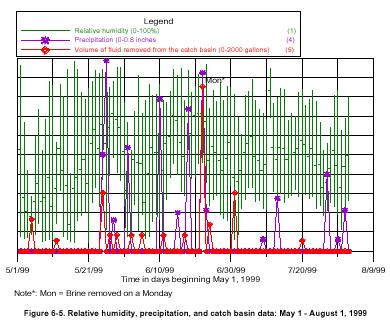
21 reporting of fluid to the catch basin. Figure 6-4 is a plot of airflow, hours of no airflow, reduced airflow, precipitation and catch basin data for the period extending from May 1 through August 1, The average airflow rate was 309,000 CFM, 49,000 CFM above the alternate airflow rate for the Exhaust Shaft. During the 93-day period there were only six days of reduced airflow. Figure 6-4 indicates that there were thirteen events totaling 4,730 gallons of fluid that was removed from the catch basin. One event, on June 22, resulted in 1,705 gallons of fluid. Two other events, one on May 25 and the other on June 31, 1999, resulted in 605 gallons each. The other ten events accumulated less than 275 gallons each. As mentioned previously, 95 percent of the fluid removed from the catch basin over the past seventeen months occurred between June 1 and October 31, 1998, and May 1 and August 1, Comparison of the two time intervals reveals some significant differences: 1. The average airflow rate between June 1 and October 31, 1998, was 216,000 compared to 309,000 CFM for May 1 through August 1, 1999, a difference of 93,000 CFM. 2. Between June 1 and October 31, 1998, there were 68 days of reduced airflow compared to only six days between May 1 and August 1, All 20 events of fluid reporting the catch basin between June 1 and October 31, 1998, were associated with reduced airflow, as opposed to only two of thirteen events between May 1 and August 1, Nine of 20 events between June 1 and October 31, 1998, attained relative humidity values greater than 80% while six of thirteen events between May 1 and August 1, 1999 attained relative humidity values greater than 80 percent. Though airflow was maintained at a higher average, with few disruptions in ventilation of the Exhaust Shaft between May 1 and August 1, 1999, there appears to be an increase in the number of incidences of fluid reporting to the catch basin under alternate mode airflow conditions (260,000 CFM). Comparison of Figures 6-3 (June 1 through October 31, 1998) and Figure 6-5 (May 1 through August 1, 1999) do not indicate significant differences in the pattern or magnitudes of relative humidity leading up to the generation of fluid between May 1 and August 1, There are some instances such as May 17 through June 1, 1999, where fluid reported to the catch basin (4 events totaling ~1500 gallons) during an extended period of relatively high humidity (averaged percent, highs over 80 percent) and alternate mode airflow (260,000 CFM). But those humidity values were significantly lower than those which occurred during the 12-day period in late October 1998 discussed in section 6.1 (averaged ~80 percent, highs over 90 percent) when no fluid reported to the catch basin except during one day in which there was reduced airflow. Careful examination of the data tends to suggest that extended periods of high humidity (>60 percent) under alternate mode airflow conditions (260,000 CFM) can result in fluid 18
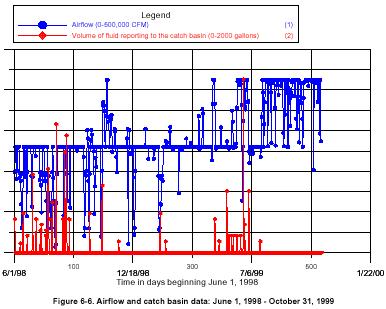
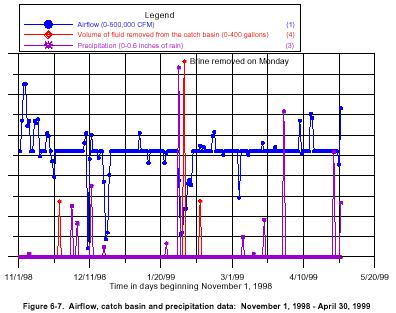
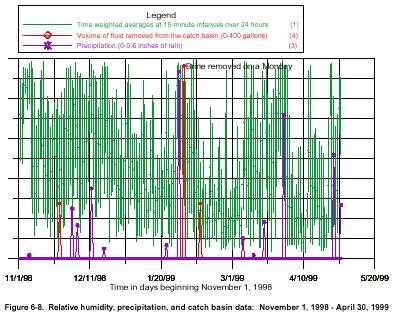
22 reporting to the catch basin. If that is true, why is it that more fluid did not report to the catch basin in late October One possible explanation is that during the middle of the 12-day high-humidity period in late October 1998 the airflow was increased to 425,000 CFM. Figure 6-6 shows that there are no incidences of fluid reporting to the catch basin at an elevated airflow rate of 425,000 CFM. Operating at 425,000 CFM may provide high enough airflow to remove the fluid seeping into the Exhaust Shaft from the cracks in the shaft liner and fluid formed by the condensing of warm moisture laden air that is cooled as air rises in the shaft. Figures 6-7 and 6-8 are comparisons of airflow, humidity, catch basin, and precipitation data for the period extending from November 1,1998, through April 30, The 182-day interval was a stable period of time when there were only three incidences of fluid reporting to the catch basin providing an excellent opportunity to verify some of the model parameters presented earlier. In early November 1998 there was an 11-day period of high humidity. Under alternate mode conditions, fluid should report to the catch basin, but in this situation there is no report of fluid. However, Figure 6-7 shows that during that eleven-day time interval there were eight days in which the airflow exceeded 330,000 CFM supporting the hypothesis that at high airflow rates result in no reporting of fluid. From Figures 6-7 and 6-8, around December 11, 1998, there is a tenday period of high humidity that is divided into periods of high airflow, reduced airflow, and high airflow. Once again, no fluid reports to the catch basin. The only significant event of fluid reporting to the catch basin on February 1, 1999 (385 gallons) after five days of high humidity coupled with several days of reduced airflow. Careful examination of relative humidity data shows that the five-day period of high humidity is preceded by several weeks of low humidity (~35 percent) during which time the moisture content of the shaft walls was decreasing. Though there are several days of high humidity and reduced airflow it took several days before fluid began reporting to the catch basin as the shaft walls resaturated. Figures 6-7 and 6-8 indicate that during alternate mode airflow conditions (260,000 CFM), there is a low probability of fluid reporting to the catch basin unless there is an extended period of high humidity. 19
23 20
24 21
25 22
26 23
27 24
28 25
29 26
30 27
31 7.0 CONCLUSION Seventeen months of Exhaust Shaft data related to airflow, relative humidity, ventilation operations, catch basin fluid volumes, and precipitation have provided important insight regarding the mechanisms effecting the quantity of fluid reporting to the Exhaust Shaft Catch Basin. From the 17 months of data, airflow is the primary factor controlling the quantity of fluid reporting. At the same time though, humidity and system operations, the moisture content and the condition of the shaft walls also have a significant impact. As can be seen from the data, the problem is not simple, but highly complex, involving a number of variables that are nonlinear. There are however, several important findings that the data has revealed. C C C First, there has been no recorded incident of fluid reporting to the catch basin when the ventilation is operating at full capacity (425,000 CFM). This suggests that there is some value of airflow between 260,000 and 425,000 CFM that has the capacity to remove the fluid seeping into the Exhaust Shaft and the fluid that is generated from condensation by the cooling of warm moist laden air traveling up the shaft; Second, airflow can be maintained at 260,000 CFM for extended periods of time without fluid reporting to the catch basin provided the relative humidity does not exceed some threshold (appears to be >60 percent) for an extended period of time (>5 days); and Third, operating at reduced airflow significantly increases the probability that fluid will report to the catch basin. The amount that reports is a function of the period of reduced airflow, the airflow rate, and the relative humidity. Even if the humidity is low, if there is an extended period of reduced airflow below 100,000 CFM, as occurred between June 1 and October 31, 1998, the probability of fluid reporting to the catch basin increases significantly. Extended periods of high or low airflow or humidity effect the moisture content of the shaft walls, which can either attenuate or delay the reporting of fluid to the catch basin. Because the moisture content varies in time and place in the shaft it would be difficult to provide a representative value without considerable instrumentation. System operations management can minimize the quantity of fluid reporting to the catch basin by effective tracking of the airflow, humidity, systems operation, extended weather forecasts and trend analysis. It is clear from the data that each of the parameters should be monitored daily and integrated into a real-time database in order to more effectively evaluate and control the conditions in the shaft. In addition, there are other parameters such as mining activities, which creates salt dust, and leaks in the WIPP site water system that may also impact Exhaust Shaft operations. These factors should also be examined more closely to determine the magnitude of their impact. 28
Modeling the Underground Ventilation System at the Waste Isolation Pilot Plant to Ensure Proper Ventilation Alignment
 Modeling the Underground Ventilation System at the Waste Isolation Pilot Plant to Ensure Proper Ventilation Alignment By: N. Wineinger 1*, K. Wallace 1, J. Farnsworth 2 1 Mine Ventilation Services, a business
TESTS OF ADSIL COATING
 TESTS OF ADSIL COATING Test B - Long Term Test FSEC-CR-1259-01 July 11, 2001 Prepared for: Bob Suggs Florida Power & Light Company 9250 W. Flagler Street Miami, Florida 33174 Principal Investigator Dr.
CRAWL SPACE MOISTURE CONTROL - A Fundamental Misunderstanding By Peter Carpenter, member ASHRAE, SBCCI
 CRAWL SPACE MOISTURE CONTROL - A Fundamental Misunderstanding By Peter Carpenter, member ASHRAE, SBCCI A crawl space needs to be ventilated with outside air. Without ventilation there will be growth of
INVESTIGATION FINDINGS III IMPACT OF INADEQUATE VENTILATION AND DISCHARGE SYSTEMS
 INVESTIGATION FINDINGS III IMPACT OF INADEQUATE VENTILATION AND DISCHARGE SYSTEMS SUMMARY Ammonia odours were reported in the community close to the time of the incident (Appendix D) and firefighters reported
THE RELIABILITY OF RADON REDUCTION TECHNIQUES. CB Howarth
 Radon in the Living Environment, 052 THE RELIABILITY OF RADON REDUCTION TECHNIQUES CB Howarth National Radiological Protection Board Chilton, Didcot, Oxon, OX11 0RQ, UK Tel: +44 1235 822796, Fax: +44 1235
Multnomah Education Service District
 Cascade Radon, Inc. 12839 NE Airport Way Bldg.9 Testing, Mitigation, Portland, Oregon 97230 Systems Design Phone: (503) 421-4813 CCB 180537 / CASCARI927C1 Fax: (503) 281-6170 Office@CascadeRadon.com Radon
2017 Annual Report. King County Fire District No. 27 Fall City, WA
 2017 Annual Report King County Fire District No. 27 Fall City, WA Foreword Beginning in 2006, the District began collecting the detailed data elements necessary to develop and publish an annual report
Queen St E & Leslie St Noise Analysis Toronto, Ontario. Toronto Transit Commission Streetcar Department 1900 Yonge Street Toronto, ON M4S 1Z2
 ASSESSMENT REPORT - Project: 151.08 Queen St E & Leslie St Noise Analysis Toronto, Ontario Prepared for: Toronto Transit Commission Streetcar Department 1900 Yonge Street Toronto, ON M4S 1Z2 Prepared by:
Unwanted Fire Alarms. Marty Ahrens National Fire Protection Association 1 Batterymarch Park Quincy, MA (617)
") Unwanted Fire Alarms Marty Ahrens National Fire Protection Association 1 Batterymarch Park Quincy, MA 02169-7471 (617) 984-7463 mahrens@nfpa.org Unwanted fire alarms, however they are defined, are a problem
Unwanted Fire Alarms Marty Ahrens National Fire Protection Association 1 Batterymarch Park Quincy, MA 02169-7471 (617) 984-7463 mahrens@nfpa.org Unwanted fire alarms, however they are defined, are a problem
Real Time Pipeline Leak Detection on Shell s North Western Ethylene Pipeline
 Real Time Pipeline Leak Detection on Shell s North Western Ethylene Pipeline Dr Jun Zhang & Dr Ling Xu* REL Instrumentation Limited ABSTRACT In the past ten years, a number of pipeline leak detection systems
The Emergence of Triboelectric Technology
 September 1998 September 1998, Pollution Engineering The Emergence of Triboelectric Technology Triboelectric monitoring, now accepted by the U.S. Environmental Protection Agency, provides continuous monitoring
EFFECT OF COMPACTION ON THE UNSATURATED SHEAR STRENGTH OF A COMPACTED TILL
 EFFECT OF COMPACTION ON THE UNSATURATED SHEAR STRENGTH OF A COMPACTED TILL Vanapalli, S.K., Pufahl, D.E., and Fredlund, D.G. (University of Saskatchewan, Saskatoon, SK., Canada, S7N 5A9) Abstract An experimental
COMPRESSED AIR SOLUTIONS REGARDING PNEUMATIC CONTROL SYSTEMS
 COMPRESSED SOLUTIONS REGARDING PNEUMATIC CONTROL SYSTEMS CONTACT: David Strain (905) 640-2333 WEB: http://www.apscontrols.ca EMAIL: analystsofpneumatic@bellnet.ca CONTENTS SECTION ONE 1.0 ASSESSING PERFORMANCE.
OHIO. Results of Area Campaigns Against Japanese Beetles in 0 HI 0 AGRICULTURAL EXPERIMENT STATION WOOSTER, OHIO J. B.
 RESEARCH CIRCULAR l 08 MAY 1962 Results of Area Campaigns Against Japanese Beetles in OHIO - - J. B. POLIVKA - - 0 HI 0 AGRICULTURAL EXPERIMENT STATION WOOSTER, OHIO SUMMARY It may be concluded from the
TRANSMISSIVITY BEHAVIOR OF SHREDDED SCRAP TIRE DRAINAGE LAYER IN LANDFILL COVER SYSTEM *
 TRANSMISSIVITY BEHAVIOR OF SHREDDED SCRAP TIRE DRAINAGE LAYER IN LANDFILL COVER SYSTEM * Krishna R. Reddy, Aravind Marella and Prasanth Ala University of Illinois at Chicago, Department of Civil and Materials
ASD Installation On A P&H 4100 Electric Rope Shovel
 ASD Installation On A P&H 4100 Electric Rope Shovel 1 Installation Driver 2 An international mining company conducted a company wide review of the fire protection systems on their Ultra- Class mobile mining
Battery Performance Alert: A TOOL FOR IMPROVED PATIENT MANAGEMENT FOR DEVICES UNDER BATTERY ADVISORY
 Battery Performance Alert: A TOOL FOR IMPROVED PATIENT MANAGEMENT FOR S UNDER BATTERY ADVISORY VERSION 1.0 AUGUST 8, 2017 Abstract: BACKGROUND: In October 2016, St. Jude Medical issued an advisory on a
The Current (2017) State of the Art for Air Leakage in Ductwork
 State of the Art for Air Leakage in Ductwork") The Current (2017) State of the Art for Air Leakage in Ductwork Over the last ten years there has been a major shift in the way ASHRAE has approached air leakage in ductwork. This is reflected in the latest
The Current (2017) State of the Art for Air Leakage in Ductwork Over the last ten years there has been a major shift in the way ASHRAE has approached air leakage in ductwork. This is reflected in the latest
Management of In-Bin Natural Air Grain Drying Systems to Minimize Energy Cost
 Know how. Know now. EC710 Management of In-Bin Natural Air Grain Drying Systems to Minimize Energy Cost Thomas W. Dorn, Extension Educator With prices for all energy sources rising dramatically in recent
Battery Performance Alert
 Battery Performance Alert A TOOL FOR IMPROVED PATIENT MANAGEMENT FOR S UNDER BATTERY ADVISORY VERSION 2.0 Abstract BACKGROUND: In October 2016, St. Jude Medical (now Abbott) issued an advisory on a family
Moisture Requirements of Grass, With Figures on Rainfall for , Inclusive
 154 Vol. 11, No. 8 Moisture Requirements of Grass, With Figures on Rainfall for 1925-1930, Inclusive The problem of supplying sufficient water to golf course turf for its best growth and development becomes
CHAPTER 4. SPECIAL CONDITION EROSION CONTROL MEASURES
 CHAPTER 4. SPECIAL CONDITION EROSION CONTROL MEASURES 4.1 INFILTRATION BASIN AND TRENCH Figure 4.1. Infiltration basin and trench (Source: Department of Civil, Construction, and Environmental Engineering,
Saying Mahalo to Solar Savings: A Billing Analysis of Solar Water Heaters in Hawaii
 Saying Mahalo to Solar Savings: A Billing Analysis of Solar Water Heaters in Hawaii Jenny Yaillen, Evergreen Economics Chris Ann Dickerson, CAD Consulting Wendy Takanish and John Cole, Hawaii Public Utilities
Guided Angler Fish Program 2017Annual Report Prepared by Kurt Iverson October 27, 2017
 Alaska Region Sustainable Fisheries Guided Angler Fish Program 2017Annual Report Prepared by Kurt Iverson October 27, 2017 In 2014, NMFS implemented the Guided Angler Fish (GAF) Program as part of the
Demand-Controlled Ventilation For Commercial Kitchens
 Demand-Controlled Ventilation For Commercial Kitchens Tetra Images/Corbis By Derek Schrock, Member ASHRAE; Jimmy Sandusky, Associate Member ASHRAE; Andrey Livchak, Ph.D., Member ASHRAE Food service facilities
Characterization of Urban Green Roofs Stormwater Runoff
 18 Characterization of Urban Green Roofs Stormwater Runoff Jieyun Chen, James Li, and Barry Adams Green roofs are considered as one of the green technologies towards the development of sustainable urban
FACTORS AFFECTING JAPANESE BEETLE GRUB CONTROL WITH OFTANOL* AND TRIUMPH* Patricia J. Vittum University of Massachusetts, Waltham, MA
 FACTORS AFFECTING JAPANESE BEETLE GRUB CONTROL WITH OFTANOL* AND TRIUMPH* Patricia J. Vittum University of Massachusetts, Waltham, MA White grubs in general, and Japanese beetle grubs in particular, cause
Guide To Troubleshooting INEFFICIENT COOLING FANS
 Guide To Troubleshooting INEFFICIENT COOLING FANS TABLE OF CONTENTS Introduction Enclosure Cooling Basics Key Attributes of Enclosure Cooling Symptoms of Poor Enclosure Cooling Typical Cooling Fan Problems
Using Smoke Obscuration to Warn of Pre-Ignition Conditions of Unattended Cooking Fires
 Using Smoke Obscuration to Warn of Pre-Ignition Conditions of Unattended Cooking Fires Erik Johnsson, Mariusz Zarzecki National Institute of Standards and Technology, Gaithersburg, MD, USA Abstract A series
Breakthrough Innovations
 Breakthrough Innovations Project Title: Bioengineering for Stabilization of Critical Slopes Project Team: Lori Belz Principle Investigator John Benson Steve Kortuem Leo Holm Introduction: One of the problems
compressed air or left to consume air even when the associated production machine has been turned off.
 SToP operating BlIND USE A FlowMETER By Ron Marshall for the Compressed Air Challenge c Participants of Compressed Air Challenge s Fundamentals of Compressed Air Systems seminars are usually surprised
HOT IN HERE: OFFICE OCCUPANT THERMAL COMFORT IN LAWRENCE HALL
 GROUP 1 HOT IN HERE: OFFICE OCCUPANT THERMAL COMFORT IN LAWRENCE HALL Daniel Abrahamson Department of Architecture University of Oregon Eugene, Oregon 97403 dva@uoregon.edu Dijon Jones Department of Architecture
New Construction Builders Challenge: Sealed Attic and High Efficiency HVAC in Central Florida: A Year in Review
 New Construction Builders Challenge: Sealed Attic and High Efficiency HVAC in Central Florida: A Year in Review FSEC-PF-454-11 May 2011 Author Carlos Colon Copyright 2011 Florida Solar Energy Center/University
ENVIRONMENTAL ENGINEERING LAND SURVEYING
 ENVIRONMENTAL ENGINEERING LAND SURVEYING Closure Plan Scrubber Solids Pond No. 3 Sherburne County Generating Plant Introduction This plan describes the closure requirements for Scrubber Solids Pond No.
EM-3.1 SAFETY ALERT HEAVY EQUIPMENT VEHICLE FIRES AND SUPPRESSION SYSTEMS
 EM-3.1 SAFETY ALERT HEAVY EQUIPMENT VEHICLE FIRES AND SUPPRESSION SYSTEMS Three fire events and a TSR violation involving fire suppression systems at Environmental Management (EM) sites have occurred since
Hybrid Refrigerated/Desiccant Compressed Air Dryers
 Hybrid Refrigerated/Desiccant Compressed Air Dryers This paper first appeared at the 2013 World Energy Engineering Congress Wayne Perry, Senior Technical Director David Phillips, Air Treatment Product
Thick-Film Heater achieves Superior Performance in Thermal Response, Uniformity and Efficiency.
 Thick-Film Heater achieves Superior Performance in Thermal Response, Uniformity and Efficiency. by Mary Ruggiero, P.Eng., PhD and John Stockton, P.Eng Abstract IntegrAL thick-film heaters by Datec Corporation
J. R. Qualey III, L. Desmarais, J. Pratt Simplex Time Recorder Co., 100 Simplex Drive, Westminster, MA 01441
 J. R. Qualey III, L. Desmarais, J. Pratt Simplex Time Recorder Co., 100 Simplex Drive, Westminster, MA 01441 Response-Time Comparisons of Ionization and Photoelectric/Heat Detectors 1. Introduction Despite
Shelbyville, KY Stormwater Best Management Practices. Section 2 EROSION PREVENTION AND SEDIMENT CONTROL PLAN
 Section 2 EROSION PREVENTION AND SEDIMENT CONTROL PLAN 2.1 Requirements The City of Shelbyville, KY will require an Erosion Prevention and Sediment Control (EPSC) Plan for most types of development construction.
The Unplanned Impacts On Houses By Powered Attic Ventilators
 The Unplanned Impacts On Houses By Powered Attic Ventilators John J. Tooley Jr., Natural Florida Retrofit Bruce Eugene Davis, Advanced Energy Corporation Applied Building Science Center 1994 ABSTRACT It
a high level of operational reliability), and the designer (in performing probabilistic-based
, and the designer (in performing probabilistic-based") By Edward K. Budnick, P.E. INTRODUCTION When automatic fire sprinkler systems, or any fire protection safety features, are included in a fire protection design package, it is assumed that, if needed, they
By Edward K. Budnick, P.E. INTRODUCTION When automatic fire sprinkler systems, or any fire protection safety features, are included in a fire protection design package, it is assumed that, if needed, they
From a Census of 680,000 Street Trees to Smart Stormwater Management: A Study of Efficacy and Economics of Street Tree Guards in New York City
 From a Census of 680,000 Street Trees to Smart Stormwater Management: A Study of Efficacy and Economics of Street Tree Guards in New York City Elliott, R. M.i., Shetty N. H.i, Culligan P. J.i Green infrastructure
Radon Measurement Survey Report. Oak Park Elementary School 1200 Front Street Aurora, Illinois Prepared For:
 Radon Measurement Survey Report Site:July 5, 2018 1200 Front Street Aurora, Illinois 60505 Survey Dates: May 9, 2018 thru May 11, 2018 Prepared For: East Aurora School District 131 417 Fifth Street Aurora,
POWER Selecting Shell Side Design Temperature for Feedwater Heaters
 Proceedings of the ASME 2014 Power Conference POWER2014 July 28-31, 2014, Baltimore, Maryland, USA Selecting Shell Side Design Temperature for Feedwater Heaters POWER2014-32275 Kellen J. Muldoon American
RESULTS FROM HOUSE APPLIANCE SAFETY AND DEPRESSURIZATION TESTS CONDUCTED ON SINGLE FAMILY HOUSES UNDERGOING SOUND INSULATION
 RESULTS FROM HOUSE APPLIANCE SAFETY AND DEPRESSURIZATION TESTS CONDUCTED ON SINGLE FAMILY HOUSES UNDERGOING SOUND INSULATION DL Bohac * Center for Energy and Environment, Minneapolis, MN USA ABSTRACT Extensive
Solutions Library Solution 5: Rain Harvesting Cisterns
 Solutions Library Solution 5: Rain Harvesting Cisterns "By harvesting nature, we can create a natural beauty all of our own." -Kylin Fulton Tahoma School District Student Rain Harvesting Cisterns 70 Cistern:
Solutions Library Solution 5: Rain Harvesting Cisterns
 SOILS TREES RAINGARDENS PERMEABLE PAVEMENT Solutions Library Solution 5: "By harvesting nature, we can create a natural beauty all of our own." -Kylin Fulton Tahoma School District Student 69 70 How a
Energy Efficiency. Intercept HDDperDay <2e 16 kwhperday
 Energy Efficiency Energy Use of the Eco House Ben Francis Introduction: Three years ago one of the small houses owned by the college was altered with the goal of being more energy efficient. Among the
The Revised Method of Test for Residential Water Heating and Its Impact on Incentive Programs
 The Revised Method of Test for Residential Water Heating and Its Impact on Incentive Programs Paul Glanville ACEEE Hot Water Forum Tuesday, February 24 th, 2015 Nashville, TN Overview >How Water Heaters
Technical Report #3 Mechanical Systems Existing Conditions Evaluation
 Mechanical Option Technical Report #3 Technical Report #3 Mechanical Systems Existing Conditions Evaluation Instructor: Dr. Bahnfleth 11.15.04 Building Sponsor: CCG Facilities Integration Table of Contents
NEORSD Green Infrastructure Grant (GIG) Program Opening Remarks
 Program Opening Remarks") NEORSD Green Infrastructure Grant (GIG) Program Opening Remarks 2019 NEORSD GIG Eligibility and Technical Requirements Project must be located in the Sewer District s combined sewer area Location Applicant
NEORSD Green Infrastructure Grant (GIG) Program Opening Remarks 2019 NEORSD GIG Eligibility and Technical Requirements Project must be located in the Sewer District s combined sewer area Location Applicant
Data-Driven Energy Efficiency in Buildings
 Data-Driven Energy Efficiency in Buildings Amir Kavousian, PhD Candidate Stanford University February 20, 2013 Photo: David Clanton What is my research about? to demonstrate the power of data mining. [
BNWAT28: Water consumption in new and existing homes
 BNWAT28: Water in new and existing homes Version 1.0 This Briefing Note and referenced information is a public consultation document and will be used to inform Government decisions. The information and
State-of-the-art Developments to Save Energy in Coating Drying
 State-of-the-art Developments to Save Energy in Coating Drying Executive Summary Coating drying is expensive. A great deal of energy is needed to effectively evaporate sufficient water to dry the coating.
Berkshire Regional Planning Commission Clearinghouse Review Report
 August 19, 2013 SUBJECT: Reconstruction of Housatonic Street, Dalton, MA EOEA#: 15083 LOCATION: Dalton ESTIMATED COST: $8.1 million REVIEW TYPE: ENF PROPONENT: MassDOT and Town of Dalton COMMENTS DUE:
Relationship of Soil Moisture and Drainage Conditions to Tree Decline in Avocado Orchards *
 California Avocado Society 1943 Yearbook 28: 34-37 Relationship of Soil Moisture and Drainage Conditions to Tree Decline in Avocado Orchards * E. R. PARKER and M. B. ROUNDS Citrus Experiment Station, University
Reviewing HVAC Designs for Compliance with ACCA Manual S
 Reviewing HVAC Designs for Compliance with ACCA Manual S by Wes Davis An approved code change to the 2009 International Residential Code (IRC) clarifies an existing requirement for sizing HVAC equipment:
OPTIMIZATION OF VENTILATION MODE OF SMOKE CONTROL SYSTEM IN HIGH-RISE BUILDING FIRE
 OPTIMIZATION OF VENTILATION MODE OF SMOKE CONTROL SYSTEM IN HIGH-RISE BUILDING FIRE 1 RU ZHOU, 2 WEI ZHANG 1 School of Urban Construction and Safety Engineering, Nanjing University of Technology, Nanjing
Understanding Surface Water Runoff at Breneman Farms
 Understanding Nutrient & Sediment Loss at Breneman Farms 4 Understanding Surface Water Runoff at Breneman Farms Kevan Klingberg, Dennis Frame and Fred Madison UW Extension/Discovery Farms AnitaThompson
DEEP GEOLOGIC REPOSITORY PROJECT JOINT REVIEW PANEL RESPONSE TO INFORMATION REQUEST EIS
 DEEP GEOLOGIC REPOSITORY PROJECT JOINT REVIEW PANEL File: 2.05 e-doc: 4427225 RESPONSE TO INFORMATION REQUEST EIS-13-515 INFORMATION REQUEST EIS-13-515: Provide a brief description of the recent incidents
SURVEY ON THE OCCUPANT BEHAVIOR RELATING TO WINDOW AND AIR CONDITIONER OPERATION IN THE RESIDENTIAL BUILDINGS
 Proceedings of BS13: SURVEY ON THE OCCUPANT BEHAVIOR RELATING TO WINDOW AND AIR CONDITIONER OPERATION IN THE RESIDENTIAL BUILDINGS Hiromi Habara 1, Rakuto Yasue 1 and Yoshiyuki Shimoda 1 1 Graduate School
ON THE BUTTON A reference guide to environmental ratings used for push button enclosures
 ON THE BUTTON A reference guide to environmental ratings used for push button enclosures A REFERENCE GUIDE TO KEY TOPICS IN PUSH BUTTON SELECTION AND SAFETY CONTENTS I. INTRODUCTION...............................
Soil characteristics that influence nitrogen and water management
 Section C Soil characteristics that influence nitrogen and water management Soil characteristics vary across the landscape Soils vary from one field to another, and often within the same field. Soil differences
ANALYSIS OF SMOKE MOVEMENT IN A BUILDING VIA ELEVATOR SHAFTS
 ANALYSIS OF SMOKE MOVEMENT IN A BUILDING VIA ELEVATOR SHAFTS Prepared for Smoke Safety Council 6775 SW 111 th Avenue, Suite 10 Beaverton, OR 97008 Prepared by Jesse J. Beitel Alison J. Wakelin Craig L.
INDUSTRIAL DEHUMIDIFICATION DRYING OF SOFTWOODS
 INDUSTRIAL DEHUMIDIFICATION DRYING OF SOFTWOODS James B. Wilson Forest Research Laboratory Oregon State University Corvallis, Oregon The drying of wood is the most energy intensive operation in forest
INDOOR RADON POLICY AND PROCEDURES LAWLER WOOD HOUSING, LLC
 INDOOR RADON POLICY AND PROCEDURES LAWLER WOOD HOUSING, LLC Prepared for Lawler-Wood Housing, LLC Riverview Tower, Suite 2000 900 South Gay Street Knoxville, Tennessee Prepared by ORION Orion Environmental
ICONE DRAFT Proceedings of the 16th International Conference on Nuclear Engineering ICONE16 May 11-15, 2008, Orlando, Florida, USA
 DRAFT Proceedings of the 16th International Conference on Nuclear Engineering ICONE16 May 11-15, 2008, Orlando, Florida, USA ICONE16-48187 THERMAL CYCLE EVALUATION FOR FEEDWATER HEATER OUT OF SERVICE CONDITION
for family composition, time allocation of people, ownership and specification of home appliances. This paper first presents the simulation procedure
 Validation of an Energy Demand Model of Residential Buildings Yohei Yamaguchi 1*, Yoshiyuki Shimoda 1 1 Graduate School of Engineering Osaka University, S4 Building, 2-1 Yamadaoka, Suita, Osaka, 565-871,
Objectives. NFPA Dust Specific Documents. Combustible Dust Process Hazard Safety Overview of NFPA Standards for Combustible Dusts
 Combustible Dust Process Hazard Safety Overview of NFPA Standards for Combustible Dusts Guy R. Colonna, PE Division Manager, NFPA Combustible Dust Symposium Detroit, MI September 20, 2011 1 Objectives
PDH & Professional Training
 510 N. Crosslane Rd. Monroe, Georgia 30656 (770) 266-6915 fax (678) 643-1758 PDH & Professional Training PDH Storm, by Engineers Edge, LLC CONTENTS 1. INTRODUCTION 1.1 GENERAL CRITERIA 1.2 DESIGN PROCEDURE
Final Report on Electric Clothes Dryers and Lint Ignition Characteristics May 2003
 Final Report on Electric Clothes Dryers and Lint Ignition Characteristics Abstract In FY 22, U.S. Consumer Product Safety Commission staff completed a test program to evaluate residential electric clothes
Evaluating Low Impact Development Practices for Stormwater Management on an Industrial Site in Mississippi
 Evaluating Low Impact Development Practices for Stormwater Management on an Industrial Site in Mississippi Dennis S. Painter, Tennessee Valley Authority, Nashville, Tennessee Donald Becker, Tennessee Valley
The following table summarizes information from various sources on corn development.
 October 7, 2009 2009 Post-Harvest Tips for Later Maturing Corn Ken Hellevang, Ph.D., PE, Extension Engineer, Professor NDSU Extension Service, Ag & Biosystems Engineering Department Corn Maturity Progression
Measuring And Understanding Energy Efficiency
 28Mar2011 www.fahrenergy.co.uk P: 1 Measuring And Understanding Energy Efficiency Knowledge makes the difference. It is the base for improvements. INSTRUMENTS NEEDED... 1 INTRODUCTION... 2 ENERGY RECOVERY
AVOID CATASTROPHIC SITUATIONS: EXPERT FIRE AND GAS CONSULTANCY OPTIMIZES SAFETY
 AVOID CATASTROPHIC SITUATIONS: EXPERT FIRE AND GAS CONSULTANCY OPTIMIZES SAFETY World-class services help reduce incidents, protect the environment, and keep people and plants safe White Paper PAGE 1 Introduction
NEW CD WARP CONTROL SYSTEM FOR THE CORRUGATING INDUSTRY
 NEW CD WARP CONTROL SYSTEM FOR THE CORRUGATING INDUSTRY USING A NEW CONCEPT IN MOISTURE SENSING AND CONTROL BY DRYING TECHNOLOGY, INC A New CD Warp Control System For the Corrugating Industry Introduction:
Grain and Soybean Drying on Georgia Farms
 Grain and Soybean Drying on Georgia Farms Table of Contents Principles of Grain Drying... 3 Drying Methods... 3 Moisture Levels for Safe Storage... 4 Equilibrium Moisture Content... 5 Bin Batch Drying...
Glencoe Elementary School Parking Lot Retrofit 825 SE 51 st Street
 Glencoe Elementary School Parking Lot Retrofit 825 SE 51 st Street Project Summary Project Type: Technologies: Institutional parking lot retrofit demonstration project Vegetated infiltration swale with
FERTILIZER, IRRIGATION STUDIES ON AVOCADOS AND LIMES ON THE ROCKDALE SOILS OF THE HOMESTEAD AREA
 Proc. Fla. State Hort. Soc. 66:228-230. 1953. FERTILIZER, IRRIGATION STUDIES ON AVOCADOS AND LIMES ON THE ROCKDALE SOILS OF THE HOMESTEAD AREA M. H. Gallatin Soil Scientist, U.S.D.A., B.P.I.S.A.E., Soils
Analysis of freeze protection methods for recuperators used in energy recovery from exhaust air
 Analysis of freeze protection methods for recuperators used in energy recovery from exhaust air Anna Pacak 1,*, Andrzej Jedlikowski 1, Demis Pandelidis 1, and Sergey Anisimov 1 1 Wrocław University of
Dedicated Closed Circuit Hydrostatic Fan Drive Control
 IFPE Paper 21.2 Dedicated Closed Circuit Hydrostatic Fan Drive Control Josh Cronbaugh Mark Peterson Danfoss Power Solutions ABSTRACT The typical closed circuit hydrostatic pump is designed primarily for
VENTILATIVE COOLING CONTROL STRATEGIES APPLIED TO PASSIVE HOUSE IN ORDER TO AVOID INDOOR OVERHEATING
 VENTILATIVE COOLING CONTROL STRATEGIES APPLIED TO PASSIVE HOUSE IN ORDER TO AVOID INDOOR OVERHEATING Rebeca Barbosa 1, Martin Barták 1, Jan L. M. Hensen 1, 2, Marcel G. L. C. Loomans 2 1 Czech Technical
PRESSURE-ENTHALPY CHARTS AND THEIR USE By: Dr. Ralph C. Downing E.I. du Pont de Nemours & Co., Inc. Freon Products Division
 INTRODUCTION PRESSURE-ENTHALPY CHARTS AND THEIR USE The refrigerant in a refrigeration system, regardless of type, is present in two different states. It is present as liquid and as vapor (or gas). During
Energy and Peak Power Reduction from Air Misting Products Applied to Commercial Condensing Units in Hot and Humid Climates.
 FINAL REPORT Energy and Peak Power Reduction from Air Misting Products Applied to Commercial Condensing Units in Hot and Humid Climates Final Report FPL CO#2000083695 UCF/FSEC #2012-8262 FSEC-CR-1971-14
PASSIVE HEAT EXCHANGER ANTI-FOULING FOR SOLAR DHW SYSTEMS
 Proceedings of ISEC 2005 2005 International Solar Energy Conference August 6-12, 2005, Orlando, Florida, USA ISEC2005-76232 PASSIVE HEAT EXCHANGER ANTI-FOULING FOR SOLAR DHW SYSTEMS Stephen J. Harrison
Phase One Archaeological Investigation Results, James Madison Park Master Development Plan Project, City of Madison, Dane County, Wisconsin
 Phase One Archaeological Investigation Results, James Madison Park Master Development Plan Project, City of Madison, Dane County, Wisconsin Prepared for the City of Madison Parks Department 28 January
FOR THE PERIOD JANUARY 1, TO DECEMBER 31, GENERAL INFORMATION
 3850-PM-BCW0083h Rev. 11/2016 COMMONWEALTH OF PENNSYLVANIA DEPARTMENT OF ENVIRONMENTAL PROTECTION BUREAU OF CLEAN WATER PAG-03 NATIONAL POLLUTANT DISCHARGE ELIMINATION SYSTEM (NPDES) GENERAL PERMIT FOR
VEGETATIVE PROPAGATION OF MATURE SYCAMORE. Samuel B. Land, Jr, 1
 VEGETATIVE PROPAGATION OF MATURE SYCAMORE Samuel B. Land, Jr, 1 Abstract.--Techniques were tested for grafting, budding, and rooting cuttings from mature sycamore trees. Success was greater for winter
All Types - Automatic, semi-automatic and manual. All Types - Horizontal (front loaders) and Vertical Plane (top loader)
 and Vertical Plane (top loader)") Other variables Technology Mapping Document Country: USA Technology: Sub Category: Domestic top and front loaders Introduction The first stage in the Mapping and Benchmarking process is the definition
Other variables Technology Mapping Document Country: USA Technology: Sub Category: Domestic top and front loaders Introduction The first stage in the Mapping and Benchmarking process is the definition
Three Rivers Park District Administration Center Rain Garden
 Three Rivers Park District Administration Center Rain Garden Introduction There are significant changes to the hydrologic regime and nutrient loading following urban and industrial development. The post-development
THE ROLE OF SUCTION IN THE PERFORMANCE OF CLAY FILL RONALD F. REED, P.E. 1 KUNDAN K. PANDEY, P.E. 2
 THE ROLE OF SUCTION IN THE PERFORMANCE OF CLAY FILL RONALD F. REED, P.E. 1 KUNDAN K. PANDEY, P.E. 2 Abstract Plastic clay is commonly used as fill. Proper placement is the key to the performance of the
Energy Conservation with PARAG Energy Efficient Axial Flow FRP Fans
 PARAG FANS & COOLING SYSTEMS LTD. Energy Conservation with PARAG Energy Efficient Axial Flow FRP Fans Registered Office & Works Plot No.1/2B & 1B/3A, Industrial Area No.1 A.B.Road, Dewas 455001 (M.P.)
CONTAINMENT AND DEWATERING OF MINE TAILINGS WITH GEOTEXTILE TUBES AT A SILVER MINE IN SAN LUIZ POTOSI, MEXICO
 CONTAINMENT AND DEWATERING OF MINE TAILINGS WITH GEOTEXTILE TUBES AT A SILVER MINE IN SAN LUIZ POTOSI, MEXICO Tom Stephens, TenCate Geosynthetics, Pendergrass, Georgia USA Angel Diaz Sobrino, Geomembranas
Challenges and Methods of Estimating a Conceptual HVAC Design
 Challenges and Methods of Estimating a Conceptual HVAC Design ABSTRACT In any conceptual HVAC design, estimators are faced with the challenge of trying to capture all of the pieces that complete a system.
Estimating the Level of Free Riders in the Refrigerator Buy-Back Program
 Estimating the Level of Free Riders in the Refrigerator Buy-Back Program Diane M. Fielding, B.C. Hydro An impact evaluation, conducted in 1993 on B.C. Hydro s Refrigerator Buy-Back Program, employed an
U.S. DEPARTMENT OF ENERGY (DOE) WALK-IN COOLER & FREEZER ENERGY EFFICIENCY RULEMAKING SUMMARY & FREQUENTLY ASKED QUESTIONS. Rulemaking History
 WALK-IN COOLER & FREEZER ENERGY EFFICIENCY RULEMAKING SUMMARY & FREQUENTLY ASKED QUESTIONS. Rulemaking History") U.S. DEPARTMENT OF ENERGY (DOE) WALK-IN COOLER & FREEZER ENERGY EFFICIENCY RULEMAKING SUMMARY & FREQUENTLY ASKED QUESTIONS Rulemaking History On June 3, 2014 The U.S. Department of Energy (DOE) published
U.S. DEPARTMENT OF ENERGY (DOE) WALK-IN COOLER & FREEZER ENERGY EFFICIENCY RULEMAKING SUMMARY & FREQUENTLY ASKED QUESTIONS Rulemaking History On June 3, 2014 The U.S. Department of Energy (DOE) published
Radon Measurement Survey Report. McKnight School Service Center 417 Fifth Street Aurora, Illinois Prepared For:
 Radon Measurement Survey Report Site: 417 Fifth Street Aurora, Illinois 60505 Survey Dates: May 9, 2018 thru May 11, 2018 Prepared For: East Aurora School District 131 417 Fifth Street Aurora, Illinois
Retrocommissioning Findings Summary: Building X #1 Priority: Major Comfort/Control Problems
 IMPORTANT NOTICE: This sample document is provided for instructional purposes only. CCC is not rendering advice concerning any commission project or practices. This document is neither approved nor intended
MEMORANDUM. NFPA Technical Committee on Fire Code (FCC-AAA) Subject: NFPA 1 Proposed Tentative Interim Amendment (TIA) No.1045
 Subject: NFPA 1 Proposed Tentative Interim Amendment (TIA) No.1045") National Fire Protection Association 1 Batterymarch Park, Quincy, MA 02169-7471 Phone: 617-770-3000 Fax: 617-770-0700 www.nfpa.org MEMORANDUM To: From: NFPA Technical Committee on Fire Code (FCC-AAA) Gregory
National Fire Protection Association 1 Batterymarch Park, Quincy, MA 02169-7471 Phone: 617-770-3000 Fax: 617-770-0700 www.nfpa.org MEMORANDUM To: From: NFPA Technical Committee on Fire Code (FCC-AAA) Gregory
PLANT TRANSPIRATION IN THE CLOUD FOREST Transpiration Introduction
 PLANT TRANSPIRATION IN THE CLOUD FOREST Transpiration Introduction Transpiration is the loss of water from the leaves of plants. Stomates are tiny pores on the surface of leaves that allow for the passage