THE APPLICATION OF AN INTEGRATED MONITORING PLAN ON STORMWATER CONTROL MEASURES. A Thesis. Presented to. Villanova University. In Partial Fulfillment
|
|
|
- Colin Davis
- 5 years ago
- Views:
Transcription
1 THE APPLICATION OF AN INTEGRATED MONITORING PLAN ON STORMWATER CONTROL MEASURES A Thesis Presented to The Faculty of the Department of Civil and Environmental Engineering Villanova University In Partial Fulfillment Of the Requirements for the Degree of Master of Civil Engineering by Kathryn L. Greising August 2011 Copyright 2011 by Kathryn L. Greising
2 ii THE APPLICATION OF AN INTEGRATED MONITORING PLAN ON STORMWATER CONTROL MEASURES by Kathryn L. Greising August 2011 Andrea Welker, Ph.D., P.E. Date Associate Professor Robert Traver, Ph.D., P.E., D. WRE Date Professor Ronald A. Chadderton, Ph.D., P.E. Date Chairman, Department of Civil and Environmental Engineering Gary A. Gabriel, Ph.D. Date Dean, College of Engineering ii
3 iii ACKNOWLEDGEMENTS I have been very fortunate in having the faculty of the Civil and Environmental Engineering Department at Villanova University to help me through this journey. In particular, Dr. Andrea Welker has been a guiding hand through this entire experience as well as a role model and friend. She has helped me through a number of speed bumps along the way in addition to being a person to hear me talk through all of my ideas. Additionally, I could not have gone through this experience without the rest of the faculty, especially Dr. Robert Traver, Dr. Bridget Wadzuk and Dr. John Komlos. They have all taught me so much in all of my classes and in the field, and continue to inspire me. I would also not have been able to get through this work without the support of my family and friends. Mom, you continue to be a guiding force in everything I do in my life and I appreciate the patience you have had with me this year. My family and friends have been my saving grace. Also, I have grown to know a number of other people who have helped me throughout this endeavor. I would like to personally thank the other graduate students for their continued support in helping me with my research and also becoming great friends. George Pappas has also been a huge help in making my research possible in addition to Linda DeAngelis who has helped guide me through the department and who has turned into a true friend as well. Lastly, I would like to thank the William Penn Foundation for making all of this research possible. iii
4 iv ABSTRACT THE APPLICATION OF AN INTEGRATED MONITORING PLAN ON STORMWATER CONTROL MEASURES by Kathryn L. Greising Villanova University, 2011 SUPERVISOR: Dr. Andrea Welker Stormwater Control Measures (SCMs) or Best Management Practices (BMPs), have been implemented around the world to control the detrimental impacts from stormwater runoff in areas with large amounts of impervious surfaces. Although there has been a significant increase in the use of these structures, little is being done to monitor SCMs after they have been constructed to insure that the structures were meeting their regulatory purpose. A goal of the study was to develop a simple monitoring plan to monitor SCMs over long periods of time at a minimal cost. The methodology was developed to determine whether an SCM is meeting the goals of the initial design. This low level monitoring plan was applied to nine SCMs in the Philadelphia area, including green roofs, wetlands, rain gardens, seepage pits and pervious pavements. These systems vary in age, location, and the type of monitoring already available for these systems. The sites were closely monitored during storm events to see how well the sites are performing with a steady inflow of water. Additional inspections were also performed iv
5 v to accumulate information on the status of the vegetation as well as the properties of the underlying soils. The monitoring plan along with additional inspections and tests were used to categorize the performance of these SCMs and identify any renovations that were needed. This cost effective monitoring plan should be implemented to create a greater understanding of the performance of these SCMs on both a large and small scale. v
6 1-2 TABLE OF CONTENTS TABLE OF CONTENTS LIST OF TABLES LIST OF FIGURES CHAPTER 1 INTRODUCTION CHAPTER 2 LITERATURE REVIEW Types of Stormwater Control Measures and Corresponding Goals Infiltration and Hydraulic Conductivity as a Performance Indicator CHAPTER 3 SITE DESCRIPTIONS CHAPTER 4 METHODOLOGY Monitoring Plan Grain Size Analysis Infiltration Tests CHAPTER 5 RESULTS CHAPTER 6 CONCLUSIONS CHAPTER 7 RECOMMENDATIONS CHAPTER 8 REFERENCES APPENDICES A-1. Plant Inventories A-2. Grain Size Analyses A-2. Infiltration Tests
7 LIST OF TABLES Table 2.1: Types of SCMs and Corresponding Goals Table 4.1: Checklist for evapotranspiration SCMs Table 4.2: Checklist for infiltration SCMs Table 4.3: Checklist for bio-infiltration and wetland SCMs Table 5.1: Drainage notes taken on site at Metroplex Shopping Center Table 5.2: Plant list and indication of on-site presence for Metroplex Shopping Center Table 5.3: Drainage notes taken on site at Morris Arboretum Table 5.4: Drainage notes taken on site at Natural Lands Trust Table 5.5: Plant Inventory for PA DEP Green Roof Table 5.6: Drainage notes taken on site at Sprinside School Table 5.7: Plant inventory and percent cover for Springside School Plants Table 5.8: Drainage notes taken on site at Wayne Art Center - Rain Garden # Table 5.9: Percent vegetative cover and plant inventory of Rain Garden #1 at WAC Table 5.10: Drainage notes taken on site at Wayne Art Center - Rain Garden # Table 5.11: Percent vegetative cover and plant inventory of Rain Garden #2 at WAC Table 5.12: Drainage notes taken on site at Wayne Art Center - Rain Garden # Table 5.13: Percent vegetative cover and plant inventory of Rain Garden #3 at WAC Table 5.14: Drainage notes taken on site at Wayne Art Center - Seepage Pit Table 6.1 : Comprehensive Evaluation for Each Stormwater Control Measure
8 LIST OF FIGURES Figure 2.1: Water Traveling Through Pervious Concrete (Ziger and Snead 2007) Figure 2.2: A Typical Rain Garden Used for Stormwater Management (PA DEP 2006) Figure 2.3: Example of a typical green roof (PA DEP 2006) Figure 3.1: Design of Metroplex Shopping Center SCMs Figure 3.2: Construction of Metroplex Shopping Center SCMs Figure 3.3: Growth of Vegetation after Construction at Metroplex Shopping Center Figure 3.4: Pervious Pavement at Morris Arboretum Figure 3.5: Pond Before Reconstruction at Hildacy Preserve Figure 3.6: Construction from Pond to Wetland at Hildacy Preserve Figure 3.7: After Completion of Construction and after One Year as a Wetland System Figure 3.8: Green Roof at Pennsylvania's DEP Figure 3.9: Construction of Rain Garden at Springside School Figure 3.10: Rain Gardens in front of Wayne Art Center Figure 3.11: Seepage Bed Behind Wayne Art Center Figure 3.12: Schematic Landscape Plan for Wayne Art Center Figure 4.1: Materials used for Infiltration Tests Figure 4.2: Single ring infiltrometer before test began Figure 5.1: First inlet structure for Metroplex Shopping Center SCM Figure 5.2: Second inlet structure for Metroplex Shopping Center SCM Figure 5.3: Third inlet structure for Metroplex Shopping Center SCM Figure 5.4: Fourth inlet structure for Metroplex Shopping Center SCM Figure 5.5: Flow paths through Metroplex Shopping Center SCM Figure 5.6: Grain Size Distribution of soils on Metroplex Shopping Center Site Figure 5.7: Sediment build-up and clogged areas at Morris Arboretum greatly affecting performance Figure 5.9: Grass walkway between two wetland areas at Natural Lands Trust Figure 5.10: Upstream section of the wetland area located at Natural Land Trust Figure 5.11: Picture of second wetland area at Natural Lands Trust Figure 5.12: Outlet structure of wetlands at Natural Lands Trust Figure 5.13: Grain Size Distribution of soils at Natural Lands Trust Figure 5.14: Inflow pipes transporting water from the roof drains into the rain garden Figure 5.15: Flow path of first inflow pipe needing improvement Figure 5.16: Results for Springside School's Rain Garden Grain Size Distribution Test Figure 5.17: Springside School Infitlration Test Data Figure 5.18: Springside School Infiltration Rate after 10 minutes
9 Figure 5.19: Ariel view of Wayne Art Center and on site SCMs Figure 5.20: Grain size distribution for underlying soil at the Wayne Art Center Figure 5.21: Wayne Art Center Rain Garden #1 and inflow area Figure 5.22: Rain Garden #2 located at Wayne Art Center Figure 5.23: Wayne Art Center Rain Garden #2 Infiltration Test Results Figure 5.24: Wayne Art Center Rain Garden #2 Infiltration Rate Approximation Figure 5.25: Inflow pipes directing stormwater into Rain Garden #3 at Wayne Art Center Figure 5.26: Wayne Art Center Rain Garden #3 Infiltration Test Results Figure 5.27: Wayne Art Center Rain Garden #3 Infiltration Rate Approximation Figure 5.28: Picture of the seepage pit at Wayne Art Center Figure 5.29: Inflow pipes routed from rooftop drain to seepage pit
10 1-6 CHAPTER 1 INTRODUCTION Increased stormwater runoff has caused a number of problems in areas of growing urbanization as a result of additional impervious surfaces. Many adverse effects have been found to result from these impervious surfaces on downstream areas (US EPA 2005). These effects can include an increase in the amount of surface runoff for a watershed, an increase in the peak flow, a decrease in the quality of water, and increased degradation of streams and rivers (US EPA 2005). New technologies are being used to remediate some of these harmful effects. These remediation techniques are known as Stormwater Control Measures (SCMs) or Best Management Practices (BMPs) (PA DEP 2006). The goals of these SCMs vary with type, but the types of SCMs targeted in this study seek to restore the hydrologic cycle by reducing the volume of runoff and the pollutants associated with stormwater runoff. Stormwater Control Measures have been increasingly implemented throughout the United States as an attempt to alleviate negative stormwater effects (PA DEP 2006). SCMs can be structural and nonstructural systems. Nonstructural SCMs are systems created to preserve or modify natural systems already aiding in the treatment of stormwater. Structural SCMs are man-made systems designed to either replicate these natural systems using native vegetation and soils, or use other techniques such as pervious pavements, not found in nature, to remediate negative stormwater impacts. Although there has been a significant increase in the use of these structures, in most
11 1-7 regions - little is being done to monitor SCMs after they have been constructed. The need to understand the effects and performance of these measures is essential in understanding if these measures are worth promoting, and to meet their regulatory obligation. A few other monitoring plans have been established, but the majority of them are specific to certain types of SCMs and some can be quite extensive and expensive. Therefore, a cost effective, easy-to-use monitoring plan for evaluating the performance of these SCMs should be created and used regularly. It should also provide a cost effective approach to help in the identification of existing problems in the systems that may require repairs or reconstruction. This paper describes an efficient monitoring plan and implements it on a number of SCMs in the Philadelphia area.
12 CHAPTER 2 LITERATURE REVIEW A monitoring plan for Stormwater Control Measures (SCMs) needed to be created that would be able to insure performance and indicate problem areas in need of additional maintenance. This monitoring plan should be easy to use and should not require excessive time or money. Previous monitoring methods have been established and were evaluated before the monitoring plan applied to this study was created. 2.1 Types of Stormwater Control Measures and Corresponding Goals To create a useful monitoring plan, different types of SCMs and their corresponding goals needed to be identified. The types of SCMs are divided into categories according to main goals or types including infiltration, bio-infiltration, evapotranspiration and ponds and constructed wetlands. Types of SCMs within these categories include seepage pits, pervious pavements, rain gardens, green roofs and constructed stormwater wetlands. Each type will be described and common goals will be outlined. The table below outlines the different types of SCMs and their corresponding goals which will be elaborated upon in the following section. 2-1
13 2-2 Table 2.1: Types of SCMs and Corresponding Goals (Hankins et al. 2008) Type of SCM Stormwater Control Goals Control Volume of Runoff Control Peak Flow Rates Control Pollutants Promote Evapotranspiration Establish Wetland Structure and Function Infiltration Trench/Bed and Pervious Pavement Rain Garden/Bio- Infiltration Yes Yes Yes No No Yes Yes Yes Yes No Green Roof Yes Yes Yes Yes No Constructed Wetland Wet Pond/Retention Basin Yes Yes Yes Yes Yes Yes Yes Yes Yes Yes Infiltration Stormwater Control Measures such as seepage pits and pervious pavements rely on storage capacity and infiltration as the method of remediating stormwater. Usually these systems accumulate stormwater runoff from a large drainage area and store the water in some type of gravel pit where the water can be held for infiltration Seepage Pits Seepage pits, also known as dry wells, are an excavation that is refilled with gravel or rocks. Other designs can include prefabricated dry wells which are
14 2-3 predominately plastic storage containers which can be placed in a trench or other subsurface (PA DEP 2006). The pit can be divided into different-sized diameter gravel particles varying with depth to filter out contaminants if needed; however, typically the pit is filled with large diameter stone. Usually a larger drainage area, such as a rooftop, drains into the seepage pit in addition to the stormwater which directly falls onto the pit. The main goal of the large diameter stones is to create storage space for the. This stored water eventually infiltrates into the groundwater. Therefore, the main goals to be analyzed through inspection should include an evaluation of the flow path into these systems, the storage capacity of the pit and infiltration rate of the system Pervious Pavements Another type of infiltration SCM is pervious pavement. These pavements restore the hydrologic cycle by promoting groundwater recharge through infiltration. The design specifications for these pavements are altered to increase the infiltration rate by removing smaller particles from traditional concrete or asphalt mixtures (US EPA 1999). These pavements are usually placed above aggregate storage beds which can accumulate and store the water for infiltration (US EPA 1999). Figure 2.1 shows the permeability, or transportation of water, through these pavements.
 Other goals for pervious pavements include treating stormwater runoff, improving water quality through pollution removal, and")
15 2-4 Figure 2.1: Water Traveling Through Pervious Concrete (Ziger and Snead 2007) Other goals for pervious pavements include treating stormwater runoff, improving water quality through pollution removal, and improving groundwater recharge (US EPA 1999). Although pervious pavements have a number of important goals which seek to improve the negative effects of stormwater runoff, only certain goals can be evaluated using minimal cost and effort. For example, analyzing the impacts of pervious pavements on the quality of the water as it travels through the system would require excessive time and money to create a collection plan for the water samples, and additional human effort and monetary funds needed to test the samples. Therefore, the main goal to be analyzed for this evaluation will be the infiltration rate of the system Bio-Infiltration Bio-infiltration SCMs are similar to the previous infiltration SCMs mentioned, but also incorporate vegetation into their treatment of stormwater. The vegetation is used to treat stormwater through evapotranspiration, which is a part of the hydrologic

16 2-5 cycle which uses the evaporation and transpiration through plants to return water to the atmosphere. Bio-infiltration SCMs, use evapotranspiration and infiltration to treat collected stormwater. A common type of bio-infiltration SCM used is rain gardens. Figure 2.2 shows a picture of a typical rain garden. Figure 2.2: A Typical Rain Garden Used for Stormwater Management (PA DEP 2006) Rain gardens are becoming a popular technology for stormwater remediation on commercial properties as well as for individual property owners. Rain gardens are landscaping features adapted to provide on-site treatment of stormwater runoff (US EPA 2006). The main goal is to collect stormwater from a larger drainage area and store the water until it can be infiltrated into the subsurface or returned back to the atmosphere through evapotranspiration. Soil characteristics such as particle size distribution, hydraulic conductivity and surface conditions determine the infiltration rate (Jenkins et al.2010) and the performance of these systems. The quality of the
17 2-6 water can also be treated through the collection of the water and ponding. While the water is being collected in the system, the water rises creating a ponding effect. The ponded water has time to settle out larger particles of sediment that are collected through rooftops and/or pavements. By settling out these particles, the turbidity of the water, in addition to pollutants absorbed to these sediments, can be decreased. A secondary benefit of bio-infiltration SCMs is that the vegetation in the system can also create a diverse habitat for plants and animals. The main goals of volume and peak flow-rate reduction of stormwater runoff, an analysis of the vegetation and a comparison of the soil types with the recommended soil compositions for rain gardens will be examined in the established monitoring plan Evapotranspiration Unlike infiltration and bio-infiltration SCMs, evaporation SCMs, such as green roofs, solely focus on the use of vegetation as the source of stormwater remediation. Figure 2.3 shows an example of a typical green roof used for stormwater management.
 Evapotranspiration SCMs collect stormwater within the pore spaces of the soil column and hold the water until it is either used by plants or")
18 2-7 Figure 2.3: Example of a typical green roof (PA DEP 2006) Evapotranspiration SCMs collect stormwater within the pore spaces of the soil column and hold the water until it is either used by plants or evaporated back into the atmosphere. The goals for evapotranspiration SCMs are usually focused on volume and/or peak flow rate reduction, but these goals are significantly dependent on the status of the vegetation. Green roofs are a type of SCM that is often used in urban areas where open space is limited. Green roofs are vegetated areas on top of roof surfaces used to increase green space and alleviate environmental problems. They usually consist of four layers: an impermeable roof cover, a drainage net, a lightweight growth media and the adapted vegetation (US EPA 2010). Green roofs differ in a number of ways from other types of SCMs. The SCMs previously examined usually accumulate runoff
19 2-8 from a larger drainage area than their own size, and treat all of the water collected. Green roofs usually only collect the water that falls directly onto their surfaces. Green roofs have a number of environmental remediation goals including improving air quality, attenuating stormwater runoff and providing building insulation, sound insulation and envelope protection (DeNardo et al.2003). The main stormwater management goals for green roofs are to accumulate rainfall which falls onto the green roof, store it in the pore spaces of the soil to be used by the plants or transferred back into the atmosphere through evapotranspiration (VanWoert et al 2005). Green roofs have the ability to retain approximately 60% of the rainfall runoff received (VanWaoert et al. 2005). For the rainfall that is not used by the plants through evapotranspiration, the roof can hold the stormwater and increase the time of release by about 20 minutes (Carter and Rasmussen 2006). It has also been proven that green roofs can improve the quality of the water traveling through the system (VanWoert et al. 2005). Although green roofs have a number of positive environmental effects, the goals assessed for this plan only include the remediation of stormwater through evapotranspiration and storage capacity. Therefore, the green roofs explored in this study will only evaluate the status of the vegetation as an indicator of stormwater remediation through evapotranspiration Ponds and Wetlands Ponds and wetland systems are mainly used as an alternative to common detention basins. A shift from these detention basins to natural habitats has created a number of benefits for stormwater control. The main goals of these systems is to
20 2-9 collect stormwater runoff from a large area, guide it into the system and to collect, store, and treat the water before it is released back into downstream areas. Depending on the type of system, ponds and wetlands can also create a diverse wildlife habitat. Constructed stormwater wetlands are a type of SCM that incorporates the use of sediment forebays and flow paths in conjunction with diverse vegetation that it suited for large amounts of water to collect water and treat the runoff before it is released downstream. The main goals of constructed stormwater wetlands are to improve the quality of the runoff and control the peak rate (PACD 1998). 2.2 Types of Monitoring Techniques Performance Assessment of Rain Gardens To create a low level, cost effective monitoring plan for Stormwater Control Measures, previously developed monitoring methods used to evaluate the performance of SCMs were researched. The previous monitoring methods analyzed were also separated into different levels of monitoring which is representative of the monitoring method established for this study. The first monitoring plan analyzed is applicable only to rain gardens or bioinfiltration SCMs. It is divided into three levels: visual inspection, infiltration rate testing and synthetic drawdown testing. The levels increase with amount of effort and funding needed (Asleson et al. 2009). The first level of monitoring incorporates visual inspection to identify problem areas for the system. This level can even be broken down into a simplified and more
21 2-10 complex inspection. The simple inspection involves visiting the rain garden within 48 hours of a storm event and identifying any presence of standing water. The time, 48 hours, is used in a number of manuals (PA DEP 2006), as design criteria to insure the infiltration rate of the systems is adequate and water is flowing through the system. If the ponded water exceeds this 48 hour limit, the presence of stagnant water could indicate clogged areas or inadequate flow paths. A more comprehensive visual analysis includes an assessment of the soil and vegetation within the rain garden as well as an analysis of the flow paths of the water entering and leaving the system. The soil analysis should involve the accumulation of a soil core of the underlying soil so different layers can be classified according to the USDA textural triangle and Munsell soil core chart (Asleson et al. 2009). The vegetation should be analyzed by identifying the species present, looking for invasive species and/or wetland plants, estimating the percent vegetative cover, and identifying the health of the plants by looking at the color, size and quality of the leaves, stems and flowers (Asleson et al. 2009). Overall, the visual inspection should be used as an indicator for additional monitoring or maintenance that may be needed on a site. If a rain garden passes the visual inspection level of assessment, it may be beneficial to gain additional information on the underlying soils. Because the main goal for rain gardens is to collect water and store it until the water is infiltrated into the ground, the infiltration rate or saturated hydraulic conductivity (K sat ) is a good indication of the performance of the rain garden. The infiltration rate can be determined using a number of techniques such as an estimated value from the grain
22 2-11 size analysis, or different types of permeameters or infiltrometers (Asleson et al. 2009). The hydraulic conductivity can be analyzed in different areas or between different rain gardens to determine the variation in performance of different K sat values. This information creates a better understanding of the capacity and performance of the rain garden. The last level of assessment of a rain garden recommended by Asleson et al. (2009) takes considerable time and money to perform. The assessment is a synthetic drawdown test. The synthetic drawdown test is also a way to measure the infiltration rate, but it provides a more holistic approach and determines an infiltration time for the entire basin. The test consists of filling the entire garden with water followed by incremental measurements being taken of the depth in the basin versus time (Asleson et al. 2009). This can provide substantial information on the performance of the rain garden, but the costs may not outweigh the benefits Villanova University s Integrated Monitoring Plan Villanova University is well known for the Stormwater Control Measures implemented throughout campus including a number of rain gardens, infiltration trenches, pervious pavements and a green roof. Extensive research has been performed on these SCMs over a number of years, and recently an integrated monitoring plan has been established not only for the SCMs on campus, but for SCMs anywhere (Hankins et al., 2008). The integrated monitoring plan outlines the different types of SCMs that exist, in addition to various monitoring techniques based on the goals and types of these
23 2-12 SCMs. The types of monitoring include hydrologic, water quality, and ecological. Monitoring an SCM based on the hydrology of the system analyzes the amount of water flowing in and out of the system and any water retained or infiltrated inside the system. The analysis of the hydrology of the system can be performed through the use of rain gauges, pressure transducers in conjunction with weirs, staff gauges and moisture meters. The integrated monitoring plan also uses the change in water quality throughout the SCM as an indicator of performance. Specific water quality indicators used to assess the quality of the water used for this monitoring plan include Total Suspended Solids (TSS), Total Dissolved Solids (TDS), ph, temperature, nutrients, metals and hydrocarbons. The plan also explains that water samples to be tested for these indicators should be taken from various locations throughout the system including the inlet, outlet and subsurface. By sampling the water throughout the system, conclusions can be made in regards to changes occurring through the system and any improvements that may be taking place. The last monitoring technique used to understand the performance of SCMs for this monitoring plan is analyzing the ecology of the system. To understand the ecology of the system, the flora, fauna and soil conditions are monitored. The ecology can be analyzed in a number of ways including an evaluation of the plant diversity and coverage, an estimation of the nutrient uptake from certain plants, insect and animal utilization of the SCM and underlying soil conditions. The diversity of the plants in conjunction with the amount of coverage throughout the system indicates the health of
24 2-13 the vegetation. By analyzing the diversity and coverage, negative qualities of a system can also be addressed such as the presence of invasive species. Invasive species are problematic because they take over too much area, which prevents native plants from growing and flourishing. Plants with nutrient uptake abilities should also be sampled, which can provide information to the changes in water quality that may be occurring in the SCM. Determining the insect and animal utilization of the system can also indicate the health of a system. For example, the presence of mosquitoes usually indicates the presence of stagnant water, which may be detrimental to a system. Lastly, the soils conditions of an SCM can also indicate the presence of any excess sediment buildup, or pollution and nutrient retention that may be occurring. All of these techniques outline diverse techniques which can illustrate the overall ecology of the SCM. The integrated monitoring plan depicted above creates an extensive understanding of the health of many types of SCMs. Although all of these monitoring techniques are useful in certain types of SCMs, some of the techniques do not apply to all SCMs. Therefore, Hankins et al. 2011, also developed the monitoring plan to be applicable by type of SCM being addressed. The monitoring methods used in each type of SCM were outlined previously in Table University of Minnesota s SCM Assessment Program The University of Minnesota developed and published a SCM assessment program (Gulliver and Anderson 2008). This organization developed four different monitoring levels as part of the plan. Distinguishing four different levels enables the
25 2-14 user to apply the monitoring method most applicable to the SCM being evaluated as well as choosing the monitoring method that is within the price range allotted for the project. The four monitoring levels are grouped according to increasing assessment, time and cost. The levels include visual inspection, capacity testing, synthetic runoff testing and continuous monitoring. The first method, visual inspection, costs the least and is the simplest test to perform. The main goal of this monitoring method is to identify and diagnose any problems within the SCM. This level is merely a performance indicator of whether the SCM is functioning. This level should be used to simply evaluate the SCM and provide a gateway into scheduling proper maintenance for any problems found. The visual inspection includes visiting the site and identifying any ponded water or wetland plants that may indicate the presence of standing water. Photographs are recommended to be taken as an indication of problem areas in a SCM. The University of Minnesota s assessment program also breaks down recommendations for visual inspection techniques based on the type of SCM in question. The second level, capacity testing, is more expensive and time consuming but provides much better information on the performance of the SCM. The goal of capacity testing is to identify the infiltration capacity throughout the SCM as well as identify any sediment building throughout the system that may be adversely affecting the infiltration capacity. This is pertinent for infiltration and bio-infiltration SCMs.
26 2-15 Point measurements of capacity assessment, such as infiltration tests, can be taken throughout the area and an average infiltration rate for the SCM can be estimated. The next highest level of monitoring is synthetic runoff testing. The advantage to this monitoring procedure is that it creates a clear representation of the performance of the SCM during a storm event. The method creates a controlled environment in which simulated stormwater runoff is diverted into the system, the SCM treats the stormwater as it would in a rain event, and problem areas can be identified and other indicators, such as the overall infiltration capacity of the system, can be measured. Although this provides a representative depiction of the performance of an SCM, a number of conditions must be met to perform this assessment. The conditions include: a water supply must be available and in close proximity to the SCM, outflow paths other than infiltration need to be plugged, and the water surface elevation must be measured throughout the duration of the experiment. This can be expensive and labor intensive, but can indicate the maximum capacity of water the system can hold. This can indicate the largest storm the SCM can handle, but may not be cost effective. The highest level of monitoring established by The University of Minnesota is a continuous monitoring program. This continuous monitoring program incorporates discharge measurements, water quality sample collection and testing as well as an analysis of the response of the system to natural stormwater runoff. Examples of these continuous monitoring programs can be seen at a number of Universities including Villanova University. These monitoring programs come at large costs and can continue for a number of years. Although these programs can be a source of great
27 2-16 information on many types of SCMs, it is not cost effective for smaller municipal projects which are only being evaluated to determine if they are functioning properly. 2.3 Infiltration and Hydraulic Conductivity as a Performance Indicator The infiltration rate and hydraulic conductivity of the underlying soil can be a clear indicator of the performance of an SCM. As mentioned before, the main goal of bio-infiltration SCMs are to collect, pond and infiltrate water over time. Aside from visual inspection of these flow paths, performing infiltration tests can also serve as an easy-to-use, cost-effective indication of the performance of an SCM in a number of areas. The infiltration rate associated with the movement of water through a bioinfiltration SCM is usually the ponded infiltration. This ponded infiltration is known as a soil-controlled condition (Hillel 1998). A soil-controlled condition is one in which the surface controls the infiltration process (Hillel 1998). Infiltration can also be broken down into two phases. The first phase, in which water begins to pond in the system, the infiltration rate is mainly controlled by a high matrix suction, especially if the soil is dry (Hillel 1998; Jury and Horton 2004). This phase of infiltration is not representative of the actual infiltration rate of the soil. Once the ground becomes saturated, the infiltration of water through the system is driven by gravity through the pore spaces. This phase of the infiltration of the system is assumed to be practically
28 2-17 equal to the saturated hydraulic conductivity (Hillel 1998). Therefore, the infiltration rate should be measured after the soil has become somewhat saturated. The infiltration rate can be an important indicator of performance, but in addition to the changes in infiltration rate as a result of the time, temperature also effects in the infiltration rate. As shown in the equation below (Hillel 1998), the saturated hydraulic conductivity (K) is a function of the intrinsic permeability of the soil (k), the density of the fluid (ρ), gravity (g), and the dynamic viscosity of the fluid (µ). Eq. 1 Although the intrinsic permeability, gravity and density of the fluid do not vary or vary quite minimally with temperature, the dynamic viscosity of the fluid can greatly change with minimal changes in temperature. Therefore, the measurements of saturated hydraulic conductivity should be recorded along with the temperature of the fluid. The infiltration rate of rain gardens is also highly dependent on the soil conditions and can be estimated based on the properties of the soil, such as particle size distribution, hydraulic conductivity and surface conditions (Jenkins et al. 2010). To regulate this high infiltration rate, a number of design recommendations have been formatted through design manuals, such as the Pennsylvania BMP Manual, and previous researched practices (PA DEP 2006 and Davis et al. 2009). Design recommendations consist of soil types with less than 10% clay composition, a low
29 2-18 percentage of fines in general, and could include loamy sands, sandy loams and loams (Davis 2008, PA DEP 2006 and Davis et al. 2009). An evaluation of the soil characteristics will be completed in the monitoring plan to gain additional understanding of the infiltration capacity of the SCM. 2.4 Types of Testing Methods for Infiltration Infiltration Methods for Pervious Pavements The main goals for pervious pavements are to use infiltration as a method of collecting and treating stormwater runoff. To meet these goals, design specifications have been made to increase the infiltration rate or hydraulic conductivity of these systems. The infiltration rate or hydraulic conductivity is the flow rate of water through a system such as pervious concrete. Typical values for the infiltration rate of water through the pervious concrete vary between 290 in/hr (740 cm/hr) and 770 in/hr (1,960 cm/hr) (Tennis et al. 2004). Additionally, values higher than 1650 in/hr (4,190 cm/hr) have been measured in the laboratory (Tennis et al. 2004). It is necessary for pervious pavements to retain these higher values of infiltration rates through the pavement so that they continue to meet the stormwater remediation goals they were designed for. A particular field method has been developed to test the infiltration rate of pervious pavements on site (Delatte, Miller and Mrkajic 2007 and Jeffers 2009). This method uses a concrete core cylinder with a hole in the bottom to direct the water into the pavement. The time it takes the water to empty the cylinder is recorded and this
30 2-19 time is used to calculate the infiltration rate of the pavement. The equation used for this experiment is outlined below (Delatte et al and Jeffers 2009). Eq. 2 This method will be described further in the methods section Infiltration Methods for Bio-infiltration SCMs A number of methods to determine the infiltration rate of soils are used for SCMs. Popular infiltration methods include the single-ring infiltrometer method and the double-ring infiltrometer method. The infiltration rate for these methods is dependent upon the ponding depth, the ring diameter, the ring insertion depth and the initial soil conditions (Wu and Pan 1997). The single-ring infiltrometer method uses a ring that is pounded into the soil and filled with water (Reynolds and Elrick 1990). After the ring is filled, measurements of the height of water within the ring are taken over time. The change in height indicates how fast water is infiltrating into the soil. The ring is used to create a one dimensional vertical direction of flow through the soil. The infiltration rate is determined by creating a graph of the results of the infiltration rate, or height measurement versus time. The double-ring infiltrometer method is similar to the single-ring method, in that is uses a ring to contain water while the infiltration rate is measured. The doublering method uses two rings, one inside the other, to create additional control over the direction of flow (Wu et al. 1997). The space between the inner ring and outer ring is filled with water first to saturate the surrounding water below the ring to ensure that
31 2-20 only one dimensional flow occurs in the inner ring. The inner ring is then filled with water and the height of the water over time is measured and graphed to get the infiltration rate. A number of advantages and disadvantages exist between the two methods, but Wu et al. (1997) found that, double ring infiltrometers caused erroneous infiltration rates which were measured from the inner ring. Additionally, the single-ring infiltrometer method requires fewer supplies to be transported to and from the testing sites. Therefore, the single ring infiltrometer method was used in determining the infiltration rate at a number of the sites evaluated in this study.
32 CHAPTER 3 SITE DESCRIPTIONS The goal of this work was to apply a monitoring plan to Stormwater Control Measures which have already been implemented throughout the Philadelphia, Pennsylvania area. A variety of different types of SCMs were selected to develop and refine a monitoring plan that is versatile enough to evaluate the performance of many different types of SCMs. The location was also a factor in choosing the sites. A close proximity to Villanova University was favored so the maximum amount of sites could be visited during one storm event. Additionally, approval from the on-site manager was needed to gain approval of access to the site, especially during storm events. Potential sites were selected from those included in the Temple-Villanova Sustainable Stormwater Initiative (T-VSSI) Regional BMP Database (TVSSI 2009). The database outlines the SCMs in the Philadelphia region in addition to the background, construction and location of each site. The sites chosen for this project include a naturalized basin with sediment forebays, vegetated swales with a number of flow paths throughout the system, a pervious pavement parking lot, a constructed stormwater wetland, a green roof, a seepage pit and a number of rain gardens. 3.1 Metroplex Shopping Center The Metroplex Shopping Center is located in Montgomery County and is part of the Schuylkill River Watershed. It is located at the intersection of Gallagher and Chemical Roads in Plymouth Township. The site is located adjacent to a shopping 3-1

33 3-2 center containing 780,000 square feet of retail space (T-VSSI 2009). Runoff from the shopping center accumulates from an area with about a six mile radius of impervious surfaces. Prior to 2008, water used to travel into a 1,560 foot arched culvert that controlled the runoff from downstream areas, but did not adequately control sedimentation and erosion, which degraded the ecology and water quality of the system. In 2008, a number of retrofits were implemented to create a more diverse habitat and incorporate a number of SCMs. The retrofits included sediment forebays, vegetated swales, naturalized basins and a meadow conversion. A few other retrofits were later implemented later including a 5,240 square foot vegetative forebay and live stakes for channel protection. Pictures of the design, construction and plant growth can be seen in Figures The site has been maintained since the completion of the construction. Volunteer groups have performed maintenance on the site by removing invasive species, weeding and removing any trash that has accumulated in the basin. Figure 3.1: Design of Metroplex Shopping Center SCMs


34 3-3 Figure 3.2: Construction of Metroplex Shopping Center SCMs Figure 3.3: Growth of Vegetation after Construction at Metroplex Shopping Center 3.2 Morris Arboretum The Morris Arboretum, which is owned by the University of Pennsylvania, is located in Philadelphia County and is part of the Wissahickon Creek Watershed. The arboretum is a 92-acre area containing thousands of different types of woody plants. A pavement parking lot, which is composed of pervious and impervious areas, was installed in All of the parking spots are paved with porous asphalt, and a recharge bed exists below the parking lot which acts as a storage space for the

35 3-4 infiltrated runoff to be held and infiltrate into the ground below. The driving lanes of the parking lot are conventional asphalt, but the lanes do allow the runoff to transfer from these impervious areas to the pervious parking spots. Maintenance procedures have not been reported for this site. A picture of the Morris Arboretum pervious pavement can be seen in Figure 3.4. Figure 3.4: Pervious Pavement at Morris Arboretum 3.3 Natural Lands Trust The Natural Lands Trust is an organization dedicated to protecting forests, fields, wetlands and streams throughout Pennsylvania and New Jersey. In alignment with these goals, the Natural Lands Trust reconstructed a pond into a Stormwater Treatment Wetland on their Hildacy Preserve site located in Delaware County, Pennsylvania. This SCM is located within the Crum Creek Watershed. The construction took place in 2002 and took nearly a year to complete. The construction process can be seen in the Figures


36 3-5 Figure 3.5: Pond Before Reconstruction at Hildacy Preserve Figure 3.6: Construction from Pond to Wetland at Hildacy Preserve Figure 3.7: After Completion of Construction and after One Year as a Wetland System
37 3-6 The wetland now collects and treats runoff from a 2-acre area before releasing the water to the subsurface or downstream areas. The wetland is about 8,000 square feet and not only collects runoff from the surrounding area but also from the roof of the adjacent office building which is 900 square feet. Maintenance has been continually performed on site. Additional plantings have been made between the adjacent tributary and the wetland so flow does not overlap between the two. In addition to extra planting, the site is also continually monitored for invasive species, and such species are removed when present. 3.4 Pennsylvania Department of Environmental Protection The Pennsylvania Department of Environmental Protection incorporated a number of SCMs within their Southeast Regional Office built in The office is located in Montgomery County and is located within the Schuylkill River Watershed. The SCMs on site include a cistern that captures excess runoff from bare roof areas and reuses the water for toilets and watering of indoor flora and a green roof. The SCM investigated for this project was a green roof. The 688-square foot green roof is a patchwork of removable sedum plant trays. Six different species of sedums were planted in this area. The water retained on the green roof only consists of precipitation that falls directly onto the green roof area.

38 3-7 Figure 3.8: Green Roof at Pennsylvania's DEP 3.5 Springside School The Springside School is an all girls college preparatory day school located in Philadelphia, Pennsylvania and located within the Wissahickon Creek Watershed. In 2009, the school constructed a rain garden outside of the school which collects runoff from the roof through artistic downspouts into the rain garden. These downspouts and the construction of the rain garden can be seen in Figure 3.9. The rain garden is approximately 2187 square feet and is home to a large number of plants.

39 3-8 Figure 3.9: Construction of Rain Garden at Springside School 3.6 Wayne Art Center The Wayne Art Center is home to art exhibitions and provides art instruction in Wayne, Pennsylvania. In the early 1990s, the Wayne Art Center had considerable stormwater management problems. Specifically, the site experienced excessive overflow which led to about four to five feet of continually stagnant water. To remedy these problems, the Wayne Art Center received a Growing Greener grant from the Pennsylvania DEP to implement SCMs throughout the site. The SCMs were designed to capture 2,429 cubic feet of runoff from the impervious surfaces at the site. The SCMs on this site include three rain gardens in front of the building and a seepage bed located behind the building. The design plan and pictures of the SCMs are shown in Figures


40 3-9 Figure 3.10: Rain Gardens in front of Wayne Art Center Figure 3.11: Seepage Bed Behind Wayne Art Center Figure 3.12: Schematic Landscape Plan for Wayne Art Center
41 CHAPTER 4 METHODOLOGY 4.1 Monitoring Plan The literature review presented monitoring plans already developed to assess the performance of Stormwater Control Measures. These methods were adjusted and combined to create a low-level monitoring plan that is cost effective for property owners to apply to evaluate their SCMs. The monitoring plan varies with the type of SCM being evaluated, and therefore to aid in the evaluation process, a number of checklists were developed for each type of site. Checklists were made for evapotranspiration SCMs, infiltration SCMs, and bio-infiltration or wetland SCMs. The similarities of the structures and goals of bio-infiltration and wetland SCMs allowed for one checklist to aid in the visual inspection of both types. The checklist for the evapotranspiration SCMs takes into account the main goals of the structures: volume and/or peak flow reduction through the accumulation, storage, and evapotranspiration of held water (Table 4.1). Because these structures rely mostly on the vegetation in the system, the checklist evaluates the health and status of the overall vegetation. The checklist for evapotranspiration SCMs is presented below, with a column designating the applicable site to be evaluated. 4-1
42 4-2 Table 4.1: Checklist for evapotranspiration SCMs Name of site Vegetation C, Q, and S of leaves C, Q and S of stems C, Q and S of flowers Correct Species Percent vegetative cover PA DEP Green Roof The checklist above indicates ways to identify the status of the vegetation on site. The vegetation is divided into an analysis of the leaves, stems and flowers. The analysis includes taking notes on the color (C), quality (Q) and size (S) of the leaves, stems and flowers for the various plants present. This indicates the health of the overall vegetation. It is also important to identify any invasive species present which can be done by checking the species present in the SCM and comparing them to the plant list at the time of construction. Lastly, the percent vegetative cover is performed by measuring areas where plants are present, and areas where plants are missing. This can indicate any problematic areas within the soil or any plants that have died off. This holistic evaluation of the vegetation gives a greater understanding of the performance of the SCM. The infiltration SCM checklist (Table 4.2) applies to SCMs with no vegetation, such as seepage pits and pervious. The goals evaluated with the checklist include accumulating stormwater runoff, storing the stormwater in a bed or pit, and allowing the water to infiltrate through the subsurface over time. The checklist identifies
43 4-3 sources of drainage problems and evaluates the material within the pit or pavement if possible. Table 4.2: Checklist for infiltration SCMs Name of site Drainage Problems Ponded water present for more than 48 hours after rainfall event Sediment accumulation in basin area Clogged inlet structures Clogged outlet structures Excessive Erosion Morris Arboretum Porous Pavement Wayne Art Center Seepage Pit The drainages problems considered include ponded water present after 48 hours, any sediment accumulation creating clogged flow paths or increasing the infiltration rate, clogged inlet and outlet structures resulting from other sources besides sedimentation build-up, and excessive erosion from the flow paths. If the seepage pit consists of certain soil types or gravel, an analysis of the soil may be a good indication of the infiltration rate. The soil can be classified by obtaining a soil sample and classifying it according to the USCS or USDA Soil Classification Systems. Additional soil testing can be performed on any site to further understand the flow paths or infiltration capacity of the system. Once the soil is classified, the infiltration rate for the soil type can be estimated. This estimated value can indicate whether the soil is suitable for the goal of water storage and infiltration.
44 4-4 Another checklist was developed for bio-infiltration and constructed wetland SCMs (Table 4.3). This checklist is the most extensive, as it incorporates a combination of the goals of the two previous checklists. The goals of this type of SCM not only include the accumulation, storage and infiltration of stormwater, but also the promotion of evapotranspiration and establishment of wildlife habitat. Therefore, the visual inspection involves the identification of drainage problems, the health and status of the vegetation, and the analysis of indicator or wetland plants. Additional information was obtained at the bio-infiltration sites by performing infiltration tests on the soil. Table 4.3: Checklist for bio-infiltration and wetland SCMs Name of site Drainage Problems Ponded water present for more than 48 hours after rainfall event Sediment accumulation in basin area Clogged inlet structures Clogged outlet structures Excessive Erosion Vegetation C, Q and S of leaves C, Q and S of stems C, Q and S of flowers Correct Species Percent Vegetative Cover Wetland Plants Metroplex Shopping Center Springside School Rain Garden Wayne Art Center Rain Garden Natural Lands Trust Constructed Wetlands
45 4-5 Cattails Arrowheads Marsh Smartweeds Soil Core for grain size analysis This checklist (Table 4.3) incorporates a number of the other indicators from the previous two checklists (Table 4.1 and Table 4.2), in addition to an analysis of wetland plants. This analysis of the presence of wetland plants can either serve as an indication of positive or negative performance for different SCMs. For example, if wetland plants such as cattails, arrowheads and marsh smartweeds are present in rain gardens or other bio-infiltration SCMs, this indicates poor performance. For these types of structures, the goal is to collect and pond water and to infiltrate the water within a 48- hour time period. The presence of wetland plants would indicate that water is present longer than 48-hours and the SCM is not performing as intended. On the other hand, wetland plants can indicate positive performance in wetlands and other SCMs involving sediment forebays. Specifically for wetlands, water is collected and the water is first treated in a sediment forebay where the larger pollutants and particles are settled out. Although the water eventually moves through the system, wetlands are designed to always have ponded water in the sediment forebays, and therefore the existence of plants that can constantly live in a ponded environment indicates that the system is performing as designed. Therefore, for this section of the checklist, it is essential to understand the goals of the SCM and correlate the indicators accordingly.
46 4-6 Although these three checklists serve as a guide to evaluate different types of SCMs, it is important to first identify the goals unique to the SCM in question and create a checklist which evaluates these goals. This monitoring plan s goal is to use visual inspection and other easy-to-use techniques to evaluate the overall performance and potential need for maintenance or reconstruction of SCMs. 4.2 Grain Size Analysis A grain size analysis is an easy to use, cost effective test that can be performed on a site to gain further understanding of the performance. An understanding of the underlying soils of an SCM can be of great importance. Once the soil type is known, the infiltration rate can be estimated. In addition, a grain size analysis can indicate the presence of fines that may reduce the infiltration rate. A sieve analysis provides the grain size distribution for particles larger than mm. The standard method used is ASTM D 422 Standard Test method for Particle-Size Analysis of Soils. A soil wash was first performed on the soil sample to quantify and rid the sample of the particles smaller than the #200 sieve. The remaining soil was used for the grain size analysis. In addition to the grain size distribution, the liquid limit and plastic limit of the soil was determined to further classify the soil according to the USCS. The Atterberg Limits, as they are also known, was found according to the ASTM D 4318 Standard Test Methods for Liquid Limit, Plastic Limit and Plasticity Index. 4.3 Infiltration Tests Infiltration Method for Pervious Pavements
47 4-7 Infiltration tests are good indicators of the performance of stormwater control measures (Asleson et al. 2009). The infiltration rates of strictly infiltration and bioinfiltration SCMsshould be tested over time. Two different methods for measuring the infiltration rate were used: one for pervious pavement systems and the other for bioinfiltration systems. The infiltration rate into pervious pavements was measured using the method developed by Delatte et al. (2007). The amount of time it takes for water to empty from a concrete cylinder is measured; this time (t, in seconds) is then used to calculate the infiltration rate (k, in in/hr) using the following equation: (1) Infiltration Method for Rain Gardens A single ring infiltrometer was to determine to infiltration rate of soils for this study. For this test, the supplies used were a 12.5 inch diameter and 20 inch tall large metal ring, a rubber mallet used to seat the ring into the ground, water, a tape measure and a stopwatch. These materials can be seen in Figure 4.1.

. Figure 4.")
48 4-8 Figure 4.1: Materials used for Infiltration Tests First, the ring was placed in an area of the bio-infiltration area that was part of the flow path. The ring was then drilled into the soil using the rubber mallet. Once the ring reached an adequate depth so that no water would seep out underneath the sides, the tape measure was placed inside the ring, against the wall of the ring, and flush with the ground surface (Figure 4.2). Figure 4.2: Single ring infiltrometer before test began Next, the timer was prepared and water was poured into the ring using a large bucket. As soon as all of the water was inside the ring, the timer began and the height
49 4-9 of the water was recorded every few seconds in the beginning, and then every few minutes once the infiltration rate became slower. The height readings were then used to create a graph of the infiltration versus time. The infiltration rate, once graphed, displayed a greater slope at the beginning of the tests due to soil matrix suction and the initial saturation of the soil. After about ten minutes into the infiltration tests, the infiltration slope became constant for the remainder of the test. The constant slope following the ten minute mark, which was assumed to be the infiltration rate, was estimated using a linear trendline for each infiltration test. Although this provided an estimated steady-flow of the water filtering through the SCM, additional evaluation of the infiltration rate was considered for twodimensional flow. The single ring infiltrometer method provided a steady infiltration rate, but it is assumed to be greater than actual conditions due to flow geometry. The steady infiltration rate is not expected to maintain one dimensional after the water flows past the sides of the ring. Two-dimensional flow is assumed to develop as soon as the water passes the sides. Therefore, it should be noted that the infiltration rates estimated from these tests are an over-estimation of the actual infiltration rate.
50 CHAPTER 5 RESULTS AND DISCUSSION The results of this work will be presented for each site. The results, which vary depending upon SCM type, include an analysis of the flow paths of the systems, plant inventories, grain size analysis and infiltration tests. The results are used to categorize the performance of the sites as exceeds expectations, meets expectations and needs improvement. 3.1 Metroplex Shopping Center The Metroplex Shopping Center SCM is a combination of sediment forebays, vegetative swales, naturalized basins and a meadow conversion. The goals of these SCMs are to slow down, transport and treat the water traveling through the watershed. To analyze this performance, the flow paths, vegetation and underlying soils were analyzed. This site is meets expectations. The first analysis performed on site was that of the flow path and any corresponding drainage problems. The flow path is what directs water into and throughout the SCM and allows the water to be treated. The flow path for this SCM is adequately designed and performs as it should. It consists of four inlets which transport runoff from the surrounding impervious areas to the SCM. The first inlet is a 1,560 foot arched culvert shown in Figure 5.1. Large amounts of water travel through this culvert and travel directly into the sediment forebay. The second inlet (Figure 5.2: 5-1
 is smaller, and transfers water from impervious areas into the middle part of the SCM, however, there is adequate space for significant treatment before the")

51 5-2 Second inlet structure for Metroplex Shopping Center SCMFigure 5.2) is smaller, and transfers water from impervious areas into the middle part of the SCM, however, there is adequate space for significant treatment before the water is later released. Figure 5.1: First inlet structure for Metroplex Shopping Center SCM Figure 5.2: Second inlet structure for Metroplex Shopping Center SCM The third inlet (Figure 5.3) takes water from a different area and discharges it in the middle part of the SCM. The fourth inlet (Figure 5.4) is on the same side as the third, just upstream. This inlet is similar to the second and third and is capable of


52 5-3 transferring much less runoff than the first. The combination of inlets provides an adequate transportation of water from adjacent impervious areas into and throughout the Metroplex SCM. Figure 5.3: Third inlet structure for Metroplex Shopping Center SCM Figure 5.4: Fourth inlet structure for Metroplex Shopping Center SCM The inlets not only provide adequate entrance to the SCM, but the flow paths throughout the SCM decrease the velocity of th stormwater and provide treatment of the water through settlement of the particles and interaction with the vegetation


53 5-4 (Figure 5.5). The flow paths were also analyzed for sediment accumulation, clogging and excessive erosion using the checklist described in the methods section. The checklist and corresponding notes are reported in Table 5.1. Figure 5.5: Flow paths through Metroplex Shopping Center SCM Table 5.1: Drainage notes taken on site at Metroplex Shopping Center Drainage Problem Analyzed Ponded water present for more than 48 hours after rainfall Sediment accumulation in basin area Clogged inlet structures Clogged outlet structures Excessive erosion Metroplex Shopping Center Notes Yes but water is moving through the system. No indication of stagnant water or mosquitoes Sediment is present throughout the system but is not impacting the performance No No Mild erosion but none impacting performance For such a large area, an entire plant inventory is not practical. Therefore, a comparison was made between the original plant list and plants present during the inspection (Table 5.2).
54 5-5 Table 5.2: Plant list and indication of on-site presence for Metroplex Shopping Center Plant Species Common Name Presence Yes/No Lobelia cardinalis Herbacious Cardinal Flower- 150 Yes Iris versicolor Blueflag Iris- 150 Yes Panicum virgatum Switchgrass- 150 Yes Calamagrotis canadensis Bluejoint Grass- 150 Yes Aster novae-angliae New England Aster- 150 Yes Trees Acer rubrum Red Maple Yes Amelanchier canadensis Canadian serviceberry Yes Betula nigra River birch Yes Fraxinus pennsylvanica Green ash Yes Liquidambar straciflua Rotundiloba Yes Platanus acerifolia Bloodgood Yes Quercus Phellos Pin oak Yes Salix babylonica Weeping willow Yes All of the plants on the plant list were present, and a number of additional species were as well. The majority of the plants present, including the plants of the previous list, were all native species, but some invasive species were present. For example, Purple Loosetrife or Lythrum salicaria was found at this site. Invasive species should be identified and removed at these sites to insure that they are not taking over the native vegetation. The Metroplex Naturalized Basin was found to be meeting expectations. As previously analyzed, the large number of inflow pipes leading to the basin allows for the water to disperse throughout the entire area. Additionally, the flow paths are working according to design and use a combination of sediment forebays and smaller flow channels to direct the water towards the outlet structure. Although the water is
55 5-6 directed to the outlet, the water is held for a long period of time before it is discharges, increasing the time of concentration for the downstream waters, and treating the water through settling and interactions with the vegetation before it is discharged as well. Additionally, there are no significant problems with the vegetation. All of the species from the plant list provided are present and the one invasive species found is not taking over the surrounding vegetation yet. To gain additional information about the underlying soils throughout the Metroplex SCM, a soil sample was collected on site and transported back to the Soils Laboratory at Villanova University to perform a grain size analysis. The USCS soil classification was found to be an OL or organic clay. The USDA soil group was found to be Group C. Soil group C indicates the presence of fine particles within the soil. Although soil group C is not ideal for infiltration SCMs, the presence of fines does not hinder the performance of the Metroplex SCM because it uses these fines to trap and direct the runoff throughout the area.
56 5-7 Figure 5.6: Grain Size Distribution of soils on Metroplex Shopping Center Site 3.2 Morris Arboretum The next site analyzed was the pervious concrete pavement site located at the Morris Arboretum in Philadelphia, Pennsylvania. The main components of the analysis included an evaluation of the drainage and flow paths into and over the pavement and an infiltration test. This site is not performing as designed and needs improvements. The drainage problems and corresponding notes are reported in Table 5.3 along with pictures of the excessive sediment that has built up on site and clogged


57 5-8 areas which are depicted in Figure 5.7. Figure 5.7: Sediment build-up and clogged areas at Morris Arboretum greatly affecting performance Table 5.3: Drainage notes taken on site at Morris Arboretum Drainage Problem Analyzed Ponded water present for more than 48 hours after rainfall Sediment accumulation in basin area Clogged inlet structures Clogged outlet structures Excessive erosion Morris Arboretum Notes No Excessive sediment build-up in certain areas of pavement, and clogged areas throughout No Mildly clogged from leaves Erosion in many areas The flow into the system is sheet flow over the adjacent impervious pavement areas into the pervious pavement areas as a result of sloped areas. Outflow structures are also present, but are clogged in some areas. As shown in Figure 5.7, the clogged areas greatly affect the performance of the pavement, decreasing the infiltration of the system. Figure 5.7 also shows the pervious pavement adjacent to the impervious roadway during a storm event. Although the infiltration rate is not optimal, infiltration is still occurring on site. The pervious pavement in the pictures is not as wet as the impervious areas, although some ponding exists in some areas. The decrease in infiltration is also proven through the infiltration test performed on site.
58 5-9 The infiltration rate of the pervious pavement was estimated using the infiltration apparatus and method described in the methods section (4.3 Infiltration Tests). The infiltration rate was found to be 0.55 in/hour. This is an average infiltration rate for the entire pervious pavement area. Although the infiltration rate was very low, no ponded water was found on site 48 hours after a rain event. This could be due to the adjacent outflow structures that may discharge any ponded water that may collect on site. The Morris Arboretum Pervious Pavement site needs improvements and reconstruction. The main indicators for this site were visual inspection of the flow path and clogged areas and the infiltration rate of the pavement. Visual inspection indicated that the flow path of the water to the pavement was still maintained, but clogged areas and excessive sedimentation in certain areas of the pavement hindered the performance of the pavement considerably. The infiltration test for the pavement found the infiltration rate of the surface to be approximately 0.55 in/hour. This estimation was quite low compared to the expected values for pervious pavements (between 290 in/hour and 770 in/hour) (Tennis et al. 2004). Additionally, the experimental apparatus explained in the methods section uses ponded water to infiltrate the water, which incorporates additional head creating pressure on the pavement. Therefore, the infiltration rate may even be smaller than calculated. This low infiltration rate is expected to be from the clogging and sediment build-up. No maintenance is known to have been performed on site. Therefore, due to the low performance of this pervious pavement, maintenance procedures should be performed

59 5-10 to see if any improvements can be made at a low cost. This could include vacuuming the area, and comparing the infiltration rate before and after. Because this site is so clogged, vacuuming may not have a significant effect on the performance, and renovations and reconstruction may need to be made. 3.3 Natural Lands Trust The Natural Lands Trust is a constructed wetland area which was analyzed for drainage issues and wetland plant species present; in addition the underlying soil was analyzed. This site is exceeding expectations. The flow paths and drainage was analyzed similarly to the first few sites (Table 5.4). The flow paths were very clear for this particular site. The inlet to the wetland included runoff from the rooftop of the adjacent building and sheet flow coming off of the upstream hill. The wetland was then divided into two separate areas. The separation by a grass walkway can be seen in Figure 5.8. Figure 5.8: Grass walkway between two wetland areas at Natural Lands Trust

60 5-11 The upstream wetland area collects the runoff and begins to treat the stormwater by slowing it down. The area is composed mostly of thick vegetation, and has a shallow bowl shape to it. This shallow bowl shape allows for the water to be collected and transported downstream. The water is treated by slowing the water down, causing larger sediment particles to drop out and allow for interactions to occur between the stormwater and the vegetation. This first section of the wetland can be seen in Figure 5.9. Figure 5.9: Upstream section of the wetland area located at Natural Land Trust After the water moves to the downstream end of the first wetland, it travels through a pipe underneath the grass walkway to the second wetland area. The second part collects water from the upstream section of the wetland in a sediment forebay area. This area allows for additional settling of the particles in the water as well as

61 5-12 additional plant interactions. A picture taken from the upstream end of the second wetland area can be seen in Figure Figure 5.10: Picture of second wetland area at Natural Lands Trust The flow path through the two wetland areas is sufficient to decrease the velocity and treat the water. Additional notes were taken on the drainage throughout the system and are reported in Table 5.4. Table 5.4: Drainage notes taken on site at Natural Lands Trust Drainage Problem Analyzed Ponded water present for more than 48 hours after rainfall Sediment accumulation in basin area Clogged inlet structures Clogged outlet structures Excessive erosion Natural Lands Trust Notes Yes, and is sufficient for wetland areas. No presence of excessive stagnant waters, and no mosquitoes. N/A No No N/A

62 5-13 In addition to the flow paths through the system, there is also an outlet structure which controls the release of water to the downstream areas (Figure 5.11). Figure 5.11: Outlet structure of wetlands at Natural Lands Trust The outlet structure is a weir-type structure that releases a small volume of water once the water reaches a certain level in the wetland. The outlet structure can also be manually released to allow for additional water to drain during larger storm events. In addition to the evaluation of the drainage and flow paths, the vegetation was analyzed on site. Because the wetland area included a number of different species, a complete plant inventory was not practical. Therefore, wetland species were identified to ensure that the right habitats were formed, and invasive species present were also noted. Wetland species present to this area were Cattails or Typha latifolia.
63 5-14 Additionally, Phragmites austrailis, an invasive plant, were also present and should be removed. A grain size analysis was performed on the underlying soils at the Natural Lands Trust Constructed Wetland. Constructed wetland systems are typically underlain by finer-grained soils. Finer grained soils, such as clays, allow wetlands to create flow paths for the water and areas of ponding, such as sediment forebays, which can also allow for additional treatment. The grain size distribution is presented in Figure 5.12; according to the USCS the soil is a silty sand or SM soil, and is a Group B soil within USDA Classification system. Figure 5.12: Grain Size Distribution of soils at Natural Lands Trust
64 5-15 A number of factors went into the evaluation of the Natural Lands Trust Stormwater Wetlands. Overall, the wetland was performing as designed and with the addition of regular maintenance and volume controlled structures, the wetland was found to exceed expectations. The flow path was adequate for the system, the entrance of the water through sheet flow over the adjacent grass area and the inflow from the adjacent buildings created a sufficient inflow. The presence of wetland species indicated that the water remained and was treated in the wetland for an extended time, meeting the goals for Constructed Stormwater Wetlands. Although some invasive species were present, they were kept under control through regular maintenance. The underlying soils performed according to design, as they kept the water ponded in a number of areas, while man-made structures allowed for excess discharges to occur when needed. The underlying soil was found to be a silty sand in the adjacent area which would not normally allow for ponding to occur which indicated that the underlying soils within the wetland could differ or a liner could be present as well. 3.4 Pennsylvania Department of Environmental Protection The green roof at The Pennsylvania Department of Environmental Protection was evaluated. The green roof only accepts water that falls directly onto the roof, therefore the flow path for this system did not need to be analyzed. As stated before, the main remediation technique for green roofs is evapotranspiration, which is dependent on the status of the vegetation. To evaluate the status of the vegetation, a
65 5-16 plant inventory was taken of the area, in addition to an evaluation of any problems with the vegetation itself. Information on the size of the vegetative area, percent vegetative and plants present can be seen in Table 5.5. This site needs improvements. Table 5.5: Plant Inventory for PA DEP Green Roof PA DEP Vegetative Characteristics Total Green Roof Area (ft²) 969 Percent Vegetative Cover 30.2 PA DEP Plant Inventory Plant Species Common Name % Vegatative Cover Sedum rupestre Angelina 0.5 Sedum kamtschaticum Weihenstephaner Gold 29.9 Sedum spurium 'Fuldaglut' Dragons blood 1.7 Other Grasses 67.9 Few species of plants were present at the PA DEP Green Roof, and a number of the plants have died off. As shown in the table above, only 30% of the green roof area was covered with healthy plants. There was no plant inventory provided for the site, so no comparison could be made between the plant inventory and plants which should have been present. The green roof evaluated at the PA Department of Environmental Protection was strictly monitored on the vegetation. This green roof needs additional planting and improvement. To perform this analysis, a plant inventory was taken of the site. The percent vegetative cover of the site was approximately 30% of the entire green roof. This amount of cover is not acceptable for a green roof to work at its maximum


66 5-17 potential. A number of the plant species had died off, only leaving a few to survive. Although the stormwater was collected in all areas of the green roof, the maximum retention and return to the atmosphere through evapotranspiration could not be met. To function at the highest potential, the green roof should be completely covered with healthy, living vegetation. This goal could be met through seasonal watering when needed. 3.5 Springside School The rain garden at the Springside School was monitored by evaluating the flow paths and drainage problems, the vegetation, underlying soils and infiltration rate of the system. Each of these techniques were used to evaluate the entrance and exiting of the stormwater, the capacity of the system and the potential for evapotranspiration. The flow paths into, throughout and exiting the rain garden were analyzed. There are a number of downspouts transporting water into the rain garden (Figure 5.13).


67 5-18 Figure 5.13: Inflow pipes transporting water from the roof drains into the rain garden In addition to the downspouts there were a number of flow paths for the water which traveled through the rain garden. The first flow path shown as the pipe to the left in Figure 5.14, traveled directly over a slate walkway, then into the rain garden, but only for a couple feet and then flowed directly into an outflow pipe. This particular flow path provided for minimal storage of the water traveling through the systems and came in contact with very little vegetation. This flow path in particular was not helpful for stormwater remediation, and needs to be altered. Figure 5.14: Flow path of first inflow pipe needing improvement Although this flow path did not help in the goals of the rain garden, the other inflow pipes sufficiently distributed the water throughout the rain garden and allowed for storage and interactions with the vegetation. Six other inflow pipes surrounding the rain garden either dispersed the water over and throughout the area, or underneath and into the soil layers. In addition to the pipes leading the stormwater from the rooftops to the rain garden, the area is adjacent to and downstream of an impervious roadway in which runoff travels off of the road and into the garden. Therefore, the majority of the
68 5-19 water traveling into and throughout the system is sufficient for stormwater removal and treatment. Additional notes taken on the drainage throughout the garden during storm events are reported in Table 5.6. Table 5.6: Drainage notes taken on site at Sprinside School Drainage Problem Analyzed Ponded water present for more than 48 hours after rainfall Sediment accumulation in basin area Clogged inlet structures Clogged outlet structures Excessive erosion Springside School Notes No may be due to overflow grate located inside the garden Minimal No No No The next area of interest in evaluating the performance of the Springside School rain garden was to understand the vegetation. This includes a plant inventory of the area, an assessment of the health of the vegetation and a check for invasive species. The plant inventory and the percent vegetative cover are reported in Table 5.7.
69 5-20 Table 5.7: Plant inventory and percent cover for Springside School Plants Total Area (ft²) Percent Vegetative Area (%) 58.0 Shrubs Plant Species Avg Height (ft) % Area Liatris spicata Echinacea purpurea Mondarda didyma Misccanthus sinensis Iris germanica Cyperaceae Helictotrichon sempervirens Onoclea sensibilis Asclepias purpurascens Percent Cover 58.0 For the plants present at the Springside School, the vegetation was in excellent condition. The leave stems and flowers of each plant were assessed and they all had the proper color, quantity and quality of the leaves, stems and flowers. Additionally, all of the plants reported in the plant inventory are native species perfect for swamp or marsh areas, and there were no invasive species. An assessment of the underlying soil and an infiltration test were performed to understand the capacity of the subsurface material for stormwater storage and the potential for the soil to infiltrate into the underlying soils. First a soil sample was retrieved from the site and transported back to the laboratory for a grain size analysis. The results of the grain size distribution can be seen in Figure The grain size distribution in conjunction with the plastic and liquid limit tests indicated that the soil
70 5-21 tested was a silty sand (SM) according to the USCS and a USDA soil type B. This soil has adequate infiltration and storage properties. Figure 5.15: Results for Springside School's Rain Garden Grain Size Distribution Test Lastly, an infiltration test was performed on site to gain additional understanding of the performance of the rain garden. The entire infiltration test is shown in Figure 5.16, and the constant slope used to determine the infiltration rate, as mentioned in the methods sections, is shown in Figure 5.17.
71 5-22 Figure 5.16: Springside School Infiltration Test Data Figure 5.17: Springside School Infiltration Rate after 10 minutes
72 5-23 The results from Figure 5.17 indicate that the infiltration rate was approximately 5.64 inches/hour or cm/second. This is a high value for soil and indicates that a large amount of stormwater accumulated into the rain garden is being infiltrating into the soil. The Springside School site was the first rain garden to be evaluated. It was found to meet expectations. The flow paths indicated sufficient performance, although some areas need improvements. The first flow path indicated the water traveling in this area traveled into the rain garden, over a large slate area, and into a drainage pipe. If this were the only inlet bringing water into the rain garden, improvements would need to be made, but the application of the other six inflow pipes distributing the water throughout the rest of the area keeps the rain garden performing as expected in regards to the water traveling in and out of the rain garden. Additionally, the health of the vegetation was exceptional. Fifty eight percent of the area was vegetative cover, and no invasive species were present. Additionally, the soil was found to be a silty sand (SM), or Group B soil according to the USDA, which provides for adequate infiltration to occur. The infiltration test performed on site corroborated these results, and the infiltration rate was found to be 5.64 inches per hour. 3.6 Wayne Art Center Wayne Art Center is home to four individual Stormwater Control Measures which were evaluated separately. A picture of The Wayne Art Center site and the names of each SCM on site are presented in Figure 5.18.

73 5-24 Figure 5.18: Ariel view of Wayne Art Center and on site SCMs Although each SCM will be identified individually, a common characteristic used in understanding the performance of all of these sites is the underlying soil. Therefore, a composite soil sample was taken from the Wayne Art Center and brought back to the Villanova Soils Laboratory for further testing. A grain size distribution was done on the soil sample to classify the soil. The results from the grain size distribution are reported in Figure 5.19.
74 5-25 Figure 5.19: Grain size distribution for underlying soil at the Wayne Art Center The grain size distribution in conjunction with the plastic and liquid limit tests indicate that the underlying soil at the Wayne Art Center was a USCS Classification: SM or silty sand, and was classified as the USDA soil type B. This soil type indicates high infiltration rates which is particularly good for the bio-infiltration and infiltration SCMs on site Rain Garden #1 The first rain garden, with an area of about 157 square feet, is located closest to the driveway entrance. This site was analyzed for drainage problems and the status of the vegetation. This site is meeting expectations. The flow path of the stormwater travels directly from an adjacent impervious walkway, downstream and into the rain garden (Figure 5.20). The stormwater is


75 5-26 transferred into the rain garden and stored for treatment. There are no significant problems with the flow path. Additional drainage notes are reported in Table 5.8. Figure 5.20: Wayne Art Center Rain Garden #1 and inflow area Table 5.8: Drainage notes taken on site at Wayne Art Center - Rain Garden #1 Drainage Problem Analyzed Wayne Art Center Rain Garden #1 Notes Ponded water present for more than 48 No hours after rainfall Sediment accumulation in basin area Some towards inlet area Clogged inlet structures No Clogged outlet structures No Excessive erosion No In addition to understanding the flow path and drainage properties of the rain garden, the vegetation for the area was analyzed by completing a plant inventory, an analysis of the health of the vegetation and a check for invasive species. The plant inventory collected information on the plants present, their physical characteristics, their vegetative cover and the total percent vegetative cover (Table 5.9). The plant
76 5-27 highlighted in red is an invasive species, and should be removed as soon as possible. The health of the vegetation was checked on site as well. The health of the vegetation of this rain garden was excellent. The leaves, stems and flowers of each plant were assessed and they all had the proper color, quantity and quality of the leaves, stems and flowers. Table 5.9: Percent vegetative cover and plant inventory of Rain Garden #1 at WAC Total Cover Percent Vegetative Cover 85.9 Shrubs ID Name Length (ft) Width (ft) Height (ft) Area (ft2) Total Area Plant 1-1 Iris germanica Plant 1-2 Iris germanica Plant 2-1 Acorus calamus Plant 2-2 Acorus calamus Plant 2-3 Acorus calamus Plant 2-4 Acorus calamus Plant 3-1 Broussonetia papyrifera Plant 3-2 Broussonetia papyrifera Lastly, an analysis of the underlying soil was assessed using a grain size analysis and an infiltration test. A composite grain size analysis was performed for the entire site and has already been reported. Additionally, infiltration tests were performed for Rain Gardens 2 and 3, but due to a liner underneath the rock bed within this rain garden, an infiltration test could not be. Although an infiltration test could not be performed, an analysis of the notes taken of the drainage through the system indicate there are no significant problems with infiltration for this rain garden, as there
77 5-28 was no ponded water present after 48 hours and no wetland plant species were present either. The first rain garden is meeting expectations. The flow path into the area was adequate sheet flow traveling into the rain garden from the adjacent pavement. Although there was some sedimentation towards the inlet, it did not seem to be affecting the performance. The vegetation for this rain garden covered 85% of the area, and although one invasive species was found, it was not yet hindering the area. Although the infiltration rate of this rain garden could not be found, no excess ponding was present during rain events suggesting the rate was adequate Rain Garden #2 The second rain garden was evaluated in the same manner as Rain Garden #1 and the Springside School Rain Garden. The evaluation includes an analysis of the flow paths, drainage problems, vegetation and soil analysis. A picture of the bowlshaped rain garden is shown in Figure This rain garden was analyzed for drainage problems, the status of the vegetation and the infiltration rate. This rain garden is exceeding expectations.

78 5-29 Figure 5.21: Rain Garden #2 located at Wayne Art Center The flow path into the second rain garden uses pipes to transfer water from roof drains into the rain garden area. As shown in Figure 5.21, the rain garden is bowl shaped and is about 102 square feet in size. The vegetation is around the edges of the area, with minimal vegetation within the actual bowl. The flow path into the system is adequate. No other flow path exists, as the water is just accumulated inside the bowl and stored for infiltration or evapotranspiration. Additional notes on the drainage are reported in Table 5.10.
79 5-30 Table 5.10: Drainage notes taken on site at Wayne Art Center - Rain Garden #2 Drainage Problem Analyzed Wayne Art Center Rain Garden #2 Notes Ponded water present for more than 48 hours after rainfall Significant ponding occurs within the bowl during storm events, but no water is present after 48 hours Sediment accumulation in basin area Minimal Clogged inlet structures No Clogged outlet structures No Excessive erosion No The vegetation was analyzed for this rain garden. As mentioned before, the majority of the vegetation surrounds the bowl on the outside edges, and minimal plants are within the bowl. The inventory of the surrounding plants and percent vegetative area are presented in Table The health of the vegetation at this rain garden was also found to be excellent by analysis of the leaves, stems and presence of flowers. Additionally, no invasive species were present at this rain garden. Table 5.11: Percent vegetative cover and plant inventory of Rain Garden #2 at WAC Total Cover 22.6 Percent Vegetative Cover 22.2 Trees Tree ID Name Total Height (ft) Crown Width (ft) Base Dimensions (ft) Area of Cover (ft2) 1A Cornus sericea alba B Cornus sericea alba C Cornus sericea alba D Cornus sericea alba E Cornus sericea alba Amelanchier Canadensis
80 5-31 After the flow path and vegetation were assessed, an infiltration test was performed on site. The results for the single-ring infiltration test are shown in Figure Figure 5.22: Wayne Art Center Rain Garden #2 Infiltration Test Results The entire infiltration test is shown in Figure 5.22, and the constant slope used to determine the infiltration rate is shown in Figure 5.23.
81 5-32 Figure 5.23: Wayne Art Center Rain Garden #2 Infiltration Rate Approximation Using the approximation of the linear trendline, the infiltration rate was found to be about 14.4 inches/hour or cm/second. This high infiltration rate indicates that large amounts of water can be transferred through the underlying soil during rain events. The second rain garden is meeting expectations. The flow path into the system is acceptable as it transports water from the roof of the neighboring building into the bowl. The shape of the rain garden also allows for collection and ponding of the accumulated water. The vegetation was all native to the area and the percent vegetative cover was about 22%. Additional plants could be introduced into the bowl area of the rain garden to incorporate additional evapotranspiration and water treatment. The infiltration rate greatly exceeded the expectations of the rain garden


82 5-33 and was measured to be 14.4 inches per hour. This is adequate for collecting, storing and infiltrating a large amount of stormwater Rain Garden #3 The last rain garden assessed at Wayne Art Center was Rain Garden #3. This rain garden was located farthest from the entrance to the site and covers an area of about 350 square feet. Although the rain garden has a large area, the area in which the stormwater covers the rain garden is much smaller. A picture of the last rain garden is depicted in Figure This rain garden was analyzed for drainage problems, the status of the vegetation and the infiltration rate. The rain garden needs improvements. Figure 5.24: Inflow pipes directing stormwater into Rain Garden #3 at Wayne Art Center As shown in the pictures above, inflow pipes direct stormwater from the roof of the building into and throughout the rain garden. The rain garden consists mostly of level ground, with a small decrease in elevation in the rocky area, used to accumulate stormwater. Although stormwater travels over the majority of the area, there is little space for any ponded water to accumulate. Most of the stormwater which is directed to
83 5-34 the heavily planted areas are used by the plants and initially infiltrated into the ground, but later in the storm event can travel over the area and into the adjacent parking lot. Minimal drainage problems were reported due to this movement of water throughout the area, and are reported in the Table The only drainage problem was the minimal sediment build up in the system. Table 5.12: Drainage notes taken on site at Wayne Art Center - Rain Garden #3 Drainage Problem Analyzed Wayne Art Center Rain Garden #3 Notes Ponded water present for more than 48 No hours after rainfall Sediment accumulation in basin area Minimal Clogged inlet structures No Clogged outlet structures No Excessive erosion No A plant inventory was taken of the plants throughout the rain garden. The percent vegetative cover and the plant inventory are reported in Table The status of the leaves, stems and flowers were also analyzed and the overall health of the vegetation was good. Most plants were in excellent shape with a few in mediocre condition. There were no invasive species in Rain Garden #3.
84 5-35 Table 5.13: Percent vegetative cover and plant inventory of Rain Garden #3 at WAC Total Cover 94.0 Percent Veg Cover 26.8 Shrubs Leaves Stems Flowers ID Name Length (ft) Width(ft) Area Total Area Height Color Status Color Status Color Quantity Status Percent Cover 1A Iris pseudoacorus green good green good yellow 16 good 1B Iris pseudoacorus green good green good yellow 1 ok 8.8 2A Acorus calamus green good green good B Acorus calamus green good green good A Rudeckia triloba green good green ok orange 4 ok 3B Rudeckia triloba green good green good orange 6 good Cornus sericea alba yellow good green good Totals A single ring infiltration test was performed on the soils in Rain Garden #3. The infiltration test was performed in the area of the rain garden where stormwater can pond (the rocky area), which can be seen in Figure The results from this infiltration test are shown in Figure 5.25.
85 5-36 Figure 5.25: Wayne Art Center Rain Garden #3 Infiltration Test Results The infiltration test followed the same trend as the two previous infiltration tests reported. Therefore, the analysis was the same for this infiltration test. A linear trendline was used for the second half of the test to approximate the infiltration rate of the soil. This approximation is shown in Figure 5.26.
86 5-37 Figure 5.26: Wayne Art Center Rain Garden #3 Infiltration Rate Approximation Using the approximation above, the infiltration rate for the third rain garden at the Wayne Art Center was found to be 5.64 inches/hour or cm/second. This is an adequate infiltration rate for stormwater to move through the underlying media. The last rain garden at the Wayne Art Center needs improvement. First the flow path was analyzed, which included direct inflow from rooftop drains. The flow path within the system was not as established. There was no bowl area to store a large amount of stormwater. Although the flow paths came in contact with the plants present and certain rocky areas for infiltration, no ponded water was able to accumulate in the area. Therefore, only a small amount of runoff could truly be collected. The vegetation of the area was evaluated and native species existed creating a diverse habitat of plants and having about 27% cover. No invasive species were

87 5-38 found. The infiltration rate was also comparable to the Springside School rain garden, and was approximately 5.64 inches per hour. This allows for the stormwater traveling over the surface to infiltrate quickly, although it does not meet the overarching goal of collecting stormwater in a bowl-type area and storing the runoff for infiltration. If the rain garden was altered to create this bowl shape, more runoff could be stored instead of traveling over the rain garden during large events Seepage Bed The last stormwater control measure evaluated at the Wayne Art Center was a seepage pit. The seepage pit is approximately 670 square feet, and collects stormwater from the rooftop of the building adjacent to it. A picture of the seepage pit is shown in Figure This site was analyzed for drainage problems and flow path problems and was found to meet expectations. Figure 5.27: Picture of the seepage pit at Wayne Art Center


88 5-39 As mentioned before, stormwater taken from the adjacent building is transferred into the seepage pit through pipes attached to the rooftop drains. Also, stormwater which falls directly onto the seepage pit is collected and stored for infiltration. Pictures of the inflow pipes are shown in Figure Figure 5.28: Inflow pipes routed from rooftop drain to seepage pit Although the pipes are performing as they should by transferring water from the rooftops to the seepage pit, there is significant ponding of the stormwater around the exit point of the pipes. The stormwater is not being dispersed over the entire seepage pit, and therefore the maximum storage potential of the pit is not being used. Additional notes taken on this phenomenon are reported in Table 5.14.
89 5-40 Table 5.14: Drainage notes taken on site at Wayne Art Center - Seepage Pit Drainage Problem Analyzed Ponded water present for more than 48 hours after rainfall Sediment accumulation in basin area Clogged inlet structures Clogged outlet structures Excessive erosion Wayne Art Center Seepage Pit Notes Although there is significant ponding around the inlet structures during storm events, no ponded water is present after 48 hours No No No No It should be also noted that no clogging has occurred throughout the seepage pit because the adjacent plants are far enough from the site, which prevents leaves and other debris from entering the area. In addition, the runoff from the roof is free of fines. The seepage pit is made up of large gravel particles. Due to this large particle size, the porosity of the bed is large, indicating large storage space throughout the bed. A single ring infiltration test was attempted on this site, and due to these large particle sizes and excessive storage capacity, the water infiltrated too quickly for any measurements to be taken. Therefore, the pit itself has an excellent infiltration rate and is performing well. The seepage bed, although it could be improved, meets the expectations of the design. The seepage pit was treated as an infiltration SCM. First the flow paths were analyzed; water travels into the seepage pit from inflow pipes directing water from the roof and from sheet flow over the upstream hill which directs water from an impervious patio area. The transportation of the water into the SCM worked properly,
90 5-41 but some excess ponding built up near the inflow pipes. This indicated that the water was not being distributed evenly over the entire surface area of the pit. Aside from this ponding during storm events, no water was left after 48 hours. Additionally, an infiltration test was attempted on site and could not be measured due to the exceedingly fast rate. Therefore, the rate seems to be acceptable, creating a large storage space within the gravel particles for stormwater storage. Also, there was no significant sedimentation in the area and no clogged areas from leaves or plants.
91 CHAPTER 6 CONCLUSIONS The evaluations for each Stormwater Control Measure have been presented, and from these evaluations, conclusions have been made on the performance for each site. Each site has been placed into one of three categories: exceeds expectations, meets expectations and needs improvements. The exceeding expectations category indicates that the SCM is not only working according to the design, but is working at the maximum performance level. The meeting expectations category indicates that the SCM may need minimal improvements, but is still performing as designed and is meeting its stormwater remediation goals. The last category, needing improvement, describes SCMs that are not meeting the goals of the design, and need either maintenance or reconstruction. Table 6.1 : Comprehensive Evaluation for Each Stormwater Control Measure Site Name Metroplex Shopping Center Naturalized Basin Morris Arboretum Pervious Pavement Natural Lands Trust Constructed Wetlands PA DEP Green Roof Springside School Rain Garden Wayne Art Center Rain Garden #1 Wayne Art Center Rain Garden #2 Wayne Art Center Rain Garden #3 Wayne Art Center Seepage Pit Overall Evaluation/Recommendation Meets expectations Needs improvements Exceeds expectations Needs Improvements Meets expectations Meets expectations Exceeds expectations Needs improvements Meets Expectations 6-1
92 6-2 Out of the nine sites evaluated, three needed improvements. Additionally, these failures were attributed to a lack of maintenance and/or poor design. Maintenance for the pervious pavement should include vacuuming as needed, typically three to four times per year, maintenance on the green roof could include seasonal watering and a reconstruction of the third rain garden at the Wayne Art Center could allow for the collection and treatment of additional stormwater. Although these three SCMs were in need of improvement, the majority of the SCMs evaluated were collecting and treating the stormwater as designed, and still prove to be good ways of remediating stormwater.
93 CHAPTER 7 RECOMMENDATIONS This study created and implemented an integrated monitoring plan used to evaluate the performance of Stormwater Control Measures. The goals were to create a plan that was easy-to-use and cost effective so that more SCMs would be evaluated to determine if improvements were necessary. As many SCMs are being implemented to decrease the urban stormwater effects on downstream areas. Although they are being implemented, little has been done to evaluate them. This monitoring plan indicated problem areas for these SCMs and creates an understanding of the overall performance. This plan should be applied to a much larger scale to determine the overall effectiveness of these SCMs over time. In addition to understanding the performance of these systems on a large scale, this monitoring plan should be implemented for each SCM following construction, and each year after. By understanding the performance of these SCMs over time, problem areas can be addressed quickly and small alterations can be made to greatly improve the performance. 7-1
94 CHAPTER 8 REFERENCES Asleson, Brooke C., Nestingen, Rebecca S., Gulliver, John S., Hozalski, Raymond M. and Nieber, John L. (2009). Performance Assessment of Rain Gardens. Journal of the American Water Resources Association. 45(4) Braga, A., Horst, M., and Traver, R. (2007). Temperature Effects of the Infiltration Rate through an Infiltration Basin BMP. Journal of Irrigation and Drainage Engineering., 133(6), Carter, T. and Rasmussen, T. (2006). Hydrologic Behavior of Vegetated Roofs. Journal of the American Water Resources Association. 42(5) pp Davis, A.P. (2008). Field Performance of Bioretention Hydrology Impacts. J. Hydrol. Eng., 13(2), Davis, A.P., Hunt, W.F., Traver, R.G. and Clar, M. (2009). Bioretention Technology: Overview of Current Practice and Future Needs. J. Env. Eng., 135(3),
95 8-2 Delatte, N., Miller, D., and Mrkajic, A. Portland Cement Pervious Concrete Pavement: Field Performance Investigation on Parking Lot and Roadway Pavements. Cleveland, Ohio: Cleveland State University, DeNardo, J. C., Jarrett, A. R., Manbeck, H.B., Beattie, D. J. and Berghage, R. D. (2003). Stormwater Detention and Retention Abilities of Green Roofs. World Water and Environmental Congress. Pennsylvania Department of Environmental Protection. (2006). Pennsylvania Stormwater Best Management Practices Manual., PA DEP Emerson, C., and Traver, R. (2008). Multiyear and Seasonal Variation of Infiltration from Storm-Water Best Management Practices. Journal of Irrigation and Drainage Engineering., 143 (5), Gulliver, J.S. and Anderson, J.L. (2008). Assessment of Stormwater Best Management Practices. University of Minnesota, St. Paul, Minnesota. < (January 15, 2011). Hankins, K., Welker, A. and Mandarano, L. (2008) An Integrated Monitoring Plan for Bioinfiltration BMP s, The Proceedings of GeoCongress 2008, March 9-12, New Orleans, LA.
96 8-3 Hillel, D. (1998). Environmental soil physics. Academic, San Diego. Jeffers, Pattrick. Water Quantity Comparison of Pervious Concrete and Porous Asphalt Products for Infiltration Best Management Practices. Masters Thesis, Villanova, Pennsylvania, Villanova University, Link: Jenkins, J.K.G., Wadzuk, B. and Welker, A. (2010). Fines Accumulation and Distribution in a Storm-Water Rain Garden Nine Years Postconstruction. Journal of Irrigation and Drainage Engineering., 136(12), Jury, W. A. and Horton, R. (2004). Soil physics. Wiley, Hoboken, NJ. Lui, C. and Evett, J Soil Properties: Testing, Measurement and Evaluation. Pearson Education, Inc. Upper Saddle River, New Jersey. O Connor, Thomas. (2009). Green Roofs for Stormwater Runoff Control, EPA/600/R- 09/026., Edison, New Jersey. Pennsylvania Association of Conservation Districts (PACD), in association with others. (1998). Pennsylvania Handbook of Best Management Practices for
97 8-4 Developing Areas. Pennsylvania Association of Conservation Districts, Harrisburg, PA. Reynolds, W.D. and Elrick, D.E Ponded infiltration from a single ring. I. Analysis of steady flow. Soil Sci. Soc. Am. J. 54(5) (2009). Temple-Villanova Sustainable Stormwater Initiative. Center for Sustainable Communities, < (August 2010). Tennis, P.D., Leming, M.L., and Akers, D.J. Pervious Concrete Pavements, EB302, Portland Cement Association, Skokie, Illinois 2004, 36 pages. US Environmental Protection Agency (2010). Heat Island Effect: Green Roofs. Environmental Protection Agency, < > (February 1, 2011). US Environmental Protection Agency (2005). National Management Measures to Control Nonpoint Source Pollution from Urban Areas. Doc. No. 841-B , Washington, D.C.
98 8-5 US Environmental Protection Agency (2006). National Pollutant Discharge Elimination System: Bioretention (Rain Gardens). Environmental Protection Agency, < (February 1, 2011). US Environmental Protection Agency (2009). National Pollutant Discharge Elimination System: Pervious Concrete Pavement. Environmental Protection Agency, < (February 1, 2011). US Environmental Protection Agency. (1999) Stormwater Technology Fact Sheet: Porous Pavement, EPA 832-F , US Environmental Protection Agency, Office of Water, Washington, D.C., VanWoert, N.D., Rowe, D., Andresen, J., Rugh, C., Fernandez, R. and Xiao, L. (2005). Green roof stormwater retention: effects of roof surface, slope, and media depth. Journal of Environmental Quality. 34, Wu, L. and Pan, L. (1997). A Generalized Solution to Infiltration from Single Ring Infiltrometers by Scaling. Soil Science of America Journal 61: Wu, L., Pan, L., Roberson, M.J. and Shouse, P.J. (1997). Numerical Evaluation of Ring Infiltrometers Under Various Soil Conditions. Soil Science 162(11)
99 8-6 Ziger and Snead (2007). Chicago s Pervious Pavement Alleys. < (February, 2011).
100 CHAPTER 9 APPENDICES A-1. Plant Inventories A-1.1. Springside School 9-1
101 9-2
102 A-1.2. Wayne Art Center Rain Garden #1 9-3

103 A-1.3. Wayne Art Center Rain Garden #2 9-4
104 A-1.4. Wayne Art Center Rain Garden #3 9-5


105 A-1.5. PA DEP 9-6

106 9-7
107 9-8

108 9-9

109 9-10
110 9-11
111 9-12
112 9-13 A-2. Grain Size Analyses A-2.1. Metroplex Shopping Center
113 A-2.2. Natural Lands Trust 9-14
114 9-15
115 9-16
116 A-2.3. Springside School 9-17

117 9-18
118 9-19
119 A-2.4. Wayne Art Center 9-20
120 9-21
121 9-22 A-2. Infiltration Tests A-2.1. Morris Arboretum A-2.2. Springside School

122 9-23
123 A-2.3. Wayne Art Center Rain Garden #2 9-24

124 9-25
125 9-26
126 A-2.4. Wayne Art Center Rain Garden #3 9-27
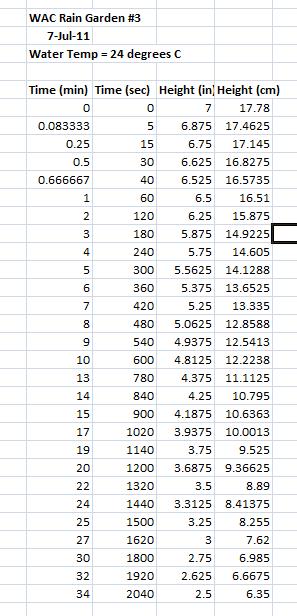
127 9-28
The Application of an Integrated Monitoring Plan on Stormwater Control Measures
 The Application of an Integrated Monitoring Plan on Stormwater Control Measures Kathryn Greising Dr. Andrea Welker 12/31/2011 http://www3.villanova.edu/vusp/ 1 Outline Introduction and Background Site
Monitoring Flow and Quality for Stormwater Control Measures
 Monitoring Flow and Quality for Stormwater Control Measures Robert Traver, Ph.D., PE, D.WRE. Andrea L. Welker, PhD, PE Bridget Wadzuk, PhD, John Komlos, PhD The mission of the Villanova Urban Stormwater
DEALING WITH STORM WATER MANAGEMENT
 December 2012 DEALING WITH STORM WATER MANAGEMENT This fact sheet provides information on the guiding principles of storm water management practices, explains the difference between structural and non-structural
Post Construction BMPs
 Post Construction BMPs Why are Post Construction BMPs important? With increased development brings the increase of impervious cover Parking lots, rooftops, driveways Storm water runoff volume increases
Attachment 2: Permeable Pavement Design Guidelines
 Attachment 2: Permeable Pavement Design Guidelines Design of permeable pavement systems is critical if they are to function properly and efficiently. The area and shape are dependent on the site design,
Planning, Design, and Construction of Green Infrastructure.
 Planning, Design, and Construction of Green Infrastructure www.water.rutgers.edu What is Green Infrastructure? an approach to stormwater management that is costeffective, sustainable, and environmentally
SIMPLIFIED APPROACH TO STORMWATER MANAGEMENT FOR SMALL PROJECTS
 SIMPLIFIED APPROACH TO STORMWATER MANAGEMENT FOR SMALL PROJECTS Introduction As required by federal and state law, the Borough of Swarthmore has adopted regulations that affect stormwater runoff and surface
LOUISIANA STATE UNIVERSITY COMPREHENSIVE & STRATEGIC CAMPUS MASTER PLAN. APPENDIX G - Stormwater Study Findings & Stormwater Solutions
 LOUISIANA STATE UNIVERSITY COMPREHENSIVE & STRATEGIC CAMPUS MASTER PLAN APPENDIX G - Stormwater Study Findings & Stormwater Solutions LSU: MP Narrative July 2017 3.5 Open Space Existing Conditions The
Lesson 2: Stormwater Best Management Practices (BMPs)
") Lesson 2: Stormwater Best Management Practices (BMPs) Environmental Stewards Class Christopher C. Obropta, Ph.D., P.E. Extension Specialist in Water Resources 732-932-9800 ext. 6209 obropta@envsci.rutgers.edu
Lesson 2: Stormwater Best Management Practices (BMPs) Environmental Stewards Class Christopher C. Obropta, Ph.D., P.E. Extension Specialist in Water Resources 732-932-9800 ext. 6209 obropta@envsci.rutgers.edu
Evaluating Low Impact Development Practices for Stormwater Management on an Industrial Site in Mississippi
 Evaluating Low Impact Development Practices for Stormwater Management on an Industrial Site in Mississippi Dennis S. Painter, Tennessee Valley Authority, Nashville, Tennessee Donald Becker, Tennessee Valley
Use of Best Management Practices
 Use of Best Management Practices Presented at the ANJEC Flood Hazard Workshop Bordentown, NJ March 13, 2008 Stormwater BMPs "a technique, measure or structural control that is used for a given set of conditions
Bioretention cell schematic key
 Bioretention Cells Bioretention cell schematic key 1 3 Hardwood mulch 2 Curb cut 3 18-30 Modified soil 4 Stone aggregate choker layer 5 Stone aggregate base layer 6 Subdrain 7 Undisturbed soil 8 Overflow/Cleanout
Appendix D - Technical Design Criteria for BMPs
 Appendix D - Technical Design Criteria for BMPs City of Wayzata Page 3 On-site infiltration features Definitions and Scope: Infiltration facilities are constructed basins or depressions located in permeable
Homeowners Guide to Stormwater BMP Maintenance
 Homeowners Guide to Stormwater BMP Maintenance What You Need to Know to Take Care of Your Property Rain Barrel Dry Well Rain Garden Pervious Asphalt Porous Pavers City of El Monte Stormwater BMP Management
Structural Stormwater Best Management Practices
 Structural Stormwater Best Management Practices for Small Commercial and Residential Applications Timothy Bruno Watershed Manager PA Department of Environmental Protection What are STRUCTURAL BMPs? Physical
Stormwater Management Techniques WMPF LAND USE TRAINING INSTITUTE MARCH 14, 2018
 Stormwater Management Techniques WMPF LAND USE TRAINING INSTITUTE MARCH 14, 2018 Potential Impacts of New Development Urban development can significantly increase stormwater runoff Water quality considerations
SMALL PROJECTS SIMPLIFIED APPROACH
 SMALL PROJECT APPLICATION AND STORMWATER MANAGEMENT DESIGN ASSISTANCE MANUAL FOR SMALL PROJECTS IN FULTON TOWNSHIP LANCASTER COUNTY, PENNSYLVANIA SMALL PROJECTS SIMPLIFIED APPROACH Prepared By: Light-Heigel
J. Paul Guyer, P.E., R.A.
 J. Paul Guyer, P.E., R.A. Paul Guyer is a registered civil engineer, mechanical engineer, fire protection engineer, and architect with over 35 years experience in the design of buildings and related infrastructure.
Appendices: Glossary. General Terms. Specific Terms. Low Impact Development Approaches Handbook
 67 67 General Terms Specific Terms 66 Low Impact Development Approaches Handbook The vocabulary of low impact development is evolving, and many terms are used interchangeably and to describe the same or
Green Infrastructure Overview
 Green Infrastructure Overview Christopher C. Obropta, Ph.D., P.E. obropta@envsci.rutgers.edu Jeremiah Bergstrom, LLA, ASLA jbergstrom@envsci.rutgers.edu February 26, 2016 Water Resources Program NJDEP
Urban Stormwater Retrofit Program Highlights
 Urban Stormwater Retrofit Program Highlights Delaware Estuary Environmental Summit 2007 Prepared and Presented by: Liz Feinberg Project Funding: William Penn Foundation PA Coastal Zone Management Program
Details for each SCM can be viewed through the following link:
 Mission - To advance the evolving field of sustainable stormwater management and to foster the development of public and private partnerships through research Since the early 1990 s the field of stormwater
RESIDENTIAL STORM WATER PERMIT & CREDIT APPLICATION WORKSHEET AND CHECKLIST
 Engineering Department - Phone: (651) 792-7004 Fax: (651) 792-7040 2660 Civic Center Dr. Roseville, MN 55113 RESIDENTIAL STORM WATER PERMIT & CREDIT APPLICATION WORKSHEET AND CHECKLIST This application
Three Rivers Park District Administration Center Rain Garden
 Three Rivers Park District Administration Center Rain Garden Introduction There are significant changes to the hydrologic regime and nutrient loading following urban and industrial development. The post-development
4.6. Low Impact and Retentive Grading
 4.6. Low Impact and Retentive Grading Low Impact Grading techniques focus on utilizing existing topography during Site layout to minimize cost. Proposing structures, roads, and other impervious surfaces
Slow it, Spread it, Sink it using Green Stormwater Infrastructure
 Milly Archer Water Resources Coordinator Becky Tharp Green Infrastructure Collaborative Slow it, Spread it, Sink it using Green Stormwater Infrastructure Overview Defining LID and GSI Hydrology and impacts
APPENDIX A SIMPLIFIED APPROACH TO STORMWATER MANAGEMENT FOR SMALL PROJECTS. In West Sadsbury Township, Chester County, Pennsylvania
 APPENDIX A SIMPLIFIED APPROACH TO STORMWATER MANAGEMENT FOR SMALL PROJECTS In West Sadsbury Township, Chester County, Pennsylvania TABLE OF CONTENTS I. Introduction 3 II. Importance of Stormwater Management
5. LOW IMPACT DEVELOPMENT DESIGN STANDARDS
 5. LOW IMPACT DEVELOPMENT DESIGN STANDARDS Low Impact Development (LID) requires a shift in stormwater management away from conveying runoff to a small number of downstream points through hydraulically
Impervious Cover Reduction Action Plan for City of Vineland, Cumberland County, New Jersey
 Impervious Cover Reduction Action Plan for City of Vineland, Cumberland County, New Jersey Prepared for the City of Vineland by the Rutgers Cooperative Extension Water Resources Program May 23, 2016 Table
Zoning Regulation Amendments Adopted December 19, 2018 effective date January 7, 2019
 Zoning Regulation Amendments Adopted December 19, 2018 effective date January 7, 2019 Article 2 General Provisions Section 2.2 Definitions Definitions- FIRE LANE The aisle immediately adjacent to a building
Sustainable Stormwater Management through Green Infrastructure. Jersey City Public School #5
 Green Infrastructure Site Evaluation Friday, October 25 th, 2013 Sustainable Stormwater Management through Green Infrastructure Jersey City Public School #5 FORMAT: (15 minutes) An Introduction to Stormwater
Draft Impervious Cover Reduction Action Plan for West New York, Hudson County, New Jersey
 Draft Impervious Cover Reduction Action Plan for West New York, Hudson County, New Jersey Prepared for the Town of West New York by the Rutgers Cooperative Extension Water Resources Program March 29, 2017
4.5 City of Indianapolis Stormwater Green Infrastructure Guidance: Bioretention (rain gardens) Bioretention Fact Sheet Bioretention Technical Design
 Bioretention Fact Sheet Bioretention Technical Design") 4.5 City of Indianapolis Stormwater Green Infrastructure Guidance: Bioretention (rain gardens) Bioretention Fact Sheet Bioretention Technical Design Specification Bioretention O & M Manual Draft Green
4.5 City of Indianapolis Stormwater Green Infrastructure Guidance: Bioretention (rain gardens) Bioretention Fact Sheet Bioretention Technical Design Specification Bioretention O & M Manual Draft Green
Draft Rhode Island Stormwater Design and Installation Standards Manual
 Draft Rhode Island Stormwater Design and Installation Standards Manual Summary The May 2009 Public Review Draft version of the RI Stormwater Design and Installation Standards Manual consists of approximately
Keele Campus Storm Drainage. Presented by Mark Hagesteijn September 24, 2013
 Keele Campus Storm Drainage Presented by Mark Hagesteijn September 24, 2013 1 Presentation Overview Urbanization Impact on the Hydrologic Cycle Why Do We Manage Stormwater? Typical Stormwater Management
MANUAL OF DESIGN, INSTALLATION, AND MAINTENANCE REQUIREMENTS FOR STORMWATER MANAGEMENT PLANS
 MANUAL OF DESIGN, INSTALLATION, AND MAINTENANCE REQUIREMENTS FOR STORMWATER MANAGEMENT PLANS May 2007 SECTION 1 Responsibility of Applicant TABLE OF CONTENTS A. Stormwater Management Plan Required Information
Case Study: Dallas Green Infrastructure for Stormwater
 Case Study: Dallas Green Infrastructure for Stormwater Extension and Research Sandhya Mohan Fouad H. Jaber, PhD Biological and Agricultural Engineering Texas Agrilife, Texas A&M University System Urban
Going Green with the NYS Stormwater Design Standards
 Going Green with the NYS Stormwater Design Standards Shohreh Karimipour, P.E. NYSDEC History of Stormwater Management Ancient Greek Cisterns Water Cistern Systems in Greece from Minoan to Hellenistic Period,
2.1.4 Roof Downspout Rain Gardens
 2008 SWMM, 2010 Revision City of Tacoma 2.1.4 Roof Downspout Rain Gardens Purpose and Definition Bioretention areas are shallow stormwater retention facilities designed to mimic forested systems by controlling
Innovative Stormwater Management in Urban Environments
 Innovative Stormwater Management in Urban Environments Cahill Associates Environmental Consultants www.thcahill.com Urban SW Issues No Stormwater Management Combined Sewers Buried Streams and Dead Streams
Why and How to Evaluate the Feasibility of Infiltrating or Harvesting and Using Stormwater. Laura Prickett, EOA, Inc.
 Why and How to Evaluate the Feasibility of Infiltrating or Harvesting and Using Stormwater Laura Prickett, EOA, Inc. November 17, 2011 Outline of Presentation Why prioritize infiltration and harvest/use
Impervious Cover Assessment for Salem City, Salem County, New Jersey
 Impervious Cover Assessment for Salem City, Salem County, New Jersey Prepared for Salem City by the Rutgers Cooperative Extension Water Resources Program August 10, 2016 Introduction Pervious and impervious
Draft Impervious Cover Reduction Action Plan for West Long Branch Borough, Monmouth County, New Jersey
 Draft Impervious Cover Reduction Action Plan for West Long Branch Borough, Monmouth County, New Jersey Prepared for West Long Branch Borough by the Rutgers Cooperative Extension Water Resources Program
County of Prince Edward. Stormwater Management Plan. Agreement in lieu of a Stormwater Management Plan
 County of Prince Edward Stormwater Management Program Date: E-Permitting Number: This stormwater management plan (Agreement) is hereby submitted by the Owner to specify the methods that will be implemented
Impervious Cover Reduction Action Plan for Hampton Township, Sussex County, New Jersey
 Impervious Cover Reduction Action Plan for Hampton Township, Sussex County, New Jersey Prepared for Hampton Township by the Rutgers Cooperative Extension Water Resources Program November 8, 2016 Table
Low Impact Development. Charlene LeBleu Auburn University Landscape Architecture (334)
") Low Impact Development Charlene LeBleu Auburn University Landscape Architecture leblecm@auburn.edu (334) 844-0192 What is Low Impact Development? Infiltrate Filter Store Evaporate Detain An innovative
Low Impact Development Charlene LeBleu Auburn University Landscape Architecture leblecm@auburn.edu (334) 844-0192 What is Low Impact Development? Infiltrate Filter Store Evaporate Detain An innovative
INTRODUCTION TO GREEN INFRASTRUCTURE HOW WE CAN PROTECT OUR COMMUNITIES AND OUR WATERS Maywood Public Library Bergen County, New Jersey
 INTRODUCTION TO GREEN INFRASTRUCTURE HOW WE CAN PROTECT OUR COMMUNITIES AND OUR WATERS Maywood Public Library Bergen County, New Jersey Jeremiah D. Bergstrom, LLA, ASLA Rutgers Cooperative Extension Water
Impervious Cover Assessment and Reduction Action Plan for Woodstown, New Jersey
 Impervious Cover Assessment and Reduction Action Plan for Woodstown, New Jersey Christopher C. Obropta, Ph.D., P.E. obropta@envsci.rutgers.edu www.water.rutgers.edu March 24, 2015 Rutgers Cooperative Extension
Green Infrastructure Recommendations For Parks and Public Spaces
 Green Infrastructure Recommendations For Parks and Public Spaces Issued by the Jersey Water Works Green Infrastructure Committee And Prepared by Meliora Design This document recommends ways to integrate
HEALTH SCIENCES BUILDING REDEVELOPMENT PROJECT
 INTRODUCTION In recent years, the University of Cincinnati (University) has demonstrated a commitment to identifying and implementing sustainable goals and objectives throughout University s Uptown Campuses.
Green Infrastructure and Low-Impact Development Technologies
 Green Infrastructure and Low-Impact Development Technologies The guiding principles of these technologies is to manage stormwater at their sources using natural means, and establish conditions so that
RAIN GARDEN ILLINOIS URBAN MANUAL PRACTICE STANDARD. (feet) CODE 897 DEFINITION
 CODE 897 DEFINITION") ILLINOIS URBAN MANUAL PRACTICE STANDARD RAIN GARDEN (feet) CODE 897 Source: Kendall County Soil and Water Conservation District DEFINITION Rain gardens are small, shallow, flat bottomed depressions constructed
ILLINOIS URBAN MANUAL PRACTICE STANDARD RAIN GARDEN (feet) CODE 897 Source: Kendall County Soil and Water Conservation District DEFINITION Rain gardens are small, shallow, flat bottomed depressions constructed
Selecting Appropriate Stormwater Control Measures for Your Development Project
 Phase II Post-Construction Stormwater Requirements Workshop - February 10, 2014 Selecting Appropriate Stormwater Control Measures for Your Development Project Jill Bicknell, P.E., EOA, Inc. Outline of
Stormwater Prevention and Control
 Stormwater Prevention and Control Principles of Stormwater Management Stormwater Fact Sheet No. 4 This fact sheet is No. 4 of a eight-part series focused on stormwater runoff problems and control strategies.
Raingardens. Conserving and Protecting Water L
 L-5482 08-08 Raingardens Justin Mechell, Extension Assistant, and Bruce Lesikar, Extension Program Leader for Biological and Agricultural Engineering,The Texas A&M University System A raingarden is an
Rainwater Management an issue for the 21 st Century. Hydrological Cycle
 Canadian Society of Landscape Architects CONGRESS 2014 Rainwater Management an issue for the 21 st Century Don Crockett, BCSLA, CSLA Principal, Golder Associates Ltd. May 2014 Hydrological Cycle PRE- URBAN
Draft Impervious Cover Assessment for Fair Haven Borough, Monmouth County, New Jersey
 Draft Impervious Cover Assessment for Fair Haven Borough, Monmouth County, New Jersey Prepared for Fair Haven Borough by the Rutgers Cooperative Extension Water Resources Program March 15, 2016 Introduction
Bioswales: A Guide to Low-Impact Development Design and Maintenance. Introduction and Compilation by: Leslie D. Bartsch And Jennifer S.
 Bioswales: A Guide to Low-Impact Development Design and Maintenance Introduction and Compilation by: Leslie D. Bartsch And Jennifer S. Raible Biological Engineering University of Arkansas Fayetteville,
Introduction to Low Impact Development. Fred Milch. East Central Florida Regional Planning Council
 Introduction to Low Impact Development Fred Milch East Central Florida Regional Planning Council Low Impact Development (LID) Low impact development (LID) is a term used to describe a land planning and
Key elements : Filter Strips must be designed within parameters required by the Fort Wayne s Development Standards/Criteria Manual.
 4.4. Filter Strips Filter Strips are densely vegetated lands that treat sheet flow storm water from adjacent pervious and impervious areas. They function by slowing runoff, trapping sediment and pollutants,
Green City, Clean Waters
 Green City, Clean Waters Green Infrastructure Maintenance Manual Consent Order & Agreement Deliverable VIII City of Philadelphia Combined Sewer Overflow Long Term Control Plan Update Submitted to The Commonwealth
Draft. Impervious Cover Reduction Action Plan for Fair Haven, Monmouth County, New Jersey
 Draft Impervious Cover Reduction Action Plan for Fair Haven, Monmouth County, New Jersey Prepared for Fair Haven by the Rutgers Cooperative Extension Water Resources Program June 10, 2016 Table of Contents
STORMWATER REPORT FOR WALMART SUPERCENTER STORE # SIOUX FALLS, LINCOLN COUNTY, SOUTH DAKOTA BFA PROJECT NO
 STORMWATER REPORT FOR WALMART SUPERCENTER STORE # 2443-00 SIOUX FALLS, LINCOLN COUNTY, SOUTH DAKOTA BFA PROJECT NO. 3286 March 1, 2012 I hereby certify that this engineering document was prepared by me
4. CONCEPT PLAN DEVELOPMENT
 4. CONCEPT PLAN DEVELOPMENT Concept Plan Step 1: Identify Site Constraints and Opportunities Review the existing site to identify constraints and opportunities for GI Practices to meet the RRv. Constraints
Urban Rain Gardens: Capturing our local water. Martha Berthelsen The Watershed Project
 Urban Rain Gardens: Capturing our local water Martha Berthelsen The Watershed Project www.thewatershedproject.org The Watershed Project s mission is to inspire Bay Area communities to understand, appreciate,
Subsurface Infiltration Bed
 Subsurface Infiltration Bed The Subsurface Infiltration Bed BMP consists of a storage bed underlying either a vegetated or hardscaped surface for the purpose of temporary storage and infiltration of stormwater
West Norriton Township
 West Norriton Township Earth Disturbance and Drainage Permit Application 1630 W. Marshall Street Norristown, PA 19403 Phone: (610) 631-0450 Fax: (610) 630-0304 www.westnorritontwp.org A stormwater permit
Green Infrastructure on Brownfields
 Green Infrastructure on Brownfields Tysen O. Miller, PE, LEED AP, CPESC KU Resources, Inc. tmiller@kuresources.com Jim Pillsbury, MS, PE Westmoreland Conservation District jim@wcdpa.org October 3, 2018
C.3 STORMWATER TECHNICAL GUIDANCE. Table of Contents. Glossary... viii. Chapter 1 Introduction/How to Use this Handbook
 C.3 STORMWATER TECHNICAL GUIDANCE Table of Contents Glossary... viii Chapter 1 Introduction/How to Use this Handbook... 1-1 1.1 Purpose of this Handbook... 1-1 1.2 What is the Countywide Program?... 1-2
Donald Carpenter, Ph.D. Laura Hallam Lawrence Technological University June 23, 2008 MWEA Annual Conference Watershed Session
 Investigation of Rain Garden Planting Mixtures Donald Carpenter, Ph.D. Laura Hallam Lawrence Technological University June 23, 2008 MWEA Annual Conference Watershed Session What is a Rain Garden? What
Low Impact Development and Bioretention: Lessons Learned in North Carolina
 Low Impact Development and Bioretention: Lessons Learned in North Carolina Jon Hathaway, PE Bill Hunt, PE, PhD www.bae.ncsu.edu/stormwater Pamlico Sound www.switchstudio.com NC Stormwater Applied Research
West Virginia Stormwater Management Manual: Methods.
 West Virginia Stormwater Management Manual: Methods Created to deliver targeted training on new tools and practices to improve the quality of stormwater runoff. www.cbstp.org www.chesapeakestormwater.net
DRAFT DESIGN CRITERIA STORMWATER TREATMENT STANDARDS CITY OF OVERLAND PARK
 DRAFT DESIGN CRITERIA STORMWATER TREATMENT STANDARDS CITY OF OVERLAND PARK A. Authority As set forth in the Overland Park Municipal Code (OPMC), Chapter 16.210, the Director of Planning and Development
RAIN GARDENS. Task: PART 1 (60 minutes) Student Directions: Steps you will be following: Directions for beginning: Source Information:
 Student Directions: Steps you will be following: Directions for beginning: Source Information:") PART 1 (60 minutes) Student Directions: Your assignment: Steps you will be following: Your neighborhood council is researching the benefits of installing rain gardens in your community. You will read two
PART 1 (60 minutes) Student Directions: Your assignment: Steps you will be following: Your neighborhood council is researching the benefits of installing rain gardens in your community. You will read two
Bioretention and Permeable Pavement Maintenance
 Bioretention and Permeable Pavement Maintenance Fouad H. Jaber, PhD, PE Associate Professor and Extension Specialist Biological and Agricultural Engineering Texas A&M AgriLife Extension Dallas Research
Rain Gardens. A Welcome Addition to Your Landscape
 Rain Gardens A Welcome Addition to Your Landscape Where Does The Rainwater Go? Naturally, forests provide a way for rainwater to percolate into the soil, filtering pollutants while trees are allowed to
Concreteville, CT. March 10, 2004
 Concreteville, CT March 10, 2004 Reducing Runoff is the most topically direct follow up to Linking Land Use to Water Quality (Basic NEMO). There is a good deal of overlap, but the major differences is
Chapter 4 - Preparation of Stormwater Site Plans
 Chapter 4 - Preparation of Stormwater Site Plans The Stormwater Site Plan is the comprehensive report containing all of the technical information and analysis necessary for the City to evaluate a proposed
GVSU Sustainable Storm Water Initiative
 GVSU Sustainable Storm Water Initiative MWEA Watershed Seminar Bath, MI December 5, 2013 Dr. Peter J. Wampler Talk Road Map Brief Geomorphic History of the Grand River and Grand River Ravines Historic
Draft. Impervious Cover Reduction Action Plan for Dunellen Borough, Middlesex County, New Jersey
 Draft Impervious Cover Reduction Action Plan for Dunellen Borough, Middlesex County, New Jersey Prepared for Dunellen Borough by the Rutgers Cooperative Extension Water Resources Program September 22,
COMMUNITY DEVELOPMENT DEPARTMENT POLICY DRAINAGE FOR RESIDENTIAL PROJECTS WITH ONE OR TWO UNITS REVISED JANUARY 4, 2018
 COMMUNITY DEVELOPMENT DEPARTMENT POLICY DRAINAGE FOR RESIDENTIAL PROJECTS WITH ONE OR TWO UNITS REVISED JANUARY 4, 2018 A. California Residential Code Requirement - Construction plans shall indicate how
Final Impervious Cover Assessment for Upper Deerfield Township, Cumberland County, New Jersey
 Final Impervious Cover Assessment for Upper Deerfield Township, Cumberland County, New Jersey Prepared for Upper Deerfield Township by the Rutgers Cooperative Extension Water Resources Program September
What is stormwater runoff? Why is it a problem? Available Financial Incentives for Stormwater BMP s Downspout Disconnection - up to $20
 What is stormwater runoff? Stormwater is any form of natural precipitation (including ice and snow melt) that flows across undeveloped or developed land. In a natural setting, a majority of the water seeps
Kittson Parkway / Watershed Park Parking Lot
 Kittson Parkway / Watershed Park Parking Lot Date Constructed: Summer 2005 Site Location / Description: Kittson Parkway, North Delta, British Columbia. Permeable parking lot adjacent to Watershed Park;
Small Project Guidance Document
 Small Project Guidance Document Introduction If you are considering a relatively small construction project on your property that creates new impervious area and you need to manage the stormwater that
APPENDIX A. Proposed Guidance and LID checklists for UConn and Town of Mansfield
 APPENDIX A. Proposed Guidance and LID checklists for UConn and Town of Mansfield 22 Guidance Document for Low Impact Development Best Management Practices for UConn June, 2011 In 2007, the Connecticut
Draft Impervious Cover Reduction Action Plan for Newark, Essex County, New Jersey Volume 2
 Draft Impervious Cover Reduction Action Plan for Newark, Essex County, New Jersey Volume 2 Prepared for the City of Newark by the Rutgers Cooperative Extension Water Resources Program April 16, 2018 Table
Storm Water Managament at the University of Michigan
 Storm Water Managament at the University of Michigan Standard Operating Procedure Date: 06/23/17 Revision #: 03 The green roof installed on top of the Mott Children s & Von Voigtlander Women s Hospital.
BE WATER WISE. Managing Your Onlot Stormwater. Sept. 23, 2006 Watershed Weekend
 BE WATER WISE Managing Your Onlot Stormwater Sept. 23, 2006 Watershed Weekend 2006 1 All water resources are interrelated through the Hydrologic Cycle Sept. 23, 2006 Watershed Weekend 2006 2 What is Storm
What Are We Inspecting? Stormwater Treatment Measure Type and Design
 What Are We Inspecting? Stormwater Treatment Measure Type and Design Jill Bicknell, P.E., EOA, Inc. Santa Clara Valley Urban Runoff Pollution Prevention Program December 16, 2013 Outline of Presentation
Draft Impervious Cover Assessment for North Plainfield Borough, Somerset County, New Jersey
 Draft Impervious Cover Assessment for North Plainfield Borough, Somerset County, New Jersey Prepared for North Plainfield Borough by the Rutgers Cooperative Extension Water Resources Program February 4,
3. Are there any projects exempt from the definition of Regulated Projects?
 STORMWATER REQUIREMENTS: OVERVIEW OF PROVISION C.3 Background: On October 14, 2009, the Regional Water Quality Control Board, San Francisco Bay Region, issued a municipal regional stormwater permit (MRP)
Managing Stormwater Runoff with Green Infrastructure "Enhancing Community Resiliency to the Changing Climate"
 Managing Stormwater Runoff with Green Infrastructure "Enhancing Community Resiliency to the Changing Climate" Presented at Stormwater Management on the Whale Pond Brook Watershed Meeting Christopher C.
Introduction Post Construction Stormwater Management Performance Requirements
 Introduction Post Construction Stormwater Management Performance Requirements The primary objective of these Post Construction Stormwater Management Performance Requirements is to minimize the downstream
General Technical Guidance for Treatment Measures
 Chapter 5 General Technical Guidance for Treatment Measures This Chapter contains guidance on: Hydraulic sizing criteria, Applicability of non-landscape based treatment measures, Using Manufactured Treatment
Community LID Workgroup Issue Paper #6
 Community LID Workgroup Issue Paper #6 Topic: Hard and Impervious Surface Coverage Limits Objective: Minimize the amount of hard and impervious surfaces in developments to allow more stormwater to infiltrate
Chapter 14. Stormwater Quality Introduction
 14.0 Introduction This chapter addresses requirements and design criteria related to post-construction stormwater best management practices (requirements for construction erosion and sediment control are
2008 SWMM, 2010 Revision City of Tacoma
 2008 SWMM, 2010 Revision City of Tacoma 2.2.3.1 BMP L630 Rain Gardens Purpose and Definition Bioretention areas are shallow stormwater retention facilities designed to mimic forested systems by controlling
Homeowners Guide to Stormwater BMP Maintenance
 Homeowners Guide to Stormwater BMP Maintenance What You Need to Know to Take Care of Your Property Rain Barrel Dry Well Rain Garden Pervious Pavers Pervious Asphalt About Stormwater Management SW Regulations
Inspection and Maintenance of Stormwater Best Management Practices
 FAC T S H E E T Inspection and Maintenance of Stormwater Best Management Practices is a general term that refers to vegetated stormwater best management practices (BMPs) that temporarily store rainwater