WorkstationST* Alarm Viewer
|
|
|
- Asher Bishop
- 5 years ago
- Views:
Transcription
1 GEI U WorkstationST* Alarm Viewer Instruction Guide These instructions do not purport to cover all details or variations in equipment, nor to provide for every possible contingency to be met during installation, operation, and maintenance. The information is supplied for informational purposes only, and GE makes no warranty as to the accuracy of the information included herein. Changes, modifications, and/or improvements to equipment and specifications are made periodically and these changes may or may not be reflected herein. It is understood that GE may make changes, modifications, or improvements to the equipment referenced herein or to the document itself at any time. This document is intended for trained personnel familiar with the GE products referenced herein. Public This document is approved for public disclosure. GE may have patents or pending patent applications covering subject matter in this document. The furnishing of this document does not provide any license whatsoever to any of these patents. GE provides the following document and the information included therein as is and without warranty of any kind, expressed or implied, including but not limited to any implied statutory warranty of merchantability or fitness for particular purpose. For further assistance or technical information, contact the nearest GE Sales or Service Office, or an authorized GE Sales Representative. Revised: June 2017 Issued: March General Electric Company. * Indicates a trademark of General Electric Company and/or its subsidiaries. All other trademarks are the property of their respective owners. We would appreciate your feedback about our documentation. Please send comments or suggestions to controls.doc@ge.com
2 Document Updates Location Live Alarms OPC UA Alarms Description Added a Note and identified columns with text that reflects the setting of the WorkstationST Status Monitor Regional Settings Use Second Language selection. Added the following column names and descriptions: Comments Primary Language Comment Secondary Language Comment Updated to listed features to reflect that Comments are now supported in Mark controls products Related Documents Doc # Title GEI WorkstationST* Alarm Server ControlST* Software Suite How-to Guides, the following sections: How to Configure Alarm Capability in the ToolboxST* Application How to Configure the Alarm Server in the WorkstationST Application How to Configure the Alarm Scanner Feature of the Alarm Server How to Analyze Historical Alarm Data Using the WorkstationST Alarm Viewer - Online Mode GEH-6808 How to Analyze Historical Alarm Data Using the WorkstationST Alarm Viewer - Offline Mode How to Filter Live and Historical Alarms Using the WorkstationST Alarm Viewer How to Set Up Alarm Help and Diagnostic Help for use in the WorkstationST Alarm Viewer How to Configure OPC AE Alarm and Event Capability How to Shelve and Place Alarms Out of Service Acronyms and Abbreviations CMP EGD EMT GUI MRU OOS OPC SOE Command Message Protocol Ethernet Global Data, a control network and communication protocol EGD Management Tool Graphical User Interface Most Recently Used Out-of-service A standard for data exchange in the industrial environment. Sequence of Events 2 GEI U WorkstationST Alarm Viewer
3 Contents 1 Introduction System Requirements Installation Multi-language Support Language Usage Rules Application Help Security Command Line Arguments Operation Screen Overview Advanced Features Live Alarms Organize and Display Columns Sort Alarm Data Filter Live Alarms Active Alarm Background Notification Manage Alarms and Events Alarm Shelving and Out-of-service Alarm Parent Child OPC UA Alarms Live Alarm Status History Alarm Symbols Sound Options Alarm Attributes Redundant Alarm Server Support Live Alarm Messages Live Alarm Summary Connect Historical Alarms Display Columns View a Single File View All Files Filters Filter Collections Alarm Filter Timeouts Edit a Filter Alarm Viewer Settings Live Settings Historical Settings Historical Chart Settings Views Create a View Open a Saved View Open a Recently Used View Default View CIMPLICITY* Alarm Status History View Alarm Reports Report Options Create Alarm Report Report Results Alarm Help Instruction Guide GEI U 3
4 17.1 Directory Structure Process Alarms Diagnostic Alarms Alarm Help Comments Alarm Viewer Glossary of Terms GEI U WorkstationST Alarm Viewer

5 1 Introduction The WorkstationST Alarm Viewer displays and manages live and historical alarm and event information from a computer configured with the WorkstationST application, and running the Alarm Server Feature. Alarm and event information displays by using advanced filtering and sorting capabilities, as well as functions such as acknowledging, locking, and silencing alarms and events. The following alarm and event information can be generated: Alarms Events Holds Sequence of Events (SOE) Diagnostics The Alarm Server connects to and receives alarm and event data from one or more controllers listed as consumed devices in a WorkstationST component configured in the ToolboxST application. An Alarm Server configuration connected to four controllers is displayed in the following figure. The Alarm Viewer then connects to the Alarm Server to display and manage the alarm and event data from the configured controllers and the Alarm Server. Note The Alarm Viewer can connect to any single Alarm Server in the system. Instruction Guide GEI U 5
6 The terms in the following table are defined in ISA 18.2 and are also used in the alarm system by GE. The definition describes their use as implemented in the GE alarm system. Note For further information refer to ISA 18.2, Management of Alarm Systems for the Process Industries. Term Definition Represents a group of alarm configuration parameters used in configuring an alarm. These parameters include: Alarm Class Alarm Group Alarm Type Alert Reset Active Unacknowledged Alarm display color Active Acknowledged Alarm color Normal, Unacknowledged Alarm display color Normal, Acknowledged Alarm display color Sound definition Priority Alarm symbol A variable can only have one alarm class assigned. A set of alarms by device or by logical plant area. Represents one of five types of alarms/events managed in the alarm system (for example, Process Alarm, Events, Holds, SOES, and Diagnostics). Alerts do not have a formal implementation in the alarm system. However, alert behavior is accomplished using the Alarm Class in conjunction with the Auto Reset property when the variable is configured for use. The operator action that clears an alarm from the alarm display when the alarm has been Acknowledged and is in the Normal condition. 1.1 System Requirements For assistance, contact the nearest GE Sales or Service office, or an authorized GE sales representative. Note The ControlST Software Suite no longer supports Windows 2000 and Windows XP. Note Refer to the ToolboxST User Guide for Mark* Controls Platform (GEH-6700), the section System Requirements. 1.2 Installation The Alarm Viewer is installed from the ControlST DVD by selecting the WorkstationST application installation option. The Alarm Viewer can be installed with the WorkstationST application or by itself for use on a remote computer. If a new version is installed, the desktop and Start menu update to reflect the most recently installed version. Note Refer to the ToolboxST User Guide for Mark Controls Platform (GEH-6700), the section Installation. 6 GEI U WorkstationST Alarm Viewer
7 2 Multi-language Support Starting with the ControlST V04.03, the Alarm Viewer can be displayed in the local Windows language as selected in the Control Panel - Region and Language - Keyboards and Languages, on the tab Display Language. Note Refer to the section Alarm Viewer Settings, the option Enable Non-translated Content. To enable the Alarm Viewer to display in the selected language the following is required: The Windows Language Pack is installed on the computer for the desired language. Or A native language Windows operating system (such as Spanish Windows 7) And The Alarm Viewer resource DLLs are installed that match the selected Windows display language. Note Refer to the Resource Translation Manager (GEI ). The resource DLLs can be created or modified by using the Resource Translation Manager utility application and exporting the strings to a dictionary text file for translation. This application is installed automatically when the ControlST software suite, Configuration Tools Package or the WorkstationST application is installed. This utility can be found in the following directory: C:\Program Files\GE Energy\Resource Translation Manager. Note The Alarm Viewer does not support right-to-left languages. Instruction Guide GEI U 7
8 2.1 Language Usage Rules Starting with ControlST V04.03, the WorkstationST Alarm Viewer supports displaying text in the native language as selected from the Control Panel - Regional Settings - Keyboards and Languages - Display Text. With this new capability, support for subcultures in the language component of the help files names is available. Note Refer to the Resource Translation Manager (GEI ). The language component used in the file name can now contain the subculture for that country. The language component of the file can be defined as: or Example: <culture>-<subculture> <culture> A file name can be defined using the culture and subculture for Spanish - Spain (Spanish for Spain) as L63QTX.es-SP.txt or it can be defined using just the culture for Spanish as L63QTX.es.txt If the alarm help subsystem detects the use of the subculture in the language component of the file name, it displays. Otherwise, the culture form displays. 3 Application Help The Alarm Viewer includes a help file to aid in the understanding of the configuration and operation of the application. The help file is located in the installation directory and is named WorkstationSTAlarmViewer.chm. Starting with ControlST V04.03, the Alarm Viewer supports displaying text in the native language of the operating system. When enabled, the Alarm Viewer displays the application help in the native display language of the operating system. The help file must reside in the language subdirectory under the installation directory for the Alarm Viewer. Note Refer to the section Language Usage Rules. Example: The Alarm Viewer is installed and has been enabled to use Spanish for Spain (Spanish Spain) display text. The language name for the subdirectory that is used is es-sp. The Spanish for Spain translated Alarm Viewer help file would be named WorkstationSTAlarmViewer.es-SP.chm and would be located in the es-sp subdirectory as follows: C:\Program Files (x86)\ge Energy\WorkstatationST Alarm Viewer\es-SP 8 GEI U WorkstationST Alarm Viewer

9 4 Security Logon security qualifies the capabilities of the Alarm Viewer user. A logon prompt displays if the user logon account names and user roles are defined in the ToolboxST application. The logon validates the user against the Windows account credentials on the current computer, and against the user logon name entered in the Users and Roles section in the ToolboxST System Editor. If the logon is successful, the user s role, as defined in the ToolboxST application (displayed in the following figure), establishes the capabilities in the Alarm Viewer. The Name (SteveH) and Role (Operations) are assigned by the Administrator. Note If the User Logon dialog box displays when the Alarm Viewer is started, select the User from the drop down list (as defined in the ToolboxST system component User Names and Roles feature), and enter the Windows account Password. The Alarm Viewer user capabilities are determined by the Alarm Privilege assigned to the user role. The Alarm Privilege is defined as True or False for each role. Alarm Privilege, when set to True, allows the user to interact completely with the alarm system. This includes performing tasks such as acknowledging, locking, silencing, and reset of alarms, defining or saving views, and defining or saving filters. Alarm Shelving Privilege allows the user to shelve or unshelve alarms. Download Privilege allows the user to download to a controller. Alarm Service Privilege allows the user to place alarms as out-of-service from the Alarm Viewer. Go To Definition From HMI Graphics Privilege, when set to True, allows the user to open the ToolboxST application to display the logic writing the current alarm. When set to False, this feature is disabled. Live Data Force Privilege allows the user to force live values. Live Data Modify Privilege allows the user to modify live values. Tag Out Privilege allows the user to perform tag outs in the system. Instruction Guide GEI U 9
10 5 Command Line Arguments The Alarm Viewer supports a number of command line options for starting up the Alarm Viewer. The leading / and trailing : characters around the option keywords are required, and only one option is supported at a time. Note The < > brackets are displayed to demonstrate usage, not to be included with the value. The following command line arguments are supported: /Host:<HostName> Where: /Host: is the option to be used HostName is a valid host name on the network. Usage: /Host:LocalHost Note If there is an AlarmViewerDefault.AvView defined, the Alarm Viewer uses that file instead of the HostName specified to control the display behavior. /IPAddress:<QuadIPAddress> Where: /IPAddress: is the option to be used QuadIPAddress is a valid IP address on the network. Usage: /IPAddress: Note If there is an AlarmViewerDefault.AvView defined, the Alarm Viewer uses that file instead of the IPAddress specified to control the display behavior. /View:<Alarm Viewer View State File Name> Where: /View: is the option to be used. View file name is the name of the AvView file to be used. The file can be fully qualified or be the name of the file without the path. Note If just the file name is specified, the Alarm Viewer uses the Alarm Configuration Root Path option, and then checks in the Views subdirectory. Note The View file name must be enclosed in double quotes if there are spaces in the path or file name. Usage (Fully Qualified): /View: C:\WorkstationST\AlarmViewerConfiguration\Views\SpecialView.AvView Usage (File Name Only): /View:SpecialView.AvView The Alarm Configuration Root Path is assigned to be C:\WorkstationST\AlarmViewerConfiguration and Views is the required subdirectory. 10 GEI U WorkstationST Alarm Viewer
11 Note For the view file name, the file extension AvView is registered for use by the Alarm Viewer during installation. When you double-click on a file with that extension, the Alarm Viewer opens and uses that file to define the display. /NoSplashScreen indicates to suppress the startup splash screen when the Alarm Viewer is started. 6 Operation To start the Alarm Viewer: from the Start menu, select All Programs, GE ControlST, and WorkstationST Alarm Viewer. or Double-click the desktop icon. 6.1 Screen Overview Tabs control the information that displays. The initial Alarm Viewer screen displays the Short Term Historical Alarms and Filter Definitions tabs. Additional tabs display when items are selected from the View menu. Instruction Guide GEI U 11
12 6.1.1 Menus Menu Command Use to File View New Filter Collection Open Filter Collection Save Filter Collection Save Filter Collection As Close Filter Collection Recent Filter Collections Open Alarm Data File Close Alarm Data File Print Alarm Data Print Alarm Summary Export Alarm Data Export Alarm Summary Data Open View Save View Save View As Recent Views Exit Connect Show Live Alarms Show Live Alarms Summary Show Live Alarm Messages Show Historical Alarms Show Alarm Reports Show Filter Collection Advanced Define a new collection of alarm filters Open a previously saved set of alarm filters Save the current set of alarm filters to a different file Save the current set of alarm filters to a different file Close the current filter set Display a list of recently used filter collections Browse for an alarm data file to display Close the currently open data file Print the currently displayed alarm/event data Print the historical alarm summary data Export the displayed alarm/event data to a.csv file Export the historical alarm data to a.csv file Open a previously saved view Save the current view Assign a name and save the current view Display a list of recently used views Exit the application. Select the computer (local or remote) as the source of alarm data Select the mode of operation to display live alarm/event data Display the Live Alarm Summary Data tab Display the Live Alarm Messages tab Select the mode of operation to display historical alarm data Display the Alarm Reports tab Display the Filter Definitions tab Displays two options Show OPC AE Test Client enables the OPC AE tab to connect to OPC AE Servers for testing. View Alarm Server Logs displays three options. Alarm Server User Log displays an Alarm Server Log. Alarm Server Debug Log displays the Alarm Server Debug Log. Alarm Server Backup Debug Log displays a backup of the Alarm Server Debug Log. Options Settings Display a dialog box of viewing options 12 GEI U WorkstationST Alarm Viewer
13 Menu Command Use to Help Contents Submit Problem Report Release Notes How To Guides About Display the Help application Allow you to submit an application problem Display information about this release Display ControlST Software Suite How to Guides Display version and copyright information Alarm Interaction and Filtering Toolbars Live Alarm Data tab displays all live alarms Live Alarm Summary Data tab displays a summary of the alarm data. Short Term Historical Alarms tab displays historical data. Alarm Reports tab displays report options and reports. Filter Definitions tab edits the filter collection. A ToolTip is provided for each of the options available on this toolbar. Instruction Guide GEI U 13
14 6.1.3 Status Bar The following is an example of an Alarm Viewer status bar. Designator for the selected display language. Number of displayed alarms and connected clients. Identity of Alarm Server, Alarm Source and filter applied. Number of active, unacknowledged process alarms. The display states are as follows: Connection indicates the source of the alarm data (local or remote computer). The IP address or host name of a remote computer also displays. A green icon indicates that the connection status is good, a red icon indicates a connection problem. The following are examples of connection options: Single Alarm Server Connection Normal Connection Status Redundant Alarm Server Connection Both Primary and Secondary connection failure Alarm Source indicates whether the data displayed is from a live connection or is historical, and if the data is filtered. Filter Applied indicates the name of the filter applied or <Unfiltered> or No Filter. If a single alarm file displays, File Contents also displays. Alarm Data indicates the number of rows used for live or historical alarm data. If live data is displayed, an icon indicates the update status of the screen. If the update is interrupted, the icon displays in red. The icon turns green when the connection is reestablished. 14 GEI U WorkstationST Alarm Viewer

15 7 Advanced Features The WorkstationST Alarm Viewer supports a number of advanced features that must be enabled in the ToolboxST application before they can be used. These features are Out of Service, Shelving, and Parent/Child. These features are enabled in the ToolboxST System Editor, System propeerties. When enabled, they are available plant wide. Note Refer to the sections Alarm Shelving and Out-of-service and Alarm Parent Child. To enable the Alarm Shelving, Alarm Out-of-service, and Alarm Parent Child features: open the System Editor, from the Tree View, select the system item, and in the Property Editor, set the Alarm Shelving, Alarm Out of Service, and/or Alarm Parent Child properties to True. Instruction Guide GEI U 15
16 8 Live Alarms Live alarms can be displayed from either a local or a remote Alarm Server. To display live alarms from an Alarm Server running on the same computer: from the View menu, select Local Mode and Show Live Alarms. To display live alarms from the Alarm Server on a different computer: from the View menu, select Remote Mode, enter the Host name or IP address of the remote Alarm Server, and click OK. 8.1 Organize and Display Columns To organize the columns that display: right-click any column header, select Organize Columns from the shortcut menu, and use the arrows to select and arrange the order of the columns to display Managing Columns Live Alarm Display Options Option Default Column Organization Hide Column Organize Columns Auto Size Columns Edit Column Filter Equation Multicolumn Sort Order Print Alarms Settings Description Resets the column order from left to right to the default order Hides the column under the cursor A dialog box with the column names displays. The columns can be displayed or hidden and the order can be changed as required. Click on this option to automatically adjust the width of all columns to display the data in those columns. When filtering is applied, the element of the filter that applies to the column can be edited. Changes made are automatically applied to the live alarms being displayed. Allows you to sort up to three columns of displayed data Prints all alarms that display or could display if scrolled into view. Selection state and alarm color is included. Only columns visible are printed Select to display Alarm Viewer Settings. The Alarm Viewer can display the items listed in the following table for each alarm. Note next to a column name in the following table indicates that the text displayed in that column reflects the setting of the WorkstationST Status Monitor Regional Settings Use Second Language selection. Live Alarm Display Columns Column Name Acknowledged Acknowledged Required Actor ID Alarm ID Alarm Server Description The acknowledged state of the alarm. (Yes = Acknowledged, No = Unacknowledged) Indicates that acknowledgement is required on this alarm The user ID of the operator that performed the last action. A unique alarm identifier for the alarm. The IP address of the Alarm Server being used as the source of the alarm. 16 GEI U WorkstationST Alarm Viewer
17 Live Alarm Display Columns (continued) Column Name Alarm State Comment Description The current state of the displayed alarm or event. If the alarm state is Undefined, the OPC AE alarm configuration must be added to the external OPC Servers in ToolboxST. The user comment displayed for the current alarm state. The comments displayed in the column reflect the setting of the WorkstationST Status Monitor Regional Settings Use Second Language setting. Comments are supported for all process alarms displayed and will be persisted in the Historical Alarm Archive. Comments can be used to meet customer needs such as for tracking, troubleshooting, regulation requirements, and informational purposes. Reset Comments and Acknowledge Comments must be enabled (set to True) in the ToolboxST System Editor Alarm System Property grid. Primary Language Comment Secondary Language Comment Class Description Device Device Time Last State Locked State OPC Severity Plant Area Primary Language Description Priority Quality Rate Recorded Time Second Language Description Service State Service Time Shelved State The user comment entered for the alarm in the primary language. This is the primary language defined in ToolboxST. The user comment entered for the alarm in the secondary language. This is the secondary language defined in ToolboxST. The Class the alarm is assigned to. The description of the alarm. The name of the unit. The time when the alarm was generated by the device. From the Options menu, select Settings to change the time display type (UTC, Local Time). The previous state of the alarm. If the previous state is unknown the displayed value will be blank. The current state of the locked attribute. Used by the operator to control the alarm from being updated. (L = Locked, U = Unlocked) Locked freezes the alarm. Unlocked allows the alarm to update. The severity of the alarm or event. (1 is a message, 1000 is critical) The logical plant area assigned to the alarm or event. The alarm description in the primary language. This is entered in the Description column for all variables in the ToolboxST application. The priority of the alarm or event. (1 is the highest priority) The quality of the alarm or event. When the quality is poor, the color changes to light gray on white to indicate that the alarm is stale and its state may not be correct. The number of notifications received between updates of the display for a given alarm. Used as an indicator to detect high rate of notifications per alarm. The threshold value default is 10 and can be changed in Settings. The time when the alarm was recorded by the alarm system (time received by the alarm server). This allows you to find time-sync problems when the device time has not yet been set and alarms are being generated. The units and precision are the same for Device Time. The alarm alternate language description in the second language defined in the ToolboxST application. The In Service or Out of Service state of the process alarm. The time when the alarm was placed either In Service or Out of Service based on the Service State value. The Shelved state of the process alarm. Instruction Guide GEI U 17
18 Live Alarm Display Columns (continued) Column Name Shelved Time Shelved Time Remaining Silenced Sound Symbol Type Units Value Variable Alias Variable Name Description The time when the alarm was placed either in the Shelved or Unshelved state. The remaining time the alarm will be in the Shelved state, Time displays in the form, Days Hours: Minutes:Seconds. The silenced state of the alarm. (Y = Silenced, N = Normal) The name of the source of the sound in the systems component in the ToolboxST application. The symbol representing the priority, alarm state, and acknowledgement state of the alarm. The type (alarms, events, holds, SOEs, or diagnostics) of the alarm being displayed. The units the value is displayed in. The value of the alarm, either True or False, for Boolean alarms, or the current value of an analog alarm. The customer assigned variable alias name associated with this alarm or event. The fully qualified name of the variable associated with this alarm or event. Device names have a unique prefix. 18 GEI U WorkstationST Alarm Viewer


19 8.2 Sort Alarm Data To sort by information in a single column: click the column header of the column to be sorted to display a sort arrow that indicates the direction of the sort. Any column can be used to sort data. Re-selecting the same column toggles the sort direction. Single-column sorting is the default. Note Rest the cursor on the sort arrow to display a ToolTip describing the sort direction. To sort using multiple columns 1. Right-click any column header and from the shortcut menu, select Multicolumn Sort Order. From the Columns Available for Sorting list, select the columns to be sorted. Use the right / left icons to move the selected column to the Columns Sorted text box. Use the up / down arrows to define major to minor sorting. 2. Click OK. An arrow now displays on each column that was selected and the same ToolTip displays when the cursor rests on either column header. Note After multi-column sort is configured, it remains in effect until removed. Instruction Guide GEI U 19

20 8.3 Filter Live Alarms The Alarm Viewer allows you to edit and apply filters that control the displayed alarms. The filter toolbar is displayed in the following figure. Note The special filter <Unfiltered> is available even if no filter collection is loaded. The filter toolbar contains the following items: Collection is the name of the filter collection currently in use. This name is user-defined and can be set in the filter collection editor. Filters Available is a list, displayed in a drop down box, of all defined filters. Selecting a filter applies it to the displayed alarm data. The filters available are all user-defined and named. Note Refer to the section Filters. Priority Filter displays the highest priority active and not acknowledged alarms. When selected, the drop-down list of filters is unavailable. Clicking the icon toggles the priority filter on or off. Selecting a filter automatically updates the live alarm display using the selected filter. The column headers also update if the alarm data in a particular column is used in the filter. Note The filter equation applied displays when the cursor is positioned over the drop-down arrow of the filter list. The following is an example of an alarm display after a filter is applied. 20 GEI U WorkstationST Alarm Viewer

21 Note All columns that have the Filter icon displayed can be edited. To edit the applied filter: from the column header, click any of the red filter icons. Clicking the Filter icon for the Type column allows you to edit the filter term for that column. Changing the selection changes the display based on the new evaluation. Changes made are reflected back into the current filter. If no Filter icon is displayed in the column header, you can add the filter term for the column. Right-click over the column header and select Edit Column Filter Equation from the shortcut menu. Note If the Edit Column Filter Equation item is unavailable, there is no filter allowed for that column. Note If no selection is made in a filter element, it is considered unused when the filter is evaluated. The Column Filter dialog box (obtained by clicking the Filter icon in the Type column) allows you to change the alarm event types being filtered. Selecting the Events check box displays both alarms and events. When Event is selected, the screen changes to display events (configured in this case with a red triangle symbol). Instruction Guide GEI U 21

22 The Filter1 filter has been modified to display both Diagnostic Alarms and Events. The new filter definition displays in the ToolTip. 8.4 Active Alarm Background Notification The Alarm Viewer alerts you to any active alarms that have not been acknowledged while a filter is being applied. A ToolTip points to an icon in the system tray. In the following example, there are 8 active, unacknowledged alarms that are currently not being displayed by the Alarm Viewer. This is due to the filter currently being applied (keeping them in the background). The notification is removed when: The filter is changed to display all the alarms The background alarms are acknowledged, or return to a normal state The information in the ToolTip updates if the status of these alarms changes. Note The notification does NOT display if the Dynamic Priority filter is applied. 22 GEI U WorkstationST Alarm Viewer

23 8.5 Manage Alarms and Events The Live Alarm Toolbar buttons are used to manage alarms and events. Additionally, when you right-click in the live display area, a shortcut menu displays with additional options. Note Items that are unavailable are due to the current alarm conditions at the instant that this menu displays (for example, if a selected alarm has already been acknowledged). Note For computers running the WorkstationST Alarm Viewer V04.04 or later, an alarm placed in the Out of Service state is displayed at all times (unless filtering is hiding the alarm) until the alarm is placed in the In Service state. Acknowledging and resetting the alarm while in the Out of Service state does not clear the alarm from the screen. If an Alarm Viewer running an earlier version is also displaying the same alarm, the operator cannot reset the alarm to clear it from the screen. There is no indication as to why the alarm cannot be cleared. It is recommended that all computers using the WorkstationST Alarm Viewer be upgraded to use V04.04 or later. Instruction Guide GEI U 23
24 The following tables display alarm and event management options: Live Alarm Shortcut Menu Options Menu Item Acknowledge All On Screen Reset All On Screen Silence All On Screen Action Acknowledges all alarms visible on screen. Does not include alarms that must be scrolled into view. All connected clients see this action. Alarm selections are not required. Resets all alarms visible on screen. Does not include alarms that must be scrolled into view. All connected clients see this action. Alarm selections are not required. Suppresses the sound being annunciated for all alarms visible on screen. All connected clients respond to this action. Only visible columns are printed. Alarm selections are not required. When an alarm set is selected, the row(s) display(s) in blue. The selected alarm set may be larger than can be displayed at one time. These actions are system-wide. Action Ctrl-A Left Mouse Ctrl-Left Mouse Result Alarm Selection Selects all alarms visible on screen. Does not include alarms that must be scrolled into view. All connected clients see this action. Alarm selections are not required. Selects the alarm under the cursor and deselects all other selected alarms Toggles the selected alarm under the cursor The following menu items affect the selected alarm set. Menu Item Acknowledge Unacknowledge Lock Unlock Reset In Service Out of Service Shelve Unshelve Override Remove Override Silence Unsilence Silence Alarm Horn Respond User Comment Action Acknowledges the selected alarm set Removes the acknowledged condition on the selected alarm set Prevents the selected alarm set from changing Releases the lock from the selected alarm set Resets the selected alarm set Returns the selected alarm(s) to In Service Places the selected alarm(s) Out-of-service Places the selected alarm(s) in the Shelved state Takes the selected alarm(s) out of the Shelved state Overrides the alarm for the selected alarm set Removes the override attribute on the selected alarm set Silences the sound played by the Alarm Viewer for the selected alarm set Silence is not supported for Mark V alarms. Reinstates the sound attribute on the selected alarm set Silences the alarm horn on the selected alarm set by sending a command to the controller to stop the physical horn connected to I/O driven by the controller Dialog specific alarm response option. The display will be updated based on what the server includes in the response. Displays the Comments Included in the Historical Alarm Data dialog box. Allows the addition of user comments in the selected language (Primary or Second). 24 GEI U WorkstationST Alarm Viewer
25 The following menu items affect the selected alarm set. They have no impact on the alarm state in the system. Menu Item Go To Definition in Logic Go To Display Screen Alarm Status History Display Variable Attributes Alarm Attributes Alarm Help Print Alarms Copy Selection Create Filter from Selection Action Starts the ToolboxST application and navigates to the application code block that is writing the variable. If the ToolboxST application is not installed on the computer running Alarm Viewer, this menu item is unavailable. This menu item is only available when a single alarm is selected. Causes the HMI screen that contains the selected alarm to display. Selection is not available if the HMI software is not installed. Selects a time frame of Ten Minutes, One Hour, One Day, or a User Defined Filter that is used to retrieve the set of historical alarms that match the filter criteria. This historical alarm data then displays in the Short Term Alarms tab. The user-defined filter item is unavailable until the user defined filter is added to the Options/Settings/User Defined Alarm Status History Filter Name option, and also is defined in the current filter collection. Displays a data grid with the selected alarm variable attributes for the operator to review. Displays alarm attributes for the selected process alarm. Displays help for the selected process alarm or diagnostic alarm if installed and configured. Prints all alarms that are displayed or could be displayed if scrolled into view. Selection state and alarm color is included. Copies the currently selected alarms into the clipboard. The copied alarms can be pasted into Word or Excel. Creates a filter from the currently selected alarms and events. Instruction Guide GEI U 25

26 8.6 Alarm Shelving and Out-of-service With ControlST V04.06, alarm shelving and an enhanced out-of-service feature are provided. These features apply only to process alarms. Alarm shelving allows an operator to temporarily suppress alarms from the WorkstationST Alarm Viewer filtered alarm display, and from HMI screens that display alarms. The shelving command can be issued from either the Alarm Viewer or selected screens on the HMI. Shelving capability is supported in all Mark VIe controllers, the WorkstationST Alarm Scanner, and the embedded OPC AE clients in the Alarm Server. The out-of-service feature allows an operator to place an alarm into the out-of-service state or to return the alarm back to the in service state. Note To enable these features, refer to the section Advanced Features. When enabled, these features impact alarm displays throughout the system. The alarm shelving and out-of service features are similar. Dedicated out-of-service and shelved alarm displays are provided in the Alarm Viewer to reduce alarm information on the filtered alarm display. Both features are enabled through properties in the ToolboxST System Editor. Refer to the ControlST Software Suite How-to Guides (GEH-6808), the section How to Shelve and Place Alarms Out-of-Service for additional information. Note Refer to the ControlST Software Suite How-to Guides, the section How to Define Roles and Users in the ToolboxST Application. The correct privileges must also be enabled for each operator in the system. This is done using the Users and Roles feature in the System Information Editor. For alarm shelving, each user must have the Alarm Privilege and the Alarm Shelving Privilege enabled. For alarm out-of-service, each operator must have the Alarm Privilege and the Alarm Service Privilege enabled. 26 GEI U WorkstationST Alarm Viewer

27 Note Changes to these properties require that the component be built and downloaded. For alarm shelving, there are two properties in each Component Editor that must also be configured. These properties display in the Property Editor when a variable is selected in the Data Grid: Alarm Shelving must be set to Enabled before shelving will be allowed on that variable. Alarm Shelving Max Duration is the maximum time in minutes that the alarm can be shelved. When a set of process alarms is being shelved, the operator is prompted to enter an expiration time for the shelving and a comment as to why the alarms are being shelved. Once the alarms are shelved, the expiration time and the shelved time are used to determine when the shelved alarm is un-shelved. When the shelve command is issued, all alarm displays with alarm shelving enabled no longer display the shelved alarms. When the expiration time expires, the alarms again display. When a set of process alarms is being placed out-of service, the operator is prompted to enter a comment as to why the alarms are being placed out-of-service. Once the alarms are placed out-of-service, they must be manually placed in service to return them to their normal function. Instruction Guide GEI U 27
28 When the Alarm Viewer is running and the Live Alarm Data tab is selected, the toolbar displays icons that indicate enabled features: Filters Available and Feed Alarms indicate the filters collection available for use. represents the dynamic priority display. represents the shelved alarm display. represents the out-of-service display. When an icon is clicked, it becomes highlighted to indicate that the selected display is active. Clicking it again toggles it back, activating the filtered alarm display. Note If no icons are selected, the filtered alarm display is active. If the shelving or the out-of-service feature is not enabled, the and the do not display. The status bar displays the total number of shelved and out-of-service alarms in the control system. When either number is zero, that area of the status bar does not display. Shelving commands can be issued if: Alarm Shelving is enabled at the system level Operator has Alarm Shelving privileges Selected alarm has Alarm Shelving enabled Note In the Alarm Viewer, shelving and out-of-service commands can be issued from the filtered alarm display. Shelving commands can also be issued from the shelved alarm display to re-shelve the alarm with a new duration. Note If an alarm that does not have the Alarm Shelving property enabled is selected as part of a set, it is not shelved. When a set of alarms is selected, both the Shelve and Out-of-service icons are enabled on the toolbar. 28 GEI U WorkstationST Alarm Viewer


29 Each Shelve Type is enabled if the device or server supports the shelving type and the alarm selected is enabled for shelving. The units can be changed as necessary. The Maximum Shelve Time displayed is the minimum of the set of selected alarms The Shelve Time must be entered. It ranges from 1 to the Maximum Shelve Time as configured in the Component Editor for the selected alarms. Comments are optional. They can be entered in either, or both of the listed languages as desired. Comments are stored in the historical alarm archive. Out-of-service commands can be issued if: Out-of-service is enabled at the system level Operator has Alarm Service privileges Instruction Guide GEI U 29

30 8.6.1 Shelved Alarm Display Alarms that have been shelved are removed from the filtered alarm display. Click the in the system. icon to display all shelved alarms Note Alarms displayed on the shelved alarm display screen can be managed as in the filtered alarm display. Alarms can be un-shelved or re-shelved by selecting the alarms and clicking the Shelve or Un-shelve icon. The following columns contain additional information: Shelved Time is the time the alarm was shelved. Shelved Time Remaining is the amount of time the alarm will remain shelved. The value is updated automatically. Shelved State indicates that the alarm is in the shelved state. Note Shelved alarms that also have Auto Reset enabled are automatically un-shelved when not in the alarmed condition. Alarms can be removed from this display by un-shelving manually or when the Shelve Time Remaining goes to zero. When either condition occurs, the alarms are removed from this display and return to the filtered alarm display. Note Shelved alarms do not play any configured sound or display blinking behaviors. These behaviors are available in the filtered alarm display only. The filtered alarm display automatically removes the shelved alarms from the display when the feature is enabled, regardless of filters defined or selected. Filtering can be applied to further reduce the alarms displayed. The Shelved State is available as a filter definition. This is used when generating historical alarm reports or performing alarm analysis. Setting the Shelved State while the filtered alarm display is active has no effect. When Alarm Printing is enabled in the WorkstationST Component Editor Alarm tab, the shelve and un-shelve commands for each alarm are printed. However, any changes to these alarms while shelved are not printed. Printing alarm changes for the alarms resumes once the alarm is un-shelved. 30 GEI U WorkstationST Alarm Viewer

31 8.6.2 Out-of-service Alarm Display Alarms that have been place out-of-service are removed from the filtered alarm display. Click the out-of-service alarms in the system. icon to display all Note Alarms displayed on the out-of-service alarm display screen can be managed as in the filtered alarm display. Alarms can be placed out-of-service from the filtered alarm display by selecting the alarms and clicking the Out-of-service icon. These alarms are only visible in the out-of-service alarm display, regardless of filters defined or selected. Place the out-of-service alarms back into service by selecting the out-of-service alarm display, select the alarms and click the Service icon. The alarms will be put back into service and displayed on the filtered alarm display. Note Out-of-service alarms do not play any configured sound or display blinking behaviors. These behaviors are available in the filtered alarm display only. The Service State is available as a filter definition. This filter can be set for In Service, Out-of-service, or Unused and is used when generating historical alarm reports or performing alarm analysis. Setting the Service State while the filtered alarm display is active has no effect. Instruction Guide GEI U 31


32 8.7 Alarm Parent Child Note To enable this feature refer to the section Advanced Features. With the release of ControlST V04.07, the Alarm Parent Child feature is available. This feature uses the parent child configuration in the ToolboxST application for each variable that is defined as an alarm. The configuration in the ToolboxST application creates an alarm hierarchy. The top most alarm is the parent alarm, which can be configured in application code as an indicator that there are one or more alarms under the parent that need attention. The parent/child criteria can then be used in an Alarm Viewer filter to selectively display only the parents or children in the live alarm data. This parent child association is evaluated in the Alarm Viewer when alarms are to be displayed. The feature is enabled through a property in the ToolboxST System Information Editor. The symbol and the foreground and background color used to display the Parent and Child icons in the Alarm Viewer are selected in ToolboxST System Editor. If the symbol selected is None, no Parent or Child icon displays. The following figure shows the symbols configuration in the ToolboxST application. Note When selecting colors, unnamed colors display the RGB code in place of the name in the data grid. The symbol and color selected will display for parents and for children. After enabling the Alarm Parent Child feature and configuring the symbol for the parent and child icons, the variables must be configured in the controller to establish the parent child associations. The following procedure shows the ToolboxST application configuration to define four Boolean variables that are enabled as process alarms with one parent and three interconnected child alarms. To configure alarms in the controller configuration From the Component Editor Software tab Tree View, select Variables. From the Summary View, select a variable and configure the Parent Alarms and Child Alarms as required. 32 GEI U WorkstationST Alarm Viewer


33 This configuration can be visualized using the following diagram. In the application code defined in the ToolboxST application, any combination of alarms available for display will be represented in the hierarchy as shown. The diagram is read as follows: A1 has children A2, A3, and A4. A2 has children A3 and A4. A3 has child A Live Alarm Display The Live Alarm display will show alarms based on the filter selected and the display mode selected. The parent and child symbols will be shown for all alarms displayed on the filtered Live Alarm Data display. The Dynamic Priority display, the Shelved Alarm display, and the Out of Service Alarm display will not show the parent child associations. Parent or child alarms can be identified by the symbol or in front of the variable name of the alarms being displayed. The symbol represents the position in the hierarchy, based on the set of alarms available at the time the alarms are being displayed. The following figure shows the all BoolA* alarms on screen. No hierarchy is displayed at this point but the alarms position in the hierarchy is denoted by the or symbol. The user can select the or symbol to see the alarms that are available in the specific alarms hierarchy for that alarm. When the box. symbol is selected, the list of all available child alarms in the defined hierarchy is displayed in a dialog Note This list excludes any alarms that have been shelved or placed out of service. Instruction Guide GEI U 33

34 The following figure shows the parent alarm selected, along with all child alarms that are available. Both displays can be used to interact with the alarms. When a child alarm is selected, the child name displays in the dialog box header, and all alarms up to the parent display in the grid. In the following figure, the alarm A3 is selected. The dialog box displays all alarms available up the hierarchy (in this example A2 and A1). 34 GEI U WorkstationST Alarm Viewer


35 8.7.2 Filtering The Parent Child filter option has been added to the filter definition. This option can be used to manage the alarms that are displayed using the parent or child configuration information. The filtering selections are Parents Only, Children Only, and Unused. Additionally, there is a check box selection Include Non-Parented Alarms. This allows alarms that are not parented to also be displayed. Note The Parent Child filter option is only used when displaying alarms on the Live Alarm Data tab. The filter has no effect on any of the other alarm displays. This option is hidden if the Alarm Parent Child feature is not enabled. When Parents Only is selected on the existing applied filter, the display will be as follows: Instruction Guide GEI U 35


36 Changing to Children Only displays the following: An Include Children option is available for Plant Area filtering. In this example, when Include Children and Plant.TG.GasSystem are selected, then alarms with the plant area Plant.TG.GasSystem.Dln, Plant.TG.GasSystem.Pump1, and Plant.TG.GasSystem.Valve1 will display in the alarm viewer when this filter is applied. 36 GEI U WorkstationST Alarm Viewer
 from an OPC UA Alarm Conditions Server, an OPC AE Server, the")

37 8.8 OPC UA Alarms Starting with ControlST V05.03, the alarm system supports an embedded OPC UA Alarm client. This allows for connecting to an external OPC UA Alarm Condition Server Features Live Alarms Alarms from an external OPC UA Server are displayed and updated like any other alarm in the control system. However, the following differences apply: Comments Comments can be entered for any process alarm displayed (Context Menu Only) from an OPC UA Alarm Conditions Server, an OPC AE Server, the WorkstationST alarm scanner, or any Mark* controls product. Comments With Acknowledge Comments when acknowledging process alarms can be entered for any process alarm displayed from an OPC UA Alarm Conditions Server, an OPC AE Server, the WorkstationST alarm scanner, or any Mark controls product. Note Acknowledge Comments must be enabled (set to True) in the system overview property grid in the ToolboxST System Editor. (By default this property is set to False.) Comments With Reset Comments when resetting process alarms can be entered for any process alarm displayed from an OPC UA Alarm Conditions Server, an OPC AE Server, the WorkstationST alarm scanner, or any Mark controls product. Note Reset Comments must be enabled (set to True) in the system overview property grid in the ToolboxST System Editor. (By default this property is set to False.) The Acknowledge Comments and Reset Comments properties must be set to True. ToolboxST System Editor Alarm System Properties To add a comment to a supported alarm: from the Alarm Viewer Live Alarm Data tab, right-click a supported alarm, and from the context menu, select User Comment. Select the language (Primary or Second) to use. Enter the comment. Click OK. Instruction Guide GEI U 37
38 One-shot Shelving This optional feature shelves an alarm until one of two conditions are met: The alarm transitions to the Normal state. OR The maximum shelving duration is exceeded. Support for One-shot Shelving and Duration are defined by the OPC UA Server and cannot be changed by ControlST. OPC AE Alarms and alarm scanner alarms support this feature and use the maximum shelve time of 1440 minutes. Alarm Shelving Dialog Box Dialog Conditions This optional feature provides a request for action to the operator. When the alarm is selected, a dialog box is displayed that presents the choices to the operator. Once a selection has been made it is sent to the UA Server, which then sends a response. The display is updated based on what the server includes in the response. The following is an example from the AlarmConditionServer: The Dialog Condition is displayed expecting a response from the operator. The icon is selected with the mouse, or Respond is selected from the context menu. 38 GEI U WorkstationST Alarm Viewer

39 A dialog box displays with the choices listed. After a selection is made the dialog box closes and the selection is sent to the server. In this example the Dialog Condition is removed from the screen indicating no further action is required. Branch Alarms These are alarms that have not been acknowledged or reset by the operator. Usually there is a current alarm that these are related to. In the following example, AlarmConditionServer.NorthMotor.Green is the current active alarm. The other two alarms are the alarms that were active but have not been acknowledged and reset by the user. This is an optional feature and the extension added to the name of the alarm is server specific. Alarm help is not supported for branched alarms Command Behaviors Reset The reset command calls the Confirm method in the OPC UA Server. The rules for the behavior are server dependent. The Reset command for any OPC UA alarm is allowed independent of the Acknowledged state or the Alarm state of the alarm. Reset is enabled for all other alarms if they have been Acknowledged and the alarm state is normal. 8.9 Live Alarm Status History To display on-demand historical information from one or more alarms or events: from anywhere in the alarm grid, right-click one or more rows of selected alarm data, select Alarm Status History and Ten Minute Filter from the shortcut menu. If the User Defined item is unavailable, from the Options menu, select Viewer Options, then in the User Defined Alarm Status History Filter Name field, enter a name for the filter. Note The selection made on the screen overwrites the variable(s) defined in the filter. Refer to the section Filters. Note To display and manage this information, refer to the section Historical Alarms. The results of the filter are displayed in the Short Term Historical Alarms display tab. Instruction Guide GEI U 39

40 8.10 Alarm Symbols Note To configure Alarm Symbols refer to the ToolboxST User Guide for Mark Controls Platform (GEH-6700), the section System Information Editor. Starting with ControlST V04.06, Alarm symbols can be displayed in the Alarm Viewer in both the Live Alarm Data display and the Live Alarm Summary Data display. The symbols must be defined and configured in the ToolboxST application before they are available for display in the alarm viewer. Alarm symbols represent alarm conditions being displayed. The symbol is a combination of the selected shape, the shape color, the alarm state, acknowledged state, and priority. The color used comes from the alarm class associated with the variable. The Symbols column must be made visible in the Live Alarm Data display for symbols to display. The Live Alarm Summary Data display automatically displays the symbol that corresponds to the alarm data in the respective column. Example: In the System Information Editor, under the Alarm System, Classes item, the following are defined: Alarm class LVL_1 Active, Normal, and Acknowledged colors Priority value In the System Information Editor, under the Alarm System, Symbols item, the alarm class LVL_1 is assigned to use a triangle symbol as shown in the following figure: The alarm class LVL_1 is associated with a variable in the controller and is declared to be an alarm. The symbol displayed indicates the priority (number inside the symbol), the alarm and acknowledged state (represented by the text and background color). A typical Alarm Viewer Live Alarm Data display using symbols is shown in the following figure: 40 GEI U WorkstationST Alarm Viewer


41 Note The Rate symbol displays in the Rate column as shown in the second figure. With the exception of the Rate symbol, the same symbols display on the Live Alarm Summary Data display as shown in the following figure: The Rate symbol displays in the Rate column. This is the default Rate symbol. It can be reconfigured as described previously in this section. Instruction Guide GEI U 41
42 8.11 Sound Options The Alarm Viewer can play sounds defined as part of the Alarm Class definition in the ToolboxST configuration. Sound options include Tone, Wave-File, and Voice. Once defined, they are assigned to an alarm class for variables. The Alarm Viewer updates the displayed alarm data approximately once a second. During the update, the Alarm Viewer detects the highest-priority alarm that is active, unacknowledged and not silenced, and plays the sound for that alarm. If the sound is defined as Voice, the Alarm Viewer states the phrase Priority <Value><AlarmType><Description>, where Value is the priority value of the alarm or event. Note Sound will only be played by the Alarm Viewer for process alarm type alarms (Type = Alarm). Alarm Type is the type of alarm/event and is a separate column in the alarm viewer. These types are distinctly different in there uses. The types are: Alarm Generated from the controller block-ware or the Workstation and are considered process alarms. The alarm class Alarm will be used if an alarm class is not assigned to the variable during configuration. These alarms are actionable by the operator. Event Generated from the controller block-ware or the Workstation and is used to provide non actionable information to the operator. The alarm class Event will be used if an alarm class is not assigned to the variable during configuration. Hold - Generated from the controller block-ware and is used holds for steam turbine applications. The alarm class Hold will be used if an alarm class is not assigned to the variable during configuration. The hold is considered actionable by the operator when used in a steam turbine application. SOE Generated by controller I/O subsystem and uses the alarm class SOE and cannot be overridden. Diagnostic - Generated by the controller and by the I/O subsystem and uses the alarm class Diag and cannot be overridden. Description is the description assigned to the variable in the ToolboxST configuration. An example of a phrase would be: Priority 1 Process Alarm, GasAuxiliaryStopPositionFilterPre-IgnitionTrip Note Using abbreviations in the variable description results in a garbled voice message. Refer to the section Live Alarms for options relating to sound. To set the sound options: From the Alarm Viewer toolbar, click Options and Settings. The Settings dialog box displays and allows you to configure the sound options. 42 GEI U WorkstationST Alarm Viewer

43 8.12 Alarm Attributes Alarm attributes can be displayed for process alarms in the Alarm Viewer. Alarm attributes cannot be displayed for non-process alarms such as holds, SOE, and such. To display alarm attributes: from the Alarm Viewer, in the Live Alarm Data display, right-click on a process alarm and select Alarm Attributes from the drop-down menu. Note Refer to the table Alarm Attributes for a complete list and description. The Alarm Attributes Display window displays for the selected process alarm. The left-hand side of the window displays the alarm attributes in a grid. Sort the attributes by clicking the Organize Attributes button, or right-click the header of the data grid and select Organize Attributes. Note Refer to the section Alarm Help. The right-hand side of the window displays the alarm help and comments for the selected alarm in the language selected in the combo box. Print Alarm Attributes Scroll Up Scroll Down Select language of the alarm help to be displayed Alarm Attributes Display Toolbar Descriptions of current alarm attributes (others may be added over time) are provided in the following table. Holding the cursor over an attribute on the Alarm Attributes Display screen displays a ToolTip with detailed information. Instruction Guide GEI U 43
44 Attribute Name Description Alarm Attributes Acknowledged Acknowledged Required Active Severity Actor ID Alarm ID Alarm On Zero Alarm Server Alarm Shelving Max Duration Alarm State Alarm Symbols Auto Reset Class Comment Compare Value Delay Time Description Device Device Time (UTC) Display High Limit Indicates if the alarm is currently acknowledged Indicates that acknowledgement is required on this alarm The value assigned when the alarm is in the active state. Used for filtering and display in the Alarm Viewer. Valid range is from , where 1 is the least severe. Range and usage defined by OPC for use in OPCAE servers and clients. The user ID that performed the last action. The unique alarm identifier for this alarm. When True, causes the alarm on a 1 to 0 transition. Requires alarm = True The IP address of the Alarm Server that is being used as the source of the alarm. The max duration the alarm can be shelved as configured in the Component Editor. The current state of the alarm. The symbol assigned to the type of alarm. Enable or disable the Return to Normal (RTN) Unacknowledged alarm state. RTN is reached when the process returns to within normal limits and the alarm clears automatically prior to the operator acknowledging the alarm. The alarm class assigned to this alarm. Any user comment regarding this alarm. For Deviation alarms only, the threshold value that is compared to the current value. This difference is checked to see if it exceeds the set point to determine if an action is to be performed. The time (in milliseconds) to wait after the set point has been exceeded before an action is performed. The description text displayed follows the Option menu Display Language setting, or the WorkstationST Status Monitor tray icon Regional Settings selection. The device name in the system. The timestamp when the alarm transitioned to its current state. (The time units change based upon the Alarm Viewer settings.) The default upper limit for displays on the HMI (such as bar-graph or trending displays). If a format spec has been specified, and this display high attribute is not specified, the format spec engineering max is used. When a measurement system is selected, HMI applications scale the display limits accordingly. Display Low Limit The default lower limit for displays on the HMI (such as bar-graph or trending displays). If a format spec has been specified, and this display low attribute is not specified, the format spec engineering min is used. When a measurement system is selected, HMI applications scale the display limits accordingly. Display Screen EGD Page Enable BQ The default HMI screen for this variable. The Ethernet Global Data page for this variable. When True, the Bad Quality alarm is configured. 44 GEI U WorkstationST Alarm Viewer
45 Alarm Attributes (continued) Attribute Name Enable Deviation Enable H Enable HH Enable HHH Enable L Enable LL Enable LLL Enable Rate Failure Event Format Spec Historian Deadband Historian Deadband Definition HMI Resource Hold Hysteresis Last State Locked State Measurement System Normal Severity Plant Area Precision Priority Quality Recorded Time (UTC) Recorder Deadband Recorder Deadband Definition Second Language Description Service State Service Time (UTC) Description When True, the Deviation alarm is configured. When True, the High state alarm is configured. When True, the High-High state alarm is configured. When True, the High-High-High state alarm is configured. When True, the Low state alarm is configured. When True, the Low-Low state alarm is configured. When True, the Low-Low-Low state alarm is configured. When True, the Rate Failure alarm is configured. When True, the variable is enabled as an Event. The format spec assigned to this variable. This value represents the amount that the data value must change before it is sent to the Historian. The definition of the Historian Deadband value (engineering units, percentage of range). The HMI resource this variable is assigned to. When True, the variable is enabled as a Hold. The incremental value that is subtracted from the set point that is then compared to the current value to clear an action. The previous state of the alarm. The current state of the locked attribute. Used to freeze the update of an alarm on screen. The measurement system currently selected. The value assigned when the alarm is in the normal state. Used for filtering and display in the Alarm Viewer. Valid range is from , where 1 is the least severe. Range and usage defined by OPC for use in OPCAE servers and clients. The plant area assigned to this alarm. The number of digits to display to the right of the decimal point. The priority of the alarm as defined in the alarm class assigned to this variable. The quality of the current alarm. The timestamp for when the Alarm Server received the alarm. (The time units change based upon the Alarm Viewer settings.) This value represents the amount that the data value must change before it is stored by the Recorder. The definition of the Recorder Deadband value (engineering units, percentage of range). The second language description for this alarm. The current service state (applies to process alarms only). The time that the Service State occurred for the process alarm (N/A for all other alarm types). (The time units change based upon the Alarm Viewer settings.) Instruction Guide GEI U 45
46 Alarm Attributes (continued) Attribute Name Set Point Severity Shelved Shelved State Shelved Time (Local Time) Shelved Time Remaining Silenced Sound Units Initial Value Variable Alias Variable Name Description The threshold value that is compared to the actual value, or difference to determine if an action is performed. The assigned OPC AE severity value for the given state. Enabled or disabled The shelved state of the alarm (Shelved or Unshelved). The time the alarm was shelved (N/A if not enabled). (The time units change based upon the Alarm Viewer settings.) The amount of time remaining before the alarm is unshelved (N/A if not enabled). The current silenced state of the alarm. The name of the source of the sound in the ToolboxST system component. The units of the value displayed. The value of the alarm. The customer assigned alias name assigned to the variable. The fully qualified name of the variable. Attribute only applies to Analog Alarms 8.13 Redundant Alarm Server Support The Alarm Viewer supports redundant Alarm Servers by providing automatic failover of the connection if the primary Alarm Server goes offline. This feature is configured in the ToolboxST System Editor by specifying the two workstations configured with the WorkstationST Alarm Server feature enabled to be used. After this is done, the Alarm Server configuration in each workstation must be made identical. The Alarm Viewer displays the primary and secondary names of the hosts running the redundant Alarm Servers in the status bar connection pane. The following are samples of the Alarm Viewer status bar displaying the primary and secondary Alarm Servers: Normal Connection Failed Primary and Secondary Connections 46 GEI U WorkstationST Alarm Viewer


47 9 Live Alarm Messages This display in the WorkstationST Alarm Viewer provides the ability to view incoming alarm notifications as they are generated within the control system. Note The WorkstationST Alarm Viewer must be connected to a live alarm source for this feature to work correctly. To enable the Live Alarm messages display: From the View menu, select Show Live Alarm Message and the Live Alarm Messages tab. The display is used to aid in troubleshooting fleeting, chattering, and dithering live alarms in the system. The newest alarm received is always displayed at the top of the screen. Sorting by columns is not supported. The features available in the display are: Filtering Used to display only the alarms that are being investigated. Max Rows Used to limit the number of alarms displayed on screen. Clear Screen Clears the screen of all alarms. Freeze Screen Prevents the updating of alarms on screen. The screen can be scrolled and the alarm data that has been captured can be viewed. All new incoming alarms received are discarded while the screen is frozen. To select and organize columns: Right-click on a column header and select Organize Columns. (The Column Header context menu contains the standard features available on the other displays in the WorkstationST Alarm Viewer.) Instruction Guide GEI U 47

48 The columns available for display when Organize Columns is selected are described in the section Managing Columns. In addition, the following columns are available: Composite State Displays the alarm symbol if defined, followed by the alarm state. The additional alarm state information is also displayed from left to right using the following format: L for Locked, K for Acknowledged, S for Silenced, H for Shelved, O for Out of Service. If the alarm is not in the above states a - is displayed. Example: Hi alarm that has been acknowledged and shelved would be Hi [-K-H-] Reason The cause for the notification being sent. The following figure shows the Live Alarm Messages tab with Max Rows set at 1000 and Freeze Screen selected. 48 GEI U WorkstationST Alarm Viewer


49 10 Live Alarm Summary With ControlST V04.06 a new capability has been added that provides an alarm summary based on a number of criteria selected by the user. To enable the Live Alarm Summary Data tab From the Alarm Viewer View menu, select Show Live Alarms Summary. The Live Alarm Summary tab displays. The Live Alarm Summary Data screen is divided into three sections; summary display (upper left), summary filtering (lower left), and summary detail display (right panel). The summary totals display in a data grid in the summary detail. If symbols are defined, they display in the same column as the totals. A gray scale option changes how the summary display uses color. The following figures were taken with gray scale set to true. With gray scale set to false, the color defined in the alarm class is used as the background color for the cell. Live Alarm Summary Data display options include: Summary By Device displays totals by device. The columns represent the Device Name, total Active Unacknowledged, Active Acknowledged, Normal Unacknowledged, Normal Acknowledged, Shelved, Out-of-service, Locked, Parent, and Child alarms. Instruction Guide GEI U 49

50 Summary By Device and Priority includes the priority column. This displays the alarm summary by priority by device. 50 GEI U WorkstationST Alarm Viewer
51 The Summary By Device and Summary By Device and Priority displays can be filtered by using the device filter in the summary filtering section of the screen. No selections in the summary filtering section indicate that the screen data is unfiltered. Summary By Plant Area produces totals by plant areas in the system. Note Since Plant Area is optional, any alarm without a Plant Area defined will be included on the row in the data grid with the Plant Area blank. Summary By Plant Area and Priority produces totals by priority and plant areas in the system. Instruction Guide GEI U 51

52 The Summary By Plant Area and Summary By Plant Area and Priority displays can be filtered by using the Plant Area filter in the summary filtering section of the screen. No selections in the summary filtering section indicate that the screen data is unfiltered. 52 GEI U WorkstationST Alarm Viewer

53 11 Connect The Alarm Viewer allows you to display alarm and event data from all alarm servers accessible in the system. To select the Alarm Server as the source of alarms to display 1. From the Alarm Viewer View menu, select Connect. 2. From the Remote Connection To WorkstationST Alarm Server dialog box, select the appropriate Connection and click OK. If the appropriate Alarm Server is not available on the list go to Step If the appropriate Alarm Server is not on the list, click Add a Connection. Instruction Guide GEI U 53


54 4. Enter the Host (either the name or IP Address) and click OK. 5. The Alarm Server displays in the list. Select the Connection and click OK. Note The checked item indicates the connection that is to be used. The selected row is used when the Resolve button is pressed. 54 GEI U WorkstationST Alarm Viewer

55 12 Historical Alarms The Alarm Viewer allows you to display alarm and event data from the short-term historical alarm data file collection on the connected Alarm Server. When no alarm data displays, the filters toolbar displays as follows: When alarm data displays, the filter toolbar displays as follows: Clicking the Find button displays the Find dialog box, used to find specific information in the alarm data displayed. Alarm data from one or more alarm data files displays in table form based on the filter selected from the drop-down list. Summary information in table or plotted form can also be displayed. Instruction Guide GEI U 55

 Note The checked item indicates the connection that is to be used. The selected row is used when the Resolve button is pressed 3. Click OK. 4.")
56 To display the historical alarms screen 1. From the View menu, select Connect 2. From the Remote Connection To WorkstationST Alarm Server dialog box, select the Alarm Server to use. (or Click Add a Connection, enter the Host (name or IP Address) and click OK to add the correct Alarm Server to the list.) Note The checked item indicates the connection that is to be used. The selected row is used when the Resolve button is pressed 3. Click OK. 4. From the View menu, select Show Historical Alarms. The Short Term Alarms tab is enabled, but no alarm data displays. 5. Select a filter to display the historical data from the files. 56 GEI U WorkstationST Alarm Viewer
57 Note If Local Mode is selected, the data is retrieved from the Historical Alarm Files on the local computer. If Remote Mode is selected, the data is retrieved from the Historical Alarm Files on the remote computer. When working with a short-term historical alarm data file collection: The number of rows returned is clamped at 50,000 unless a filter is defined and the Maximum Alarm Rows To Return option in the filter definition is non-zero. The text in the selected tab is Short Term Historical Alarms Unfiltered. Historical displays as the Alarm Source in the status bar Display Columns For Historical Alarms, the Alarm Viewer can display most of the columns available in the Live Alarms display, in addition to the following: Column Name Description Historical Alarm Columns Acknowledged Time Comments Composite State Override State Primary Language Comments Second Language Comments Severity Transition Reason Unit Type The time the alarm or event was last acknowledged The user comments displayed following the WorkstationST Use Second Language selection A string that represents the alarm state and all additional command states of the alarm. (L for Locked, A for Acknowledged, Sl for Silenced, Sh for Shelved, O for Out of Service) The Hold Override state of the alarm. (Yes = Overridden, No = Override Removed) The user comments in the primary language The user comments in the alternate language The severity of the alarm/event (1 is a message, 1000 is critical) The reason for the transition The type of Unit the alarm came from Instruction Guide GEI U 57

58 12.2 View a Single File The Historical information in a single alarm data file from a collection can also be displayed. To view data in a single file 1. From the Alarm Viewer File menu, select Open Alarm Data File. 2. Select an alarm data file. The data from that file displays. Note To restore viewing of all Alarm Data, the Alarm Data Display must be closed by selecting Close Alarm Data File from the File menu. 58 GEI U WorkstationST Alarm Viewer

59 12.3 View All Files Once the historical alarm file source has been selected, the information in the files can be displayed in various ways. Note To update the initial historical data display, select a filter from the drop-down list. Selecting a different filter always applies the new filter to the current alarm data file selected. When the Charts button is clicked, the alarm data displays in table form (the default). When the Summary button is clicked, summary information displays. From the Tree View, select Time Range Summary to display time range information, summary information for all devices, and summary information by device alarm type. Instruction Guide GEI U 59


60 From the Tree View, select Device Summary to display summary information for all devices and all alarm/event types. Alarm details include: Time range of the alarm Number of Locked/Unlocked transitions Number of Active/Normal transitions Note When the selection is changed to an item in the Device Summary, the corresponding alarm summary displays and a new chart button is added to the toolbar. No alarm summary information is displayed, and the chart button is removed from the toolbar if the Time Range Summary item is selected. Click the Charts button to display the selected chart type. 60 GEI U WorkstationST Alarm Viewer


61 The following are examples of the four different chart types that are available: Transitions Frequency A Pareto chart that is scaled to the largest frequency value found. Transitions Pareto A Pareto chart that is scaled to display the data scaled as percent of the total frequency found. A cumulative percent line from highest to lowest frequency displays. Instruction Guide GEI U 61


62 Priority A Pareto chart of the highest frequency by priority. The chart starts with the alarms grouped from highest priority to the lowest priority. Alarms Per Hour A bar chart displaying transition frequency by hour. 62 GEI U WorkstationST Alarm Viewer

63 Note Refer to the section Historical Chart Settings for Alarms per hour options. By selecting the alarm types for a single device in the tree, a Pareto chart of the alarms and events that occurred within the hour displays. Instruction Guide GEI U 63

64 Right-click anywhere in the chart area to display the Settings dialog box and select Historical Chart Settings to display options for the chart. 64 GEI U WorkstationST Alarm Viewer

65 13 Filters A filter contains one or more terms that can be configured. These terms, which correspond to the column names of the live or historical alarm data display, can be edited to provide filtering capability. Filters used in this application are pass-through filters. The alarm/event data displays if the evaluation of the filter is True for the alarm/event. Created filters are immediately available for use in both the live and historical displays Filter Collections A filter collection consists of one or more filters. Only one collection can be opened at one time. Individual filters can be added, modified or deleted within this collection. To create a new filter collection: from the File menu, select New Filter Collection. A new filter collection is created with a default filter named Filter1. Select Filter1 and the following screen displays. Select the Filter Definitions tab to display the filter collection in the Tree View. The collection and filter names can be modified. Instruction Guide GEI U 65

66 The Tree View displays all filters in the collection. The File Name used to store the filter collection. The filter Name and Description. Enter a number from 0 to 60 to specify the time in minutes the filter is allowed to be applied. Enter a value that limits the number of historical alarms that display. Refer to the following section, Alarm Filter Timeouts for additional information. The default configuration for a new filter added is Display All Alarms. 66 GEI U WorkstationST Alarm Viewer


67 13.2 Alarm Filter Timeouts With the release of ControlST V04.07, a Filter Timeout field has been added to the alarm filter definition. This allows a timeout value to be entered that specifies the time in minutes the filter is allowed to be applied when used on the live alarm display. The behavior is as follows: The number entered must be between 0 and 60 minutes. A 0 indicates the filter is to be applied indefinitely. The timeout only applies to the live alarm display. Other displays are not affected. When the filtered live alarm data screen is displayed, alarm filters can be selected as before. If a filter has a timeout defined, the alarm filter in the available filters drop-down list displays in a distinct color, with a clock icon to indicate that the time is limited to the time defined in each filter. Instruction Guide GEI U 67

68 After selection, the filter name displays with the clock icon and in the timed color. Upon expiration of the time specified, the filter selection reverts to Unfiltered as shown in the following figure. 68 GEI U WorkstationST Alarm Viewer
 to display a ToolTip with the equation for the current filter.")
69 13.3 Edit a Filter To edit a filter: from the Tree View, select the filter element name. A dialog box displays to allow you to edit the filter element. Rest the cursor over the filter name (Filter1) to display a ToolTip with the equation for the current filter. Note Alarm Class displays all alarm classes defined in the ToolboxST configuration for the current system Filter Element Names Acknowledge State filters on Acknowledge, Unacknowledged or both. Alarm Class displays a list of Alarm Classes. These Alarm Classes are read from the current system configuration if the option Use Local Workstation Alarm Configuration is set to True. You can right-click to add or delete Alarm Classes. Select the Alarm Class to include it in the filter. Alarm State filters on the Condition States of Normal and Active/Alarmed. (For event and SOE alarm types, the condition is always Normal.) and Analog Alarm States Hi, Hi Hi, Hi Hi Hi,Bad Quality, Lo, Lo Lo, Lo Lo Lo, Rate, Deviation, and Inhibited. Alarm Type filters on the type of alarm or event to display. The choices are Alarm, Event, SOE, Diagnostic, and Hold. Any combination may be selected. Description filters on the description of the alarm or event. Wildcard characters? and * are supported. Device Name displays the devices that are the source of the alarm/events. These devices are read from the current system configuration if the option Use Local Workstation Alarm Configuration is set to True. You can right-click to add or delete devices. Select the device to include it in the filter. Instruction Guide GEI U 69
70 Device Time specifies a number of time-filtering options for filtering on the time of the alarm or event. The options are: None No time specified for this filter. Absolute Time Range Specifies a time range for the filter. Absolute Time To Current Specifies an ever-increasing time Absolute Time Specifies a single point in time for the filter. The precision of the time value can be specified. Relative Time To Current Specifies a moving time window for the filter. Time entry units must be specified when entering a time for filtering. Time is managed and stored in Universal Time Coordinated (UTC) in the system. If using Local Time units, the time value must be expressed in local time. The application converts the time to UTC to perform any calculations or filtering. Note It is recommended that the option Time Type for Display be set to the same units as the units defined here. Locked State filters on Locked, Unlocked, or both. Plant Area filters on a logical area of the plant. The Plant Area is configured in tree form in the ToolboxST application and is associated with each alarm/event. The Plant Area cannot be edited. All or any portion of the tree may be used in the filter. Priority filters on the priority value associated with the alarm/event. The operators defined are <=, =, or >=. Quality filters on Good, Bad, or both. Good indicates the alarm information is current, Bad indicates the information is stale and is not updating on the Live alarm display. Rate filters on the rate value associated with the alarm/event. The operators defined are <=, =, or >=. Recorded Time specifies the same time-filtering options as in Device Time. This can filter on the received time of the alarm/event. The received time is the time that the Alarm Server received the alarm or event. This is used to troubleshoot time-sync problems. Service State filters on In Service, Out of Service, or Unused. Severity filters on the OPC AE Severity value of the alarm/event. The operators defined are <=, =, or >=. Silence filters on Silenced, Normal or both of the alarm or event. Shelved State filters on Shelve, Unshelve, or Unused. A Not Selected option is also available. Variable Alias filters on the alias name of the alarm or event. The definition can be a single variable or a list of variables. Wildcard characters? and * are supported. Variable Name filters on the alarm or event name. The definition can be a single variable or a list of variables. Wildcard characters? and * are supported Save a Filter Collection To save a filter collection: from the File menu, click Save Filter Collection (enter a unique name for the file). The file extension is.xml. The default directory can be specified in the alarm viewer options (Options/Settings/Alarm Viewer Settings/Local Settings/Alarm Configuration Root Path). 70 GEI U WorkstationST Alarm Viewer

71 14 Alarm Viewer Settings To access Alarm Viewer Settings: from the Alarm Viewer Options menu, select Settings. or Right-click any tab and select Settings from the shortcut menu. Alarm Description Language Alarm Help Alarm Description Display Language selects the default language for displaying alarm descriptions, alarm state information, and alarm/event help. These languages are defined in the ToolboxST application, primary and second languages. These can also be selected using the WorkstationST or ControlST icon in the taskbar notification area. Master Workstation Host Name is the host name that is the source of the Process Alarm/Diagnostics Help. Communications Ping Timeout is the time to wait, in milliseconds, when initially connecting to a remote host. The default is Instruction Guide GEI U 71
72 Filter Options Local Settings Add Default Filters, if True, opens the file DefaultFilters.xml (if found) and adds all contents to the new filter collection being created. The DefaultFilters.xml file is generated by creating and editing a set of filters and then saving them to the file named DefaultFilters.xml. This file must be located in the Filters folder of the Alarm Configuration Root Path. Load Last Used Filter, if True, loads the last filter file. The filters can then be selected and applied. User Defined Alarm Status History Filter Name is the name of the filter to locate and apply when selecting the Historical Status. Alarm Configuration Root Path sets the path to the Alarm Viewer root configuration directory. All views, filters, and sound filters are located under this directory. Alarm Export Path is the path used when the current alarm display is exported to a.csv file. Alarm Files Path is the path used when Use Local Workstation Alarm Configuration is set to False. Export CSV data with headers, if set to True, writes the headers when the alarm data is exported to a.csv file. If set to False, no headers are written. Only the visible columns are written. Use Local Workstation Alarm Configuration, if set to True, uses the workstation configuration on this computer. If set to False, uses the local Alarm Files Path to point to the alarm data to process. Startup Settings Display Style selects either a resizable, movable form or a fixed size and fixed position form. Show Main Menu, when True, displays the main menu. When False, the main menu is hidden. Show Startup Splash Screen, when True, displays the startup splash screen. When False, the startup splash screen is suppressed when the Alarm Viewer is started. Show Status Bar, when True, displays the status bar at the bottom of the screen. When False, the status bar is hidden. Show Toolbar, when True, displays the toolbar. When False, the toolbar is hidden. 72 GEI U WorkstationST Alarm Viewer
73 Viewer Display Options Alarm ID in Hex, when True, displays the alarm ID in hex. When False, the value is displayed as a decimal. Always On Top, when True, keeps the Alarm Viewer on top of all other windows. Enable Non-Translated Content displays only when the Alarm Viewer is configured to display in a language other than English. When True, it enables access to non-translated documentation and advanced features of the WorkstationST Alarm Viewer that are not translated into the selected display language. Image Size, sets the size of the images displayed on the Live and Historical toolbars. Main Font changes the font used for all items displayed. Show Text With Toolbar Buttons, when True, displays the text for each toolbar button displayed. Time Resolution Displayed selects the time data displayed (Milliseconds is the default) Time Type for Display defines the time type that displays. The selections are UTC Time, Site Time, or Local Time. Local and site settings use the local time zone to calculate the time for display. Enable Non-translated Content displays when displaying text in a language other than English. When False, it prevents access to the following features/documentation: View\Advanced\Show OPC AE Test Client View\Advanced\View Alarm Server Logs Help\Release Notes Help\How To Guides When changed to True, the following message displays: Setting this option to 'True' will enable access to features and documentation that may not be translated into the current Windows display language. After clicking OK, access to the listed features is enabled. When displaying English, this option is hidden and set to True, allowing access to all features and documentation. Instruction Guide GEI U 73

74 14.1 Live Settings 74 GEI U WorkstationST Alarm Viewer
75 Alarm Management Group Toolbar Enable Unconditional Acknowledge, Reset, and Silence All when set to True, enables the Acknowledgement, Resetting, or Silencing of all alarms, even if they have not been scrolled into view. Show Acknowledge All Command Button hides or displays the Acknowledge All Command button on the toolbar. Show Filter Collection Name hides or displays the filter collection name. Show Filters Available Label hides or displays the Filters Available label. Show Page Down Button hides or displays the Page Down button. Used to control scrolling when using a touch screen. Show Page Up Button hides or displays the Page Up button. Used to control scrolling when using a touch screen. Show Reset All Command Button hides or displays the Reset All Command button. Show Toolbar hides or displays this toolbar. Show Zoom In Button hides or displays the Zoom In Button. Used to increase the font size used for display. Show Zoom Out Button hides or displays the Zoom Out Button. Used to decrease the font size used for display. Alarm Management Toolbar Show Acknowledge/Unacknowledge Command Button Set hides or displays the Acknowledge/Unacknowledge Command button set. Show Alarm Help hides or displays the Alarm Help button. Show Lock/Unlock Command Button Set hides or displays the Lock/Unlock Command button set. Show Override/Remove Override Command Button Set hides or displays the Override/Remove Override Command buttons set. Show Reset Command Button hides or displays the Reset Command button. Show the In Service/Out of Service Command Button Set hides or displays the In Service/Out of Service Command button set on the toolbar. The Alarm Out of Service feature In the ToolboxST application must be enabled for this feature to be available. Show the In Shelve/Unshelve Command Button Set hids or displays the Shelve/Unshelve Command button set on the toolbar. The Alarm Shelving feature in the ToolboxST application must be enabled for this feature to be available. Show Toolbar hides or displays this toolbar. If the toolbar is not displayed, the functionality provided by this toolbar is disabled. Instruction Guide GEI U 75
76 Display Disable Blinking overrides the configured blink value in the Alarm Class definition for the system. Alarm Class configuration is defined in the ToolboxST System Editor. Enable Gray Scale when True, enables gray scale rendering and allows the Enable Vertical Colored Bar option to display. The Symbols column must be used to provide plant alarm conditions feedback. Enable Vertical Colored Bar provides alarm state feedback using a vertical colored bar displayed in the 2 nd and last column on screen. These are always displayed regardless of the alarm viewer windows size or scrolling position. If the Enable Gray Scale option is false, the Enable Vertical Colored Bar option is forced to false and is hidden in the options dialog. Notification Rate Threshold the threshold value for the maximum number of notifications allowed before an icon indicator is displayed. A value of 0 disables the icon. The update rate is set by the Rate Units selection. Rate Units the unit of time that notifications are accumulated before being reset back to 1. Row Height Percentage is the height of the row calculated as a percentage of the text height displayed. The value must be between 0 and 100. A value of 0 displays the most rows on screen. A value of 100 displays the fewest number of rows. Increase the number to improve readability. Show Background Alarm Balloon ToolTips, when True, displays a balloon ToolTip listing the number of active and unacknowledged alarms that are not displayed due to the filter being used. (Refer to the section Active Alarm Background Notification.) Show Column Headers, when True, displays the column headers. Hiding the headers prevents the reorganization of columns and prevents changing the selected sort direction. Show Dynamic Priority Display Button hides or displays the Dynamic Priority Display button. Used to display alarms based on cascading priorities. Show Horizontal Grid Lines is used to display or hide the lines. Show Only Priority One Alarms in Balloon ToolTip, when True, displays priority one alarms only in the balloon ToolTip. The Show Background Alarm Balloon ToolTips must also be set to True. Show Vertical Grid Lines is used to display or hide the lines. 76 GEI U WorkstationST Alarm Viewer
77 Sound Configuration Play Sound Continuously, when True, causes the sound configured for the highest-priority alarm to play repeatedly until the operator takes action to silence the alarm. Play Sound Continuously Repeat Delay is the time delay, in seconds, before repeating the sound for the highest-priority alarm. Play Sound Continuously must also be set to True. Time To Disable Mute Sound Button is the time delay, in minutes, before resetting the button when the Mute Sound Button is clicked. While the mute button is active, all sound is suspended. When this time expires, sound is played again. A value of 0 mutes the sound indefinitely. Sound Toolbar Show Alarm Horn Command Button displays or hides the Alarm Horn Silence Command button. Show Mute Sound Button displays or hides the Mute Sound button. Show Silence All Command Button displays or hides the Silence All Command button. Show Silence/Unsilence Command Button Set displays or hides the Silence/Unsilence Command button. Show Toolbar displays or hides this toolbar. If the toolbar is not displayed, the functionality provided by this toolbar is disabled. Sound will still be played if configured in the system. Voice Options Use Second Language Description Text, when False, uses the text description. When True, uses the second language description text as the phrase spoken when Voice is the sound type configured Historical Settings Display Enable Alarm Symbols when True displays alarm symbols in the Composite State column if alarm symbols have been configured for use in the control system. Enable Vertical Color Bar when True enables display of a vertical colored bar that tracks the alarm background color. Instruction Guide GEI U 77
78 14.3 Historical Chart Settings Active Transitions Bar Color Center Color for Active Transitions Bar Color is the color for the center of the Active Transition state bar when a chart is displayed. Edge Color for Active Transitions Bar Color is the color for the edge of the Active Transition state bar when a chart is displayed. Alarms Per Hour Alarm Type Center Color is the color for the center of the Alarm Type displayed. Alarm Type Edge Color is the color for the edge of the Alarm Type displayed. Diagnostic Type Center Color is the color for the center of the Diagnostic Type displayed. Diagnostic Type Edge Color is the color for the edge of the Diagnostic Type displayed. Event Type Center Color is the color for the center of the Event Type displayed. Event Type Edge Color is the color for the edge of the Event Type displayed. Hold Type Center Color is the color for the center of the Hold Type displayed. Hold Type Edge Color is the color for the edge of the Hold Type displayed. Increasing Time Table Sort Direction Set to True to sort the time labels in increasing order (from oldest time to newest time). Set to False to sort in decreasing order (from newest time to oldest time). The time display format is Month-Day Hour:Minute:Second. Show Time Label Sort Direction Set to True to display the hour time label on the x axis for data that is not defined for that hour. Set to False to skip displaying time for no data. SOE Type Center Color is the color for the center of the SOE Type displayed. SOE Type Edge Color is the color for the edge of the SOE Type displayed. Background Color Bottom Gradient Color is the gradient color at the bottom of the chart displayed. Top Gradient Background Color is the gradient color at the top of the chart displayed. Chart Options Distance Between Bar Groups is the distance in pixels between bar groups. Horizontal Grid, when True, draws the horizontal grid lines. Show Alarm/Event states for each variable displays the alarm state appended on the alarm/event name (variable). Show Alarm/Event types for each variable, when True, draws bars for each alarm/event type for all variables. Show Alias Names, when True, the Alias name displays in the chart. When False, the standard variable name display behavior is provided. The variable names are displayed on the bars and also displayed in the ToolTip. If the alias name to be displayed is blank, the variable name displays instead. Depending on the configuration, there can be a mixed display of alias and variable names on the same chart. Show Bar Text, when True, displays the text inside or above the bar as necessary. When False, no bar text is displayed. 78 GEI U WorkstationST Alarm Viewer
79 Show cumulative percent line plot, when True, draws the line connecting the first series of bars representing total percent of the data displayed. This option only works if the Chart Type selected is Pareto. Text Angle is the alarm/event display angle on the screen, and has a range of 0-90 degrees. Vertical Grid, when True, draws the vertical grid lines. Starting with the Deviations Transitions Bar Color, the remaining Transitions Bar Color options use the same definitions as explained previously in the Active Transactions Bar Code section of this list Deviation Transitions Bar Color The three alarm states (Hi, HiHi, and HiHiHi) designate increasing levels of severity, or concern, for an alarm in this category. (The higher it gets, the more critical it is.) Hi Transitions Bar Color HiHi Transitions Bar Color HiHiHi Transitions Bar Color Inhibited Transitions Bar Color The three alarm states (Lo, LoLo, and LoLoLo) designate increasing levels of severity, or concern, for an alarm in this category. (The lower it gets, the more critical it is.) Lo Transitions Bar Color LoLo Transitions Bar Color LoLoLo Transitions Bar Color Normal Transitions Bar Color Rate Transitions Bar Color Instruction Guide GEI U 79
80 15 Views With the View menu, a set of parameters can be configured to view in a given situation. When saved, the view will return to the same set of parameters at any time Create a View To create a view, you must first set the parameters to display in that view. To create a view 1. From the View menu, select Local Mode or Remote Mode, Show Live Alarms, and Show Historical Alarms as appropriate. Refer to the section Live Alarms. 2. Select the Live Alarm Data tab and organize the columns as they need to be displayed. Refer to the section Live Alarms, Organizing and Displaying Columns. 3. Sort the alarm data as required. Refer to the section Live Alarms, Sorting Alarm Data. 4. Create and name the necessary Filter Collection. Refer to the section Filters, Filter Collections. Note If you have filters defined from previous versions of Alarm Viewer, you can manually copy them to the Filters subdirectory. 5. From the Options menu, select Settings. Select Alarm Viewer Settings. Select Alarm Configuration Root Path. Click the ellipsis to display the Browse For Folder dialog box. 80 GEI U WorkstationST Alarm Viewer

81 6. Set the Alarm Configuration Root Path to a directory that contains all Filters, Views, and Sound Files in one location. It is recommended that the root directory be named AlarmViewerConfiguration. The Filters, Views, and Sound Files subdirectories are created automatically under the root directory. Note At this point, the Alarm Viewer should be configured to display all the necessary parameters. Once you ensure this, proceed with the final step. 7. From the File menu, select Save View As. The file browser defaults to the View subdirectory. Save the view using a name that describes the view state. Or 8. Right-click any tab and select Save View As from the shortcut menu. Instruction Guide GEI U 81
82 15.2 Open a Saved View To open a saved view: From the File menu, select Open View. Or 1. Right-click any tab and select Open View from the shortcut menu. 2. Select the desired view, then click Open. The selected view displays. Note The Short Term Historical Alarms tab does not automatically apply and display the filter selected. You must apply the filter to update the Short Term Historical Alarms display. To apply a filter to the Short Term Historical Alarms display: with the Alarm Viewer, open to the correct view, select the Short Term Historical Alarms tab and from the drop-down list, select the required filter Open a Recently Used View To open a view from the Recent Views list: from the File menu, select Recent Views. A list of recently used views displays. or Right-click any tab and select Recent Views from the shortcut menu Default View When the Alarm Viewer is started, it searches for the AlarmViewerDefault.AvView view file. This is the saved default view and must be created and saved in the same manner as all other view files CIMPLICITY* Alarm Status History View This view is used to implement the Alarm Status History feature from screen objects in CimView. The feature requires the CimplicityAlarmStatusHistory.AvView file be defined and saved. This view generates a historical alarm report on the variables passed into the WorkstationST Alarm Viewer when started from CimView. Note Refer to the WorkstationST CIMPLICITY Advanced Viewer Integration Instruction Guide (GEI ). This view file is also used to animate the alarm button on the navigation bar in CimView. The animation is controlled by an alarm status client running in the background when CimView is running. This client reads the CimplicityAlarmStatusHistory. AvView file to perform the connection to the designated alarm servers. A filter named AlarmStatusFilter is created to allow only process alarms to be received by the alarm status client. 82 GEI U WorkstationST Alarm Viewer
83 Create a CimplicityAlarmStatusHistory View File To create the CimplicityAlarmStatusHistory View file 1. From the Start menu, select All Programs, GE ControlST, and WorkstationST Alarm Viewer. The WorkstationST Alarm Viewer screen displays. 2. From the View menu, select Local Mode or Remote Mode to select the Alarm Server to use. 3. From the Options menu, select Settings to display the Settings dialog box. 4. Select Alarm Viewer Settings, expand Local Settings, and note the Alarm Configuration Root Path. Note The Short Term Historical Alarms tab display (such as column order, column visibility, and sort order can be customized by right-clicking the column header before saving the the view state. 5. From the File menu, select Save View As. 6. Verify the file path matches the Alarm Configuration Root Path noted earlier. 7. Select File name and enter CimplicityAlarmStatusHistory. 8. Click Save. Instruction Guide GEI U 83

84 16 Alarm Reports Note Starting with ControlST V04.04, the WorkstationST Alarm Viewer includes an Alarm Reports feature. The Alarm Reports feature analyzes alarm data to compute and display the performance metrics of the alarm system based on ISA 18.2 recommendations. All the metrics are computed based on the alarm data available for the reporting period as defined by the selected alarm filter. The reporting period is selected by the user and is sorted on a range of dates, hours, and minutes. In addition to frequency-based reports the Alarm Reports feature provides for the creation of alarm metrics, including the most frequent alarms, alarm flood, stale alarms, and chattering alarm reports. These reports would be used as part of the continuous improvement of the control system. To display Alarm Reports From the Alarm Viewer View menu, select Show Alarm Reports. 84 GEI U WorkstationST Alarm Viewer

85 The Alarm Reports tab displays with the Alarm Reports options, including Filter Criteria. Instruction Guide GEI U 85

86 16.1 Report Options The following figure displays the report sorting options; Alarm Reports, Report Configuration, and Filter Criteria including Time Range, Alarm Types, Devices, Priority, and Plant Area. Note When creating reports that are targeting ISA 18.2 metrics, expand the Alarm Types section and select Alarm only. This ensures that all reports generated are for process alarms only. 86 GEI U WorkstationST Alarm Viewer
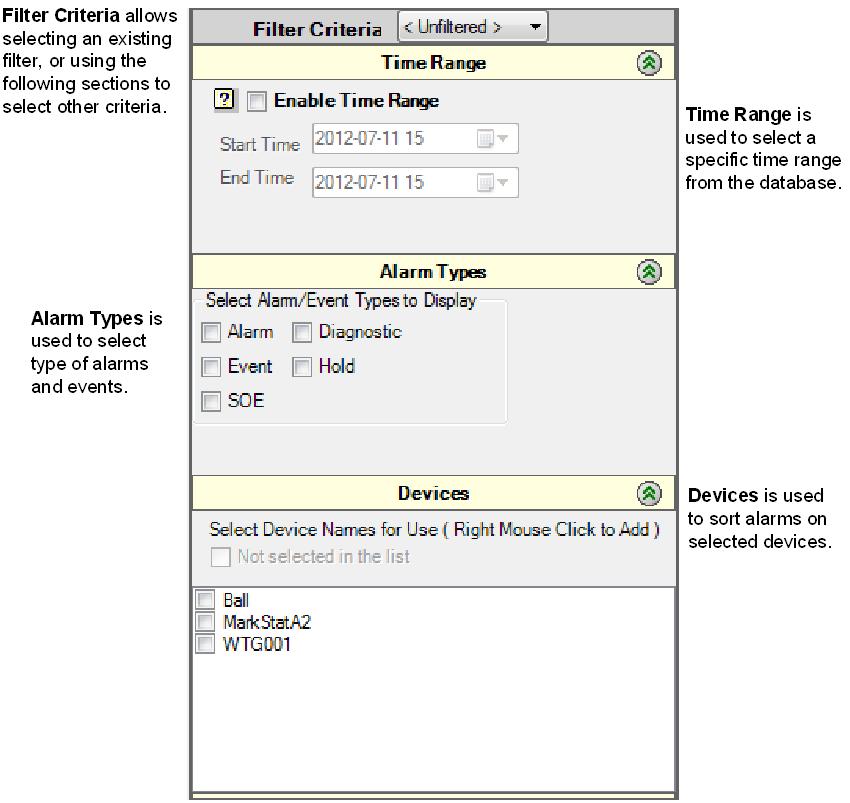
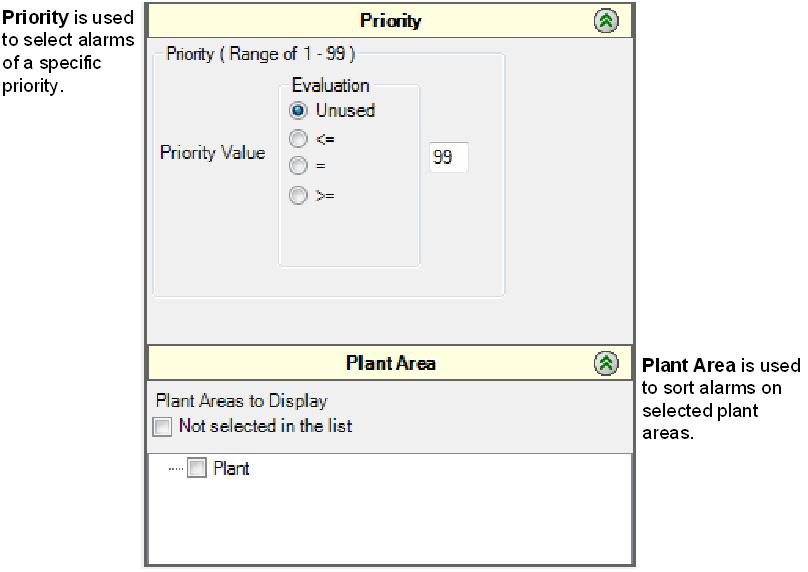
87 Instruction Guide GEI U 87
88 Refer to the following sections for additional information on the reports available Alarm Reports Alarm Performance Metric Report Select to display the Alarm Metrics Report. Alarms Per Day Select to display the number of alarms created per day during the selected time range. Alarms Per Hour Select to display the number of alarms created per hour during the selected time range. Alarms Per Ten Minutes Select to display the number of alarms created per ten minute period during the selected time range. Note Refer to the section Terms for a definition of alarm flood and alarm chattering. Alarm Flood Report Select to display the number of alarm floods, as defined in the section Percent Display Options, during the selected time range. Chattering Alarms Select to display chattering alarms. Use the Chattering Alarm Definition options to define the chattering parameter (such as an alarm transitioning three times in a one minute period). Stale Alarms Select to display alarms that remain in effect continuously for more than 24 hours. Top Most Frequent Alarms Select to display the most frequently occurring alarms. Use the Maximum Alarm Quantity to determine the setpoint (such as top 10, top 15, top 20 and so forth) Report Configuration End Flood Alarm Quantity Defines the quantity of alarms that must not be exceeded within the defined Flood Time Interval for the alarm flood to end. Flood Time Interval The period of time to use to define the alarm flood. (For example, 10 alarms in a 10 minute period.) Quantity Displays when creating a Top Most Frequent Alarms report. Defines the number of alarm variables to return for display. The alarms with the highest transition count display (such as top 10, top 15, top 20, and so forth). Restore Defaults Restores the defaults as recommended in the ISA 18.2 specification. Start Flood Alarm Quantity Defines the quantity of alarms that must be exceeded within the defined Flood Time Interval for the alarm flood to be detected. Show Threshold Quantity on Bar Chart Used to determine the number of time slices that exceed the Threshold Quantity. When selected, displays a horizontal line at the designated Threshold Quantity level on the bar chart. Show Percent Pie Chart Select to display the Alarm Quantity Percentage Pie Chart tab and chart that displays the percentage of alarms above and below the designated Threshold Quantity. Threshold Quantity This is the transitions value used as a threshold to calculate the percentage of time that exceeds this value. It is the actual number of transitions displayed on the bar chart. Transition Quantity Displays when creating a Chattering Alarms report. This defines the number of transitions that must be exceeded within the defined Time Interval for the chattering alarm to be detected. Time Interval Displays when creating a Chattering Alarms report. This is the time period in minutes over which the chattering alarms option is defined (such as an alarm transitioning three times in a one minute period). Note When creating an Alarm Performance Metric Report or a Stale Alarms report the Report Configuration section does not display. 88 GEI U WorkstationST Alarm Viewer
89 Filter Criteria A drop-down list is provided to allow selection of filter already defined in the Alarm Viewer Time Range Enable Time Range Select to enable the Start Time and End Time options. When not selected, the entire database is used. Start Time Select the time at which to start sorting the database. Stop Time Select the time at which to stop sorting the database. Note The format of the Start Time and Stop Time criteria is based upon the Alarm Reports option selected (Day, Hour, or Ten Minutes) Alarm Types Select the type of alarm to display. The choices are Alarms, Events, Diagnostics, SOE, or Holds. Any combination can be selected Devices This filters on the devices that are the source of the alarms Priority Filters on the priority value associated with the alarm or event. The operators defined are <=, =, or >=. The range is from 1 to 99 with 1 being the highest priority Plant Area This filters on a logical area of the plant. The Plant Area is configured in tree form in the ToolboxST application and is associated with each alarm/event. The Plant Area cannot be edited. All or any portion of the tree can be used in the filter. Instruction Guide GEI U 89


90 16.2 Create Alarm Report To create an alarm report Note When Alarms Per Day, Alarms Per Hour, or Alarms per Ten Minutes is selected, the appropriate Threshold Quantity is enabled in the Report Configuration section. 90 GEI U WorkstationST Alarm Viewer


91 Note When Unfiltered is selected, the Filter Criteria cannot be saved for future use. To save a filter selection, an existing filter must be selected from the drop-down menu. Instruction Guide GEI U 91


92 When creating an Alarm Flood Report, the Alarm System Flood Definition criteria display. A bar chart is not created. 92 GEI U WorkstationST Alarm Viewer


93 When creating a Top Most Frequent Alarms report, the Frequent Alarm Maximum Quantity option displays. When creating a Chattering Alarms report, the Chattering Alarm Definition criteria display. A pie chart is not created. Instruction Guide GEI U 93

94 When creating a Stale Alarms report, there are no display options available and a pie chart is not created. When creating an Alarm Performance Metric Report, the Report Configuration section changes to allow entry of criteria for all other reports. A Restore Defaults option is included to set the criteria to ISA standards. Data displays in tabular form only. 94 GEI U WorkstationST Alarm Viewer

95 Click Create Report to display the Alarm Reports tabs and associated reports. Note After selecting Create Report a progress dialog box displays. The amount of time it takes to create the report varies based upon the size of the database. Instruction Guide GEI U 95
, right-click the header row and select Organize Columns to configure which columns display.")
96 16.3 Report Results The following are representative samples of the reports created: Note When Alarms Per Day, Alarms Per Hour, or Alarms per Ten Minutes is selected, the tabs and reports display in the corresponding time segments. Note For all tabular data reports (first tab in each report), right-click the header row and select Organize Columns to configure which columns display. Report Configuration Displays the report configuration options and their selected values. This tab displays for each type of report created. 96 GEI U WorkstationST Alarm Viewer


97 Alarm Performance Metric Report Displays the Alarm Metrics Report in tabular form. Alarm Quantity Per Hour Data Displays the report data in one hour segments in tabular form. Instruction Guide GEI U 97

98 Alarm Quantity Per Hour Bar Chart Displays the data in one hour segments in bar chart form. From the Report Configuration section, the Threshold Quantity entered displays as a line. 98 GEI U WorkstationST Alarm Viewer


99 Alarm Quantity Percentage Pie Chart Displays in blue the percentage of hours that exceeds the Threshold Quantity entered in the Display Options section. Alarm Flood Summary Displays the time periods when an alarm flood has occurred in tabular form. Instruction Guide GEI U 99

100 Alarm Flood Load Percentage Displays the number of time periods during which a defined alarm flood occurs as a percentage of the selected time range. (For example, 10 alarms in a 10-minute period over the selected 5-day time range.) A breakdown of the selected alarm types, how many floods they contributed, and their percentage of overall time displays. Top Occurring Alarm Data Displays the Top Most Frequent Alarms in tabular form. 100 GEI U WorkstationST Alarm Viewer

101 Top Occurring Alarm Data Bar Chart Displays the Top Most Frequent Alarm data in bar chart form. Instruction Guide GEI U 101
102 Top Occurring Alarm Percentage Displays in orange the Top Most Frequent Alarms as a percentage of the total alarm load. 102 GEI U WorkstationST Alarm Viewer

103 Chattering Alarm Data Displays the Chattering Alarms report data in tabular form. Instruction Guide GEI U 103


104 Chattering Alarm Data Bar Chart Displays the Chattering Alarm report data in bar chart form. Stale Alarm Data Displays the Stale Alarm report data in tabular form. 104 GEI U WorkstationST Alarm Viewer

105 Stale Alarm Data Bar Chart Displays the number of stale alarms by duration in bar chart form. Instruction Guide GEI U 105
106 17 Alarm Help The process and diagnostics Alarm Help display and their associated alarm commenting capabilities are integrated into the Alarm Viewer. Alarm Help is displayed by one of the following methods: Click the Alarm Help Browser icon. Select a single process alarm or diagnostic alarm and click the Alarm Help icon. Right-click a single process or diagnostic alarm and select Alarm Help from the context menu. Right-click a single process or diagnostic alarm and select Alarm Attributes from the context menu Directory Structure Alarm Help uses the existing Master Location defined in the Property Editor in the ToolboxST System Editor. It adds the Help subdirectory to the directory structure used by the Alarm Viewer. Two additional subdirectories required are ProcessAlarms and Diagnostics. The directory structure created uses the defined component names to contain the help for that component. The diagnostics Help is configured by device type. The following is an example of the directory structure: MasterDirectory is the root directory on the Master Workstation as defined in the ToolboxST application. Help is the subdirectory that defines the start of the help file collection. This subdirectory is required, and must be named as displayed. Diagnostics is the subdirectory that defines the start of the diagnostics section. This subdirectory is required, and must be named as displays. Subdirectories such as AEPA are specific Distributed I/O packs used in the system. ProcessAlarms is the subdirectory that defines the start of the process alarms section. This subdirectory is required, and must be named as displayed. Ews1 is a name of a WorkstationST component. G1 and G2 are component names. TMRM6E is a Mark VIe component. 106 GEI U WorkstationST Alarm Viewer
107 17.2 Process Alarms Process alarm Help is managed on a per instance basis. This requires a file for each component and each variable, with the correct suffix, to display Help in Alarm Viewer. Help for a variable that is identical for G1 and G2 must also be copied into both G1 and G2 folders. An example of the process alarm help directory with a help file defined is as follows: The file must use the format <Variable>.<language>.<extension> where: <Variable> is the variable name as defined in the ToolboxST application without the device prefix. <Language> is the language identifier in the Name column of the Language Naming table. (Refer to the Resource Translation Manager Instruction Guide (GEI ) for a list of language names and their culture and subculture abbreviations.) <Extension> is the required file extension (for example,.txt,.htm, and so on). A properly named file is L63QTX.en.txt, which indicates the file is for the variable L63QTX, is authored in English, and is a standard text file. Note Process alarm help files can have the extension.txt, rtf, htm, or chm. If a set of files is located in this directory, the order txt, htm, rtf, chm is used to display the file. The first one found is displayed. The name of the file is not case-sensitive Diagnostic Alarms Diagnostic alarm Help is managed on a per type basis. An example of the directory used for Diagnostics is as follows: The file must use the format <Type>Diags.<language>.chm where: <Type> is the component type, usually distributed I/O packs (PDOA, PAIC, and such) but may also be UCCA or ALARMSERVER. Diags is the required string appended to the Type (for example PAICDiags) Instruction Guide GEI U 107
108 <Language>is the language identifier in the Name column of the Language Naming table. (Refer to the Resource Translation Manager Instruction Guide (GEI ) for a list of language names and their culture and subculture abbreviations.) The Alarm Viewer allows you to determine which language to use when detecting the correct file for display. chm is the required file extension. Diagnostics help files must be defined as chm files A properly named file is PAICDiags.en.chm, which indicates the file is for a PAIC pack, is authored in English, and is a standard chm file. Note The file name is not case-sensitive. Note For information on how MarkV Diagnostic alarms are defined, refer to the ControlST Software Suite How-to-Guides (GEH-6808), the section How to Convert a Mark V Component for Use in ControlST Applications. 108 GEI U WorkstationST Alarm Viewer
109 17.4 Alarm Help Comments Note Refer to the section Comments Tab. There are two types of comment files; user comment and comment lock files. These files are created by the Alarm Viewer when the customer adds or modifies comments, so the user does not need to create the file separately User Comments File A comment file uses the following formats: The Process Alarms format is <Variable>Comments.<language>.xml where: Variable is the name of the process alarm as defined in the ToolboxST application. Comments is a constant string added to the variable name. <Language> is the language identifier in the Name column of the Language Naming table. (Refer to the Resource Translation Manager Instruction Guide (GEI ) for a list of language names and their culture and subculture abbreviations.) xml is the required file extension of xml. The Diagnostics format is <Type>Comments.<language>.xml where: <Type> is the component type, usually distributed I/O packs (PDOA, PAIC, and such) but may also be UCCA or ALARMSERVER. Comments is the required string appended to the Type (for example PAICComments). <Language> is the language identifier in the Name column of the Language Naming table. (Refer to the Resource Translation Manager Instruction Guide (GEI ) for a list of language names and their culture and subculture abbreviations.) xml is the required file extension. A properly named file is PaicComments.en.xml, which indicates that this is a comment file for a PAIC pack type, is authored in English, and is an xml file Comment Lock File The comment lock file contains the computer name and user ID of the user currently editing the User Comments file. This information displays on the Alarm Help Viewer Comments tab to notify all users that the User Comments file is being edited. The file is created and managed by the Alarm Viewer. The format is: <Variable>Comments.lock.txt for process alarms and <Type>Comments.lock.txt for component type Instruction Guide GEI U 109


110 17.5 Alarm Viewer The Alarm Viewer allows you to browse available help files, view live and historical alarm help in either the primary or second language, and view and enter comments through the Alarm Help Viewer Alarm Help Browsing If the Master Workstation Host is not defined when the Alarm Viewer is started, the Alarm Help Browser button is unavailable. Disabled Alarm Help Browser icon. You must enter the Master Workstation Host in the Settings dialog box. To set the Master Workstation Host Name: from the Alarm Viewer Options menu, select Settings. Enter the Master Workstation Host Name. After it is entered, the host name is resolved and the Master Workstation Path is retrieved. If an error is detected, the host name is not set. The Master Host and Path in the ToolboxST application must be fixed. After the Master Host and Path are validated, the Alarm Help Browser button is enabled. Alarm Help Browser Click the browser button to display a dialog box that allows you to navigate all defined alarm and diagnostic help files. 110 GEI U WorkstationST Alarm Viewer


111 Navigate to the appropriate item to display the help file. The Tree View displays the existing master directory and all its subdirectories. A document that can be displayed is represented by the Document icon. When the icon is selected, the file is read on demand from the Master Workstation and written locally to a temporary (temp) directory. ProcessAlarms help displays on the Help tab in the Summary View of the Alarm Help Viewer dialog box. Diagnostics help only displays when the CHM viewer is used. It does not display in the Summary View. Instruction Guide GEI U 111

112 Note If the Master Workstation host name is not set, an error displays in the status bar, and only the root names display in the Tree View Selected Language Display The Alarm Viewer language choices are set in the ToolboxST System Editor using the Primary Language and Second Language options in the Property Editor. The display language can be selected by right-clicking the WorkstationST or ControlST icon in the taskbar notification area and selecting or deselecting the Use Second Language option. From the Alarm Viewer Help dialog box, the signal name language can be selected from a drop-down menu. After the language is selected, the display refreshes and Help is displayed in the selected language. If a document is not defined in Spanish (the signal name language), the document icon is missing and the Help tab is blank. The following screen displays: 112 GEI U WorkstationST Alarm Viewer

 enables the Alarm Help icon and the Alarm Help shortcut menu item.")
113 Live Alarm Display Help In a live alarm display, you can select a single process alarm or diagnostic by selecting the row. Alarm Help is enabled only if a single item is selected and the variable type is a Process Alarm or a Diagnostic type. Alarm Help is available from the live alarm toolbar and the alarm shortcut menu. Examples: Live alarms actively update without selecting rows. The selection of a single Process Alarm or Diagnostic (row is highlighted in blue) enables the Alarm Help icon and the Alarm Help shortcut menu item. The Alarm Help icon displays on the toolbar and when the mouse pointer is held over it, a ToolTip displays. You can also right-click an alarm and select Alarm Help from the drop-down menu. Instruction Guide GEI U 113

114 When Alarm Help is selected, the Alarm Viewer Help dialog box displays, the Tree View expands, the correct item is selected, and the corresponding Help content displays. All file types, except chm files, display in the Summary View. Note Help displays for a single process alarm/diagnostic only Alarm Help Viewer Comments Tab The Alarm Help Viewer supports customer-defined comments. To enter comments: from the Alarm Help Viewer, select the Comments tab. The R icon shows that the Comment tab is in read-only mode. Click the R icon to change to edit mode. 114 GEI U WorkstationST Alarm Viewer


115 The icon changes to L to indicate it is locked for commenting by the displayed user. At this point, the Comment Lock file gets created. This lock is also displayed to any other user that may have the same alarm help open. From the Tree View, right-click the Comments item and select Add Comment or Modify Comment from the drop-down menu. Comments are displayed by creation date and time. All comments for that date are displayed. The red page indicates the Comment has been edited but has not yet been saved. Click the L icon to return the file to the read-only mode. Click the Save icon. This creates the Comment file, which is saved in the format for the selected language. Instruction Guide GEI U 115
Procidia iware AlarmWorX32. AlarmWorX32 Viewer January 2010
 Procidia iware AlarmWorX32 AlarmWorX32 Viewer Siemens Protection AG 2008. notice All / Copyright rights reserved. notice Introduction / Contents Procidia iware is an operator interface software designed
I/A Series A 2 Software FoxAlert Alarm Manager
 Product Specifications I/A Series A 2 Software FoxAlert Alarm Manager PSS 21S-2B2 B4 Current Alarms Display Most Recent Alarms Display Summary Displays By Status Alarm History Display An Extensive Collection
ArchestrA Direct Connect
 Table of Contents ArchestrA Direct Connect... 1 Introduction... 1 ArchestrA Direct Connection... 1 ArchestrA Data Source Definition... 2 Data Source Definition... 2 Importing Alarms from ArchestrA... 6
Monitor Alarms and Events
 This chapter contains the following topics: What Are Alarms and Events?, page 1 How are Alarms and Events Created and Updated?, page 2 Find and View Alarms, page 3 Set Alarm and Event Management Preferences,
Oracle Communications Performance Intelligence Center
 Oracle Communications Performance Intelligence Center System Alarms Guide Release 10.2.1 E77506-01 June 2017 1 Oracle Communications Performance Intelligence Center System Alarms Guide, Release 10.2.1
Avigilon System Integration Guide. for the Avigilon Control Center and Access Control Manager
 Avigilon System Integration Guide for the Avigilon Control Center and Access Control Manager 2014-2017, Avigilon Corporation. All rights reserved. AVIGILON, the AVIGILON logo, ACC, AVIGILON CONTROL CENTER,
Avigilon Control Center 5 System Integration Guide
 Avigilon Control Center 5 System Integration Guide for Paxton Net2 Access Control Systems 2014 Avigilon Corporation. All rights reserved. Unless expressly granted in writing, no license is granted with
Monitoring Operator Guide. Access Control Manager Software Version
 Monitoring Operator Guide Access Control Manager Software Version 5.10.10 2018, Avigilon Corporation. All rights reserved. AVIGILON, the AVIGILON logo, ACCESS CONTROL MANAGER, ACM, ACM VERIFY AND TRUSTED
Managing Network Alarms and Events
 10 CHAPTER Prime Performance Manager allows you to view alarms and events that occur in your network. The following topics provide information about displaying network alarms and events: Displaying Active
Managing Network Alarms and Events
 9 CHAPTER Prime Performance Manager allows you to view alarms and events that occur in your network. The following topics provide information about displaying network alarms and events: Displaying Active
Avigilon System Integration Guide. for the Avigilon Control Center and Access Control Manager
 Avigilon System Integration Guide for the Avigilon Control Center and Access Control Manager 2014-2016, Avigilon Corporation. All rights reserved. AVIGILON, the AVIGILON logo, AVIGILON CONTROL CENTER,
Monitor Alarms and Events
 What Are Alarms and Events?, page 1 How are Alarms and Events Created and Updated?, page 2 Which Events Are Supported?, page 5 Set Alarm and Event Management Preferences, page 5 Interpret Event and Alarm
DeltaV Operate. Product Data Sheet DeltaV Operate December 2006 Page 1. Introduction. Benefits
 December 2006 Page 1 You can easily manage your process with. Powerful operator interface, optionally up to four monitors Alarms prioritized by user Secure, standard operating desktop Intuitive graphics
Lighting Xpert Insight User Manual
 Lighting Xpert Insight User Manual Table of Contents 1 About This Document... 3 1.1 Key Terms... 3 1.2 Related Fifth Light Documentation... 3 2 Lighting Xpert Insight Overview... 4 2.1 Key Features...
Avigilon Control Center 5 System Integration Guide
 Avigilon Control Center 5 System Integration Guide with Hirsch Velocity INT-HIRSCH-B-Rev1 2012 2014 Avigilon Corporation. All rights reserved. Unless expressly granted in writing, no license is granted
Avigilon System Integration Guide. Avigilon Control Center with AMAG Symmetry Security Management System 7.0
 Avigilon System Integration Guide Avigilon Control Center with AMAG Symmetry Security Management System 7.0 2013-2016, Avigilon Corporation. All rights reserved. AVIGILON, the AVIGILON logo, HDSM, HIGH
Architectural and Engineering Specification for a Security Management System. StarNet 2
 Architectural and Engineering Specification for a Security Management System StarNet 2 Jan 2, 2018 Page 1 of 12 AE-S2-IN-R1-EN-01/18 This document is intended to provide performance specifications and
Experion PKS Operator Course EXP01R201 06/2004 Rev 01
 Experion PKS Operator Course EXP01R201 06/2004 Rev 01 COURSE: Experion PKS Operator Course REVISION: 10 June, 2004 Honeywell IAC courseware is subject to change without notice. Honeywell IAC assumes no
DeltaV Operate. DeltaV Operate. Introduction. DeltaV Product Data Sheet. Robust and secure plant operations
 February 2016 Page 1 DeltaV Operate You can easily manage your process with. Robust and secure plant operations Powerful operator interface, optionally up to four monitors Constant visibility and access
SPECTRUM Web Operator
 Notice Copyright Notice Copyright 2001 by Aprisma Management Technologies, Inc. All rights reserved worldwide. Use, duplication, or disclosure by the United States government is subject to the restrictions
Avigilon Control Center System Integration Guide
 Avigilon Control Center System Integration Guide with Velocity INT-HIRSCH-A-Rev3 Copyright 2013 Avigilon. All rights reserved. No copying, distribution, publication, modification, or incorporation of this
Alarm Coordination Connected Components Building Block. Quick Start
 Alarm Coordination Connected Components Building Block Quick Start Important User Information Solid state equipment has operational characteristics differing from those of electromechanical equipment.
Using ANM Mobile CHAPTER
 CHAPTER 19 Date: 3/22/13 This chapter describes Cisco ANM Mobile, which allows you to access your ANM server or ANM Virtual Appliance and manage your devices using a mobile device such as an iphone or
HERCULES 6 GRAPHICS SYSTEM
 HERCULES 6 GRAPHICS SYSTEM USER MANUAL Protec Fire Detection PLC, Protec House, Churchill Way, Nelson, Lancashire, BB9 6RT. Telephone: +44 (0) 1282 717171 Fax: +44 (0) 1282 717273 Web: www.protec.co.uk
Manual# User s Manual. 200E Series. DCU 210E/208E Diesel Engine Control Unit RP 210E Remote Panel
 Manual# 1006494 User s Manual 200E Series DCU 210E/208E Diesel Engine Control Unit RP 210E Remote Panel User's Manual Rev. 1.0 Marine Pro 200E Series ~~~ DCU 210E Diesel Engine Control Unit DCU 208E Diesel
FactoryTalk Alarms and Events. System Configuration Guide
 FactoryTalk Alarms and Events System Configuration Guide Important user information Read this document and the documents listed in the additional resources section about installation, configuration, and
Technical Publications. FactoryTalk Alarms and Events System Configuration Guide
 Technical Publications FactoryTalk Alarms and Events System Configuration Guide Important user information Read this document and the documents listed in the additional resources section about installation,
Manual# User s Manual. DCU 410/408 Engine Control Unit RP 410 Remote Panel FW 2.3
 Manual# 1100268 User s Manual DCU 410/408 Engine Control Unit RP 410 Remote Panel FW 2.3 Table of Content GENERAL INFORMATION... 3 ABOUT THIS MANUAL... 3 400 SERIES OVERVIEW... 3 Available Modules...
Patriot Systems Limited
 COPYRIGHT 1997 - The Patriot Systems Ltd. Patriot Alarm Monitoring Automation Package is licensed for use on one computer, by the original person, or company, or organization whose name is registered with
Getting Started with Live Exceptions
 Getting Started with Live Exceptions Live Exceptions provides alarm reporting by identifying problems that include delay, errors, failures, security, or configuration changes. The Live Exceptions Browser
Alarm Client. Installation and User Guide. NEC NEC Corporation. May 2009 NDA-30364, Revision 9
 Alarm Client Installation and User Guide NEC NEC Corporation May 2009 NDA-30364, Revision 9 Liability Disclaimer NEC Corporation reserves the right to change the specifications, functions, or features,
2017/11/16 P a g e 1
 2017/11/16 P a g e 1 Contents What s New... 2 Fixes... 3 Driver Updates... 3 New Sensors... 3 New Features... 3 How To... 4 Security... 4 Auditing... 6 Smart UI/MAPS Title 21 CFR Part 11 Auditing... 6
Alarm Manager Plug-in
 Alarm Manager Plug-in User s Guide While every attempt is made to ensure both accuracy and completeness of information included in this document, errors can occur, and updates or improvements may be implemented
System Galaxy Quick Guide
 System Galaxy Quick Guide CONFIGURATION AND OPERATION Integrating CCTV with System Galaxy JAN 2019 SG 11.1.0.2 System Galaxy Quick Guide For CCTV Integration Configuration & Operation Information in this
Operation Manual Fighter ProVision Software. Version: 0.0 Revision: 1
 Operation Manual Fighter ProVision Software Version: 0.0 Revision: 1 TABLE OF CONTENTS 1. Introduction 5 2. Software Installation 5 3. PC Users 6 3.1 Introduction 6 3.2 Default Code 6 3.3 Edit PC User
Weekly Testing of Dedicated Smoke Control Dampers - Metasys System Extended Architecture
 Weekly Testing of Dedicated Smoke Control Dampers - Metasys System Extended Architecture Code No. LIT-1201743 Release 1.2 Issued Date July 30, 2004 Supersedes Document Introduction.................................................
3D_ISS. Integrated Software System. User Guide Manual
 3D Digital Design & Development LTD 58/60 Edward Road Tribec House New Barnet EN4 8AZ 020 8440 7060 3D_ISS Integrated Software System User Guide Manual Copyright 2014 3D Digital Design and Development
Laptop / PC Programming Manual
 Laptop / PC Programming Manual Doc. # Fire PC Program rev B 01.07 This Document is property of Evax Systems, Inc. The Evax Fire Solutions Programmer Components 2 1.0 System Setup 4 1.1 Interface Setup
MultiSite Manager. Setup Guide
 MultiSite Manager Setup Guide Contents 1. Introduction... 2 How MultiSite Manager works... 2 How MultiSite Manager is implemented... 2 2. MultiSite Manager requirements... 3 Operating System requirements...
CompleteView Alarm Client User Manual. CompleteView Version 4.6.1
 CompleteView Alarm Client User Manual CompleteView Version 4.6.1 Table of Contents Introduction... 1 Overview...2 System Requirements...2 Configuration... 3 Starting the Alarm Client...3 Menus...3 File
Alarm Notification Manager
 Titlepage Alarm Notification Manager SPECTRUM Enterprise Manager Application & Gateway Summary of Changes Alarm Notification Manager Version Date Reason for Change Description of Change 9031308-00 Feb
Alarms and Events. Defining Alarm Conditions. Database-Generated Alarms
 9 Defining Alarm Conditions Database-Generated Alarms The LookoutDirect alarm service keeps track of error messages and any process elements you have defined alarm conditions for. You can define alarm
System 800xA Operations
 System 800xA Operations System Version 5.1 Power and productivity for a better world TM System 800xA Operations System Version 5.1 NOTICE This document contains information about one or more ABB products
Yokogawa DX Ethernet Driver Help Kepware Technologies
 Yokogawa DX Ethernet Driver Help 2012 Kepware Technologies 2 Table of Contents Table of Contents 2 4 Overview 4 Device Setup 5 Communications Parameters 7 Optimizing Your Ethernet Communications 9 Data
Manual# User s Manual. 200 Series. DCU 210/208 Diesel Engine Control Unit RP 210 Remote Panel
 Manual# 1100334 User s Manual 200 Series DCU 210/208 Diesel Engine Control Unit RP 210 Remote Panel Rev. March 2012 User's Manual for the Marine Pro 200 Series ~~~ DCU 210 Diesel Engine Control Unit DCU
Avigilon Control Center 5 System Integration Guide. with STENTOFON AlphaCom. INT-STENTOFON-C-Rev1
 Avigilon Control Center 5 System Integration Guide with STENTOFON AlphaCom INT-STENTOFON-C-Rev1 2013 2014 Avigilon Corporation. All rights reserved. Unless expressly granted in writing, no license is granted
Introduction. Introduction
 M-Alarm User s Guide 1-1 Chapter 1 Introduction Introduction M-Alarm allows the user to view, store, and manipulate current alarms received by N1 or BACnet Object Linking and Embedding (OLE) for Process
Avigilon Control Center System Integration Guide
 Avigilon Control Center System Integration Guide with Picture Perfect 4 INT-PP4-A-Rev1 Copyright 2012 Avigilon. All rights reserved. No copying, distribution, publication, modification, or incorporation
Avigilon Control Center System Integration Guide
 Avigilon Control Center System Integration Guide with Gallagher Command Centre INT-CARDAX-C-Rev3 Copyright 2013 Avigilon. All rights reserved. No copying, distribution, publication, modification, or incorporation
SIMATIC IPC DiagBase SIMATIC. Industrial PC SIMATIC IPC DiagBase. Introduction. DIAG software components. Quick-Start Guide
 Introduction 1 DIAG software components 2 SIMATIC Industrial PC Operating Manual Quick-Start Guide 3 Hardware and software requirements 4 Installing and removing the software 5 Description of the Management
Weekly Testing of Dedicated Stairwell Pressurization Fans- Metasys System Extended Architecture Code No. LIT
 Weekly Testing of Dedicated Stairwell Pressurization Fans- Metasys System Extended Architecture Code No. LIT-1201739 Release 1.2 Issued Date July 30, 2004 Supersedes Document Introduction.................................................
Installing ProSeries 2005
 Installing ProSeries 2005 The following instructions will walk you through Installing and Launching ProSeries 2005. Before you begin your installation, it is very important to make note of the following
Avigilon Control Center 5 System Integration Guide
 Avigilon Control Center 5 System Integration Guide with Lenel Facility Commander Wnx INT-FCWNX-A-Rev1 2010 2014 Avigilon Corporation. All rights reserved. Unless expressly granted in writing, no license
Simplex Panel Interface Guide
 Simplex Panel Interface Guide February 2016 SATEON Software Integrations Simplex Panel Interface Guide Issue 1.0, released February 2016 Disclaimer Copyright 2016, Grosvenor Technology. All rights reserved.
Ion Gateway Cellular Gateway and Wireless Sensors
 Page 1 of 9 Account & Network Setup If this is your first time using the Ion Gateway online system site you will need to create a new account. If you have already created an account you can skip to the
ION Meter Alerts TECHNICAL NOTE NOVEMBER In This Document
 70072-0125-01 TECHNICAL NOTE NOVEMBER 2006 ION Meter Alerts A PowerLogic ION meter can send alerts to indicate a user specified power system condition such as a power quality problem (including surges,
Ademco Vista Alarm Panel
 System Galaxy Quick Guide CONFIGURATION AND OPERATION Ademco Vista Alarm Panel JAN 2018 SG 10.5.6 System Galaxy Quick Guide For Ademco Vista Panel Configuration & Operation 2nd edition JAN 2018 Information
USER MANUAL DexTempTM 1000 Temperature Monitor (P/N: IR-1001) DexTempTM 1000 USB Non-Contact Temperature Monitor. User Manual.
 DexTempTM 1000 USB Non-Contact Temperature Monitor. User Manual.") USER MANUAL DexTempTM 1000 Temperature Monitor (P/N: IR-1001) DexTempTM 1000 USB Non-Contact Temperature Monitor User Manual 8690 Rev B Update: 10/24/2013 1 Table of Contents 1 Introduction.. 3 2 Host
USER MANUAL DexTempTM 1000 Temperature Monitor (P/N: IR-1001) DexTempTM 1000 USB Non-Contact Temperature Monitor User Manual 8690 Rev B Update: 10/24/2013 1 Table of Contents 1 Introduction.. 3 2 Host
Instruction manual MTL process alarm equipment. October 2016 CSM 725B rev 2 MTL RTK 725B. Configuration Software Manual
 Instruction manual MTL process alarm equipment October 2016 CSM 725B rev 2 MTL RTK 725B Configuration Software Manual SECTION 1 - INTRODUCTION... 5 Basic Requirements... 5 SECTION 2 - SOFTWARE INSTALLATION...
Raytec Avigilon Integration User Guide Integrating Raytec Network Illuminators with Avigilon Control Center Document Revision 2.0
 Raytec Avigilon Integration User Guide Integrating Raytec Network Illuminators with Avigilon Control Center Document Revision 2.0 Table of Contents 1 INTRODUCTION... 3 1.1 OVERVIEW... 3 1.2 SOFTWARE COMPONENTS...
Patriot Systems Limited
 COPYRIGHT 1997 - The Patriot Systems Ltd. Patriot Alarm Monitoring Automation Package is licensed for use on one computer, by the original person, or company, or organisation whose name is registered with
User Guide IM/SM3000 EN Rev. L. SM3000 Multipoint Videographic Recorder
 User Guide IM/SM3000 EN Rev. L SM3000 The Company We are an established world force in the design and manufacture of measurement products for industrial process control, flow measurement, gas and liquid
Niagara4 Technical Certification Program Student Guide DAY 1 DAY 2
 Niagara4 Technical Certification Program Student Guide DAY 1 Welcome Course Introduction Platforms & Stations Niagara4 Fundamentals Simple Logic: Hot Water Pump Control (Thermostatic) Simple Logic: Hot
i-vu CCN 4.0 Owner s Guide
 i-vu CCN 4.0 Owner s Guide CARRIER CORPORAION 2007 A member of the United echnologies Corporation family. Stock symbol UX. 11-808-377-01 07/07 able of Contents ACCESSING YOUR SYSEM... 3 YOUR SYSEM DEAILS...
SPECTRUM Alarm Notification Manager (SANM)
") Titlepage SPECTRUM Alarm Notification Manager (SANM) Document 9031308-08 Application & Gateway Copyright Notice Document 9031308-07. Copyright December 2001 Aprisma Management Technologies, Inc., 121 Technology
Titlepage SPECTRUM Alarm Notification Manager (SANM) Document 9031308-08 Application & Gateway Copyright Notice Document 9031308-07. Copyright December 2001 Aprisma Management Technologies, Inc., 121 Technology
725B Configuration Software Manual
 725B Configuration Software Manual REV DATED DESCRIPTION AUTHOR APPROVED 0 09-03-10 First Issue P.Cartmell Page 1 of 80 SECTION 1 - SOFTWARE INSTALLATION... 5 725B ConfigurationSoftware Installation...
Platform Services BACnet Alarm Management
 Description: Guide to understanding and setting up BACnet Alarms, visualizing real-time and historical BACnet alarms using AlarmWorX64 Viewer and logging them to SQL database using AlarmWorX64 Logger OS
[ [ ADMIN PANEL USER GUIDE
 [ [ ADMIN PANEL USER GUIDE ADMIN PANEL USER GUIDE 2 Contents Logging In & Systems Overview 3 System Details 5 Analytics 6 View Alarms 8 Manage Alarms 9 Create Alarms 10 Device Reporting Alarm 11 Monthly
SIMATIC IPC DiagBase SIMATIC. Industrial PC. Introduction. DIAG software components. Quick-Start Guide. Hardware and software requirements
 Introduction 1 DIAG software components 2 SIMATIC Industrial PC Operating Manual Quick-Start Guide 3 Hardware and software requirements 4 Installing and removing the software 5 Description of the Management
Setting up and Managing Alarms in McAfee ESM 10.x
 McAfee SIEM Alarms Setting up and Managing Alarms in McAfee ESM 10.x Introduction McAfee SIEM provides the ability to send alarms on a multitude of conditions. These alarms allow for users to be notified
SMART TILES. 0-1 Initial draft 11/21/ Public Release 1 12/5/2017 4/4/2018
 SMART TILES VERSION NUMBER PURPOSE/CHANGE DATE 0-1 Initial draft 11/21/2017 0-2 Public Release 1 12/5/2017 4/4/2018 Copyright 2018 MegaSys Enterprises Ltd. Copyright 2018 Worth Ventures Ltd. Table of Contents
Milestone SMI Intrepid II Perimeter Module 1.1 User s Manual
 Milestone SMI Intrepid II Perimeter Module 1.1 User s Manual Target Audience for this Document This document is aimed at system users and provides descriptions on how to install and maintain the Milestone
PotterNet Fire & Facility Supervising Station
 Features Connect up to 1000 Potter panels in a single building, local campus, or multiple sites worldwide using LAN/WAN/Internet Native Ethernet networking connectivity with fire panels and client stations,
BlackBerry AtHoc Networked Crisis Communication Siemens Indoor Fire Panel Installation and Configuration Guide Release Version 7.
 BlackBerry AtHoc Networked Crisis Communication Siemens Indoor Fire Panel Installation and Configuration Guide Release Version 7.3, October 2017 Copyright 2017 BlackBerry Limited. All Rights Reserved.
BOSCH GV4 Alarm Panel
 System Galaxy Quick Guide CONFIGURATION AND OPERATION BOSCH GV4 Alarm Panel SG 10.2 (or later) NOV 2012 This is a Galaxy Product Interface Guide. Information in this document is subject to change without
Oracle Communications Performance Intelligence Center
 Oracle Communications Performance Intelligence Center System Alarms User s Guide Release 10.1 E55927 Revision 2 October 2014 Oracle Communications Performance Intelligence Center System Alarms User s Guide,
Alarm Monitoring and Management
 CHAPTER 9 This chapter describes Cisco Transport Controller (CTC) alarm management. To troubleshoot specific alarms, refer to the Cisco ONS 15310-CL Troubleshooting Guide. Chapter topics include: 9.1 Overview,
Ovation Alarm Management System
 Ovation Alarm Management System Features Multiple types of fully configurable, easy-tounderstand alarm displays Convenient access to past alarms, returns and state changes Simplified ability to acknowledge,
PowerLogic ION Setup Meter Configuration Software Configuration Guide
 PowerLogic ION Setup Meter Configuration Software Configuration Guide 70002-0293-03 12/2010 Conventions Used in this Manual This section describes the symbols and terminology used in this guide. Symbols
Manage Alarms. Before You Begin. NTP-E57 Document Existing Provisioning CHAPTER
 CHAPTER 9 Manage Alarms This chapter provides procedures required to view and manage Cisco ONS 15600 alarms and conditions. Cisco Transport Controller (CTC) detects and reports SONET alarms generated by
Manage Alarms. Before You Begin CHAPTER
 CHAPTER 9 Manage Alarms This chapter provides procedures required to view and manage Cisco ONS 15600 alarms and conditions. Cisco Transport Controller (CTC) detects and reports SONET alarms generated by
Smart Combiners Installation Guide. For Obvius A89DC-08 sensor modules
 For Obvius A89DC-08 sensor modules Introduction Large roof and ground arrays connect the panels into stings that are merged together in combiner boxes. Each string will typically consist of 10-15 panels
DeltaV Live. Introduction. Benefits. Modern, built-for-purpose operations experience
 DeltaV Distributed Control System Product Data Sheet December 2018 DeltaV Live Modern, built-for-purpose operations experience Easily create intuitive displays, with minimal to no scripting required Robust,
Installation, Configuration and User Manual
 Model 8826 System Controller Model 8826 System Controller Installation, Configuration and User Manual READ AND SAVE THESE INSTRUCTIONS WELCOME Thank you for choosing the Aprilaire HVAC Automation System.
Running IGSS as an Operator, Part One
 Running IGSS as an Operator, Part One Contents Duration We want to see how a completed IGSS SCADA system appears to plant operator personnel to get an idea of the various elements in the system and how
SPECTRUM/Tivoli Gateway User s Guide
 SPECTRUM/Tivoli Gateway User s Guide Notice Cabletron Systems reserves the right to make changes in specifications and other information contained in this document without prior notice. The reader should
Alarm Monitoring and Management
 CHAPTER 10 This chapter describes Cisco Transport Controller (CTC) alarm management. To troubleshoot specific alarms, refer to the Cisco ONS 15310-MA SDH Troubleshooting Guide. Chapter topics include:
Installing ProSeries 2004
 Installing ProSeries 2004 The following instructions will walk you through Installing and Launching ProSeries 2004. Before you begin your installation, it is very important to make note of the following
Halton SAFE / 7.14 user guide and installation instructions
 Halton SAFE / 7.14 user guide and installation instructions VERIFIED SOLUTIONS BY H A LTO N Enabling Wellbeing Table of contents 1 System description 3 2 User Accounts 4 3 Main menu 7 3.1 Main menu - Change
Warning: To reduce a risk of fire or electric shock, do not expose this product to rain or moisture.
 XX093-03-01 V1500 Configurator Warning: To reduce a risk of fire or electric shock, do not expose this product to rain or moisture. Vicon Industries Inc. does not warrant that the functions contained in
Alarm Monitoring and Management
 14 CHAPTER This chapter explains how to manage alarms with Cisco Transport Controller (CTC). To troubleshoot specific alarms, refer to the Cisco ONS 15454 SDH Troubleshooting Guide. Chapter topics include:
BeneVision Central Monitoring System. Quick Reference Guide
 BeneVision Central Monitoring System Quick Reference Guide NOTE: The Quick Reference Guide is not intended as a replacement to the Operating Instructions. Prior to operating equipment, the user must be
Oracle Communications Network Charging and Control
 Oracle Communications Network Charging and Control Product: OCNCC 4.3 Component: Service Management System S ware version: Release 3.1.2 Guide version: 03.00 Release date: December 2010 Status: Approved
Making the Most of Alarms
 Making the Most of Alarms Leverage the alarm management features of MPA to address network performance problems more effectively. Blueprint to Leverage Alarms and Alerts Using Mitel Performance Analytics
PM-ANALYZE. Overview 1. System Configuration 2. Operation 3. Analysis of Alarms and process values. User Interface 4
 Overview 1 System Configuration 2 Operation 3 Analysis of Alarms and process values User Interface 4 Version 8 Configuration 5 Edition: 04/04/2017 Table of Contents Contents 1 Overview... 1-1 1.1 General
Avigilon Control Center System Integration Guide
 Avigilon Control Center System Integration Guide with Gallagher Command Centre INT-CARDAX-C-Rev2 Copyright 2011 Avigilon. All rights reserved. No copying, distribution, publication, modification, or incorporation
STRIPEYFISH. Utilities for VMware Series. sfvalarms User Guide
 STRIPEYFISH Utilities for VMware Series sfvalarms User Guide S T R I P E Y F I S H sfvalarms User Guide Revision 3 StripeyFish 2013 www.stripeyfish.co.uk Table of Contents Introduction... 1 What is covered
Enterprise Alarm Manager UserÕs Guide
 Titlepage Enterprise Alarm Manager UserÕs Guide SPECTRUM Enterprise Manager Network Management Notice Aprisma Management Technologies, Inc. (Aprisma) reserves the right to make changes in speciþcations
ModSync Sequencing System Installation & Operation Manual. For use with Fulton Steam Boilers.
 ModSync Sequencing System Installation & Operation Manual For use with Fulton Steam Boilers. Revision 3.0 8/21/2008 - 2 - Table of Contents Introduction Page 4 Features Page 4 Sequence of Operation Page
INTEGRATED PRODUCTION & PERFORMANCE SUITE. Alarms and Events SYSTEM CONFIGURATION GUIDE
 INTEGRATED PRODUCTION & PERFORMANCE SUITE Alarms and Events SYSTEM CONFIGURATION GUIDE PUBLICATION FTAE-RM001A-EN-E May 2009 Contact Rockwell Technical Support Telephone 440-646-3434 Technical Support