Custom Soil Resource Report for State of Connecticut
|
|
|
- Eustacia Sherman
- 6 years ago
- Views:
Transcription


1 United States Department of Agriculture Natural Resources Conservation Service A product of the National Cooperative Soil Survey, a joint effort of the United States Department of Agriculture and other Federal agencies, State agencies including the Agricultural Experiment Stations, and local participants Custom Soil Resource Report for State of Connecticut UCONN Campus September 9, 2010
2 Preface Soil surveys contain information that affects land use planning in survey areas. They highlight soil limitations that affect various land uses and provide information about the properties of the soils in the survey areas. Soil surveys are designed for many different users, including farmers, ranchers, foresters, agronomists, urban planners, community officials, engineers, developers, builders, and home buyers. Also, conservationists, teachers, students, and specialists in recreation, waste disposal, and pollution control can use the surveys to help them understand, protect, or enhance the environment. Various land use regulations of Federal, State, and local governments may impose special restrictions on land use or land treatment. Soil surveys identify soil properties that are used in making various land use or land treatment decisions. The information is intended to help the land users identify and reduce the effects of soil limitations on various land uses. The landowner or user is responsible for identifying and complying with existing laws and regulations. Although soil survey information can be used for general farm, local, and wider area planning, onsite investigation is needed to supplement this information in some cases. Examples include soil quality assessments ( and certain conservation and engineering applications. For more detailed information, contact your local USDA Service Center ( agency=nrcs) or your NRCS State Soil Scientist ( state_offices/). Great differences in soil properties can occur within short distances. Some soils are seasonally wet or subject to flooding. Some are too unstable to be used as a foundation for buildings or roads. Clayey or wet soils are poorly suited to use as septic tank absorption fields. A high water table makes a soil poorly suited to basements or underground installations. The National Cooperative Soil Survey is a joint effort of the United States Department of Agriculture and other Federal agencies, State agencies including the Agricultural Experiment Stations, and local agencies. The Natural Resources Conservation Service (NRCS) has leadership for the Federal part of the National Cooperative Soil Survey. Information about soils is updated periodically. Updated information is available through the NRCS Soil Data Mart Web site or the NRCS Web Soil Survey. The Soil Data Mart is the data storage site for the official soil survey information. The U.S. Department of Agriculture (USDA) prohibits discrimination in all its programs and activities on the basis of race, color, national origin, age, disability, and where applicable, sex, marital status, familial status, parental status, religion, sexual orientation, genetic information, political beliefs, reprisal, or because all or a part of an individual's income is derived from any public assistance program. (Not all prohibited bases apply to all programs.) Persons with disabilities who require alternative means 2
3 for communication of program information (Braille, large print, audiotape, etc.) should contact USDA's TARGET Center at (202) (voice and TDD). To file a complaint of discrimination, write to USDA, Director, Office of Civil Rights, 1400 Independence Avenue, S.W., Washington, D.C or call (800) (voice) or (202) (TDD). USDA is an equal opportunity provider and employer. 3
4 Contents Preface...2 How Soil Surveys Are Made...6 Soil Map...8 Soil Map...9 Legend...10 Map Unit Legend...11 Map Unit Descriptions...11 State of Connecticut Ridgebury fine sandy loam Ridgebury, Leicester, and Whitman soils, extremely stony A Woodbridge fine sandy loam, 0 to 3 percent slopes B Woodbridge fine sandy loam, 3 to 8 percent slopes C Woodbridge fine sandy loam, 8 to 15 percent slopes B Woodbridge fine sandy loam, 2 to 8 percent slopes, very stony C Woodbridge fine sandy loam, 2 to 15 percent slopes, extremely stony B Sutton fine sandy loam, 3 to 8 percent slopes D Canton and Charlton soils, 15 to 25 percent slopes E Charlton-Chatfield complex, 15 to 45 percent slopes, very rocky B Paxton and Montauk fine sandy loams, 3 to 8 percent slopes C Paxton and Montauk fine sandy loams, 8 to 15 percent slopes D Paxton and Montauk fine sandy loams, 15 to 25 percent slopes B Paxton and Montauk fine sandy loams, 3 to 8 percent slopes, very stony C Paxton and Montauk fine sandy loams, 8 to 15 percent slopes, very stony C Paxton and Montauk fine sandy loams, 3 to 15 percent slopes, extremely stony D Paxton and Montauk fine sandy loams, 15 to 35 percent slopes, extremely stony Udorthents-Urban land complex Urban land Udorthents, smoothed...49 W Water...50 Soil Information for All Uses...51 Suitabilities and Limitations for Use...51 Land Classifications...51 Farmland Classification...51 Soil Properties and Qualities...56 Soil Physical Properties...56 Organic Matter (surface layer)...56 Water Features...60 Depth to Water Table...60 Flooding Frequency Class
5 Soil Reports...69 AOI Inventory...69 Selected Soil Interpretations (Connecticut Inland Wetlands)...69 Building Site Development...71 Roads and Streets, Shallow Excavations, and Lawns and Landscaping...71 References
6 How Soil Surveys Are Made Soil surveys are made to provide information about the soils and miscellaneous areas in a specific area. They include a description of the soils and miscellaneous areas and their location on the landscape and tables that show soil properties and limitations affecting various uses. Soil scientists observed the steepness, length, and shape of the slopes; the general pattern of drainage; the kinds of crops and native plants; and the kinds of bedrock. They observed and described many soil profiles. A soil profile is the sequence of natural layers, or horizons, in a soil. The profile extends from the surface down into the unconsolidated material in which the soil formed or from the surface down to bedrock. The unconsolidated material is devoid of roots and other living organisms and has not been changed by other biological activity. Currently, soils are mapped according to the boundaries of major land resource areas (MLRAs). MLRAs are geographically associated land resource units that share common characteristics related to physiography, geology, climate, water resources, soils, biological resources, and land uses (USDA, 2006). Soil survey areas typically consist of parts of one or more MLRA. The soils and miscellaneous areas in a survey area occur in an orderly pattern that is related to the geology, landforms, relief, climate, and natural vegetation of the area. Each kind of soil and miscellaneous area is associated with a particular kind of landform or with a segment of the landform. By observing the soils and miscellaneous areas in the survey area and relating their position to specific segments of the landform, a soil scientist develops a concept, or model, of how they were formed. Thus, during mapping, this model enables the soil scientist to predict with a considerable degree of accuracy the kind of soil or miscellaneous area at a specific location on the landscape. Commonly, individual soils on the landscape merge into one another as their characteristics gradually change. To construct an accurate soil map, however, soil scientists must determine the boundaries between the soils. They can observe only a limited number of soil profiles. Nevertheless, these observations, supplemented by an understanding of the soil-vegetation-landscape relationship, are sufficient to verify predictions of the kinds of soil in an area and to determine the boundaries. Soil scientists recorded the characteristics of the soil profiles that they studied. They noted soil color, texture, size and shape of soil aggregates, kind and amount of rock fragments, distribution of plant roots, reaction, and other features that enable them to identify soils. After describing the soils in the survey area and determining their properties, the soil scientists assigned the soils to taxonomic classes (units). Taxonomic classes are concepts. Each taxonomic class has a set of soil characteristics with precisely defined limits. The classes are used as a basis for comparison to classify soils systematically. Soil taxonomy, the system of taxonomic classification used in the United States, is based mainly on the kind and character of soil properties and the arrangement of horizons within the profile. After the soil scientists classified and named the soils in the survey area, they compared the 6
7 individual soils with similar soils in the same taxonomic class in other areas so that they could confirm data and assemble additional data based on experience and research. The objective of soil mapping is not to delineate pure map unit components; the objective is to separate the landscape into landforms or landform segments that have similar use and management requirements. Each map unit is defined by a unique combination of soil components and/or miscellaneous areas in predictable proportions. Some components may be highly contrasting to the other components of the map unit. The presence of minor components in a map unit in no way diminishes the usefulness or accuracy of the data. The delineation of such landforms and landform segments on the map provides sufficient information for the development of resource plans. If intensive use of small areas is planned, onsite investigation is needed to define and locate the soils and miscellaneous areas. Soil scientists make many field observations in the process of producing a soil map. The frequency of observation is dependent upon several factors, including scale of mapping, intensity of mapping, design of map units, complexity of the landscape, and experience of the soil scientist. Observations are made to test and refine the soillandscape model and predictions and to verify the classification of the soils at specific locations. Once the soil-landscape model is refined, a significantly smaller number of measurements of individual soil properties are made and recorded. These measurements may include field measurements, such as those for color, depth to bedrock, and texture, and laboratory measurements, such as those for content of sand, silt, clay, salt, and other components. Properties of each soil typically vary from one point to another across the landscape. Observations for map unit components are aggregated to develop ranges of characteristics for the components. The aggregated values are presented. Direct measurements do not exist for every property presented for every map unit component. Values for some properties are estimated from combinations of other properties. While a soil survey is in progress, samples of some of the soils in the area generally are collected for laboratory analyses and for engineering tests. Soil scientists interpret the data from these analyses and tests as well as the field-observed characteristics and the soil properties to determine the expected behavior of the soils under different uses. Interpretations for all of the soils are field tested through observation of the soils in different uses and under different levels of management. Some interpretations are modified to fit local conditions, and some new interpretations are developed to meet local needs. Data are assembled from other sources, such as research information, production records, and field experience of specialists. For example, data on crop yields under defined levels of management are assembled from farm records and from field or plot experiments on the same kinds of soil. Predictions about soil behavior are based not only on soil properties but also on such variables as climate and biological activity. Soil conditions are predictable over long periods of time, but they are not predictable from year to year. For example, soil scientists can predict with a fairly high degree of accuracy that a given soil will have a high water table within certain depths in most years, but they cannot predict that a high water table will always be at a specific level in the soil on a specific date. After soil scientists located and identified the significant natural bodies of soil in the survey area, they drew the boundaries of these bodies on aerial photographs and identified each as a specific map unit. Aerial photographs show trees, buildings, fields, roads, and rivers, all of which help in locating boundaries accurately. 7
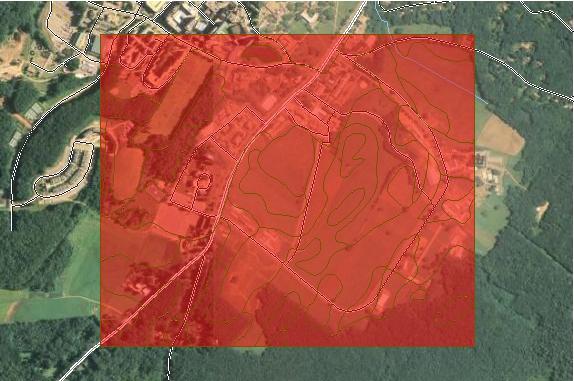
8 Soil Map The soil map section includes the soil map for the defined area of interest, a list of soil map units on the map and extent of each map unit, and cartographic symbols displayed on the map. Also presented are various metadata about data used to produce the map, and a description of each soil map unit. 8
9 Hillside Rd 41 49' 27'' 41 48' 33'' 72 15' 59'' 72 15' 56'' Tower Ct Ledoyt Rd 84B 85C 46B 85C 45A W 84B 47C 45A 86D Storrs Rd W 86D 73E B Map Scale: 1:11,900 if printed on A size (8.5" x 11") sheet. Moulton Rd Laurel Way 86C Eagleville Rd 46B Tower Loop Rd B 84D 47C 45C Glenbrook Rd Meters Feet ,000 2,000 3,000 Custom Soil Resource Report Soil Map W 85B Horse Barn Hill Rd 84C B 84B 84B 45B 2 85B 60D 84B 86D 84D 45B 46B W 50B Willowbrook Rd 85C B Gurleyville Rd 45B 47C Dog Ln 72 14' 8'' 72 14' 10'' 41 49' 24'' 41 48' 30''
10 MAP LEGEND MAP INFORMATION Area of Interest (AOI) Area of Interest (AOI) Soils Soil Map Units Special Point Features Blowout Borrow Pit Clay Spot Closed Depression Gravel Pit Gravelly Spot Landfill Lava Flow Marsh or swamp Mine or Quarry Miscellaneous Water Perennial Water Rock Outcrop Saline Spot Sandy Spot Severely Eroded Spot Sinkhole Slide or Slip Sodic Spot Spoil Area Stony Spot Very Stony Spot Wet Spot Other Special Line Features Gully Short Steep Slope Other Political Features Cities Water Features Oceans Streams and Canals Transportation Rails Interstate Highways US Routes Major Roads Local Roads Map Scale: 1:11,900 if printed on A size (8.5" 11") sheet. The soil surveys that comprise your AOI were mapped at 1:12,000. Please rely on the bar scale on each map sheet for accurate map measurements. Source of Map: Natural Resources Conservation Service Web Soil Survey URL: Coordinate System: UTM Zone 18N NAD83 This product is generated from the USDA-NRCS certified data as of the version date(s) listed below. Soil Survey Area: State of Connecticut Survey Area Data: Version 7, Dec 3, 2009 Date(s) aerial images were photographed: 8/16/2006; 7/17/2006 The orthophoto or other base map on which the soil lines were compiled and digitized probably differs from the background imagery displayed on these maps. As a result, some minor shifting of map unit boundaries may be evident.
11 Map Unit Legend State of Connecticut (CT600) Map Unit Symbol Map Unit Name Acres in AOI Percent of AOI 2 Ridgebury fine sandy loam % 3 Ridgebury, Leicester, and Whitman soils, extremely stony % 45A Woodbridge fine sandy loam, 0 to 3 percent slopes % 45B Woodbridge fine sandy loam, 3 to 8 percent slopes % 45C 46B 47C Woodbridge fine sandy loam, 8 to 15 percent slopes Woodbridge fine sandy loam, 2 to 8 percent slopes, very stony Woodbridge fine sandy loam, 2 to 15 percent slopes, extremely stony % % % 50B Sutton fine sandy loam, 3 to 8 percent slopes % 60D Canton and Charlton soils, 15 to 25 percent slopes % 73E Charlton-Chatfield complex, 15 to 45 percent slopes, very rocky 84B Paxton and Montauk fine sandy loams, 3 to 8 percent slopes 84C Paxton and Montauk fine sandy loams, 8 to 15 percent slopes 84D Paxton and Montauk fine sandy loams, 15 to 25 percent slopes 85B Paxton and Montauk fine sandy loams, 3 to 8 percent slopes, very stony 85C Paxton and Montauk fine sandy loams, 8 to 15 percent slopes, very stony 86C Paxton and Montauk fine sandy loams, 3 to 15 percent slopes, extremely stony 86D Paxton and Montauk fine sandy loams, 15 to 35 percent slopes, extremely stony % % % % % % % % 306 Udorthents-Urban land complex % 307 Urban land % 308 Udorthents, smoothed % W Water % Totals for Area of Interest % Map Unit Descriptions The map units delineated on the detailed soil maps in a soil survey represent the soils or miscellaneous areas in the survey area. The map unit descriptions, along with the maps, can be used to determine the composition and properties of a unit. 11
12 A map unit delineation on a soil map represents an area dominated by one or more major kinds of soil or miscellaneous areas. A map unit is identified and named according to the taxonomic classification of the dominant soils. Within a taxonomic class there are precisely defined limits for the properties of the soils. On the landscape, however, the soils are natural phenomena, and they have the characteristic variability of all natural phenomena. Thus, the range of some observed properties may extend beyond the limits defined for a taxonomic class. Areas of soils of a single taxonomic class rarely, if ever, can be mapped without including areas of other taxonomic classes. Consequently, every map unit is made up of the soils or miscellaneous areas for which it is named and some minor components that belong to taxonomic classes other than those of the major soils. Most minor soils have properties similar to those of the dominant soil or soils in the map unit, and thus they do not affect use and management. These are called noncontrasting, or similar, components. They may or may not be mentioned in a particular map unit description. Other minor components, however, have properties and behavioral characteristics divergent enough to affect use or to require different management. These are called contrasting, or dissimilar, components. They generally are in small areas and could not be mapped separately because of the scale used. Some small areas of strongly contrasting soils or miscellaneous areas are identified by a special symbol on the maps. If included in the database for a given area, the contrasting minor components are identified in the map unit descriptions along with some characteristics of each. A few areas of minor components may not have been observed, and consequently they are not mentioned in the descriptions, especially where the pattern was so complex that it was impractical to make enough observations to identify all the soils and miscellaneous areas on the landscape. The presence of minor components in a map unit in no way diminishes the usefulness or accuracy of the data. The objective of mapping is not to delineate pure taxonomic classes but rather to separate the landscape into landforms or landform segments that have similar use and management requirements. The delineation of such segments on the map provides sufficient information for the development of resource plans. If intensive use of small areas is planned, however, onsite investigation is needed to define and locate the soils and miscellaneous areas. An identifying symbol precedes the map unit name in the map unit descriptions. Each description includes general facts about the unit and gives important soil properties and qualities. Soils that have profiles that are almost alike make up a soil series. Except for differences in texture of the surface layer, all the soils of a series have major horizons that are similar in composition, thickness, and arrangement. Soils of one series can differ in texture of the surface layer, slope, stoniness, salinity, degree of erosion, and other characteristics that affect their use. On the basis of such differences, a soil series is divided into soil phases. Most of the areas shown on the detailed soil maps are phases of soil series. The name of a soil phase commonly indicates a feature that affects use or management. For example, Alpha silt loam, 0 to 2 percent slopes, is a phase of the Alpha series. Some map units are made up of two or more major soils or miscellaneous areas. These map units are complexes, associations, or undifferentiated groups. A complex consists of two or more soils or miscellaneous areas in such an intricate pattern or in such small areas that they cannot be shown separately on the maps. The pattern and proportion of the soils or miscellaneous areas are somewhat similar in all areas. Alpha-Beta complex, 0 to 6 percent slopes, is an example. 12
13 An association is made up of two or more geographically associated soils or miscellaneous areas that are shown as one unit on the maps. Because of present or anticipated uses of the map units in the survey area, it was not considered practical or necessary to map the soils or miscellaneous areas separately. The pattern and relative proportion of the soils or miscellaneous areas are somewhat similar. Alpha- Beta association, 0 to 2 percent slopes, is an example. An undifferentiated group is made up of two or more soils or miscellaneous areas that could be mapped individually but are mapped as one unit because similar interpretations can be made for use and management. The pattern and proportion of the soils or miscellaneous areas in a mapped area are not uniform. An area can be made up of only one of the major soils or miscellaneous areas, or it can be made up of all of them. Alpha and Beta soils, 0 to 2 percent slopes, is an example. Some surveys include miscellaneous areas. Such areas have little or no soil material and support little or no vegetation. Rock outcrop is an example. 13
14 State of Connecticut 2 Ridgebury fine sandy loam Map Unit Setting Elevation: 0 to 1,200 feet Mean annual precipitation: 37 to 56 inches Mean annual air temperature: 45 to 55 degrees F Frost-free period: 140 to 185 days Map Unit Composition Ridgebury and similar soils: 80 percent Minor components: 20 percent Description of Ridgebury Setting Across-slope shape: Concave Parent material: Coarse-loamy lodgment till derived from granite and/or schist and/ or gneiss Properties and qualities Slope: 0 to 5 percent Depth to restrictive feature: 20 to 30 inches to dense material Drainage class: Poorly drained Capacity of the most limiting layer to transmit water (Ksat): Very low to moderately high (0.00 to 0.20 in/hr) Depth to water table: About 0 to 6 inches Frequency of flooding: None Frequency of ponding: None Available water capacity: Very low (about 2.6 inches) Interpretive groups Land capability (nonirrigated): 4w Typical profile 0 to 5 inches: Fine sandy loam 5 to 14 inches: Fine sandy loam 14 to 21 inches: Fine sandy loam 21 to 60 inches: Sandy loam Minor Components Woodbridge Percent of map unit: 10 percent Landform: Drumlins, hills Sutton Percent of map unit: 3 percent 14
15 Leicester Percent of map unit: 2 percent Across-slope shape: Concave Whitman Percent of map unit: 2 percent Across-slope shape: Concave Unnamed, steep slopes Unnamed, silt loam surface Unnamed, stony surface 3 Ridgebury, Leicester, and Whitman soils, extremely stony Map Unit Setting Elevation: 0 to 1,200 feet Mean annual precipitation: 37 to 56 inches Mean annual air temperature: 45 to 55 degrees F Frost-free period: 140 to 185 days Map Unit Composition Ridgebury and similar soils: 40 percent Leicester and similar soils: 35 percent Whitman and similar soils: 15 percent Minor components: 10 percent Description of Ridgebury Setting Across-slope shape: Concave Parent material: Coarse-loamy lodgment till derived from granite and/or schist and/ or gneiss Properties and qualities Slope: 0 to 5 percent Surface area covered with cobbles, stones or boulders: 9.0 percent Depth to restrictive feature: 20 to 30 inches to dense material 15
16 Drainage class: Poorly drained Capacity of the most limiting layer to transmit water (Ksat): Very low to moderately high (0.00 to 0.20 in/hr) Depth to water table: About 0 to 6 inches Frequency of flooding: None Frequency of ponding: None Available water capacity: Very low (about 2.6 inches) Interpretive groups Land capability (nonirrigated): 7s Typical profile 0 to 5 inches: Fine sandy loam 5 to 14 inches: Fine sandy loam 14 to 21 inches: Fine sandy loam 21 to 60 inches: Sandy loam Description of Leicester Setting Across-slope shape: Concave Parent material: Coarse-loamy melt-out till derived from granite and/or schist and/or gneiss Properties and qualities Slope: 0 to 5 percent Surface area covered with cobbles, stones or boulders: 9.0 percent Depth to restrictive feature: More than 80 inches Drainage class: Poorly drained Capacity of the most limiting layer to transmit water (Ksat): Moderately high to high (0.57 to 5.95 in/hr) Depth to water table: About 0 to 18 inches Frequency of flooding: None Frequency of ponding: None Available water capacity: Moderate (about 6.9 inches) Interpretive groups Land capability (nonirrigated): 7s Typical profile 0 to 1 inches: Moderately decomposed plant material 1 to 7 inches: Fine sandy loam 7 to 10 inches: Fine sandy loam 10 to 18 inches: Fine sandy loam 18 to 24 inches: Fine sandy loam 24 to 43 inches: Gravelly fine sandy loam 43 to 65 inches: Gravelly fine sandy loam Description of Whitman Setting Across-slope shape: Concave Parent material: Coarse-loamy lodgment till derived from granite and/or schist and/ or gneiss 16
17 Properties and qualities Slope: 0 to 2 percent Surface area covered with cobbles, stones or boulders: 9.0 percent Depth to restrictive feature: 12 to 20 inches to dense material Drainage class: Very poorly drained Capacity of the most limiting layer to transmit water (Ksat): Very low to moderately high (0.00 to 0.20 in/hr) Depth to water table: About 0 to 12 inches Frequency of flooding: None Frequency of ponding: Occasional Available water capacity: Very low (about 1.9 inches) Interpretive groups Land capability (nonirrigated): 7s Typical profile 0 to 1 inches: Slightly decomposed plant material 1 to 9 inches: Fine sandy loam 9 to 16 inches: Fine sandy loam 16 to 22 inches: Fine sandy loam 22 to 60 inches: Fine sandy loam Minor Components Sutton Percent of map unit: 2 percent Woodbridge Percent of map unit: 2 percent Landform: Drumlins, hills Unnamed, frequently flooded Percent of map unit: 2 percent Landform: Drainageways Unnamed, steep slopes Percent of map unit: 2 percent Unnamed, silt loam surface Unnamed, nonstony 17
18 45A Woodbridge fine sandy loam, 0 to 3 percent slopes Map Unit Setting Elevation: 0 to 1,200 feet Mean annual precipitation: 43 to 56 inches Mean annual air temperature: 45 to 55 degrees F Frost-free period: 140 to 185 days Map Unit Composition Woodbridge and similar soils: 80 percent Minor components: 20 percent Description of Woodbridge Setting Landform: Drumlins, hills Parent material: Coarse-loamy lodgment till derived from granite and/or schist and/ or gneiss Properties and qualities Slope: 0 to 3 percent Depth to restrictive feature: 20 to 40 inches to dense material Drainage class: Moderately well drained Capacity of the most limiting layer to transmit water (Ksat): Very low to moderately high (0.00 to 0.20 in/hr) Depth to water table: About 18 to 30 inches Frequency of flooding: None Frequency of ponding: None Available water capacity: Low (about 3.9 inches) Interpretive groups Land capability (nonirrigated): 2w Typical profile 0 to 7 inches: Fine sandy loam 7 to 18 inches: Fine sandy loam 18 to 26 inches: Fine sandy loam 26 to 30 inches: Fine sandy loam 30 to 43 inches: Gravelly fine sandy loam 43 to 65 inches: Gravelly fine sandy loam Minor Components Paxton Percent of map unit: 5 percent Landform: Drumlins, hills, till plains 18
19 Across-slope shape: Convex Montauk Percent of map unit: 3 percent Landform: Drumlins, hills Down-slope shape: Convex Ridgebury Percent of map unit: 3 percent Across-slope shape: Concave Sutton Percent of map unit: 2 percent Leicester Percent of map unit: 2 percent Across-slope shape: Concave Unnamed, loamy substratum Percent of map unit: 2 percent Landform: Drumlins Whitman Across-slope shape: Concave Georgia Landform: Hills Stockbridge Landform: Hills 45B Woodbridge fine sandy loam, 3 to 8 percent slopes Map Unit Setting Elevation: 0 to 1,200 feet 19
20 Mean annual precipitation: 43 to 56 inches Mean annual air temperature: 45 to 55 degrees F Frost-free period: 140 to 185 days Map Unit Composition Woodbridge and similar soils: 80 percent Minor components: 20 percent Description of Woodbridge Setting Landform: Drumlins, hills Parent material: Coarse-loamy lodgment till derived from granite and/or schist and/ or gneiss Properties and qualities Slope: 3 to 8 percent Depth to restrictive feature: 20 to 40 inches to dense material Drainage class: Moderately well drained Capacity of the most limiting layer to transmit water (Ksat): Very low to moderately high (0.00 to 0.20 in/hr) Depth to water table: About 18 to 30 inches Frequency of flooding: None Frequency of ponding: None Available water capacity: Low (about 3.9 inches) Interpretive groups Land capability (nonirrigated): 2w Typical profile 0 to 7 inches: Fine sandy loam 7 to 18 inches: Fine sandy loam 18 to 26 inches: Fine sandy loam 26 to 30 inches: Fine sandy loam 30 to 43 inches: Gravelly fine sandy loam 43 to 65 inches: Gravelly fine sandy loam Minor Components Paxton Percent of map unit: 5 percent Landform: Drumlins, hills, till plains Across-slope shape: Convex Montauk Percent of map unit: 3 percent Landform: Drumlins, hills Down-slope shape: Convex Ridgebury Percent of map unit: 3 percent Across-slope shape: Concave 20
21 Sutton Percent of map unit: 2 percent Leicester Percent of map unit: 2 percent Across-slope shape: Concave Unnamed, loamy substratum Percent of map unit: 2 percent Whitman Across-slope shape: Concave Georgia Landform: Hills Stockbridge Landform: Hills 45C Woodbridge fine sandy loam, 8 to 15 percent slopes Map Unit Setting Elevation: 0 to 1,200 feet Mean annual precipitation: 43 to 56 inches Mean annual air temperature: 45 to 55 degrees F Frost-free period: 140 to 185 days Map Unit Composition Woodbridge and similar soils: 80 percent Minor components: 20 percent Description of Woodbridge Setting Landform: Drumlins, hills 21
22 Parent material: Coarse-loamy lodgment till derived from granite and/or schist and/ or gneiss Properties and qualities Slope: 8 to 15 percent Depth to restrictive feature: 20 to 40 inches to dense material Drainage class: Moderately well drained Capacity of the most limiting layer to transmit water (Ksat): Very low to moderately high (0.00 to 0.20 in/hr) Depth to water table: About 18 to 30 inches Frequency of flooding: None Frequency of ponding: None Available water capacity: Low (about 3.9 inches) Interpretive groups Land capability (nonirrigated): 3e Typical profile 0 to 7 inches: Fine sandy loam 7 to 18 inches: Fine sandy loam 18 to 26 inches: Fine sandy loam 26 to 30 inches: Fine sandy loam 30 to 43 inches: Gravelly fine sandy loam 43 to 65 inches: Gravelly fine sandy loam Minor Components Paxton Percent of map unit: 5 percent Landform: Drumlins, hills, till plains Across-slope shape: Convex Montauk Percent of map unit: 3 percent Landform: Drumlins, hills Down-slope shape: Convex Ridgebury Percent of map unit: 3 percent Across-slope shape: Concave Sutton Percent of map unit: 2 percent Leicester Percent of map unit: 2 percent Across-slope shape: Concave Unnamed, loamy substratum Percent of map unit: 2 percent 22
23 Whitman Across-slope shape: Concave Georgia Landform: Hills Stockbridge Landform: Hills 46B Woodbridge fine sandy loam, 2 to 8 percent slopes, very stony Map Unit Setting Elevation: 0 to 1,200 feet Mean annual precipitation: 43 to 56 inches Mean annual air temperature: 45 to 55 degrees F Frost-free period: 140 to 185 days Map Unit Composition Woodbridge and similar soils: 80 percent Minor components: 20 percent Description of Woodbridge Setting Landform: Drumlins, hills Parent material: Coarse-loamy lodgment till derived from granite and/or schist and/ or gneiss Properties and qualities Slope: 2 to 8 percent Surface area covered with cobbles, stones or boulders: 1.6 percent Depth to restrictive feature: 20 to 40 inches to dense material Drainage class: Moderately well drained Capacity of the most limiting layer to transmit water (Ksat): Very low to moderately high (0.00 to 0.20 in/hr) Depth to water table: About 18 to 30 inches Frequency of flooding: None Frequency of ponding: None Available water capacity: Low (about 3.9 inches) 23
24 Interpretive groups Land capability (nonirrigated): 6s Typical profile 0 to 7 inches: Fine sandy loam 7 to 18 inches: Fine sandy loam 18 to 26 inches: Fine sandy loam 26 to 30 inches: Fine sandy loam 30 to 43 inches: Gravelly fine sandy loam 43 to 65 inches: Gravelly fine sandy loam Minor Components Paxton Percent of map unit: 5 percent Landform: Drumlins, hills, till plains Across-slope shape: Convex Montauk Percent of map unit: 3 percent Landform: Drumlins, hills Down-slope shape: Convex Ridgebury Percent of map unit: 3 percent Across-slope shape: Concave Sutton Percent of map unit: 2 percent Leicester Percent of map unit: 2 percent Across-slope shape: Concave Unnamed, loamy substratum Percent of map unit: 2 percent Whitman Across-slope shape: Concave Georgia Landform: Hills 24
25 Stockbridge Landform: Hills 47C Woodbridge fine sandy loam, 2 to 15 percent slopes, extremely stony Map Unit Setting Elevation: 0 to 1,200 feet Mean annual precipitation: 43 to 56 inches Mean annual air temperature: 45 to 55 degrees F Frost-free period: 140 to 185 days Map Unit Composition Woodbridge and similar soils: 80 percent Minor components: 20 percent Description of Woodbridge Setting Landform: Drumlins, hills Parent material: Coarse-loamy lodgment till derived from granite and/or schist and/ or gneiss Properties and qualities Slope: 2 to 15 percent Surface area covered with cobbles, stones or boulders: 9.0 percent Depth to restrictive feature: 20 to 40 inches to dense material Drainage class: Moderately well drained Capacity of the most limiting layer to transmit water (Ksat): Very low to moderately high (0.00 to 0.20 in/hr) Depth to water table: About 18 to 30 inches Frequency of flooding: None Frequency of ponding: None Available water capacity: Low (about 3.9 inches) Interpretive groups Land capability (nonirrigated): 7s Typical profile 0 to 7 inches: Fine sandy loam 7 to 18 inches: Fine sandy loam 18 to 26 inches: Fine sandy loam 26 to 30 inches: Fine sandy loam 30 to 43 inches: Gravelly fine sandy loam 43 to 65 inches: Gravelly fine sandy loam 25
26 Minor Components Paxton Percent of map unit: 5 percent Landform: Drumlins, hills, till plains Across-slope shape: Convex Montauk Percent of map unit: 3 percent Landform: Drumlins, hills Down-slope shape: Convex Ridgebury Percent of map unit: 3 percent Across-slope shape: Concave Sutton Percent of map unit: 2 percent Leicester Percent of map unit: 2 percent Across-slope shape: Concave Unnamed, loamy substratum Percent of map unit: 2 percent Whitman Across-slope shape: Concave Stockbridge Landform: Hills Georgia Landform: Hills 26
27 50B Sutton fine sandy loam, 3 to 8 percent slopes Map Unit Setting Elevation: 0 to 1,200 feet Mean annual precipitation: 43 to 56 inches Mean annual air temperature: 45 to 55 degrees F Frost-free period: 140 to 185 days Map Unit Composition Sutton and similar soils: 80 percent Minor components: 20 percent Description of Sutton Setting Parent material: Coarse-loamy melt-out till derived from granite and/or schist and/or gneiss Properties and qualities Slope: 3 to 8 percent Depth to restrictive feature: More than 80 inches Drainage class: Moderately well drained Capacity of the most limiting layer to transmit water (Ksat): Moderately high to high (0.57 to 5.95 in/hr) Depth to water table: About 18 to 30 inches Frequency of flooding: None Frequency of ponding: None Available water capacity: Moderate (about 6.9 inches) Interpretive groups Land capability (nonirrigated): 2w Typical profile 0 to 6 inches: Fine sandy loam 6 to 12 inches: Fine sandy loam 12 to 24 inches: Fine sandy loam 24 to 28 inches: Fine sandy loam 28 to 36 inches: Gravelly fine sandy loam 36 to 65 inches: Gravelly sandy loam Minor Components Charlton Percent of map unit: 5 percent Landform: Hills 27
28 Canton Percent of map unit: 4 percent Landform: Hills Across-slope shape: Convex Paxton Percent of map unit: 3 percent Landform: Drumlins, hills, till plains Across-slope shape: Convex Leicester Percent of map unit: 3 percent Across-slope shape: Concave Woodbridge Percent of map unit: 2 percent Landform: Drumlins, hills Rainbow Percent of map unit: 2 percent Landform: Drumlins, hills Across-slope shape: Concave Narragansett Landform: Hills, till plains Across-slope shape: Convex 60D Canton and Charlton soils, 15 to 25 percent slopes Map Unit Setting Elevation: 0 to 1,200 feet Mean annual precipitation: 43 to 54 inches Mean annual air temperature: 45 to 55 degrees F Frost-free period: 140 to 185 days Map Unit Composition Canton and similar soils: 45 percent Charlton and similar soils: 35 percent Minor components: 20 percent 28
29 Description of Canton Setting Landform: Hills Across-slope shape: Convex Parent material: Coarse-loamy over sandy and gravelly melt-out till derived from granite and/or schist and/or gneiss Properties and qualities Slope: 15 to 25 percent Depth to restrictive feature: More than 80 inches Drainage class: Well drained Capacity of the most limiting layer to transmit water (Ksat): High (1.98 to 5.95 in/hr) Depth to water table: More than 80 inches Frequency of flooding: None Frequency of ponding: None Available water capacity: Low (about 5.6 inches) Interpretive groups Land capability (nonirrigated): 4e Typical profile 0 to 1 inches: Moderately decomposed plant material 1 to 3 inches: Gravelly fine sandy loam 3 to 15 inches: Gravelly loam 15 to 24 inches: Gravelly loam 24 to 30 inches: Gravelly loam 30 to 60 inches: Very gravelly loamy sand Description of Charlton Setting Landform: Hills Parent material: Coarse-loamy melt-out till derived from granite and/or schist and/or gneiss Properties and qualities Slope: 15 to 25 percent Depth to restrictive feature: More than 80 inches Drainage class: Well drained Capacity of the most limiting layer to transmit water (Ksat): Moderately high to high (0.57 to 5.95 in/hr) Depth to water table: More than 80 inches Frequency of flooding: None Frequency of ponding: None Available water capacity: Low (about 5.9 inches) Interpretive groups Land capability (nonirrigated): 4e Typical profile 0 to 4 inches: Fine sandy loam 4 to 7 inches: Fine sandy loam 7 to 19 inches: Fine sandy loam 29
30 19 to 27 inches: Gravelly fine sandy loam 27 to 65 inches: Gravelly fine sandy loam Minor Components Sutton Percent of map unit: 5 percent Leicester Percent of map unit: 5 percent Across-slope shape: Concave Chatfield Percent of map unit: 5 percent Landform: Hills, ridges Down-slope shape: Convex Hollis Percent of map unit: 5 percent Landform: Hills, ridges Down-slope shape: Convex Across-slope shape: Convex 73E Charlton-Chatfield complex, 15 to 45 percent slopes, very rocky Map Unit Setting Elevation: 0 to 1,200 feet Mean annual precipitation: 43 to 56 inches Mean annual air temperature: 45 to 55 degrees F Frost-free period: 140 to 185 days Map Unit Composition Charlton and similar soils: 45 percent Chatfield and similar soils: 30 percent Minor components: 25 percent Description of Charlton Setting Landform: Hills Parent material: Coarse-loamy melt-out till derived from granite and/or schist and/or gneiss 30
31 Properties and qualities Slope: 15 to 45 percent Surface area covered with cobbles, stones or boulders: 1.6 percent Depth to restrictive feature: More than 80 inches Drainage class: Well drained Capacity of the most limiting layer to transmit water (Ksat): Moderately high to high (0.57 to 5.95 in/hr) Depth to water table: More than 80 inches Frequency of flooding: None Frequency of ponding: None Available water capacity: Low (about 5.9 inches) Interpretive groups Land capability (nonirrigated): 7s Typical profile 0 to 4 inches: Fine sandy loam 4 to 7 inches: Fine sandy loam 7 to 19 inches: Fine sandy loam 19 to 27 inches: Gravelly fine sandy loam 27 to 65 inches: Gravelly fine sandy loam Description of Chatfield Setting Landform: Hills, ridges Down-slope shape: Convex Parent material: Coarse-loamy melt-out till derived from granite and/or schist and/or gneiss Properties and qualities Slope: 15 to 45 percent Surface area covered with cobbles, stones or boulders: 1.6 percent Depth to restrictive feature: 20 to 40 inches to lithic bedrock Drainage class: Well drained Capacity of the most limiting layer to transmit water (Ksat): Low to high (0.01 to 5.95 in/hr) Depth to water table: More than 80 inches Frequency of flooding: None Frequency of ponding: None Available water capacity: Low (about 3.3 inches) Interpretive groups Land capability (nonirrigated): 7s Typical profile 0 to 1 inches: Highly decomposed plant material 1 to 6 inches: Gravelly fine sandy loam 6 to 15 inches: Gravelly fine sandy loam 15 to 29 inches: Gravelly fine sandy loam 29 to 80 inches: Unweathered bedrock Minor Components Rock outcrop Percent of map unit: 10 percent 31
32 Sutton Percent of map unit: 5 percent Leicester Percent of map unit: 5 percent Across-slope shape: Concave Hollis Percent of map unit: 3 percent Landform: Hills, ridges Down-slope shape: Convex Across-slope shape: Convex Unnamed, red parent material Unnamed, sandy subsoil 84B Paxton and Montauk fine sandy loams, 3 to 8 percent slopes Map Unit Setting Elevation: 0 to 1,200 feet Mean annual precipitation: 43 to 56 inches Mean annual air temperature: 45 to 55 degrees F Frost-free period: 140 to 185 days Map Unit Composition Paxton and similar soils: 55 percent Montauk and similar soils: 30 percent Minor components: 15 percent Description of Paxton Setting Landform: Drumlins, hills, till plains Across-slope shape: Convex Parent material: Coarse-loamy lodgment till derived from granite and/or schist and/ or gneiss Properties and qualities Slope: 3 to 8 percent Depth to restrictive feature: 20 to 40 inches to dense material Drainage class: Well drained 32
33 Capacity of the most limiting layer to transmit water (Ksat): Very low to moderately high (0.00 to 0.20 in/hr) Depth to water table: About 18 to 30 inches Frequency of flooding: None Frequency of ponding: None Available water capacity: Low (about 3.4 inches) Interpretive groups Land capability (nonirrigated): 2e Typical profile 0 to 8 inches: Fine sandy loam 8 to 15 inches: Fine sandy loam 15 to 26 inches: Fine sandy loam 26 to 65 inches: Gravelly fine sandy loam Description of Montauk Setting Landform: Drumlins, hills Down-slope shape: Convex Parent material: Coarse-loamy lodgment till derived from granite and/or coarseloamy lodgment till derived from gneiss and/or coarse-loamy lodgment till derived from gneiss and/or coarse-loamy lodgment till derived from granite Properties and qualities Slope: 3 to 8 percent Depth to restrictive feature: 20 to 38 inches to dense material Drainage class: Well drained Capacity of the most limiting layer to transmit water (Ksat): Very low to moderately high (0.00 to 0.20 in/hr) Depth to water table: About 24 to 30 inches Frequency of flooding: None Frequency of ponding: None Available water capacity: Low (about 3.3 inches) Interpretive groups Land capability (nonirrigated): 2e Typical profile 0 to 4 inches: Fine sandy loam 4 to 14 inches: Fine sandy loam 14 to 25 inches: Sandy loam 25 to 39 inches: Gravelly loamy coarse sand 39 to 60 inches: Gravelly sandy loam Minor Components Woodbridge Percent of map unit: 3 percent Landform: Drumlins, hills Ridgebury Percent of map unit: 3 percent 33
34 Across-slope shape: Concave Charlton Percent of map unit: 3 percent Landform: Hills Canton Percent of map unit: 2 percent Landform: Hills Across-slope shape: Convex Stockbridge Landform: Hills Unnamed, less sloping Unnamed, stony surface Unnamed, red parent material 84C Paxton and Montauk fine sandy loams, 8 to 15 percent slopes Map Unit Setting Elevation: 0 to 1,200 feet Mean annual precipitation: 43 to 56 inches Mean annual air temperature: 45 to 55 degrees F Frost-free period: 140 to 185 days Map Unit Composition Paxton and similar soils: 55 percent Montauk and similar soils: 30 percent Minor components: 15 percent Description of Paxton Setting Landform: Drumlins, hills, till plains Across-slope shape: Convex Parent material: Coarse-loamy lodgment till derived from granite and/or schist and/ or gneiss 34
35 Properties and qualities Slope: 8 to 15 percent Depth to restrictive feature: 20 to 40 inches to dense material Drainage class: Well drained Capacity of the most limiting layer to transmit water (Ksat): Very low to moderately high (0.00 to 0.20 in/hr) Depth to water table: About 18 to 30 inches Frequency of flooding: None Frequency of ponding: None Available water capacity: Low (about 3.4 inches) Interpretive groups Land capability (nonirrigated): 3e Typical profile 0 to 8 inches: Fine sandy loam 8 to 15 inches: Fine sandy loam 15 to 26 inches: Fine sandy loam 26 to 65 inches: Gravelly fine sandy loam Description of Montauk Setting Landform: Drumlins, hills Down-slope shape: Convex Parent material: Coarse-loamy lodgment till derived from granite and/or coarseloamy lodgment till derived from gneiss and/or coarse-loamy lodgment till derived from gneiss and/or coarse-loamy lodgment till derived from granite Properties and qualities Slope: 8 to 15 percent Depth to restrictive feature: 20 to 38 inches to dense material Drainage class: Well drained Capacity of the most limiting layer to transmit water (Ksat): Very low to moderately high (0.00 to 0.20 in/hr) Depth to water table: About 24 to 30 inches Frequency of flooding: None Frequency of ponding: None Available water capacity: Low (about 3.3 inches) Interpretive groups Land capability (nonirrigated): 3e Typical profile 0 to 4 inches: Fine sandy loam 4 to 14 inches: Fine sandy loam 14 to 25 inches: Sandy loam 25 to 39 inches: Gravelly loamy coarse sand 39 to 60 inches: Gravelly sandy loam Minor Components Woodbridge Percent of map unit: 3 percent Landform: Drumlins, hills 35
36 Ridgebury Percent of map unit: 3 percent Across-slope shape: Concave Charlton Percent of map unit: 3 percent Landform: Hills Canton Percent of map unit: 2 percent Landform: Hills Across-slope shape: Convex Unnamed, stony surface Percent of map unit: 2 percent Stockbridge Landform: Hills Unnamed, red parent material 84D Paxton and Montauk fine sandy loams, 15 to 25 percent slopes Map Unit Setting Elevation: 0 to 1,200 feet Mean annual precipitation: 43 to 56 inches Mean annual air temperature: 45 to 55 degrees F Frost-free period: 140 to 185 days Map Unit Composition Paxton and similar soils: 55 percent Montauk and similar soils: 30 percent Minor components: 15 percent Description of Paxton Setting Landform: Drumlins, hills, till plains Across-slope shape: Convex 36
37 Parent material: Coarse-loamy lodgment till derived from granite and/or schist and/ or gneiss Properties and qualities Slope: 15 to 25 percent Depth to restrictive feature: 20 to 40 inches to dense material Drainage class: Well drained Capacity of the most limiting layer to transmit water (Ksat): Very low to moderately high (0.00 to 0.20 in/hr) Depth to water table: About 18 to 30 inches Frequency of flooding: None Frequency of ponding: None Available water capacity: Low (about 3.4 inches) Interpretive groups Land capability (nonirrigated): 4e Typical profile 0 to 8 inches: Fine sandy loam 8 to 15 inches: Fine sandy loam 15 to 26 inches: Fine sandy loam 26 to 65 inches: Gravelly fine sandy loam Description of Montauk Setting Landform: Drumlins, hills Down-slope shape: Convex Parent material: Coarse-loamy lodgment till derived from granite and/or coarseloamy lodgment till derived from gneiss and/or coarse-loamy lodgment till derived from gneiss and/or coarse-loamy lodgment till derived from granite Properties and qualities Slope: 15 to 25 percent Depth to restrictive feature: 20 to 38 inches to dense material Drainage class: Well drained Capacity of the most limiting layer to transmit water (Ksat): Very low to moderately high (0.00 to 0.20 in/hr) Depth to water table: About 24 to 30 inches Frequency of flooding: None Frequency of ponding: None Available water capacity: Low (about 3.3 inches) Interpretive groups Land capability (nonirrigated): 4e Typical profile 0 to 4 inches: Fine sandy loam 4 to 14 inches: Fine sandy loam 14 to 25 inches: Sandy loam 25 to 39 inches: Gravelly loamy coarse sand 39 to 60 inches: Gravelly sandy loam Minor Components Woodbridge Percent of map unit: 3 percent 37
38 Landform: Drumlins, hills Ridgebury Percent of map unit: 3 percent Across-slope shape: Concave Charlton Percent of map unit: 3 percent Landform: Hills Canton Percent of map unit: 2 percent Landform: Hills Across-slope shape: Convex Stockbridge Landform: Hills Unnamed, steep slopes Unnamed, red parent material Unnamed, stony surface 85B Paxton and Montauk fine sandy loams, 3 to 8 percent slopes, very stony Map Unit Setting Elevation: 0 to 1,200 feet Mean annual precipitation: 43 to 56 inches Mean annual air temperature: 45 to 55 degrees F Frost-free period: 140 to 185 days Map Unit Composition Paxton and similar soils: 55 percent Montauk and similar soils: 30 percent Minor components: 15 percent 38
39 Description of Paxton Setting Landform: Drumlins, hills, till plains Across-slope shape: Convex Parent material: Coarse-loamy lodgment till derived from granite and/or schist and/ or gneiss Properties and qualities Slope: 3 to 8 percent Surface area covered with cobbles, stones or boulders: 1.6 percent Depth to restrictive feature: 20 to 40 inches to dense material Drainage class: Well drained Capacity of the most limiting layer to transmit water (Ksat): Very low to moderately high (0.00 to 0.20 in/hr) Depth to water table: About 18 to 30 inches Frequency of flooding: None Frequency of ponding: None Available water capacity: Low (about 3.4 inches) Interpretive groups Land capability (nonirrigated): 6s Typical profile 0 to 8 inches: Fine sandy loam 8 to 15 inches: Fine sandy loam 15 to 26 inches: Fine sandy loam 26 to 65 inches: Gravelly fine sandy loam Description of Montauk Setting Landform: Drumlins, hills Down-slope shape: Convex Parent material: Coarse-loamy lodgment till derived from granite and/or coarseloamy lodgment till derived from gneiss and/or coarse-loamy lodgment till derived from gneiss and/or coarse-loamy lodgment till derived from granite Properties and qualities Slope: 3 to 8 percent Surface area covered with cobbles, stones or boulders: 1.6 percent Depth to restrictive feature: 20 to 38 inches to dense material Drainage class: Well drained Capacity of the most limiting layer to transmit water (Ksat): Very low to moderately high (0.00 to 0.20 in/hr) Depth to water table: About 24 to 30 inches Frequency of flooding: None Frequency of ponding: None Available water capacity: Low (about 3.3 inches) Interpretive groups Land capability (nonirrigated): 6s Typical profile 0 to 4 inches: Fine sandy loam 39
40 4 to 14 inches: Fine sandy loam 14 to 25 inches: Sandy loam 25 to 39 inches: Gravelly loamy coarse sand 39 to 60 inches: Gravelly sandy loam Minor Components Woodbridge Percent of map unit: 3 percent Landform: Drumlins, hills Ridgebury Percent of map unit: 3 percent Across-slope shape: Concave Charlton Percent of map unit: 3 percent Landform: Hills Canton Percent of map unit: 2 percent Landform: Hills Across-slope shape: Convex Stockbridge Landform: Hills Unnamed, less sloping Unnamed, red parent material Unnamed, nonstony surface 85C Paxton and Montauk fine sandy loams, 8 to 15 percent slopes, very stony Map Unit Setting Elevation: 0 to 1,200 feet 40
41 Mean annual precipitation: 43 to 56 inches Mean annual air temperature: 45 to 55 degrees F Frost-free period: 140 to 185 days Map Unit Composition Paxton and similar soils: 55 percent Montauk and similar soils: 30 percent Minor components: 15 percent Description of Paxton Setting Landform: Drumlins, hills, till plains Across-slope shape: Convex Parent material: Coarse-loamy lodgment till derived from granite and/or schist and/ or gneiss Properties and qualities Slope: 8 to 15 percent Surface area covered with cobbles, stones or boulders: 1.6 percent Depth to restrictive feature: 20 to 40 inches to dense material Drainage class: Well drained Capacity of the most limiting layer to transmit water (Ksat): Very low to moderately high (0.00 to 0.20 in/hr) Depth to water table: About 18 to 30 inches Frequency of flooding: None Frequency of ponding: None Available water capacity: Low (about 3.4 inches) Interpretive groups Land capability (nonirrigated): 6s Typical profile 0 to 8 inches: Fine sandy loam 8 to 15 inches: Fine sandy loam 15 to 26 inches: Fine sandy loam 26 to 65 inches: Gravelly fine sandy loam Description of Montauk Setting Landform: Drumlins, hills Down-slope shape: Convex Parent material: Coarse-loamy lodgment till derived from granite and/or coarseloamy lodgment till derived from gneiss and/or coarse-loamy lodgment till derived from gneiss and/or coarse-loamy lodgment till derived from granite Properties and qualities Slope: 8 to 15 percent Surface area covered with cobbles, stones or boulders: 1.6 percent Depth to restrictive feature: 20 to 38 inches to dense material Drainage class: Well drained Capacity of the most limiting layer to transmit water (Ksat): Very low to moderately high (0.00 to 0.20 in/hr) Depth to water table: About 24 to 30 inches 41
42 Frequency of flooding: None Frequency of ponding: None Available water capacity: Low (about 3.3 inches) Interpretive groups Land capability (nonirrigated): 6s Typical profile 0 to 4 inches: Fine sandy loam 4 to 14 inches: Fine sandy loam 14 to 25 inches: Sandy loam 25 to 39 inches: Gravelly loamy coarse sand 39 to 60 inches: Gravelly sandy loam Minor Components Woodbridge Percent of map unit: 4 percent Landform: Drumlins, hills Ridgebury Percent of map unit: 3 percent Across-slope shape: Concave Charlton Percent of map unit: 3 percent Landform: Hills Canton Percent of map unit: 2 percent Landform: Hills Across-slope shape: Convex Stockbridge Landform: Hills Unnamed, nonstony surface Unnamed, red parent material 42
43 86C Paxton and Montauk fine sandy loams, 3 to 15 percent slopes, extremely stony Map Unit Setting Elevation: 0 to 1,200 feet Mean annual precipitation: 43 to 56 inches Mean annual air temperature: 45 to 55 degrees F Frost-free period: 140 to 185 days Map Unit Composition Paxton and similar soils: 55 percent Montauk and similar soils: 30 percent Minor components: 15 percent Description of Paxton Setting Landform: Drumlins, hills, till plains Across-slope shape: Convex Parent material: Coarse-loamy lodgment till derived from granite and/or schist and/ or gneiss Properties and qualities Slope: 3 to 15 percent Surface area covered with cobbles, stones or boulders: 9.0 percent Depth to restrictive feature: 20 to 40 inches to dense material Drainage class: Well drained Capacity of the most limiting layer to transmit water (Ksat): Very low to moderately high (0.00 to 0.20 in/hr) Depth to water table: About 18 to 30 inches Frequency of flooding: None Frequency of ponding: None Available water capacity: Low (about 3.4 inches) Interpretive groups Land capability (nonirrigated): 7s Typical profile 0 to 8 inches: Fine sandy loam 8 to 15 inches: Fine sandy loam 15 to 26 inches: Fine sandy loam 26 to 65 inches: Gravelly fine sandy loam Description of Montauk Setting Landform: Drumlins, hills Down-slope shape: Convex 43
44 Parent material: Coarse-loamy lodgment till derived from granite and/or coarseloamy lodgment till derived from gneiss and/or coarse-loamy lodgment till derived from gneiss and/or coarse-loamy lodgment till derived from granite Properties and qualities Slope: 3 to 15 percent Surface area covered with cobbles, stones or boulders: 9.0 percent Depth to restrictive feature: 20 to 38 inches to dense material Drainage class: Well drained Capacity of the most limiting layer to transmit water (Ksat): Very low to moderately high (0.00 to 0.20 in/hr) Depth to water table: About 24 to 30 inches Frequency of flooding: None Frequency of ponding: None Available water capacity: Low (about 3.3 inches) Interpretive groups Land capability (nonirrigated): 7s Typical profile 0 to 4 inches: Fine sandy loam 4 to 14 inches: Fine sandy loam 14 to 25 inches: Sandy loam 25 to 39 inches: Gravelly loamy coarse sand 39 to 60 inches: Gravelly sandy loam Minor Components Woodbridge Percent of map unit: 4 percent Landform: Drumlins, hills Ridgebury Percent of map unit: 3 percent Across-slope shape: Concave Charlton Percent of map unit: 3 percent Landform: Hills Canton Percent of map unit: 2 percent Landform: Hills Across-slope shape: Convex Stockbridge Landform: Hills 44
45 Unnamed, nonstony surface Unnamed, red parent material 86D Paxton and Montauk fine sandy loams, 15 to 35 percent slopes, extremely stony Map Unit Setting Elevation: 0 to 1,200 feet Mean annual precipitation: 43 to 56 inches Mean annual air temperature: 45 to 55 degrees F Frost-free period: 140 to 185 days Map Unit Composition Paxton and similar soils: 55 percent Montauk and similar soils: 30 percent Minor components: 15 percent Description of Paxton Setting Landform: Drumlins, hills, till plains Across-slope shape: Convex Parent material: Coarse-loamy lodgment till derived from granite and/or schist and/ or gneiss Properties and qualities Slope: 15 to 35 percent Surface area covered with cobbles, stones or boulders: 9.0 percent Depth to restrictive feature: 20 to 40 inches to dense material Drainage class: Well drained Capacity of the most limiting layer to transmit water (Ksat): Very low to moderately high (0.00 to 0.20 in/hr) Depth to water table: About 18 to 30 inches Frequency of flooding: None Frequency of ponding: None Available water capacity: Low (about 3.4 inches) Interpretive groups Land capability (nonirrigated): 7s Typical profile 0 to 8 inches: Fine sandy loam 8 to 15 inches: Fine sandy loam 15 to 26 inches: Fine sandy loam 26 to 65 inches: Gravelly fine sandy loam 45
46 Description of Montauk Setting Landform: Drumlins, hills Down-slope shape: Convex Parent material: Coarse-loamy lodgment till derived from granite and/or coarseloamy lodgment till derived from gneiss and/or coarse-loamy lodgment till derived from gneiss and/or coarse-loamy lodgment till derived from granite Properties and qualities Slope: 15 to 35 percent Surface area covered with cobbles, stones or boulders: 9.0 percent Depth to restrictive feature: 20 to 38 inches to dense material Drainage class: Well drained Capacity of the most limiting layer to transmit water (Ksat): Very low to moderately high (0.00 to 0.20 in/hr) Depth to water table: About 24 to 30 inches Frequency of flooding: None Frequency of ponding: None Available water capacity: Low (about 3.3 inches) Interpretive groups Land capability (nonirrigated): 7s Typical profile 0 to 4 inches: Fine sandy loam 4 to 14 inches: Fine sandy loam 14 to 25 inches: Sandy loam 25 to 39 inches: Gravelly loamy coarse sand 39 to 60 inches: Gravelly sandy loam Minor Components Woodbridge Percent of map unit: 4 percent Landform: Drumlins, hills Ridgebury Percent of map unit: 3 percent Across-slope shape: Concave Charlton Percent of map unit: 3 percent Landform: Hills Canton Percent of map unit: 2 percent Landform: Hills Across-slope shape: Convex 46
47 Stockbridge Landform: Hills Unnamed, stony surface Unnamed, red parent material 306 Udorthents-Urban land complex Map Unit Setting Elevation: 0 to 2,000 feet Mean annual precipitation: 43 to 56 inches Mean annual air temperature: 45 to 55 degrees F Frost-free period: 120 to 185 days Map Unit Composition Udorthents and similar soils: 50 percent Urban land: 35 percent Minor components: 15 percent Description of Udorthents Setting Down-slope shape: Convex Parent material: Drift Properties and qualities Slope: 0 to 25 percent Depth to restrictive feature: More than 80 inches Drainage class: Well drained Capacity of the most limiting layer to transmit water (Ksat): Very low to high (0.00 to 1.98 in/hr) Depth to water table: About 54 to 72 inches Frequency of flooding: None Frequency of ponding: None Available water capacity: Moderate (about 6.8 inches) Interpretive groups Land capability (nonirrigated): 3e Typical profile 0 to 5 inches: Loam 5 to 21 inches: Gravelly loam 21 to 80 inches: Very gravelly sandy loam 47
48 Description of Urban Land Interpretive groups Land capability (nonirrigated): 8 Typical profile 0 to 6 inches: Material Minor Components Unnamed, undisturbed soils Percent of map unit: 8 percent Udorthents, wet substratum Percent of map unit: 5 percent Down-slope shape: Convex Rock outcrop Percent of map unit: 2 percent 307 Urban land Map Unit Setting Elevation: 0 to 2,000 feet Mean annual precipitation: 43 to 56 inches Mean annual air temperature: 45 to 55 degrees F Frost-free period: 120 to 185 days Map Unit Composition Urban land: 80 percent Minor components: 20 percent Description of Urban Land Interpretive groups Land capability (nonirrigated): 8 Typical profile 0 to 6 inches: Material Minor Components Udorthents, wet substratum Percent of map unit: 10 percent Down-slope shape: Convex Unnamed, undisturbed soils Percent of map unit: 10 percent 48
49 308 Udorthents, smoothed Map Unit Setting Elevation: 0 to 2,000 feet Mean annual precipitation: 43 to 56 inches Mean annual air temperature: 45 to 55 degrees F Frost-free period: 120 to 185 days Map Unit Composition Udorthents and similar soils: 80 percent Minor components: 20 percent Description of Udorthents Setting Down-slope shape: Convex Properties and qualities Slope: 0 to 35 percent Depth to restrictive feature: More than 80 inches Drainage class: Moderately well drained Capacity of the most limiting layer to transmit water (Ksat): Very low to high (0.00 to 1.98 in/hr) Depth to water table: About 24 to 54 inches Frequency of flooding: None Frequency of ponding: None Available water capacity: Moderate (about 6.8 inches) Interpretive groups Land capability (nonirrigated): 4e Typical profile 0 to 5 inches: Loam 5 to 21 inches: Gravelly loam 21 to 80 inches: Very gravelly sandy loam Minor Components Udorthents, wet substratum Percent of map unit: 7 percent Unnamed, undisturbed soils Percent of map unit: 7 percent Urban land Percent of map unit: 5 percent Rock outcrop 49
50 W Water Map Unit Composition Water: 100 percent 50
51 Soil Information for All Uses Suitabilities and Limitations for Use The Suitabilities and Limitations for Use section includes various soil interpretations displayed as thematic maps with a summary table for the soil map units in the selected area of interest. A single value or rating for each map unit is generated by aggregating the interpretive ratings of individual map unit components. This aggregation process is defined for each interpretation. Land Classifications Land Classifications are specified land use and management groupings that are assigned to soil areas because combinations of soil have similar behavior for specified practices. Most are based on soil properties and other factors that directly influence the specific use of the soil. Example classifications include ecological site classification, farmland classification, irrigated and nonirrigated land capability classification, and hydric rating. Farmland Classification Farmland classification identifies map units as prime farmland, farmland of statewide importance, farmland of local importance, or unique farmland. It identifies the location and extent of the soils that are best suited to food, feed, fiber, forage, and oilseed crops. NRCS policy and procedures on prime and unique farmlands are published in the "Federal Register," Vol. 43, No. 21, January 31,
52 Hillside Rd 41 49' 27'' 41 48' 33'' 72 15' 59'' 72 15' 56'' Tower Ct Ledoyt Rd 84B 85C 46B 85C 45A W 84B 47C 45A 86D Storrs Rd W 86D 73E B Map Scale: 1:11,900 if printed on A size (8.5" x 11") sheet. Moulton Rd Laurel Way 86C Eagleville Rd 46B Tower Loop Rd B 84D 47C 45C Glenbrook Rd Meters Feet ,000 2,000 3,000 Custom Soil Resource Report Map Farmland Classification W 85B Horse Barn Hill Rd 84C B 84B 84B 45B 2 85B 60D 84B 86D 84D 45B 46B W 50B Willowbrook Rd 85C B Gurleyville Rd 45B 47C Dog Ln 72 14' 8'' 72 14' 10'' 41 49' 24'' 41 48' 30''
53 MAP LEGEND MAP INFORMATION Area of Interest (AOI) Soils Soil Ratings Area of Interest (AOI) Soil Map Units Not prime farmland All areas are prime farmland Prime farmland if drained Prime farmland if protected from flooding or not frequently flooded during the growing season Prime farmland if irrigated Prime farmland if drained and either protected from flooding or not frequently flooded during the growing season Prime farmland if irrigated and drained Prime farmland if irrigated and either protected from flooding or not frequently flooded during the growing season Political Features Prime farmland if subsoiled, completely removing the root inhibiting soil layer Prime farmland if irrigated and the product of I (soil erodibility) x C (climate factor) does not exceed 60 Prime farmland if irrigated and reclaimed of excess salts and sodium Farmland of statewide importance Farmland of local importance Farmland of unique importance Not rated or not available Cities Water Features Transportation Oceans Streams and Canals Rails Interstate Highways US Routes Major Roads Local Roads Map Scale: 1:11,900 if printed on A size (8.5" 11") sheet. The soil surveys that comprise your AOI were mapped at 1:12,000. Please rely on the bar scale on each map sheet for accurate map measurements. Source of Map: Natural Resources Conservation Service Web Soil Survey URL: Coordinate System: UTM Zone 18N NAD83 This product is generated from the USDA-NRCS certified data as of the version date(s) listed below. Soil Survey Area: State of Connecticut Survey Area Data: Version 7, Dec 3, 2009 Date(s) aerial images were photographed: 8/16/2006; 7/17/2006 The orthophoto or other base map on which the soil lines were compiled and digitized probably differs from the background imagery displayed on these maps. As a result, some minor shifting of map unit boundaries may be evident.
54 Table Farmland Classification Farmland Classification Summary by Map Unit State of Connecticut Map unit symbol Map unit name Rating Acres in AOI Percent of AOI 2 Ridgebury fine sandy loam Farmland of statewide importance % 3 Ridgebury, Leicester, and Whitman soils, extremely stony 45A Woodbridge fine sandy loam, 0 to 3 percent slopes 45B Woodbridge fine sandy loam, 3 to 8 percent slopes Not prime farmland % All areas are prime farmland % All areas are prime farmland % 45C Woodbridge fine sandy loam, 8 to 15 percent slopes 46B Woodbridge fine sandy loam, 2 to 8 percent slopes, very stony 47C Woodbridge fine sandy loam, 2 to 15 percent slopes, extremely stony 50B Sutton fine sandy loam, 3 to 8 percent slopes 60D Canton and Charlton soils, 15 to 25 percent slopes 73E Charlton-Chatfield complex, 15 to 45 percent slopes, very rocky 84B 84C 84D 85B 85C 86C 86D Paxton and Montauk fine sandy loams, 3 to 8 percent slopes Paxton and Montauk fine sandy loams, 8 to 15 percent slopes Paxton and Montauk fine sandy loams, 15 to 25 percent slopes Paxton and Montauk fine sandy loams, 3 to 8 percent slopes, very stony Paxton and Montauk fine sandy loams, 8 to 15 percent slopes, very stony Paxton and Montauk fine sandy loams, 3 to 15 percent slopes, extremely stony Paxton and Montauk fine sandy loams, 15 to 35 percent slopes, extremely stony Farmland of statewide importance % Not prime farmland % Not prime farmland % All areas are prime farmland % Not prime farmland % Not prime farmland % All areas are prime farmland % Farmland of statewide importance % Not prime farmland % Not prime farmland % Not prime farmland % Not prime farmland % Not prime farmland % 306 Udorthents-Urban land complex Not prime farmland % 307 Urban land Not prime farmland % 308 Udorthents, smoothed Not prime farmland % W Water Not prime farmland % Totals for Area of Interest % 54
55 Rating Options Farmland Classification Aggregation Method: No Aggregation Necessary Tie-break Rule: Lower 55
56 Soil Properties and Qualities The Soil Properties and Qualities section includes various soil properties and qualities displayed as thematic maps with a summary table for the soil map units in the selected area of interest. A single value or rating for each map unit is generated by aggregating the interpretive ratings of individual map unit components. This aggregation process is defined for each property or quality. Soil Physical Properties Soil Physical Properties are measured or inferred from direct observations in the field or laboratory. Examples of soil physical properties include percent clay, organic matter, saturated hydraulic conductivity, available water capacity, and bulk density. Organic Matter (surface layer) Organic matter is the plant and animal residue in the soil at various stages of decomposition. The estimated content of organic matter is expressed as a percentage, by weight, of the soil material that is less than 2 millimeters in diameter. The content of organic matter in a soil can be maintained by returning crop residue to the soil. Organic matter has a positive effect on available water capacity, water infiltration, soil organism activity, and tilth. It is a source of nitrogen and other nutrients for crops and soil organisms. An irregular distribution of organic carbon with depth may indicate different episodes of soil deposition or soil formation. Soils that are very high in organic matter have poor engineering properties and subside upon drying. For each soil layer, this attribute is actually recorded as three separate values in the database. A low value and a high value indicate the range of this attribute for the soil component. A "representative" value indicates the expected value of this attribute for the component. For this soil property, only the representative value is used. 56
57 Hillside Rd 41 49' 27'' 41 48' 33'' 72 15' 59'' 72 15' 56'' Tower Ct Ledoyt Rd 84B 85C 46B 85C 45A W 84B 47C 45A 86D Storrs Rd W 86D 73E B Map Scale: 1:11,900 if printed on A size (8.5" x 11") sheet. Moulton Rd Laurel Way 86C Eagleville Rd 46B Tower Loop Rd B 84D 47C 45C Glenbrook Rd Meters Feet ,000 2,000 3,000 Custom Soil Resource Report Map Organic Matter (surface layer) W 85B Horse Barn Hill Rd 84C B 84B 84B 45B 2 85B 60D 84B 86D 84D 45B 46B W 50B Willowbrook Rd 85C B Gurleyville Rd 45B 47C Dog Ln 72 14' 8'' 72 14' 10'' 41 49' 24'' 41 48' 30''
58 MAP LEGEND Area of Interest (AOI) Area of Interest (AOI) Soils Soil Map Units Soil Ratings <= 3.5 > 3.5 AND <= 4 > 4 AND <= 5.5 > 5.5 AND <= 70 Not rated or not available Political Features Cities Water Features Oceans Streams and Canals Transportation Rails Interstate Highways MAP INFORMATION Map Scale: 1:11,900 if printed on A size (8.5" 11") sheet. The soil surveys that comprise your AOI were mapped at 1:12,000. Please rely on the bar scale on each map sheet for accurate map measurements. Source of Map: Natural Resources Conservation Service Web Soil Survey URL: Coordinate System: UTM Zone 18N NAD83 This product is generated from the USDA-NRCS certified data as of the version date(s) listed below. Soil Survey Area: State of Connecticut Survey Area Data: Version 7, Dec 3, 2009 Date(s) aerial images were photographed: 8/16/2006; 7/17/2006 The orthophoto or other base map on which the soil lines were compiled and digitized probably differs from the background imagery displayed on these maps. As a result, some minor shifting of map unit boundaries may be evident. US Routes Major Roads Local Roads
59 Table Organic Matter (surface layer) Organic Matter Summary by Map Unit State of Connecticut Map unit symbol Map unit name Rating (percent) Acres in AOI Percent of AOI 2 Ridgebury fine sandy loam % 3 Ridgebury, Leicester, and Whitman soils, extremely stony 45A Woodbridge fine sandy loam, 0 to 3 percent slopes 45B Woodbridge fine sandy loam, 3 to 8 percent slopes 45C Woodbridge fine sandy loam, 8 to 15 percent slopes 46B Woodbridge fine sandy loam, 2 to 8 percent slopes, very stony 47C Woodbridge fine sandy loam, 2 to 15 percent slopes, extremely stony % % % % % % 50B Sutton fine sandy loam, 3 to 8 percent slopes 60D Canton and Charlton soils, 15 to 25 percent slopes 73E Charlton-Chatfield complex, 15 to 45 percent slopes, very rocky 84B 84C 84D 85B 85C 86C 86D Paxton and Montauk fine sandy loams, 3 to 8 percent slopes Paxton and Montauk fine sandy loams, 8 to 15 percent slopes Paxton and Montauk fine sandy loams, 15 to 25 percent slopes Paxton and Montauk fine sandy loams, 3 to 8 percent slopes, very stony Paxton and Montauk fine sandy loams, 8 to 15 percent slopes, very stony Paxton and Montauk fine sandy loams, 3 to 15 percent slopes, extremely stony Paxton and Montauk fine sandy loams, 15 to 35 percent slopes, extremely stony % % % % % % % % % % 306 Udorthents-Urban land complex % 307 Urban land % 308 Udorthents, smoothed % W Water % Totals for Area of Interest % 59
60 Rating Options Organic Matter (surface layer) Units of Measure: percent Aggregation Method: Dominant Component Component Percent Cutoff: None Specified Tie-break Rule: Higher Interpret Nulls as Zero: No Layer Options: Surface Layer Water Features Water Features include ponding frequency, flooding frequency, and depth to water table. Depth to Water Table "Water table" refers to a saturated in the soil. It occurs during specified months. Estimates of the upper limit are based mainly on observations of the water table at selected sites and on evidence of a saturated, namely grayish colors (redoximorphic features) in the soil. A saturated that lasts for less than a month is not considered a water table. This attribute is actually recorded as three separate values in the database. A low value and a high value indicate the range of this attribute for the soil component. A "representative" value indicates the expected value of this attribute for the component. For this soil property, only the representative value is used. 60
61 Hillside Rd 41 49' 27'' 41 48' 33'' 72 15' 59'' 72 15' 56'' Tower Ct Ledoyt Rd 84B 85C 46B 85C 45A W 84B 47C 45A 86D Storrs Rd W 86D 73E B Map Scale: 1:11,900 if printed on A size (8.5" x 11") sheet. Moulton Rd Laurel Way 86C Eagleville Rd 46B Tower Loop Rd B 84D 47C 45C Glenbrook Rd Meters Feet ,000 2,000 3,000 Custom Soil Resource Report Map Depth to Water Table W 85B Horse Barn Hill Rd 84C B 84B 84B 45B 2 85B 60D 84B 86D 84D 45B 46B W 50B Willowbrook Rd 85C B Gurleyville Rd 45B 47C Dog Ln 72 14' 8'' 72 14' 10'' 41 49' 24'' 41 48' 30''
62 MAP LEGEND Area of Interest (AOI) Area of Interest (AOI) Soils Soil Map Units Soil Ratings > 200 Political Features Cities Water Features Oceans Streams and Canals Transportation Rails MAP INFORMATION Map Scale: 1:11,900 if printed on A size (8.5" 11") sheet. The soil surveys that comprise your AOI were mapped at 1:12,000. Please rely on the bar scale on each map sheet for accurate map measurements. Source of Map: Natural Resources Conservation Service Web Soil Survey URL: Coordinate System: UTM Zone 18N NAD83 This product is generated from the USDA-NRCS certified data as of the version date(s) listed below. Soil Survey Area: State of Connecticut Survey Area Data: Version 7, Dec 3, 2009 Date(s) aerial images were photographed: 8/16/2006; 7/17/2006 The orthophoto or other base map on which the soil lines were compiled and digitized probably differs from the background imagery displayed on these maps. As a result, some minor shifting of map unit boundaries may be evident. Interstate Highways US Routes Major Roads Local Roads
63 Table Depth to Water Table Depth to Water Table Summary by Map Unit State of Connecticut Map unit symbol Map unit name Rating (centimeters) Acres in AOI Percent of AOI 2 Ridgebury fine sandy loam % 3 Ridgebury, Leicester, and Whitman soils, extremely stony % 45A 45B 45C 46B 47C Woodbridge fine sandy loam, 0 to 3 percent slopes Woodbridge fine sandy loam, 3 to 8 percent slopes Woodbridge fine sandy loam, 8 to 15 percent slopes Woodbridge fine sandy loam, 2 to 8 percent slopes, very stony Woodbridge fine sandy loam, 2 to 15 percent slopes, extremely stony 50B Sutton fine sandy loam, 3 to 8 percent slopes 60D 73E 84B 84C 84D 85B 85C 86C 86D Canton and Charlton soils, 15 to 25 percent slopes Charlton-Chatfield complex, 15 to 45 percent slopes, very rocky Paxton and Montauk fine sandy loams, 3 to 8 percent slopes Paxton and Montauk fine sandy loams, 8 to 15 percent slopes Paxton and Montauk fine sandy loams, 15 to 25 percent slopes Paxton and Montauk fine sandy loams, 3 to 8 percent slopes, very stony Paxton and Montauk fine sandy loams, 8 to 15 percent slopes, very stony Paxton and Montauk fine sandy loams, 3 to 15 percent slopes, extremely stony Paxton and Montauk fine sandy loams, 15 to 35 percent slopes, extremely stony % % % % % % > % > % % % % % % % % 306 Udorthents-Urban land complex % 307 Urban land > % 308 Udorthents, smoothed % W Water > % Totals for Area of Interest % 63
64 Rating Options Depth to Water Table Units of Measure: centimeters Aggregation Method: Dominant Component Component Percent Cutoff: None Specified Tie-break Rule: Lower Interpret Nulls as Zero: No Beginning Month: January Ending Month: December Flooding Frequency Class Flooding is the temporary inundation of an area caused by overflowing streams, by runoff from adjacent slopes, or by tides. Water standing for short periods after rainfall or snowmelt is not considered flooding, and water standing in swamps and marshes is considered ponding rather than flooding. Frequency is expressed as none, very rare, rare, occasional, frequent, and very frequent. "None" means that flooding is not probable. The chance of flooding is nearly 0 percent in any year. Flooding occurs less than once in 500 years. "Very rare" means that flooding is very unlikely but possible under extremely unusual weather conditions. The chance of flooding is less than 1 percent in any year. "Rare" means that flooding is unlikely but possible under unusual weather conditions. The chance of flooding is 1 to 5 percent in any year. "Occasional" means that flooding occurs infrequently under normal weather conditions. The chance of flooding is 5 to 50 percent in any year. "Frequent" means that flooding is likely to occur often under normal weather conditions. The chance of flooding is more than 50 percent in any year but is less than 50 percent in all months in any year. "Very frequent" means that flooding is likely to occur very often under normal weather conditions. The chance of flooding is more than 50 percent in all months of any year. 64
65
Custom Soil Resource Report for Fond du Lac County, Wisconsin
 United States Department of Agriculture Natural Resources Conservation Service A product of the National Cooperative Soil Survey, a joint effort of the United States Department of Agriculture and other
Custom Soil Resource Report for Craighead County, Arkansas
 United States Department of Agriculture Natural Resources Conservation Service A product of the National Cooperative Soil Survey, a joint effort of the United States Department of Agriculture and other
 108 40' 29'' W Soil Map Mesa County Area, Colorado 108 36' 55'' W 39 10' 11'' N 39 6' 31'' N 4331700 4332500 4333300 4334100 4334900 4335700 4336500 4337300 4338100 701100 701900 702700 703500 704300 705100
Custom Soil Resource Report for Daviess County, Missouri
 United States Department of Agriculture Natural Resources Conservation Service A product of the National Cooperative Soil Survey, a joint effort of the United States Department of Agriculture and other
Custom Soil Resource Report for Kent County, Maryland
 United States Department of Agriculture Natural Resources Conservation Service A product of the National Cooperative Soil Survey, a joint effort of the United States Department of Agriculture and other
Custom Soil Resource Report for Kane County, Illinois
 United States Department of Agriculture Natural Resources Conservation Service A product of the National Cooperative Soil Survey, a joint effort of the United States Department of Agriculture and other
Custom Soil Resource Report for State of Connecticut
 United States Department of Agriculture Natural Resources Conservation Service A product of the National Cooperative Soil Survey, a joint effort of the United States Department of Agriculture and other
Custom Soil Resource Report for Pope County, Illinois
 United States Department of Agriculture Natural Resources Conservation Service A product of the National Cooperative Soil Survey, a joint effort of the United States Department of Agriculture and other
Custom Soil Resource Report for Pope County, Illinois
 United States Department of Agriculture Natural Resources Conservation Service A product of the National Cooperative Soil Survey, a joint effort of the United States Department of Agriculture and other
Custom Soil Resource Report for Southampton County, Virginia
 United States Department of Agriculture Natural Resources Conservation Service A product of the National Cooperative Soil Survey, a joint effort of the United States Department of Agriculture and other
Custom Soil Resource Report for Clark County, Missouri
 United States Department of Agriculture Natural Resources Conservation Service A product of the National Cooperative Soil Survey, a joint effort of the United States Department of Agriculture and other
Custom Soil Resource Report for Lane County Area, Oregon
 United States Department of Agriculture Natural Resources Conservation Service A product of the National Cooperative Soil Survey, a joint effort of the United States Department of Agriculture and other
NRCS Soils Report. Encana Oil & Gas (USA) Inc. C19 Injection Well. OA Project No
 Inc. C19 Injection Well. OA Project No") NRCS Soils Report Encana Oil & Gas (USA) Inc. C19 Injection Well OA Project No. 012-0178 826 21 ½ Road Grand Junction, CO 81505 TEL 970.263.7800 FAX 970.263.7456 United States Department of Agriculture
NRCS Soils Report Encana Oil & Gas (USA) Inc. C19 Injection Well OA Project No. 012-0178 826 21 ½ Road Grand Junction, CO 81505 TEL 970.263.7800 FAX 970.263.7456 United States Department of Agriculture
Custom Soil Resource Report for Franklin County, Washington
 United States Department of Agriculture Natural Resources Conservation Service A product of the National Cooperative Soil Survey, a joint effort of the United States Department of Agriculture and other
Custom Soil Resource Report for Hamilton County, Texas
 United States Department of Agriculture Natural Resources Conservation Service A product of the National Cooperative Soil Survey, a joint effort of the United States Department of Agriculture and other
Custom Soil Resource Report for Choctaw County, Oklahoma, and McCurtain County, Oklahoma
 United States Department of Agriculture Natural Resources Conservation Service A product of the National Cooperative Soil Survey, a joint effort of the United States Department of Agriculture and other
Custom Soil Resource Report for Hancock County Area, Maine
 United States Department of Agriculture Natural Resources Conservation Service A product of the National Cooperative Soil Survey, a joint effort of the United States Department of Agriculture and other
Custom Soil Resource Report for Payne County, Oklahoma
 United States Department of Agriculture Natural Resources Conservation Service A product of the National Cooperative Soil Survey, a joint effort of the United States Department of Agriculture and other
Custom Soil Resource Report for Banks and Stephens Counties, Georgia
 United States Department of Agriculture Natural Resources Conservation Service A product of the National Cooperative Soil Survey, a joint effort of the United States Department of Agriculture and other
Custom Soil Resource Report for Polk County, Oregon
 United States Department of Agriculture Natural Resources Conservation Service A product of the National Cooperative Soil Survey, a joint effort of the United States Department of Agriculture and other
Custom Soil Resource Report for Yamhill Area, Oregon
 United States Department of Agriculture Natural Resources Conservation Service A product of the National Cooperative Soil Survey, a joint effort of the United States Department of Agriculture and other
Custom Soil Resource Report for Ulster County, New York
 United States Department of Agriculture Natural Resources Conservation Service A product of the National Cooperative Soil Survey, a joint effort of the United States Department of Agriculture and other
Custom Soil Resource Report for Alsea Area, Oregon, and Lincoln County Area, Oregon
 United States Department of Agriculture Natural Resources Conservation Service A product of the National Cooperative Soil Survey, a joint effort of the United States Department of Agriculture and other
Custom Soil Resource Report for Polk County, Oregon
 United States Department of Agriculture Natural Resources Conservation Service A product of the National Cooperative Soil Survey, a joint effort of the United States Department of Agriculture and other
Custom Soil Resource Report for Union County, South Carolina
 United States Department of Agriculture Natural Resources Conservation Service A product of the National Cooperative Soil Survey, a joint effort of the United States Department of Agriculture and other
Custom Soil Resource Report for Duval County, Texas
 United States Department of Agriculture Natural Resources Conservation Service A product of the National Cooperative Soil Survey, a joint effort of the United States Department of Agriculture and other
Custom Soil Resource Report for Hinds County, Mississippi
 United States Department of Agriculture Natural Resources Conservation Service A product of the National Cooperative Soil Survey, a joint effort of the United States Department of Agriculture and other
NRCS Soils Report. Grand River Gathering LLC K28E Compressor Station. OA Project No
 NRCS Soils Report Grand River Gathering LLC K28E Compressor Station OA Project No. 012-032 82 21 ½ Road Grand Junction, CO 81505 TEL 90.23.800 FAX 90.23.45 United States Department of Agriculture A product
Custom Soil Resource Report for Cibola Area, New Mexico, Parts of Cibola, McKinley, and Valencia Counties
 United States Department of Agriculture Natural Resources Conservation Service A product of the National Cooperative Soil Survey, a joint effort of the United States Department of Agriculture and other
Custom Soil Resource Report for Walker County, Texas
 United States Department of Agriculture Natural Resources Conservation Service A product of the National Cooperative Soil Survey, a joint effort of the United States Department of Agriculture and other
Custom Soil Resource Report for Gallia County, Ohio
 United States Department of Agriculture Natural Resources Conservation Service A product of the National Cooperative Soil Survey, a joint effort of the United States Department of Agriculture and other
APPENDIX A SOIL RESOURCES REPORTS
 APPENDIX A SOIL RESOURCES REPORTS United States Department of Agriculture Natural Resources Conservation Service A product of the National Cooperative Soil Survey, a joint effort of the United States Department
BENNING ROAD & BRIDGES TRANSPORTATION IMPROVEMENTS NRCS SOIL RESOURCE REPORT DRAFT MAY 2016
 BENNING ROAD & BRIDGES TRANSPORTATION IMPROVEMENTS NRCS SOIL RESOURCE REPORT DRAFT MAY 2016 United States Department of Agriculture Natural Resources Conservation Service A product of the National Cooperative
Custom Soil Resource Report for McCurtain County, Oklahoma
 United States Department of Agriculture Natural Resources Conservation Service A product of the National Cooperative Soil Survey, a joint effort of the United States Department of Agriculture and other
Custom Soil Resource Report for Orange County, New York, and Sussex County, New Jersey
 United States Department of Agriculture Natural Resources Conservation Service A product of the National Cooperative Soil Survey, a joint effort of the United States Department of Agriculture and other
~ NRCS. Custom Soil Resource Report for Rifle Area, Colorado, Parts of Garfield and Mesa Counties. Encana Upper Gate Communication Tower
 USA United States ~ epartment of Agriculture ~ NRCS Natural Resources Conservation Service A product of the National Cooperative Soil Survey, a joint effort of the United States epartment of Agriculture
~ NRCS. Custom Soil Resource Report for Rifle Area, Colorado, Parts of Garfield and Mesa Counties. USDA United States ~ Department of Agriculture
 USA United States ~ epartment of Agriculture ~ NRCS Natural Resources Conservation Service A product of the National Cooperative Soil Survey, a joint effort of the United States epartment of Agriculture
Custom Soil Resource Report for McCurtain County, Oklahoma, and Red River County, Texas
 United States Department of Agriculture Natural Resources Conservation Service A product of the National Cooperative Soil Survey, a joint effort of the United States Department of Agriculture and other
Custom Soil Resource Report for Centre County, Pennsylvania
 United States Department of Agriculture Natural Resources Conservation Service A product of the National Cooperative Soil Survey, a joint effort of the United States Department of Agriculture and other
Custom Soil Resource Report for Orange County, Virginia
 United States Department of Agriculture Natural Resources Conservation Service A product of the National Cooperative Soil Survey, a joint effort of the United States Department of Agriculture and other
Custom Soil Resource Report for Hinds County, Mississippi
 United States Department of Agriculture Natural Resources Conservation Service A product of the National Cooperative Soil Survey, a joint effort of the United States Department of Agriculture and other
Custom Soil Resource Report for Columbia County, New York
 United States Department of Agriculture Natural Resources Conservation Service A product of the National Cooperative Soil Survey, a joint effort of the United States Department of Agriculture and other
~ NRCS. Custom Soil Resource Report for Rifle Area, Colorado, Parts of Garfield and Mesa Counties. USDA United States ~ Department of Agriculture
 USA United States ~ epartment of Agriculture ~ NRCS Natural Resources Conservation Service A product of the National Cooperative Soil Survey, a joint effort of the United States epartment of Agriculture
Custom Soil Resource Report for Van Buren County, Iowa
 United States Department of Agriculture Natural Resources Conservation Service A product of the National Cooperative Soil Survey, a joint effort of the United States Department of Agriculture and other
Custom Soil Resource Report for Webb County, Texas
 United States Department of Agriculture Natural Resources Conservation Service A product of the National Cooperative Soil Survey, a joint effort of the United States Department of Agriculture and other
Custom Soil Resource Report for Marion County Area, Oregon
 United States Department of Agriculture Natural Resources Conservation Service A product of the National Cooperative Soil Survey, a joint effort of the United States Department of Agriculture and other
Custom Soil Resource Report Soil Map
 77 11' 22'' W Custom Soil Resource Report Soil Map 77 9' 43'' W 36 48' 13'' N 304700 304900 305100 305300 305500 305700 305900 306100 306300 306500 306700 306900 307100 36 48' 13'' N 36 47' 21'' N 4073800
Custom Soil Resource Report for Centre County, Pennsylvania
 United States Department of Agriculture Natural Resources Conservation Service A product of the National Cooperative Soil Survey, a joint effort of the United States Department of Agriculture and other
Submittal Document II.I. USDA NRCS Soil Resources Report
 Submittal Document II.I. USDA NRCS Soil Resources Report United States Department of Agriculture Natural Resources Conservation Service A product of the National Cooperative Soil Survey, a joint effort
Custom Soil Resource Report for Centre County, Pennsylvania
 United States Department of Agriculture Natural Resources Conservation Service A product of the National Cooperative Soil Survey, a joint effort of the United States Department of Agriculture and other
Custom Soil Resource Report for Clearfield County, Pennsylvania
 United States Department of Agriculture Natural Resources Conservation Service A product of the National Cooperative Soil Survey, a joint effort of the United States Department of Agriculture and other
Preliminary Layout Drawings
 Preliminary Layout Drawings Geotechnical Evaluation Memorandum Memorandum To: From: Ryan S. Kingsbury Stephen L. Whiteside, P.E. Tyler C. Dunn Michael P. Smith Date: November 9, 2011 Subject: Preliminary
Ecological Sites. Topics of Discussion 2/28/2014. Ecological Site Classification. Ecological Site Key. Ecological Site Descriptions
 Ecological Sites Topics of Discussion Ecological Site Classification Ecological Site Key Ecological Site Descriptions Jon Siddoway Montana NRCS Helping People Help the Land An Ecological Site is defined
Custom Soil Resource Report for Madison County, Virginia, and Orange County, Virginia
 United States Department of Agriculture Natural Resources Conservation Service A product of the National Cooperative Soil Survey, a joint effort of the United States Department of Agriculture and other
Custom Soil Resource Report for Centre County, Pennsylvania
 United States Department of Agriculture Natural Resources Conservation Service A product of the National Cooperative Soil Survey, a joint effort of the United States Department of Agriculture and other
THE SCORE CARD. Observed Soil Properties. Interpretive Soil Properties
 Rev. 07/18/2008 Jim Doolittle Doug Malo Tom Schumacher Plant Science Department SDSU and Kent Cooley Lance Howe Bruce Kunze Jim Millar Walt Schaefer Dan Shurtliff Steve Winter USDA Natural Resources Conservation
Farmland Classification Centre County, Pennsylvania (Student Farm Site) Web Soil Survey National Cooperative Soil Survey
 Web Soil Survey National Cooperative Soil Survey") 256300 256600 256900 257200 257500 257800 258100 77 51' 20'' W 77 53' 26'' W Farmland Classification Centre County, Pennsylvania 258400 258700 259000 40 49' 4'' N 4520600 4520900 4520900 4521200 4521200
256300 256600 256900 257200 257500 257800 258100 77 51' 20'' W 77 53' 26'' W Farmland Classification Centre County, Pennsylvania 258400 258700 259000 40 49' 4'' N 4520600 4520900 4520900 4521200 4521200
September 20, 2016 Soils Investigation for Agricultural Designation Windemere Place, Missoula County, Montana
 September 20, 201 Soils Investigation for Agricultural Designation Windemere Place, Missoula County, Montana The purpose of this report is to compare on-site soils of the proposed subdivision with the
Any County, New York. Custom Soil Resource Report for. Homer Vegetable Research Farm. United States Department of Agriculture
 United States Department of Agriculture Natural Resources Conservation Service A product of the National Cooperative Soil Survey, a joint effort of the United States Department of Agriculture and other
SOIL DATA: Avondale. in Allen, TX. This information was taken from NRCS web soil survey of Collin County, Texas.
 SOIL DATA: Avondale in Allen, TX This information was taken from NRCS web soil survey of Collin County, Texas. United States Department of Agriculture Soil Conservation Service in cooperation with Texas
HCI ENGINEERING. March 27, City of Thornton, Development Engineering 9500 Civic Center Drive Thornton, CO 80229
 HCI ENGINEERING A division of HABERER CARPENTRY INC. March 27, 2014 Attn: Heath Klein, P.E. City of Thornton, Development Engineering 9500 Civic Center Drive Thornton, CO 80229 Re: Drainage Letter for
Yields of Non-Irrigated Crops (Component): Soybeans (Bu) Edgecombe County, North Carolina, and Halifax... (SOYBEANS)
: Soybeans (Bu) Edgecombe County, North Carolina, and Halifax... (SOYBEANS)") 77 37' 52'' W Yields of Non-Irrigated Crops (Component): Soybeans (Bu) Edgecombe County, North Carolina, and Halifax... () 77 36' 28'' W 263300 263600 263900 264200 264500 264800 265100 36 6' 59'' N 36
77 37' 52'' W Yields of Non-Irrigated Crops (Component): Soybeans (Bu) Edgecombe County, North Carolina, and Halifax... () 77 36' 28'' W 263300 263600 263900 264200 264500 264800 265100 36 6' 59'' N 36
Custom Soil Resource Report for Tompkins County, New York
 United States Department of Agriculture Natural Resources Conservation Service A product of the National Cooperative Soil Survey, a joint effort of the United States Department of Agriculture and other
Please use the Assessment and Solution section of your Scantron to answer Questions 1 through 20.
 Please use the Assessment and Solution section of your Scantron to answer Questions 1 through 20. Scenario part 1: You own a small 40 acre farm which you have been growing forage crops on for several years.
Section 1. Judging the soil pit (questions 1-4)
") CONNECTICUT ENVIROTHON 2009 SOILS QUESTIONS Please select the best response to the following questions. There are 25 questions; each question is worth 4 points. Section 1. Judging the soil pit (questions
CONNECTICUT ENVIROTHON 2009 SOILS QUESTIONS Please select the best response to the following questions. There are 25 questions; each question is worth 4 points. Section 1. Judging the soil pit (questions
Appendix Q WETLAND SOILS EXAMINATION
 Appendix Q WETLAND SOILS EXAMINATION TIM MILLER ASSOCIATES, INC. ---------------------------------------------------------------------------------------------------------------------- 10 North Street,
2014 Iowa FFA Soil Judging CDE Exam
 2014 Iowa FFA Soil Judging CDE Exam 1. Landscape position is one aspect of evaluating the surface features of a certain tract of land. Identifying the correct landscape position will indicate: a. If the
This definition is from the Soil Science Glossary (Soil Science Society of America).
.") What is Soil? This definition is from the Soil Science Glossary (Soil Science Society of America). soil - (i) The unconsolidated mineral or organic material on the immediate surface of the earth that serves
What is Soil? This definition is from the Soil Science Glossary (Soil Science Society of America). soil - (i) The unconsolidated mineral or organic material on the immediate surface of the earth that serves
Iowa FFA Soil Career Development Event 2008
 Iowa FFA Soil Career Development Event 2008 1. In Iowa, corn suitability ratings for soil mapping units specifies a. natural weather conditions b. surface and subsurface drainage installed where needed
Custom Soil Resource Report for Angelina County, Texas
 United States Department of Agriculture Natural Resources Conservation Service A product of the National Cooperative Soil Survey, a joint effort of the United States Department of Agriculture and other
SOIL SCIENTIST REPORT FOR THE CONNECTICUT PORTION OF THE CONNECTICUT EXPANSION PROJECT. Prepared for:
 SOIL SCIENTIST REPORT FOR THE CONNECTICUT PORTION OF THE CONNECTICUT EXPANSION PROJECT Prepared for: Tennessee Gas Pipeline Company, L.L.C. 1001 Louisiana Street Houston, Texas 77002 Prepared by: AECOM
SITE ASSESSMENT AND SEPTIC EVALUATION FOR JASON & JANET THATCHER 201 N. SPRAGUE AVED KINGSTON, PA 18704
 DATE: December 13, 2010 N.H. LICENSED DESIGNER OF SUBSURFACE DISPOSAL SYSTEMS 216 Hill Road Phone & Fax: 934-6206 Franklin, NH 03235 Cell: 393-3085 SITE ASSESSMENT AND SEPTIC EVALUATION FOR JASON & JANET
2012 FINAL SOILS AREA 2 Envirothon Questions Answer KEY
 2012 FINAL SOILS AREA 2 Envirothon Questions Answer KEY Questions 1-6 to be answered at the soil pit: 1. Soil scientists categorize soils by drainage classes. What is the drainage class of the soil at
RaC. RaD GlG. GlF. RaD GlE. CeA. RaE. RcD. GoF. GoF SkC. SkD. CfA. AdA. GoF. GoF. GoF. RcD. GgD. GoF. RaE GlE. RaE DbF. GoF. DbE. RaC.
 526300 527400 528500 529600 530700 531800 532900 534000 535100 4240200 4241300 4242400 4243500 4244600 4245700 ADRIAN DR FAIRWAY DR STATE FARM DR DOLORES DR HUDIS ST SANTA ALICIA DR Cotati PAGE ST ALTA
Land Capability Classifications
 Land Capability Classifications Unit: Soil Science Problem Area: Basic Principles of Soil Science Student Learning Objectives. Instruction in this lesson should result in students achieving the following
2016 Iowa FFA Soils Evaluation CDE Exam
 2016 Iowa FFA Soils Evaluation CDE Exam 1. Which of the following is true regarding soil horizons? a. A horizon is darker in color and has more organic matter b. B horizon is darker in color and has more
2017 Iowa FFA Soil Judging CDE Exam
 2017 Iowa FFA Soil Judging CDE Exam 1. Landscape positions vary in soil composition and makeup. What landscape position would be characterized by having strata and lenses of different textures in the profile:
United States Standards for Grades of Beets
 Marketing and Regulatory Programs Agricultural Marketing Service Specialty Crops Program United States Standards for Grades of Beets Effective September 6, 2016 Specialty Crops Inspection Division This
Soil Survey of Nelson County, Virginia
 United States Department of Agriculture Natural Resources Conservation Service In cooperation with United States Department of Agriculture, Forest Service, and Virginia Polytechnic Institute and State
Pits 1 & 3 Questions. 7. Subsurface: Texture (5 pts) A. Coarse B. Moderately course C. Medium D. Fine E. Very Fine
 A. Coarse B. Moderately course C. Medium D. Fine E. Very Fine") Minnesota Soils Scorecard Questions for Pits 1-4 Scantron # 105481 Use your soils scorecard to fill out the answers on your scantron Bubble in the front side of the sheet for Pit 1 (# 1-45) and Pit 2 (#51-95)
Minnesota Soils Scorecard Questions for Pits 1-4 Scantron # 105481 Use your soils scorecard to fill out the answers on your scantron Bubble in the front side of the sheet for Pit 1 (# 1-45) and Pit 2 (#51-95)
2 Older farm homes on the land
 2 Older farm homes on the land LAND RANCHES EXCHANGES This ranch consists of 70 +/_ acres of level farmland. Prime 13700 POWERHOUSE RD POTTER VALLEY agricultural land at an attractive price. This property
Alternative Crop Suitability Methodology
 Alternative Crop Suitability Methodology The Alternative Agriculture in Missouri Hub on Community Commons includes model-based ratings of natural suitability for selected alternative crops. These ratings
IOWA FFA STATE SOILS CDE SATURDAY, OCTOBER 13, 2007 AMES, IOWA
 IOWA FFA STATE SOILS CDE SATURDAY, OCTOBER 13, 2007 AMES, IOWA 1. Moderately sloping has what percent slope: a. 9-14% b. 2-5% c. 5-9% d. over 14% 2. Which of the following horizons is the loose underlying
1. Position (2 pts.) 2. Parent Material (2 pts.) 3. Slope Characteristics (2 pts.) 4. Surface Stoniness or Rockiness (2 pts.)
 2. Parent Material (2 pts.) 3. Slope Characteristics (2 pts.) 4. Surface Stoniness or Rockiness (2 pts.)") Maryland Envirothon SOILS Exam Guidance Information (revised 2017) Objective: To test students' knowledge and awareness of basic soil science and its application in wise land-use planning and therefore
Maryland Envirothon SOILS Exam Guidance Information (revised 2017) Objective: To test students' knowledge and awareness of basic soil science and its application in wise land-use planning and therefore
Soil Maps for Production Agriculture. Jarrod O. Miller, Extension Agronomist
 Soil Maps for Production Agriculture Jarrod O. Miller, Extension Agronomist Origination of Soil Mapping Originally mapped by Division of Soils Federal Bureau of Soils Soil Conservation Service (SCS) started
Unit II Soil Management
 Unit II Soil Management Lesson 2: Using Soil Survey Manuals Soil survey manuals provide useful information for grassland management. Soil scientists evaluate the soil for chemical and physical properties,
Horner-McLaughlin Woods: Soil Types
 Horner-McLaughlin Woods: Soil Types Not present at HMW Adrian Muck Conover Loam 0-4% Slopes Houghton Muck Miami Loam 2-6% Slopes Miami Loam 6-12% Slopes Miami Loam 12-18% Slopes t 0 0.125 0.25 Miles Mary
2018 Iowa FFA Soil Judging CDE Exam 1. Landscape positions characterizes the location of the soil on the landscape and identifies potential risks.
 2018 Iowa FFA Soil Judging CDE Exam 1. Landscape positions characterizes the location of the soil on the landscape and identifies potential risks. Which landscape position is considered the floodplain
Area 3 Envirothon Soils Questions Key
 Area 3 Envirothon Soils Questions Key 1. Soil aeration is the exchange of air in soil with air from the atmosphere. When a soil is well aerated, the air within the soil is very similar to the atmosphere
SOILS IN URBAN / SUBURBAN LANDSCAPES. Lisa Krall Soil Scientist CT USDA NRCS Tolland, CT
 SOILS IN URBAN / SUBURBAN LANDSCAPES Lisa Krall Soil Scientist CT USDA NRCS Tolland, CT What is Urban Soil? Is This Soil? Is This Soil? active gravel pit pavement and buildings vegetated roadside areas
Finger Lakes National Forest. Backbone Horse Camp Water Hydrant Project
 United States Department of Agriculture Forest Service February 2014 Backbone Horse Camp Water Hydrant Project Scoping Information Hector Ranger District Town of Lodi, Seneca County, New York For Information
NONMETALLIC MINING SITE RECLAMATION PLAN. Gerke Excavating Town of Wilton Monroe County, Wisconsin May, 2012
 General Engineering Company P.O. Box 340 916 Silver Lake Drive Portage, WI 53901 608-742-2169 (Office) 608-742-2592 (Fax) gec@generalengineering.net www.generalengineering.net NONMETALLIC MINING SITE RECLAMATION
ASCE - Philadelphia. Soils & Stormwater Management. Matthew C. Hostrander, CPSS, SEO Soil Scientist. Gilmore & Associates, Inc.
 ASCE - Philadelphia Soils & Stormwater Management Matthew C. Hostrander, CPSS, SEO Soil Scientist Gilmore & Associates, Inc. Course Overview COURSE OUTLINE Soil Science Fundamentals Discuss United States
Soil Interpretations Erosion and Sedimentation Control Planning and Design Workshop
 Soil Interpretations Erosion and Sedimentation Control Planning and Design Workshop Presented by Richard Brooks Presentation prepared by Kristin May Resource Soil Scientists USDA-Natural Resources Conservation
Using Land Capability Classifications
 Lesson C7 2 Using Land Capability Classifications Unit C. Plant and Soil Science Problem Area 7. Soil Erosion and Land Management Lesson 2. Using Land Capability Classifications New Mexico Content Standard:
2016 Area 3 Envirothon Muskingum County Soils Test ANSWER KEY
 2016 Area 3 Envirothon Muskingum County Soils Test ANSWER KEY 1. The majority of the bedrock in Muskingum County is. a. sedimentary bedrock b. glacial bedrock c. igneous bedrock d. metamorphic bedrock
Topoclimate Southland Soil Technical Data Sheet No Waiau
 This Technical Data Sheet describes the typical average properties of the specified soil. It is essentially a summary of information obtained from one or more profiles of this soil that were examined and
2011 Wisconsin Envirothon Soils and Land Use Exam
 2011 Wisconsin Envirothon Soils and Land Use Exam USE THE OCONTO COUNTY SOIL SURVEY TO ANSWER QUESTIONS 1-4 The Pensaukee River Wetland Complex is a mixture of state (Pensaukee Wildlife Area) and privately
Soil characteristics that influence nitrogen and water management
 Section C Soil characteristics that influence nitrogen and water management Soil characteristics vary across the landscape Soils vary from one field to another, and often within the same field. Soil differences
Sacramento River Farmland Anderson, California
 AG-LAND INVESTMENT BROKERS 275 Sale Lane / P. O. Box 896 Red Bluff, CA 96080 530.529.4400 office / 530.527.5042 fax Sacramento River Farmland Anderson, California Property: 43 +/- acres of farmland with