SOIL ACIDITY, ALKALINITY, AND SALINITY
|
|
|
- Augustine Garrett
- 5 years ago
- Views:
Transcription
1 SOIL ACIDITY, ALKALINITY, AND SALINITY
2 Introduction: Soil ph o Degree of soil acidity or alkalinity in soil Cl Expressed as ph o Soil ph considered a master variable affecting wide range of soil properties Cl Chemical Cl Biological Cl Physical
3 Introduction: Soil ph o Plant species in natural landscape reflect ph o Soil ph affects mobility of pollutants in soil EJ Influences rate of biochemical breakdown El Influences solubility EJ Influences adsorption potential to colloids o Soil ph critical factor in predicting likelihood of pollutants to contaminant groundwater, surface water, etc


4 ph values for familiar substances compared to ranges of ph typical for various types of soils Bleaeh Milkof magnesia Antacid tablets Seawater Baking soda Pure.wacer Milk Natural: rain Beer Coffl!{! r 10 ph'sca e 12 It 9 s 6 4. Ranges found in.soils Sodic.soils Calcareous. soils Nc:urral Humid region arable soil for S;I soils ci.e <C c <( Milk of Magnesia 10; ' 4 3 Tomato Juice 4.2 lne r:. pple L'emon Juice 2.0 Vinegar Battery acid 3 l Acid sulf;ne -soils T
5 Introduction: Soil ph o CJ CJ 2 most important factors influencing soil ph Balance between acid and nonacid cations on colloid surfaces Balance between H + and OH- ions in soil solution o These balances are controlled by the nature of the soil colloids
6 Introduction: Soil ph o Acidification is a natural process in soil formation CJ reatest expression of acidity in humid regions Sufficient rainfall to thoroughly leach soil profile CJ Least expression of acidity in drier regions Scant rainfall means less leaching of soil profile Soils retain sufficient Ca 2+, Mg 2+, K +, and Na + to prevent buildup of acid cations (Al 3 + and H + )
7 Introduction: Alkalinity, Salinity and Sodicity o Dry regions of the earth may accumulate detrimental levels of: Cl Soluble salts (saline soils) Cl Exchangeable sodium ions (sodic soils) o Due to insufficient leaching, dry areas of the world tend to have ph's above 7 (alkaline soils) o Alkalinity, salinity, and sodicity affect physical condition and fertility of arid and semiarid area soils
8 Understanding ph o Acidity and alkalinity measured with ph scale IJ Expresses activity or concentration of H + ions in solution IJ Pure water has equal concentrations of H + and OH- ions H 2 0 <=> H + + OH- IJ Ion product of concentrations of H + and OH- ions is a constant ( ) = 1 X 1 Q-l 4 [H + ] x [QH-J = = 1 Q- 14
9 Understanding ph o Since in pure water the concentration of H + [H + ] ions must be equal to the concentration of OH [OH-] ions then concentration of each must be 1 o- 7 1 Q-7 X 1 Q-7 = 1 Q- 14
10 Understanding ph o Inverse relationship exists between concentrations of these two ions El As one increases the other must decrease proportionately El If H + ion concentration [H + ] was increased 1 0 times (from 1 o- 7 to 1 o- 6 ) then [OH-] would be decreased by 1 Q times (from 1 Q-l to 1 Q- 8 ) since product must equal, o-14 1 o- 6 x 1 o-s = 1 o- 14
11 Understanding ph o Can express the small concentrations of H + and OHions by using the negative logarithm of the H + ion concentration or the ph o 1 o- 7 can be expressed more easily logarithmically as-7 IJ -log ( 1 o- 7 ) = -(-7) = 7
12 . Understanding ph o Increasing quantity of H + in solution decreases ph value IJ [OH] decreases as [H] increases IJ Each integer change represents a 1 0 fold change in concentration A solution at ph 5 is 1 0 times more acidic than one at ph 6; 1 00 times more acidic than one at ph 7
13 Sources of Hydrogen Ions o Carbonic and other organic acids Cl Carbon dioxide gas from soil air and water form carbonic acid H + dissociates in this reaction Cl Other organic acids formed as microbes break down organic matter o Accumulation of organic matter Cl OM forms complexes with nonacid cations allowing them to be leached Cl OM itself a source of H + ions
14 Sources of Hydrogen Ions o Oxidation of Nitrogen (Nitrification) Cl NH 4 + (ammonium) ions from OM or fertilizer react with oxygen Oxidizes the ammonium ion and releases 2 H + ions o Oxidation of Sulfur Cl Decomposition of plant residues or presence of sulfur in rocks results in oxidation reactions forming sulfuric acid (H 2 S0 4 ) Dissociates to release H + ions
15 Sources of Hydrogen Ions o Acids in precipitation CJ Rain, snow, fog and dust contain various acids Precipitation forms carbonic, sulfuric or nitric acids depending on what is in the air it is falling through o Plant uptake of cations CJ Plants must maintain charge balance on ions they uptake CJ If they take up more cations than anions often release H + back into soil solution to maintain balance
16 Main processes that produce or consume Hydrogen ions (H + ) Production of H + ions increases soil acidity,,vhile consurnption of H + ions delays acidification and leads to alkalinity. The ph level of a soil reflects the long-term balance betlveen these nvo types of processes. Acidifying (H ion-producing) processes Fonnation of carbonic acid fro1n CO 2 Acid dissociation such as: RCOOH-'? Rcoo- + H + Oxidation of N, S, and Fe compounds Atmospheric H and HN0 3 deposition Cation uptake by plants Accun1ulation of acidic organic n1atter (e.g. fulvic acids) Cation precipitation such as: Af H 2 0""' 3H + Al(OH) 3 Si Al(OH) 3 + Ca 2+ CaA}zSi H ZH + Deprato nation of ph-dependent charges A.lkalinizing (H i ion-consunzing) processes Input of bicarbonates or carbonates Anion protonation such as: Rcoo + H + RCOOH Reduction of N, S, and Fe compounds Atmospheric Ca, Mg deposition Anion uptake by plants Specific (inner sphere) adsorp t ion of anions ( especially SO/-) Cation,,veathering fron1 rninerals such as: 3H J. + Al(OHh O Al H 2 0 CaAl 2 Si H H + Si Al(OHh + Ca 2+ Protonation of ph-dependent charges
 Addition of H + ions from acid-forming processes /Anions of acid ' (NO 3, SO 4, 2 HC0 3, etc.) / \ \,.")
17 Process by which soils may become acidic (2) Exchange of 2 H + ions for a Ca 2 + ion - (tr) :-..,,..-,-- -,/' (1) Addition of H + ions from acid-forming processes /Anions of acid ' (NO 3, SO 4, 2 HC0 3, etc.) / \ \,. Exchangeable cations (3) Leaching loss of Ca, Mg, K and Na ions along with anions
18 Alkalinity, Salinity, Sodicity o Alkaline soils are those with a ph above 7.0 o Alkalinity refers to concentration of OH- ions generated from reaction of carbonates and water o Alkali soil is an obsolete term for sodic or salinesodic soils IJ Soils with high levels of exchangeable sodium
19 Causes of Alkalinity o High soil ph is the main cause of alkalinity Occurs when cations released by mineral weathering accumulate faster then they can be leached Common where precipitation is less than evaporation o Salts accumulate naturally in soils of arid/semi-arid regions due to insufficient rainfall to flush (leach) them from upper layers
20 Sources of Alkalinity o Cations in soil solution and on exchange complex are mainly Ca 2 +, Mg 2+, K +, Na + CJ These cations do not produce H + (acid) when reacting with water CJ Usually don't produce OH- ions either CJ Effect in water is neutral Soils containing these cations have ph's no higher than 7 UNLESS certain anions present
21 Sources of Alkalinity o Presence of hydroxyl generating (OH-) anions will raise ph in soils IJ Anions are carbonate (( ) and bicarbonate (HC0 3 -) IJ Anions react with water and dissociate producing OH- IJ Anions form from dissolution of calcite (mineral) or carbonic acid
22 Influence of carbon dioxide and carbonates on ph o Biological activity increases CO 2 in soil and limits/lowers ph o Precipitation of CaC0 3 when soil solution is saturated with Ca 2 + is due to the limited solubility of Ca 2 + Cl Limits ph to 8.4 o Sodium carbonate and sodium bicarbonate much more soluble than calcium carbonate Cl Produces high concentrations of C ions IJ Allows for ph's as high as 11
23 Role of Aluminum in Soil Acidity o Aluminum is a maior constituent of most soil minerals Cl When H + ions adsorbed they will attack mineral structure releasing Al 3 + ions from structure EJ Al 3 + ions become adsorbed to colloid cation exchange sites while maintaining equilibrium with dissolved Al 3 + ions in soil solution
24 Role of Aluminum in Soil Acidity o The exchangeable and dissolved Al 3 + ions are critical to soil acidity CJ Aluminum is highly toxic to most organisms and plants Responsible for most acidity impacts on organisms CJ Al 3 + ions have strong tendency to hydrolyze That is they split water molecules into H + and OH- Aluminum combines with OH- leaving H + free to lower ph One Al 3 + ion can release up to 3 H + ions Al 3 + and H + ions are called the acid cations
25 Role of Aluminum in Soil Acidity CJ Hydroxy aluminum ions formed earlier are strongly adsorbed to clay surfaces or complexed with OM thus masking much of the colloids CEC potential As ph is raised. these ions precipitate into solution as uncharged ions opening up negative exchange sites on colloid for cation exchange
26 Buffering of ph in Soils o Buffering: The tendency of soils resist change in ph of the soil solution ll Soils are most highly buffered when aluminum compounds (low ph) and carbonates (high ph) are controlling the buffer reactions ll Soils are least well buffered at mid ph levels when H + ion dissociation and cation exchange are primary buffer mechanisms


27 Buffering of soils against changes in ph Low ph: buffering by hydrolysis and precipitation of aluminum compounds. :c High ph: buffering by a. precipitation and 5 v, dissolution of calcium carbonate. Mid ph: buffering by cation exchange and gain or loss of H + ions 6 =- 5 4 Buffered b ' x /, :-A B ,--=:L..---,.,,,,,,,,... Ruff ered by cation exchange and ph.. dependent charge sites Jt.. ",icj -- 3 alurninun1 con1pounds Buffered by carbonates -.. -,,., ,.,.. _ ) J Acid added cn1olc/kg Base added X f 20
28 Buffering of ph in Soils o Applying a base {lime/ ground limestone) increases ph by neutralizing H + ions {active acidity) o Neutralized H + ions are replaced by ions from residual and exchangeable acidity reservoirs Cl Hard to change ph because these reservoirs are so large
29 Buffering of ph in Soils o The higher the cation exchange capacity of a soil, the greater its buffering capacity o The higher the clay and organic matter contents the more lime is needed to raise ph o Soil buffering is important because it prevents fluctuations in ph that could harm plants and m1croorgan1sms
30 Human-Influenced Soil Acidification o Human activities can accelerate natural processes of soil acidification o Three maior types of human-influenced soil acidification 7) Nitrogen fertilization 2) Acid deposition from the atmosphere 3) Exposure of acid sulfate materials
31 Nitrogen Fertilization o Excessive use of ammonium-based fertilizers Cl Microbes oxidize to acids, plants uptake what they need, remainder available to increase acidity o Application of acid forming organic material IJ Mainly sewage sludges and animal manures Oxidation of nitrogen or formation of acids during their decomposition can decrease ph
32 Acid Deposition from Atmosphere o Industrial activity emits Nitrogen and Sulfur containing gases into atmosphere o Reaction with water etc., produces sulfuric and nitric acid CJ Returned to earth as acid rain (snow, fog dust) CJ Maior effects on fish and forests Effect is a result of interaction between acid rain and soils in the affected watersheds
33 Acid Deposition from Atmosphere o Incoming acids mobilize aluminum in the soil minerals o Aluminum displaces Ca 2 + and other nonacid cations from exchange complex IJ Ca 2 + and other ions easily leached ll Al 3 + and H + become dominant on exchange complex, in soil solution, and in drainage waters
34 Acid Deposition from Atmosphere o Main effects of acidification on forest and fish are a result of aluminum toxicity o A ph drop to 6 0 damages reproductive systems of fish, a ph drop to 5.0 will kill fish o Areas with much acid rain, soils with low CEC, and low reserves of weatherable minerals (to re-supply the leached out calcium) are most susceptible


35 Effects of Acid Rain on Watersheds Movement of Pollutants Pa.rtfc late- ollutants in tl!l Ph.ere NO HNO X


36 Effects of Acid Rain on Forests Chilean Forest: The amount of precipitation derived elements leaving is equal to those arriving Aci i pacte forest: E e:y f-f.i- dc-cd lo: he soil b:; :.rc rl rui:": re foe an qui 1a:cn atnount of_.., nuuient... ie:mcnt sue Nutrients disolved in preciptation enter Tree lakes up nutrients from soil, some from rock weathering, some from atmospheric sources Blue=precipitation derived nutrients Rcd=Rock derived nutrients Ti'ee leaves become yehow as nutrients become scarce in the soil tf ions from acid replace the nutrient clements in the soil: for every unit of acid added to the soil, an equivalent amount of nutrient elements arc removed...._,. + = 1ca2 or 21(' 2+# 2+ Nutrients exit to ca1... C:,l. groundwater and streams 2 M 2 More nutrient elements are + leached from the soil than arrive from woathoring or rocks or precipitation; the forest goes into decline
37 Exposure of Acid Sulfate Materials o Coastal wetlands, marshes, or sediments from the ocean are potential acid sulfate forming materials o Sulfur and iron remain in reduced form as long as sediments remain waterlogged IJ Exposure to oxygen by drainage or dredging changes oxygen and sulfur to oxidized forms Soils can now produce sulfuric acid when water is added
38 Biological Effects of Soil ph o Aluminum toxicity Cl Becomes a problem when ph reaches 5.2 and below Cl Affects plants and bacteria Blocks sites of calcium uptake Interferes with phosphorous metabolism Stunts root systems Plants become easily drought stressed


39 Plant Response to Aluminum Toxicity rl. ;:As ph drops below 5.2 exchangeable Al amount._increases and - root length is severely - restricted S.S. I 5.4 is Soil phwa1ter
40 Biological Effects of Soil ph o Manganese toxicity IJ Manganese is an essential plant nutrient but is toxic in excessive quantities IJ Some soils contain high content of manganese containing minerals IJ Toxicity common when ph reaches 5.6 IJ Toxicity increased when manganese is in reduced form Common in flooded, waterlogged conditions


41 Plant Response to Manganese Toxicity Average plant shoot g r wth declines and.. manganese, - ' -. content of. folia ge increases. at low ph lev;els (Soils are :naturally high in manganese) 1000 :100 Tissue Mn Toxic level for b e an and cabbage o, o S 5.0' 5.5 Soil ph1<01 QI: loo ' '.. ;,..._
42 Biological Effects of Soil ph o Nutrient availability to plants Cl In strongly acid soils Ca, Mg, K, P, N, S (macronutrients); Molybdenum and Boron (micronutrients) are curtailed Cl Phosphorous (P) and Boron (B) constrained in alkaline soils P reacts with free Ca (insoluble compounds) and B strongly adsorbed to colloids Cl Most other micronutrients availability, (Fe, Mn, Zn, Cu, Co), are increased by decreasing ph Plant growth may be constrained in slight to moderately alkaline soils due to micronutrient unavailability

43 Relationships between ph and Availability of Plant Nutrients Soil ph S I 4 fungi Bacteria and,actfnomycetes N K Ca.Mg ' p Fe.Mn Mo B Zn
44 Acidity and Plant Growth o Optimum p for plant growth depends on individual species Cl ph must be at least 5.5 to neutralize Al in soil Cl Al precipitates out of solution at ph 5.5 o Generally a ph >6 (most plants) provides: Cl Optimum nutrient availability Cl Optimum herbicide action
45 Raising Soil ph o Soil acidity is decreased ( and ph increased) by adding alkaline materials CJ Alkaline materials include carbonate (C0 3 -), hydroxide (OH-), and silicate (Si ) Called "conjugate bases", anions which are capable of consuming (or reacting with) H + to form weak acids (water is an example) IJ These bases commonly called "agricultural limes"
46 Raising Soil ph o Adding agricultural lime to a soil is called "liming" Cl Purpose of liming is to change the chemical makeup of a substantial part of the root zone Cl Liming material must be added in large quantities Cl Liming material must be relatively inexpensive Cl Most common liming materials are derived from limestone
47 Raising Soil ph o Liming materials raise ph by reacting with carbon dioxide and water to yield bicarbonates Cl Bicarbonates are more soluble than carbonates, Can react with exchangeable and residual acidity pools CJ Ca 2 + and Mg 2+ replace H + and Al 3 + on the colloidal complex, increasing ph of soil solution Cl Soil texture and corresponding buffering capacity important in determining amount of lime needed to change ph


48 Effect of Soil Textural Class on Limestone Required to Raise Soil ph 6.5, :c Cl.ay loan1s CEC = 2 S Silt loam s. CEC = 20 - Learns, CEC = I Sandy loams. CEC = I 0 Sands " CEC = S "wlil ) S 9 0 II I I Ground lhnestone 'to raise p'h to 6,.. 5 (Mg/ha)
49 Raising Soil ph vs. Neutralizing Acidity o Liming (with CaC0 3 or MgC0 3 ) works well for surface soil acidity Cl Neutralizes acidity directly o For subsoils with high clay AND high acidity gypsum (CaSO 4 2H 20) is effective Cl Main problem is excessive Al causing high acidity Cl Ca 2+ replaces exchangeable Al 3 on the exchange site (leaching) lowering acidity Cl Does not raise or lower soil ph significantly IJ S anion available to accompany Ca 2 + in leaching of Al 3 +
50 Soil Reactions for CaC03 and Gypsum LIMING REACTION (with CaC0 3 ) GYPSUM REACTION > Ca I CLAY I + 2W + so r
51 Lowering soil ph o Sometimes need to lower ph of alkaline (or even acid) soil IJ Usually to promote growth of certain plant species IJ Lower ph by adding acid-forming organic and inorganic materials Acid organic matter Inorganic chemicals
52 Lowering soil ph o Acid organic matter Cl Material should be low in calcium Pine needles/sawdust, acid peat moss, leaf mold o Inorganic chemicals Cl Ferrous sulfate Provides available iron to plants and lowers ph Cl Aluminum sulfate (alum) Cl Elemental sulfur
53 Changing ph in Soil Soil ph directly affects the life and growth of plants because it affects the availability of all plant nutrients. Between ph 6.0 and 6.5, most plant nutrients are in their most available state. A nutrient must be soluble and remain soluble long enough to successfully travel through the soil solution into the roots. Nitrogen, for example, has its greatest solubility between soil ph 4 and soil ph 8. Above or below that range, its solubility is seriously restricted. Soil acidity or alkalinity (ph) is extremely important because it has an effect on the decomposition of mineral rock into essential elements that plants can use. It also changes fertilizers from their form in the bag to a form that plants can easily uptake. Soil microorganisms that change organic nitrogen (amino acids) to the ammonium form of nitrogen to the nitrate form that plant can use also depends on the soil ph. Soil ph should be checked periodically and consistent testing will indicate whether your ph-control program is working. Raising ph The ideal ph range for soil is from 6.0 to 6.5 because most plant nutrients are in their most available state. If a soil test indicates a ph below 6.5, the usual recommendation is for the application of ground limestone. In addition to having the ability to raise ph, limestone contains calcium. Some prefer dolomitic limestone because it contains both calcium and magnesium, however soils high in magnesium (serpentine) do not need more magnesium. Table 1 indicates the number of tons per acre of ground limestone required to raise the ph of a given soil to based on the original ph, desired ph, and soil type. In order to select the correct application rate use a soil test to determine both the soil texture group and the current ph. As the percentage of clay in a soil increases, it requires proportionately more limestone to raise the ph. This means it is much harder to change the ph of clay soil than sandy soil. Consider that limestone moves very slowly, taking years to move down a few inches in the soil. This is why it is so important to test soil early in the planning process. Limestone should be tilled into the soil root zone (top 7 inches). Table 1. Approximate Amount of Finely Ground Limestone Needed to Raise the ph of a 7-inch Layer of Soil Lime Requirements (Tons per Acre) Soil Texture From ph 4.5 to 5.5 From ph 5.5 to 6.5 Sand and loamy sand Sandy loam Loam Silt loam Clay loam Muck Table 2. Common Liming Materials Name Chemical Formula Equivalent % CaCO 3 Source Shell meal CaCo 3 95 Natural shell deposits Limestone CaCO Pure form, finely ground Hydrated lime Ca(OH) Steam burned Burned lime CaO Kiln burned Dolomite CaCO 3 M g CO Natural deposit Sugar beet lime CaCO Sugar beet by-product lime Calcium silicate CaSiO Slag 1
54 Lowering ph Some soils are alkaline and have a ph above 6.5. Some fertilizers (ammonium sulfate, urea, and ammonium nitrate) create an acid reaction in the soil, so they aid in lowering or maintaining a specific ph. Certain acidifying organic materials such as pine needles or peat moss can lower soil ph gradually over many years. In nature this takes thousands of years. For more rapid results in lowering ph, sulfur is used. Sulfuric acid forms when sulfur is added to the soil, the smaller the particles of sulfur, the faster the reaction. Lowering the ph is a slow process and will take 1-2 years to see a reaction. Table 3. Tons of sulfur needed per acre to lower ph to 6.5 Original ph Sandy Soil Clay Soil Table 4. Commonly Used Materials and Their Equivalent Amendment Values Tons of Amendment Equivalent to Material (100% Basis)* Chemical Formula 1 Ton of Pure Gypsum 1 Ton of Soil Sulfur Gypsum CaSO 4 ٠ 2H 2 O Soil sulfur S Sulfuric acid (conc.) H 2 SO Ferric sulfate Fe 2 (SO 4 ) 3 ٠ 9H 2 O Lime sulfur (22% S) CaS Calcium chloride CaC1 2 ٠ H 2 O Aluminum sulfate A1 2 (SO 4 ) * The percent purity is given on the bag or identification tag Common Amendment Reactions in Soil Gypsum (calcium sulfate) + sodic soil calcium soil + sodium sulfate (leachable with water) Sodium sulfate is then leached out of the soil by rainfall or heavy irrigations. The removal of sodium lowers the sodium permeability hazard allowing for soil aggregation and improved drainage. Gypsum does not change ph nor improve drainage in non-sodic situations. Gypsum is used to add calcium to soils such as serpentine with very high or toxic Mg levels. Sulfur (elemental) + oxygen + water sulfuric acid + soil calcium gypsum Gypsum then acts as above. Sulfur and sulfuric acid also lower ph Lime (calcium or magnesium carbonate) + water calcium soil + OH Lime neutralizes the (acidity) - H + ion concentration and adds calcium to soil Paul Vossen University of California Cooperative Extension 2604 Ventura Ave. Santa Rosa, CA (707)
55 Soil ph is a measure of soil acidity or alkalinity. It is an important indicator of soil health. It affects crop yields, crop suitability, plant nutrient availability, and soil micro-organism activity, influencing key soil processes. Soil ph can be managed by practices such as applying the proper amount of nitrogen fertilizer, liming, and using cropping systems that increase soil organic matter content and improve overall soil health. Inherent factors that affect soil ph include climate, mineral content, and soil texture. Natural soil ph reflects the combined effects of the soil-forming factors (parent material, time, relief or topography, climate, and organisms). The ph of newly formed soils is determined by the minerals in the parent material. Temperature and rainfall affect the intensity of leaching and the weathering of soil minerals. In warm, humid environments, soil ph decreases over time through acidification due to leaching from high amounts of rainfall. In dry environments where weathering and leaching Soil ph is affected by land use and management. The type of vegetation on a soil impacts ph levels. For example, areas of forestland tend to be more acidic than areas of grassland. Conversion of land from forestland or grassland to cropland can result in drastic changes in ph over time. These changes are a result of loss of organic matter, removal of soil minerals when crops are harvested, and erosion of the surface layer. Also, application of nitrogen and sulfur fertilizers can lower soil ph over time. Measures that minimize or reduce acidification: Liming to raise the ph of an acid soil. Applying nitrogen and sulfur according to the needs of the crop grown. Inherent Factors Affecting Soil ph Soil ph Management are less intense, soil ph may be neutral or alkaline. Soils that have a high content of clay and organic matter are more resistant to changes in ph (higher buffering capacity) than are sandy soils. Although clay content cannot be altered, organic matter content can be altered by management practices. Sandy soils commonly have a low content of organic matter, resulting in a low buffering capacity and a high rate of water percolation and infiltration. Thus, they are susceptible to acidification. Applying nitrogen fertilizer in appropriate amounts and in a timely manner (relative to crop uptake) and using proper irrigation management to minimize leaching of nitrate nitrogen. Diversifying crop rotations to minimize acidifying effects of applied nitrogen fertilizer. Applying irrigation water and manure and other organic material that have a high content of calcium or magnesium bicarbonates. Using continuous no-till cropping systems, using cover crops, applying solid manure, and using diverse rotations that include highresidue crops, which increase organic matter content and improve soil buffering capacity, minimizing changes in ph. Page 1 Guides for Educators (May 2014)
56 Soil Health Soil ph USDA-NRCS Table 1. Crop Yields Relative to ph. Soil ph Crop Relative yield (100 is best; 0 is worst) Corn Wheat Soybeans Oats Barley Alfalfa Timothy (grass) Methods for Assessing Soil Quality, page 173 (SSSA, 1996). Problems Related to ph and Relationship of ph to Soil Function Soil ph is an excellent indicator of the suitability of a soil for plant growth. For most crops, ph of 6 to 7.5 is optimal (table 1). Soil ph levels that are too high or too low (fig. 1) lead to a deficiency of many nutrients, decline in microbial activity, decrease in crop yields, and deterioration of soil health. For example, soil ph values below 5.5 and between 7.5 and 8.5 limit the availability of phosphate for plants (figures 2 and 3). Four major management practices that increase the availability of phosphate for plants are: 1. Liming acid soils to increase ph to between 6.5 and Applying small amounts of phosphorus fertilizer frequently rather than a large amount at one time. 3. Banding or injecting the source of the phosphorus (manure and/or fertilizer) into the soil to reduce the contact between the soil and the phosphorus. 4. Applying phosphorus fertilizer near crop rows, where roots are most active. Nitrogen cycling is inhibited by low ph. The effectiveness and degradation of herbicides and insecticides and the solubility of heavy metals are dependent on the soil ph. Some diseases thrive in alkaline or acidic soils. The effectiveness and potential carryover of certain herbicides is also impacted by soil ph. Page 2 Guides for Educators (May 2014)
. Figure 1.")
. What current practices affect soil ph?")
57 Soil Health Soil ph USDA-NRCS Figure 2. Availability of phosphorus relative to ph (California Fertilizer Association, 1995). Figure 1. Relationship between the availability of plant nutrients and soil ph (National Soil Survey Manual, USDA, NRCS). Figure 3. Corn that is deficient in phosphorus (R.L. Croissant, Bugwood.org). What current practices affect soil ph? What impact are these practices expected to have on soil ph and why? Page 3 Guides for Educators (May 2014)
 measuring scoop Calibrated 120-mL vial with lid for shaking Squirt bottle Distilled water or rainwater Pen, field notebook, permanent marker, and resealable plastic bags Considerations:")

58 Soil Health Soil ph USDA-NRCS Materials needed to measure ph: Probe and plastic container for gathering and mixing soil samples Roll of ph test strips 1/8-cup (29.5 ml) measuring scoop Calibrated 120-mL vial with lid for shaking Squirt bottle Distilled water or rainwater Pen, field notebook, permanent marker, and resealable plastic bags Considerations: Electrical conductivity should always be measured on a sample before measuring ph. Soil ph levels can be measured using the steps in the following paragraphs. Quick in-field hand test: 1. Soil ph levels vary depending on the location of the field and the time of year. They are affected by the placement of fertilizer (in rows or between rows), soil texture, organic matter content, and application of manure or other fertilizer. Using a soil probe, gather at least 10 small samples to a depth of 8 inches or less randomly from an area that represents a particular soil type and management history. Place samples in the plastic container. Do not include large stones and plant residue. Repeat this step for each sampling area. 2. Neutralize hands by rubbing moist soil across palms. Discard soil. Measuring Soil ph 3. Place a scoop of the mixed soil in palm, and saturate with clean water (distilled water or rainwater). 4. Squeeze hand gently until a soil and water slurry forms. 5. Touch tip of piece of ph test strip 1 inch long to the soil and water slurry. Leave until the liquid is drawn up at least 1/4 to 1/2 inch beyond the area covered by the soil (fig. 4). 6. Compare the color approximately one-third up the strip to the color chart on the test strip dispenser (fig. 5). Record soil ph and interpretations (table 2). Figure 4. Quick hand test. Compare color 1/3 of the way up. Figure 5. Soil ph color chart. Page 4 Guides for Educators (May 2014)
 with the mixed soil, tamping down during filling by carefully striking scoop on a hard, level surface. Place soil in vial. Add one scoopful (29.")
59 1:1 soil to water ph test in classroom: Soil Health Soil ph 1. Soil sampling should be completed as instructed in step 1 under Quick in-field hand test. 2. Fill scoop (29.5 ml) with the mixed soil, tamping down during filling by carefully striking scoop on a hard, level surface. Place soil in vial. Add one scoopful (29.5 ml) of water to the vial, resulting in a 1:1 ratio of soil to water, on a volume basis. 3. Tightly cap the vial and shake 25 times. Let settle for 1 minute. Remove lid, and carefully decant 1/16 inch of soil and water slurry into lid. Allow to settle for 2 to 3 minutes. 4. Immerse tip of piece of ph test strip 1 inch long into soil and water slurry. Leave until USDA-NRCS liquid is drawn up at least 1/4 to 1/2 inch beyond area covered by soil (fig. 6). 5. Compare the color approximately one-third up the strip to the color chart on the test strip dispenser (fig. 5). Record soil ph and interpretations (table 2). Figure 6. 1:1 soil to water test. Record soil ph, and complete table 2 by comparing measured soil ph to that given in figure 1, figure 2, and table 1. Answer discussion questions. In general, ph values between 6 and 7.5 are optimum for crop and forage production and Interpretations Table 2. Soil ph and Interpretations nutrient uptake. Soil ph impacts nutrient availability and overall soil health. Soil acidification can be an indication of excessive application of nitrogen fertilizer. Site Soil ph Soil ph category (from figure 1) Nutrients impacted by soil ph (from figures 1 and 2) Crops impacted by soil ph level (from table 1) Notes Ex Medium acid Phosphorus, potassium, calcium, molybdenum All but oats Spring test on corn stubble Page 5 Guides for Educators (May 2014)
60 Soil Health Soil ph USDA-NRCS Compare test results recorded in table 2 to values in figure 1, figure 2, and table 1. Are soil ph levels ideal for crops or forage grown? Why or why not? Based on results of soil ph test, is liming or other measures to adjust ph recommended? Why or why not? Acidity. Soil ph lower than 7. Alkalinity. Soil ph higher than 7. Anion. Negatively charged ion. Buffering capacity. Ability of soils to resist changes in ph levels. Soils that have a high content of clay and organic matter have a higher buffering capacity. Cation. Positively charged ion. Glossary Nitrification. Oxidation of ammonium-nitrogen compounds in organic material or fertilizer into nitrites and nitrates by soil bacteria, making nitrogen available to plants. Phosphorus fixation. Tying up of phosphorus by calcium, iron, or aluminum compounds, making it unavailable for plant use. Fixation is impacted by soil ph. Soil ph. Measure of soil acidity or alkalinity. USDA is an equal opportunity provider and employer. Page 6 Guides for Educators (May 2014)

61 Soil Quality Information Sheet Soil Quality Indicators: ph USDA Natural Resources Conservation Service January 1998 What is ph? Soil ph is a measure of the acidity or alkalinity in the soil. It is also called soil reaction. The most common classes of soil ph are: Extremely acid Very strongly acid Strongly acid Moderately acid Slightly acid Neutral Slightly alkaline Moderately alkaline Strongly alkaline in this range. However, some plants have soil ph requirements above or below this range. Soils that have a ph below 5.5 generally have a low availability of calcium, magnesium, and phosphorus. At these low ph s, the solubility of aluminum, iron, and boron is high; and low for molybdenum. At ph 7.8 or more, calcium and magnesium are abundant. Molybdenum is also available if it is present in the soil minerals. High ph soils may have an inadequate availability of iron, manganese, copper, zinc, and especially of phosphorus and boron. Micro-organisms Soil ph affects many micro-organisms. The type and population densities change with ph. A ph of 6.6 to 7.3 is favorable for microbial activities that contribute to the availability of nitrogen, sulfur, and phosphorus in soils. Pesticide Interaction Most pesticides are labeled for specific soil conditions. If soils have a ph outside the allowed range, the pesticides may become ineffective, changed to an undesirable form, or may not degrade as expected, which results in problems for the next crop period. Mobility of heavy metals Many heavy metals become more water soluble under acid conditions and can move downward with water through the soil, and in some cases move to aquifers, surface streams, or lakes. What is the significance of ph? Availability of Nutrients Soil ph influences the solubility of nutrients. It also affects the activity of micro-organisms responsible for breaking down organic matter and most chemical transformations in the soil. Soil ph thus affects the availability of several plant nutrients. A ph range of 6 to 7 is generally most favorable for plant growth because most plant nutrients are readily available Corrosivity Soil ph is one of several properties used as a general indicator of soil corrosivity. Generally, soils that are either highly alkaline or highly acid are likely to be corrosive to steel. Soils that have ph of 5.5 or lower are likely to be highly corrosive to concrete. What controls soil ph? The acidity or alkalinity in soils have several different sources. In natural systems, the ph is affected by the mineralogy, climate, and weathering. Management of soils

62 often alters the natural ph because of acid-forming nitrogen fertilizers, or removal of bases (potassium, calcium, and magnesium). Soils that have sulfur-forming minerals can produce very acid soil conditions when they are exposed to air. These conditions often occur in tidal flats or near recent mining activity where the soil is drained. The ph of a soil should always be tested before making management decisions that depend on the soil ph. How is ph measured? A variety of kits and devices are available to determine the ph in the field. The methods include: dyes paper strips glass electrodes. Soil ph can change during the year. It depends on temperature and moisture conditions, and can vary to as much as a whole ph unit during the growing season. Since ph is a measure of the hydrogen ion activity [H + ], many different chemical reactions can affect it. Temperature changes the chemical activity, so most measurements of ph include a temperature correction to a standard temperature of 25 degrees C (77 o F). The soil ph generally is recorded as a range in values for the soil depth selected. How is soil ph modified? A soil ph below about 5.6 is considered low for most crops. Generally, the ideal ph range is between 6.0 and 7.0. Liming is a common method to increase the ph. It involves adding finely ground limestone to the soil. The reaction rate for limestone increases when soil temperatures are warm and soil moisture is high. If the limestone is more finely ground, the reaction is faster. The amount of limestone to apply depends on the amount of organic matter and clay as well as the ph. Fertility testing laboratories that have local experience make this determination. A soil ph that is more than about 8.0 is considered high for most crops. Soils that have a ph in this range are often also calcareous. Calcareous soils have a high content of calcium carbonate. The ph of these soils does not change until most of the calcium carbonate is removed. Acids that are added to the soil dissolve the carbonates and lower the soil ph. Treatments with acid generally are uneconomical for soils that have a content of calcium carbonate of more than about 5%. Because phosphorus, iron, copper, and zinc are less available to plants in calcareous soils, nutrient deficiencies are often apparent. Applications of these nutrients are commonly more efficient than trying to lower the ph. When the soil ph is above 8.6, sodium often is present. These soils generally do not have gypsum or calcium carbonates, at least not in the affected soil horizons. Addition of gypsum followed by leaching using irrigation is a common reclamation practice. However, salts flushed into drainage water may contaminate downstream waters and soils. The application of anhydrous ammonia as a nitrogen fertilizer contributes to lowering the soil ph. In some parts of the country, applications of ammonia lower the surface soil ph from ranges of 6.6 to 7.3 to below 5.6. This reduction can be easily overlooked in areas of no-till cropping unless the ph is measured in the upper 2 inches. Chemical amendments that contain sulfur generally form an acid, which lowers the soil ph. Visit our Web site: (Prepared by the National Soil Survey Center in cooperation with the Soil Quality Institute, NRCS, USDA, and the National Soil Tilth Laboratory, Agricultural Research Service, USDA). The U. S. Department of Agriculture (USDA) prohibits discrimination in its programs on the basis of race, color, national origin, gender, religion, age, disability, political beliefs, sexual orientation, and marital or family status. (Not all prohibited bases apply to all programs.) Persons with disabilities who require alternative means for communication of program information (Braille, large print, audiotape, etc.) should contact USDA s TARGET Center at (202) (voice and TDD). To file a complaint of discrimination, write USDA, Director, Office of Civil Rights, Room 326W, Whitten Building, 14th and Independence Avenue, SW, Washington, DC or call (202) (voice or TDD). USDA is an equal opportunityprovider and employer.
 in the soil solution. The ph scale ranges from 0 to 14; a ph of 7 is considered neutral.")
63 USDA Natural Resources Conservation Service Indicator C Test F Function F/N Soil Quality Indicators Soil ph Soil ph generally refers to the degree of soil acidity or alkalinity. Chemically, it is defined as the log10 hydrogen ions (H + ) in the soil solution. The ph scale ranges from 0 to 14; a ph of 7 is considered neutral. If ph values are greater than 7, the solution is considered basic or alkaline; if they are below 7, the solution is acidic. It is important to recognize that because the ph scale is in logarithmic units, a change of just a few ph units can induce significant changes in the chemical environment and sensitive biological processes. For example, a soil with ph 5 is 10 or 100 times more acidic than a soil with ph 6 or 7, respectively. Sources of H + ions in soil solution include carbonic acid produced when carbon dioxide (CO2) from decomposing organic matter, root respiration, and the soil atmosphere is dissolved in the soil water. Other sources of H + ions are root release, reaction of aluminum ions (Al +3 ) with water, nitrification of ammonium from fertilizers and organic matter mineralization, reaction of sulfur compounds, rainwater, and acid rain. Certain soils are more resistant to a drop or rise in ph (buffering capacity). Therefore, the lime requirement, which is the quantity of limestone (CaCO3) required to raise the ph of an acid soil to a desired ph, must be determined specifically for each field before amending the soil. Factors Affecting Inherent - The natural soil ph reflects the combined effects of the soil-forming factors. Weathering and associated chemical reactions release cations (Ca +2, Mg +2, K +1, Na +1 ) that remain freely in soil solution, form complexes with dissolved organic carbon compounds, or are adsorbed at the surface of clay minerals and humus. Over time, the leaching of free cations, basic oxides, and carbonates, as well as the removal of cations by plant uptake and harvesting, and the continuous formation of carbonic acid result in soil acidification. When cations are lost, H + ions replace them in the soil solution and on the surface of clay minerals and humus. In very acid soils (where ph is less than 5), aluminum becomes soluble and its ions (Al +3 ) tend to react with water to produce H + ions, which further exacerbate acidification. In arid climates, soil weathering and leaching are less intense, cations accumulate, and OH - ions offset H + ions. As a result, the Phosphorus deficiency in corn. Source: R.L. Croissant, Bugwood.org soil becomes neutral or alkaline. Soils with coarse textures may acidify easily compared to clay soils, because they have low organic matter content, a low buffering capacity, a low cation-exchange capacity (poor cation retention), and high rates of water percolation and infiltration. Clay and organic matter in mineral soils act as buffers to resist ph variations. Soil parent material influences soil properties including ph as shown by the contrasting phs of soil formed in calcareous and granitic materials. The effect of vegetation on soil ph is due partly to the type of humus produced as certain types of humus are soil acidifying. Water erosion removes surface horizons, which can be rich in organic matter, creating a ph gradient along the slope. Dynamic - The conversion of uncultivated land into cultivated soils can result in drastic ph changes after a few years. These changes are caused by the removal of cations by crops, the acceleration of leaching, the effect of fertilizers and amendments, and the variations in organic matter content and soil buffering capacity. Inorganic amendments (lime and gypsum) and organic amendments rich in cations increase soil ph. Ammonium from organic matter mineralization (nitrification), ammonium-based fertilizers, and sulfur compounds lower the ph. High rates of water percolation and infiltration increases leaching of cations and accelerate soil acidification. Relationship to Soil Function Soil ph affects the soil s physical, chemical, and biological properties and processes, as well as plant growth. The nutrition, growth, and yields of most crops decrease where ph is low and increase as ph rises to an optimum level Helping People Help the Land...

64 (see table 1). Many crops grow best if ph is close to neutral (ph 6 to 7.5) although a few crops prefer acid or alkaline soils. In acid soils, calcium and magnesium, nitrate-nitrogen, phosphorus, boron, and molybdenum are deficient, whereas aluminum and manganese are abundant, sometimes at levels toxic to some plants. Phosphorus, iron, copper, zinc, and boron are frequently deficient in very alkaline soils. Bacterial populations and activity decline at low ph levels, whereas fungi adapt to a large range of ph (acidic and alkaline). Most microorganisms have an optimum ph range for survival and function (see table 2). At very acid or alkaline ph levels, organic matter mineralization is slowed down or stopped because of poor microbial activity linked to bacteria. Nitrification and nitrogen fixation are also inhibited by low ph. The mobility and degradation of herbicides and insecticides, and the solubility of heavy metals are ph dependent. The effects of soil ph on cation availability influence aggregate stability since multivalent cations, such as calcium ions, act as bridges between organic colloids and clays. Some diseases thrive when the soil is alkaline or acidic. Take-all, which is caused by the fungus Gaeumannomyces graminis, is favored by alkaline ph and infects wheat, barley, rye, and several grasses. Problems with Poor Soil ph Levels Deficiencies of many nutrients, decline of microbial activity and crop yield, and deterioration of environmental conditions are associated with ph levels as discussed in the previous section. Improving Soil ph Liming, addition of organic residues rich in basic cations, and crop rotation to interrupt the acidifying effect of leguminous crops increase soil ph. Applying ammonium based fertilizers, urea, sulfur/ferrous sulfate, irrigating with acidifying fertilizers, or using acidifying residues (acid moss, pine needles, sawdust) decrease soil ph. Increasing organic matter increases buffering capacity. Measuring Soil ph Soil ph is measured in the field using a portable ph pocket meter as described in the Soil Quality Test Kit Guide, section I, chapter 6, page 15. See also section II, chapter 5, pages 63 to 66 for interpretation of results. Specialized equipment, shortcuts, tips: Always calibrate the ph meter with the appropriate buffer solution before using it and report the soil to water ratio used to take the reading. Wait 10 to 15 minutes after measuring electrical conductivity to allow soil particles to settle. Time needed: 10 minutes References: Brady CN and RR Weil The Nature and Properties of Soils, 13th Edition. Prentice-Hall. Karlen D, Andrews S, Wienhold B, and Zobeck T Soil quality assessment: Past, present and future. Journal of Integrated Biosciences 6(1):3-14. Smith JL and JW Doran Measurement and use of ph and electrical conductivity for soil quality analysis. In Methods for assessing soil quality. Soil Science Society of America Special Publication 49: Table 1. Relative yield of selected crops grown in a corn, small grain, legumes or timothy rotation at different ph levels. (adapted from Smith and Doran 1996) Crop ph Relative Average Yield Corn Wheat Oats Barley Alfalfa Soybean Timothy Table 2: Maximum, minimum, and optimum ph values for microbial groups. (adapted from Smith and Doran 1996) Microorganisms Range Optimum Bacteria Actinomycetes Fungi Blue green bacteria 6-9 > 7 Protozoa 5-8 > 7 USDA is an equal opportunity provider and employer. April 2011
65 Calcium and Magnesium o Calcium and Magnesium are macronutrients required by all plants o Ability of soil to supply these nutrients tied to soil alkalinity, acidity (and liming)
66 Calcium and Magnesium o Calcium Cl Usually in plentiful supply except at lower ph ( and lower) when Al plentiful Sources are calcium containing minerals (calcite), calcium in complex with humus, calcium on cation exchange complex Cl Deficiencies are uncommon but can make Mg, Mn, and Zn toxic to plants Toxicity results in stunted and gelatinous roots

67 Effect of Calcium Deficiency on Root Growth -Ca + Ca
68 Calcium and Magnesium o Magnesium c Magnesium important in photosynthesis c Magnesium deficiency more common than Calcium Deficiency appears as chlorosis on leaves c Sources of Mg include: Exchangeable Mg on clay-humus complex (colloid) Mg containing minerals Plant residue and organic matter
69 Salt-Affected Soils o Salt-affected soils found throughout world, typically in areas with little ra inf a II o Soluble salts originate from weathering of minerals in rocks IJ Dissolved salts carried by water from high to lower elevations, wetter to drier zones IJ Water eventually evaporates leaving salt accumulations behind
70 Salt-Affected Soils o Salt concentration in soils can be increased by human activity c Changing perennial vegetation for annual row crops can upset water balance More water percolating through strata can pick up more salt and carry it to low lying areas Cl Irrigation water will have dissolved salts present
71 Classes of Salt-Affected Soils o Saline soils IJ Electrical conductivity >4 deci-siemens/m (ds/m) Cl ph values of 8.5 or less Exchangeable sodium 0 /o 15 or less Cl Exchange complex dominated by calcium and magnesium Cl Plant growth is not limited by poor infiltration, aggregate stability, or aeration
72 Classes of Salt-Affected Soils o Saline-sodic soils Cl Detrimental levels of neutral soluble salts and a high proportion of sodium ions Exchangeable sodium is 15o/o or more Electrical conductivity >4 ds/m Cl Plant growth may be limited by salinity and sodium levels Cl Can become sodic if soluble salts are leached from soil
73 Classes of Salt-Affected Soils o Sodic soils c Electrical conductivity less than 4 ds/m and ESP >15o/o c ph is greater than 8.5 High solubility of sodium carbonate maintains high concentrations of ( and HC0 3 - in soil solution c Soil colloids repel each other leaving a dispersed surface and poor physical condition c Plant growth highly limited or restricted


74 Effect of Ion Type on Dispersion and Flocculation If there \\.'ere no int.ol.!ne-nir r g hyt'lrated l'o,ll's. lnen shorl range by \'an der \V.aa1s forc s { t \\ ootd eause o510iids w rol1er.e_ \\ f ith H htly bound hydrat<!d ioos. eo!lohis.jre :still cfose enou:h to C{'lbe e by van de.r.a.al,s. forces. 0 {.') \Vith loosd)' bol!nd hydra1ed tolls. CC!llo ds Me too far apart to co41e-re b)1 v.an dd' \'tt.aa1s: forc :s. o, a G 1Q 0 ao e o oo 0 {a) livdr t d Ca mtr:l 1\.tg io1u (l,) 0 0 Hydr ted Na Jlis; (C} 0 0

75 Soil electrical conductivity (EC) is a measure of the amount of salts in soil (salinity of soil). It is an excellent indicator of nutrient availability and loss, soil texture, and available water capacity. It affects crop yields, the suitability of the soil for certain crops, the amount of water and nutrients available for plant use, and the activity of soil micro-organisms, which influences key soil processes such as the emission of greenhouse gases, including nitrogen oxides, methane, and carbon dioxide. Excessive salts hinder plant growth by affecting the soil and water balance. Soils containing excessive salts occur naturally in arid and semiarid climates. Salt levels can increase as a result of cropping, irrigation, and land management. Although EC does not provide a direct measurement of specific ions or salt compounds, it has been correlated to concentrations of nitrates, potassium, sodium, chloride, sulfate, and ammonia. For certain nonsaline soils, determining EC can be an easy, economical way to estimate the amount of nitrogen (N) available for plant use. Soil EC can also be an effective way to determine the texture of the surface layer because smaller clay particles conduct more electrical current than larger silt and sand particles. Inherent Factors Affecting Soil EC Inherent factors affecting EC include soil minerals, climate, and soil texture. Other factors include bulk density, soil structure, water potential, timing of measurement, soil aggregation, and electrolytes in soil water. Salts originate from the disintegration (weathering) of minerals and rocks. In areas that receive a high amount of rainfall, soluble salts are flushed below the root zone and eventually into deep groundwater systems or into streams that transport the salts to the ocean. Nonsaline soils that have a higher EC value have more available nutrients than those that have a lower EC value. In arid areas, areas that receive less rainfall, and areas where saline irrigation water is applied, soluble salts are more likely to accumulate and remain near the soil surface, resulting in high EC. Salt-affected soils are mainly in the western part of the United States, in arid or semiarid areas where the annual rainfall is low. Low areas, depressions, or other areas where water accumulates tend to have higher EC than surrounding higher lying, better drained areas. Water that infiltrates into soils can interact with the underlying bedrock and other material that weathers, releasing salts and creating saline seeps on side slopes. This occurs at the loess-till interface in areas where loess soils are underlain by glacial till. Soils that have a higher content of smaller soil particles (higher content of clay) conduct more electrical current than do soils that have a higher content of larger silt and sand particles (lower content of clay). Soils that consist dominantly of clay minerals that have a high cation-exchange capacity (CEC), such as smectite, can have higher EC than soils that consist dominantly of clay minerals that have a low CEC, such as kaolinite. Soils that have a restrictive layer, such as a claypan, typically Page 1 Guides for Educators (May 2014)
76 Soil Health Electrical Conductivity USDA-NRCS have higher EC. The salts accumulate on the soil surface because the restrictive layer limits water flow; thus, they cannot be leached from the root zone. Soil EC is affected by cropping, irrigating, land use, and application of fertilizer, manure, and compost. When managing for salinity on irrigated land, the salt content of the irrigation water must be determined. Applying irrigation water in amounts too low to leach salts or applying water that is high in content of salts results in an accumulation of salts in the root zone, increasing EC. Existing salinity levels and the amount of salts in manure and municipal waste need to be closely monitored, especially in arid climates. Nitrogen fertilizer can also increase salinity, especially in areas where it is already a potential concern. Management that leads to low organic matter content, poor infiltration, poor drainage, saturated soil conditions, or compaction can Salinity Management increase salinity and decrease the ability of the soil to support some plants. When irrigating, applying more water than is needed for crops can help to leach excess salts below the root zone and maintain the desired EC level for the crop grown. Care is needed when applying excess irrigation water because the soil can become waterlogged, allowing salts to accumulate. Leaving crop residue on the surface limits evaporation and helps to retain soil moisture, allowing rainfall and irrigation water to be more effective in leaching salts. In some areas, both irrigation and drainage are needed to reduce salinity. Proper soil management to maintain the organic matter content and overall soil health is needed to keep EC at the desired level. Problems Related to EC and Relationship of EC to Soil Function Areas of saline soils need to be managed differently than areas of nonsaline soils (e.g., different crops and irrigation practices). Soil micro-organism activity declines as EC increases above the desired level. This impacts important soil processes such as respiration, residue decomposition, nitrification, and denitrification (table 1). A high concentration of sodium salts (sodic conditions) in soils can result in poor soil structure, poor infiltration or drainage, and toxicity for many crops. Each crop has a particular salt tolerance. Table 3 shows the percent reduction in yields based on the soil EC level. Soils that have EC 1:1 of less than 1 decisiemen per meter (ds/m) are considered to be nonsaline (table 2). Salinity in these soils does not affect most crops and soil microbial processes (tables 1 and 3). Soils that have EC 1:1 of more than 1 ds/m are considered to be saline. Important microbial processes, such as nitrogen cycling, production of nitrous gases and other N oxide gases, respiration, and decomposition of organic matter are affected. Populations of parasitic nematodes and loss of nitrogen can be higher in these soils. Even slight to moderate salinity can impede crop growth, as shown in figure 1. In nonsaline soils, EC levels can be an indirect indicator of the amount of water-soluble nutrients, such as nitrate nitrogen, available for plant use. Page 2 Guides for Educators (May 2014)
. *EC 1:1 value using compost and distilled water that has no EC value (0 ds/m).")
77 Soil Health Electrical Conductivity USDA-NRCS *EC 1:1 2.2 *EC 1:1 1.6 *EC 1:1 1.2 Figure 1. EC 1:1 values for tomatoes, using three types of compost with different EC values and tap water (Gage, 2012). *EC 1:1 value using compost and distilled water that has no EC value (0 ds/m). The EC 1:1 value was adjusted using the formula: EC 1:1 value of compost with tap water (EC of tap water EC 1:1 of compost with tap water). For example, the EC value of the smallest tomato plant with tap water is 2.6; therefore, (1 2.6) = (0.385), or 2.22 ds/m with distilled water. Table 1. Soil EC influence on microbial processes and gaseous N production in soils amended with sodium chloride (NaCl) or nitrogen fertilizer (adapted from Smith and Doran, 1996 (tables 10-5 & 10-6) and Adviento-Borbe and others, 2006). Process EC 1:1 range (ds/m) Relative decrease/increase (percent) EC 1:1 threshold Respiration 0.7 to to Decomposition 0.7 to to Nitrification 0.7 to to Denitrification 1.0 to to Anaerobic N 2 O gas production (high nitrate)* 0.02 to to +31, *Anaerobic N 2 O gas production (low nitrate) 0.5 to to + 90, *Soils that have an EC value of more than 1 ds/m and a relatively high nitrate level will have increased production of nitrous oxide (N 2 O) gas by denitrification under anaerobic conditions (90 percent or more water-filled pore space) by more than 15 to 315 times. Nitrous oxide is nearly 300 times more potent than carbon dioxide (CO 2 ) as a greenhouse gas that depletes ozone in the upper atmosphere. Page 3 Guides for Educators (May 2014)
78 Soil Health Electrical Conductivity USDA-NRCS Table 2. Salinity classes and relationship between EC 1:1 and EC e values (Smith and Doran, 1996, adapted from Dahnke and Whitney, 1988). Degree of salinity (salinity classes) Texture Nonsaline Slightly saline Moderately saline Strongly saline Very strongly saline Ratio of EC 1:1 to EC e Coarse sand to loamy sand EC 1:1 method (ds/m) Loamy fine sand to loam Silt loam to clay loam Silty clay loam to clay EC e method (ds/m) All textures N/A Page 4 Guides for Educators (May 2014)
79 Soil Health Electrical Conductivity USDA-NRCS Table 3. Salt tolerance and decrease in yields beyond EC threshold (Smith and Doran, 1996; EC 1:1 based on Hoffman and Maas, 1977). Crops EC e threshold (ds/m) EC 1:1 threshold (ds/m) Percent decrease in yields per EC 1:1 unit (ds/m) beyond threshold Barley to Cotton to Sugar beets to Wheat to Perennial ryegrass to Soybeans to Tall fescue to Crested wheatgrass to Peanuts to Rice, common vetch to Tomatoes to Alfalfa to Corn, potatoes to Berseem clover, orchardgrass, grapes, peppers to Lettuce, cowpeas to Green beans to What current practices affect soil EC? What impact do these practices have on soil EC? Why? Page 5 Guides for Educators (May 2014)
 measuring scoop Squirt bottle Distilled water or rainwater Calibrated 120-mL vial with lid EC probe (blue with black cap) Probe holder with field calibration resistor (470 ohm) 1.")
80 Soil Health Electrical Conductivity USDA-NRCS Measuring Soil EC (EC 1:1 Method) Materials needed to measure soil EC: Soil probe and plastic container for gathering and mixing soil samples 1/8-cup (29.5-mL) measuring scoop Squirt bottle Distilled water or rainwater Calibrated 120-mL vial with lid EC probe (blue with black cap) Probe holder with field calibration resistor (470 ohm) 1.41-dS/m calibration solution Pen, field notebook, permanent marker, and resealable plastic bags Considerations: Because soil EC is variable, multiple samples should be taken from multiple locations. Soil EC levels vary depending on past management, field location, and time of year. Examples of variables include placement of fertilizer in rows versus between rows, soil texture, organic matter content, and applications of manure or fertilizer. Scan sampling area for large bare spots, areas with short plants, areas with better plant growth, and areas with possible indications of salinity (salts may be visible at the soil surface). Each of these areas should be sampled separately. *Step-by-step procedure: 1. Calibrate EC probe by immersing in a standard salt solution (1.41 ds/m) at 25 C (77 F) and turning the adjustment knob on the probe to 1.4 with a screwdriver. Second, insert EC probe (fig. 2) into calibration resistor on probe holder. Record reading. Future readings are taken at the same air temperature. Figure 2. EC probe inserted into resistor on holster to check calibration (Doran and Kucera, 2012). 2. Using a soil probe, gather at least 10 randomly selected samples from an area that represents a particular soil type, condition, and management history. The probe should extent to a depth of 8 inches or less. Place samples in the small plastic container and mix. Do not include large stones and plant residue. Repeat step 1 for each sampling area. 3. Fill one scoop (29.5 ml) with mixed soil, tamping down during filling by carefully striking scoop on a hard, level surface. Place soil in calibrated vial. Add one scoopful (29.5 ml) of distilled water. The vial will contain a 1:1 ratio of soil to water, on a volume basis. 4. Tightly cap vial and shake 25 times. 5. Remove EC probe cap, turn probe on, and insert probe into soil and water mixture in vial, keeping the tip of the probe in the center of the suspended soil particles. Take reading while soil particles are still suspended in solution. To keep soil particles from settling, stir gently with EC probe. Do not immerse probe below maximum immersion level. 6. Reading will stabilize in about 10 seconds. Record EC 1:1 as ds/m. Page 6 Guides for Educators (May 2014)
81 Soil Health Electrical Conductivity USDA-NRCS 7. Save soil and water mixture to measure ph, nitrates, nitrites, and phosphorus, if applicable. Nitrate levels can be estimated for soils that are nonsaline and have a ph of less than 7.2 if nitrates make up most of the soluble salts in the EC reading. Use the equation 140 x EC 1:1 </= soil nitrate nitrogen, expressed as ppm. For example, 140 x 0.03 ds/m </= 4.2 ppm nitrate nitrogen. 8. Turn off probe, thoroughly rinse with water, and replace cap. *Note that the EC test can be conducted in the field by inserting the EC probe into the soil to the desired depth and saturating the soil with distilled water. This simulates the EC1:1 test. Record soil EC 1:1 readings. Complete table 4 by comparing EC readings to values in tables 1, 2, and 3 to determine the relative Interpretations level of salinity and the microbial processes and crops that might be impacted by the salinity. Answer discussion questions. Table 4. Soil EC level (salinity) of upper part of soil and interpretations Site Soil EC 1:1 (ds/m) Texture Degree of salinity ph Nitrate estimate (ppm) Microbial processes impacted Crops impacted Notes No till 0.3 Silt loam Nonsaline N/A N/A Nitrate level of 42 ppm is adequate for corn. Conventional till 1.2 Silt loam Slightly saline 7.8 N/A Decrease in respiration, decomposition, and nitrification; increase in loss of nitrogen (N 2 and N 2 O) through denitrification Alfalfa and vegetables Reading taken after nitrogen fertilizer was applied. Page 7 Guides for Educators (May 2014)
82 Soil Health Electrical Conductivity USDA-NRCS Were results of soil EC test expected? Why or why not? Compare soil EC results to values in tables 1, 2, and 3. Are EC levels ideal for crops or forage plants and for soil microbial processes? Why or why not? Glossary and References Glossary Cation-exchange capacity (CEC). Capacity of soil to hold cations (positively charged ions) on surface of negatively charged clay and soil organic matter and release them to the soil solution to be used by plants, to be leached, and/or to be used for biological processes. Soils that have a high content of clay or organic matter have a higher CEC than those that have a low content of organic matter or are sandy. DeciSiemens per meter (ds/m). Unit of measurement for soil electrical conductivity. Equivalent to millimhos per centimeter. Denitrification. Conversion and loss of nitrate nitrogen to the atmosphere as various forms of gas due to a lack of oxygen in soil when it is saturated with water. EC e method. Saturated past method for measuring soil EC, which is the standard laboratory method (adjustment for soil texture not needed). See table 2 for the relationship between EC 1:1 and EC e values. EC 1:1 method. Method for measuring soil EC using a 1:1 ratio of soil and water (adjustment for soil texture needed). See table 2 for the relationship between EC 1:1 and EC e values. Loess. Soil consisting of eolian sediment, which is an accumulation of windblown silt. Loess typically is homogeneous and highly porous. Nitrification. Conversion of ammonium compounds in organic material and fertilizer into nitrites and nitrates by soil bacteria, making nitrogen available to plants. Nitrogen oxides. Nitrogen gases that can be generated by human activity and released into the atmosphere. Loss of nitrogen gases from soils increases 10 to 100 times by nitrification when the soils are dry and by denitrification when the soils are saturated. Loss of nitrogen oxide gases also increases when soil EC is more than 1 to 2 ds/m. Respiration. Release of carbon dioxide (CO 2 ) from soil as a result of biological activity (i.e., micro-organisms and roots) and decomposition of organic matter. Saline/sodic soil. Saline soils have a high content of soluble salts that negatively affect soil processes, productivity, and overall soil Page 8 Guides for Educators (May 2014)
83 Soil Health Electrical Conductivity USDA-NRCS health. As sodium (Na + ) becomes dominant, saline soils can become sodic. Sodic soils tend to have poor structure, which restricts water infiltration, soil aeration, and drainage. Till. Soils that formed in till or glacial till are made up of extremely heterogeneous sediment of glacial origin. These soils consist of clay to mixed clay, sand, gravel, and boulders. Till typically is less porous than loess, and water seeps can form on hillsides in areas where loess overlies till. References Adviento-Borbe, M.A.A.; J.W. Doran; R.A. Drijber; and A. Dobermann Soil electrical conductivity and water content affect nitrous oxide and carbon dioxide emissions in intensively managed soils. Journal of Environmental Quality, 35: Dahnke, W.C., and D.A. Whitney Measurement of soil salinity. In Recommended soil chemical test procedures for the North Central Region. Pages Revision of North Central Regional Research Publication 221. North Dakota Agricultural Experiment Station Bulletin 499. Fargo, ND. Maas, E.V., and G.J. Hoffman Crop salt tolerance current assessment. Journal of the Irrigation and Drainage Division, American Society of Civil Engineers, 103: Patriquin, D.E.; H. Blaikie; M.J. Patriquin; and C. Yang On-farm measurements of ph, electrical conductivity, and nitrate in soil extracts for monitoring coupling and decoupling of nutrient cycles. Biological Agriculture and Horticulture. Volume 9, pages Smith, J.L., and J.W. Doran Measurement and use of ph and electrical conductivity for soil quality analysis. In Methods for assessing soil quality, J.W. Doran and A.J. Jones (editors). Pages Soil Science Society of America Special Publication 49. Madison, WI. USDA is an equal opportunity provider and employer. Page 9 Guides for Educators (May 2014)
84 USDA Natural Resources Conservation Service Indicator C Test F Function N/D Soil Quality Indicators Soil Electrical Conductivity Soil electrical conductivity (EC) measures the ability of soil water to carry electrical current. Electrical conductivity is an electrolytic process that takes place principally through water-filled pores. Cations (Ca 2+, Mg 2+, K +, Na +, and NH 4+ ) and anions (SO 4 2-, Cl -, NO 3-, and HCO 3- ) from salts dissolved in soil water carry electrical charges and conduct the electrical current. Consequently, the concentration of ions determines the EC of soils. In agriculture, EC has been used principally as a measure of soil salinity (table 1); however, in non-saline soils, EC can be an estimate of other soil properties, such as soil moisture and soil depth. EC is expressed in decisiemens per meter (ds/m). Factors Affecting Inherent - Factors influencing the electrical conductivity of soils include the amount and type of soluble salts in solution, porosity, soil texture (especially clay content and mineralogy), soil moisture, and soil temperature. High levels of precipitation can flush soluble salts out of the soil and reduce EC. Conversely, in arid soils (with low levels of precipitation), soluble salts are more likely to accumulate in soil profiles resulting in high EC. Electrical conductivity decreases sharply when the temperature of soil water is below the freezing point (EC decreases about 2.2% per degree centigrade due to increased viscosity of water and decreased mobility of ions). In general, EC increases as clay content increases. Soils with clay dominated by high cation-exchange capacity (CEC) clay minerals (e.g., smectite) have higher EC than those with clay dominated by low CEC clay minerals (e.g., kaolinite). Arid soils with high content of soluble salt and exchangeable sodium generally exhibit extremely high EC. In soils where the water table is high and saline, water will rise by capillarity and increase salt concentration and EC in the soil surface layers. It is generally accepted that the higher the porosity (the higher the soil moisture content), the greater the ability of soil to conduct electrical currents; that is, other properties being similar, the wetter the soil the higher the EC. Soil parent materials contribute to EC variability. Granites have lower EC than marine shales and clayey lacustrine deposits have higher EC than sandy outwash or alluvial deposits. Saline (ECe 4 ds/m) and sodic (sodium absorption ratio 13) soils are characterized by high EC. Scientific literature reported a relationship between EC values measured with commercial sensors and depths to claypan, bedrock, and fragipan. Microtopographic depressions in agricultural fields typically are wetter and accumulate organic matter and nutrients and therefore have higher EC than surrounding higher lying, better drained areas. Dynamic - Mineral soils enriched in organic matter, or with chemical fertilizers (e.g., NH 4 OH) have higher CEC than non-enriched soils, because OM improves soil water holding capacity, and synthetic fertilizers augment salt content. Continuous application of municipal wastes on soil can increase soil EC in some cases. Electrical conductivity has been used to infer the relative concentration, extent, and movement of animal wastes in soils. Because of its sensitivity to soluble salts, EC is an effective measure for assessing the contamination of surface and ground water. Although EC does not provide a direct measurement of specific ions or compounds, it has been correlated with concentrations of potassium, sodium, chloride, sulfate, ammonia, and nitrate in soils. Poor water infiltration can lead to poor drainage, waterlogging, and increased EC. Relationship to Soil Function Soil EC does not directly affect plant growth but has been used as an indirect indicator of the amount of nutrients available for plant uptake and salinity levels. EC has been used as a surrogate measure of salt concentration, organic Table 1. Classes of salinity and EC (1 ds/m = 1 mmhos/cm; adapted from NRCS Soil Survey Handbook) EC (ds/m) Salinity Class 0 < 2 Non-saline 2 < 4 Very slightly saline 4 < 8 Slightly saline 8 < 16 Moderately saline 16 Strongly saline Helping People Help the Land...

85 matter, cation-exchange capacity, soil texture, soil thickness, nutrients (e.g., nitrate), water-holding capacity, and drainage conditions. In site-specific management and high-intensity soil surveys, EC is used to partition units of management, differentiate soil types, and predict soil fertility and crop yields. For example, farmers can use EC maps to apply different management strategies (e.g., N fertilizers) to sections of a field that have different types of soil. In some management units, high EC has been associated with high levels of nitrate and other selected soil nutrients (P, K, Ca, Mg, Mn, Zn, and Cu). Most microorganisms are sensitive to salt (high EC). Actinomycetes and fungi are less sensitive than bacteria, except for halophyte (salt-tolerant) bacteria. Microbial processes, including respiration and nitrification, decline as EC increases (table 2). Problems with Poor Soil EC Levels High EC can serve as an indication of salinity (EC > 4 ds/m) problems, which impede crop growth (inability to absorb water even when present) and microbial activity (tables 2 and 3). Soils with high EC resulting from a high concentration of sodium generally have poor structure and drainage, and sodium becomes toxic to plants. Improving Soil EC Effective irrigation practices, which wash soluble salts out of soil and beyond the rooting depth, can decrease EC. Excessive irrigation and waterlogging should be avoided since a rising water table may bring soluble salts into the root zone. In arid climates, plant residue and mulch help soils to remain wetter and thus allow seasonal precipitation and irrigation to be more effective in leaching salts from the surface. To avoid the adverse effects of high EC (salinity) in irrigation water, the leaching requirement must be calculated for each crop. Leaching requirement is the fraction of water needed to flush excessive salt below the root zone, that is, the amount of additional water required to maintain a target salinity level. Adding organic matter, Table 2. Influence of soil EC on microbial process in soils amended with NaCl or nitrate (adapted from Smith and Doran, 1996) Microbial process Salt added EC Range (ds/m) Relative Decrease (%) Threshold EC (1:1) Respiration NaCl Decomposition NaCl + alfalfa Nitrification soil + alfalfa Denitrification NO 3 -N such as manure and compost, increases EC by adding cations and anions and improving the water-holding capacity. In some cases, a combination of irrigation and drainage is necessary to lower salt concentration and EC. An EC water (ECw) 0.75 ds/m is considered good for irrigation water. Beyond this value, leaching or a combination of leaching and drainage will be necessary if the water is used. Measuring Soil EC The EC pocket meter is used to take measurements in the field. The method is described in the Soil Quality Test Kit Guide. Always calibrate the EC meter before use. The pocket meter can be augmented by a probe that is placed directly into the soil to measure subsoil EC and NO 3- and make other estimates. NRCS soil scientists and agronomists use electromagnetic induction meters, not pocket EC meters, to map spatial variability of EC and associated soil properties at field scales. Special sensors are used for EC mapping for precision agriculture. Time needed: 10 minutes References: Corwin DL and SM Lesch Apparent soil electrical conductivity measurements in agriculture. Computers and Electronics in Agriculture 46: Smith JL and JW Doran Measurement and use of ph and electrical conductivity for soil quality analysis. In Methods for assessing soil quality. Soil Science Society of America Special Publication 49: Doolittle JA, KA Suddeth, NR Kitchen, and SJ Indorante Estimating depths to claypans using electromagnetic induction methods. Table 3. Salt tolerance of crops and yield decrease beyond EC threshold (adapted from Smith and Doran, 1996) Crop species Threshold EC 1:1 (ds/m)* Percent yield decrease per unit EC beyond threshold EC Alfalfa Barley Cotton Peanut Potato Rice Soybean Tomato Wheat * Electrical conductivity of a 1:1 soil/water mixture relative to that of a saturated paste extract USDA is an equal opportunity provider and employer. December 2011

86 Soil Quality Information Sheet Soil Quality Resource Concerns: Salinization USDA Natural Resources Conservation Service January 1998 What is salinization? Salinization is the process by which water-soluble salts accumulate in the soil. Salinization is a resource concern because excess salts hinder the growth of crops by limiting their ability to take up water. Salinization may occur naturally or because of conditions resulting from management practices. Any process that affects the soil-water balance may affect the movement and accumulation of salts in the soil. These processes include: hydrology climate irrigation drainage plant cover and rooting characteristics farming practices In semiarid areas, salinization often occurs on the rims of depressions and edges of drainageways, at the base of hillslopes, and in flat, low-lying areas surrounding sloughs and shallow bodies of water. These areas receive additional water from below the surface, which evaporates, and the salts are left behind on the soil surface. Summer fallow management practices may cause increased salinization by increasing the soil moisture content to the point that water moves to seeps on hillslopes. Salts accumulate as the water evaporates from these seeps. What are some indicators of soil salinity? Early signs: increased soil wetness in semiarid and arid areas to the point that the soil does not support equipment the growth of salt-tolerant weeds irregular patterns of crop growth and lack of plant vigor Advanced signs: white crusting on the surface a broken ring pattern of salts adjacent to a body of water white spots and streaks in the soil, even where no surface crusting is visible the presence of naturally growing, salt-tolerant vegetation Soil salinity can be estimated by measuring the electrical conductivity of the soil solution. Electrical conductivity increases in a solution in direct proportion to the total concentration of dissolved salts. What causes salinization? Salinization on the soil surface occurs where the following conditions occur together: the presence of soluble salts, such as sulfates of sodium, calcium, and magnesium in the soil a high water table a high rate of evaporation low annual rainfall What are some effects of salinization? Salts in the soil increase the efforts by plant roots to take in water. High levels of salt in the soil have a similar effect as droughtiness by making water less available for uptake by plant roots.

87 Few plants grow well on saline soils; therefore, salinization often restricts options for cropping in a given land area. Salinization degrades the quality of shallow ground water and surface water resources, such as ponds, sloughs, and dugouts. How can salinity problems be managed? Reducing the severity and extent of soil salinity is primarily a problem of water management. Water management can be addressed in two ways: (1) by managing the area contributing excess water to the soil (recharge area) or (2) by managing the area where the excess water comes to the surface (discharge area). Recharge management: Decrease excess water from infiltrating into the soil in recharge areas of seeps by diverting surface water to downslope ponds. Maintain the water table at a low, safe level. Do not over irrigate. In some areas, over irrigation and the lack of natural drainage has raised the water tables, which may require the use of an artificial drainage system. Discharge of salty waters from these drains may contribute to other offsite problems. Irrigate to maintain salts at a level below the root zone in the soil. Use cropping and tillage systems that promote adequate infiltration and permeability. This includes building organic matter for soil aggregation and avoiding compaction. Plant crops that use the available soil moisture. Shallowrooted crops may not extract excess subsoil moisture that can lead to salinity. Remove excess water from recharge areas of seeps by using actively growing, deep-rooted plants. Perennial plants and forages, especially alfalfa, are useful for this purpose because they have a longer growing season and take up more water from a greater depth in the soil than annual plants. Forages may also increase organic matter in the soil and improve soil structure. Return manure and crop residue to the soil to increase soilwater retention. Reduce summer fallow by continuous cropping. Manage snow so that it is evenly distributed and does not pond on thawing. Discharge management: Grow salt-tolerant crops. Convert to permanent soil cover with salt-tolerant crops in high risk areas. Reduce deep tillage, which may bring up salts from deeper soil horizons. Plant forage crops or trees next to bodies of water to increase water use. Install artificial drainage systems in severely affected areas only. Eliminate seepage from irrigation canals, dugouts, and ponds. Generally, control measures should take an integrated approach involving cropping, structural methods, and tillage systems. Visit our Web site: (Prepared by the National Soil Survey Center in cooperation with the Soil Quality Institute, NRCS, USDA, and the National Soil Tilth Laboratory, Agricultural Research Service, USDA). The U. S. Department of Agriculture (USDA) prohibits discrimination in its programs on the basis of race, color, national origin, gender, religion, age, disability, political beliefs, sexual orientation, and marital or family status. (Not all prohibited bases apply to all programs.) Persons with disabilities who require alternative means for communication of program information (Braille, large print, audiotape, etc.) should contact USDA s TARGET Center at (202) (voice and TDD). To file a complaint of discrimination, write USDA, Director, Office of Civil Rights, Room 326W, Whitten Building, 14th and Independence Avenue, SW, Washington, DC or call (202) (voice or TDD). USDA is an equal opportunityprovider and employer.
88 SALINITY AND SODICITY IN WESTERN SOILS
89 What are Salts? When acids and bases neutralize one another; that is, they react chemically, they lose their distinguishing characteristics, and produce compounds called salts. Example: Mg +2 + SO 4-2 = MgSO4 7H 2 O, is known as Epsom salt, and is used in medicine, in tanning leather, and in fireproofing compositions. Ca +2 + SO -2 4 = CaSO 4 = gypsum Na +2 + Cl -2 = NaCl = table salt
90 TYPES OF SALT TABLE SALT = SODIUM CHLORIDE NaCl ROAD DEICER = MAGNESIUM CHLORIDE MgCl DUST CONTROL= CALCIUM CHLORIDE = CaCl TUMS or LIME = CaCO 3 GYPSUM = CaSO 4 BAKING SODA = NaHCO 3 AMMONIUM NITRATE = NH 4 NO 3 CALCIUM NITRATE = CaNO 3 EPSOM SALT = MgSO 4 NU-SALT SUBSTITUTE = KCl
91 WHERE DO SALTS COME FROM? Salts come from the breakdown of rocks through a geochemical process in nature. Production of salt come from salt mines (surface and subsurface), salt wells and the sea.

92 Typical Saline Seep
93 Sodium salt is very soluble! A maximum of 35.7 grams of Sodium Chloride (table salt) will form a solution with 100 ml of water. A maximum of 0.24 grams of CaSO 4 (gypsum) will form a solution with 100 ml of water. A maximum of.0081 grams of CaCO 3 (lime) will form a solution with 100 ml of water.
94 SALT CONDITIONS IN NATURE ( 2 MAJOR TYPES) Salinity- Total concentrations of dissolved salts in soil or water. ( Ca, Mg, K, Na, Cl, SO 3 HCO 3, NO 3, ) Measured by Electrical conductivity EC s ds/m Sodicity- Excess sodium (Na), lower amounts of Ca and Mg on the soil colloid. Measured by calculating SAR or ESP, unitless
95 SAR Is Calculated by: SAR = Na Ca + Mg 2 units are in meq/l
96 Did you know that salt is a good conductor!
97 What is the Difference between Salinity and Sodicity? Salinity = total salts in irrigation water or soil and is measured by EC (ds/m) Sodicity = excess sodium salts relative to Ca and Mg (or other salts) in irrigation water or soil colloids and is measured by SAR
98 Classes of Soil Salts Class EC SAR ph Soil Structure Saline >4dS/m <13 SAR <8.5pH Normal Sodic <4dS/m >13 SAR >8.5pH Poor Saline/ >4dS/m >13 SAR Sodic < 8.5 ph Normal
99 Very Important!! Watch your units in EC! There are many units being used for example: an EC of 1.6 ms/cm = 1.6 ds/m or an EC of 1.6 ds/m = 1.6 mmhos/cm or an EC of 1.6 ds/m = 1600 micros/m
100 What is Soil EC? Soil Electrical Conductivity (EC) is the electrolytic conductivity of an extract from saturated soil paste. Electrical conductivity is a measure of the concentration of water-soluble salts in soils. It is used to indicate saline soils.
101 Why does sodium raise the ph? The ph of most western soils is controlled by CaCO 3. As sodium enters the soil which is more soluble than Ca, the sodium reacts with the CO 3 to form Na 2 CO 3 and by adding water gives off Na 2 HCO 3. This gives off the OH anion in soil solution which raises ph. Ex. ph 9 has >(OH- Anions) vs (H+cations) in soil solution ph 5 has >(H+cations) vs (OH-anions) in soil solution Remember ph is the negative log of the H ion. H is positive (cation) and OH is negative (anion)!
102 Sodium Hazards High concentrations of neutral salts, such as sodium chloride and sodium sulfate, may interfere with the absorption of water by plants because the osmotic pressure in the soil solution is nearly as high or higher than that in the plant cells. Other salts such as CaSO 4 may also effect osmotic pressure.
103 What are the components of a good soil? Non-saline, Non-sodic EC=1.0 SAR=1.5 A balanced soil of cation/anions on the exchange sites with EC=1.0 = 640mg/l 23% Ca or 150mg/l 7% Mg or 15mg/l 11% Na or 70 mg/l 4% K or 8 mg/l 28% HCO 3 or 180 mg/l 25% SO 4 or 160 mg/l 14%Cl or 90 mg/l
104 What are the components of a high EC (6.0) /saline soil? SAR (2.3) A Saline soil has a high amount of soluble salts, nonsodic salts 3800 mg/l 21% Ca or 800mg/l 4% Mg or 160mg/l 10% Na or 400mg/l 4% K or 150mg/l 16% Cl or 610mg/l 21% HCO 3 or 790 mg/l 23% SO 4 or 890 mg/l
105 What are the components of a high EC (6.5) /Saline and High Sodic/SAR (27) soil? A high EC/Saline and high Sodic/SAR soil 5200 mg/l 6% Ca or 320mg/l 0.5% Mg or 60mg/l 57% Na or 2900mg/l 0.5% K or 150mg/l 7% Cl or 360 mg/l 15% HCO 3 or 800mg/l 14% SO 4 or 720mg/l
106 What are the components of a low EC (2.0) /Saline and High Sodic/SAR (19) soil? A low EC/Saline and high Sodic/SAR soil dispersing & black alkali sfc mg/l 6% Ca or 80 mg/l 3% Mg or 40 mg/l 71% Na or 900 mg/l 0.6% K or 8 mg/l 6% SO 4 or 80 mg/l 6%Cl or 80 mg/l 6%HCO 3 or 80 mg/l
 Saline High Sodic/SAR (19) soil Na+ Na+ Na+ Na+ Na+ Na+ Na+ Na+ Na+ Na+ Na+ Na Sodium only has 1+ charge, compared to Ca and")
107 Low EC (2.0) Saline High Sodic/SAR (19) soil Na+ Na+ Na+ Na+ Na+ Na+ Na+ Na+ Na+ Na+ Na+ Na Sodium only has 1+ charge, compared to Ca and Mg which has 2+. Na does not form bridges (weaker bond) between soil particles therefore the soil structure deteriorates.


108 TDS Ratio s EC/SAR EC/SAR EC/SAR EC/SAR 1.0/ /27 6.0/ /19

109 Example of Sodic and Saline Soil

110 Close Up Of Soil Dispersion Breakdown of soil particles.
111 Soil Particles are negatively charged. - Soil Particles are negatively charge and attract positive charge
112 EC Values of Various Water Absolute Pure water ds/m Good City water 0.05 ds/m My water (Gillette) 2.2 ds/m Ocean water 53.0 ds/m
113 Crop EC Tolerances Crop toler. no loss Max toler.will have 50% loss Beans Alfalfa Corn S. Beets Crest. Whtg Wheat Barley M.Brome Tall Wheatgrass
114 Cations + Anions = TDS Ca,Mg,K,Na Cl,SO 4,HCO 3, CO 3 An EC of 1.0 ds/m = 640 mg/l An EC of 2.0 ds/m = 1280 mg/l An EC of 4.0 ds/m = 2560 mg/l
115 Irrigation Water EC ranges Non-saline water Slightly saline Moderately saline Highly saline Brine water < 0.75 ds/m d/sm 2-5 ds/m 5-25 ds/m >45 ds/m
116 Salts In Irrigation Water EC of irrigation water = 2.0 or 1280mg/l or 1280 ppm. Ac-Ft of water weighs 2,720,000 lbs Therefore each irrigation of 1.0 ac-ft of water will have 1280 X 2.72 = 1.7 tons of salt with each irrigation application.
117 Reclamation of Saline Soils Applying additional water to leach the salts lower in the profile, it is best to use EC water is 0.5 or less. E.g. Amt. of drainage/ amt. of water applied 12 ppt with 20 irrigation w/ efficiencies calculated corn needs = = 8 8 /32 = 25% leaching fraction Rule of Thumb 1.0 ac-ft or 12 inches of extra water applied = would reduce salinity by approx. 90% Therefore 8 inches of extra water = 65%
118 Reclamation of Sodic Soils Amend soils with a supply of Ca, such as Gypsum, CaSO 4 CaCl 2 Sulfur Sulfuric Acid, H 2 SO 4 Along with Irrigation water
119 NRCS Practices PC-610 Toxic Salt Reductions, used to reduce sodium/boron/chlorides in soils. PC- 571 Soil Salinity Mgt., non-irrigated lands
120 Leaching Fraction-example Water has EC of 3.1 ds/m Crop is alfalfa, max no yield loss EC of inches of water for alfalfa What is the leaching fraction? Lf%= EC water [5 (a constant) x Ecdesired ]- Ecwater = 3.1 [5 x 2.0] % extra water to leach the salts to a acceptable EC of 2.0
121 Reclamation of Saline Soils o Leaching excess soluble salts from soil with salt free water o Use deep rooted vegetation to lower water table and reduce upward movement of salts o Ensure natural soil drainage is adequate to accommodate leaching water IJ Install artificial drainage if necessary
122 Reclamation of Saline Soils o Management of soil salinity Cl Timing of irrigation important Ensure that salts are moved out of root zone of seedlings High quality water necessary Cl Tillage or surface-residue management Mulches or conservation tillage can reduce evaporation and prevent upward movement of soluble salts
123 Reclamation of Saline-Sodic and Sodic Soils o First, need to reduce level of exchangeable Na + ions, then leach soluble salts CJ To reduce level of exchangeable Na +, Ca 2 + or H + used to replace Na + on exchange complex Gypsum used to supply the Ca 2 + or H + ions Replaced sodium forms a soluble salt (sodium sulfate) that is easily leached Gypsum must be well mixed with soil and followed by leaching to remove sodium sulfate
124 Reclamation of Saline-Sodic and Sodic Soils o Sulfur or sulfuric acid can be used in place of gypsum o Gypsum and sulfur reverse impermeability of sodic soils ll Replacement of Na + with Ca 2 + or H + improves soil aggregation and improves water infiltration
125 FERTFACTS GYPSUM INTRODUCTION Gypsum is the common name of hydrated calcium sulphate, which has the chemical formula CaSO 4.2H 2 O. Gypsum is obtained in two ways, being either: mined from naturally-occurring deposits, or obtained as a co-product from the manufacture of phosphoric acid. This product is known as Phosphogypsum. Very little Phosphogypsum is now available in Australia. Gypsum is used as: a sulphur fertiliser, a calcium fertiliser, or at higher rates as a soil conditioner. Gypsum contains sulphur as sulphate, the form taken up by plant roots. The sulphur in gypsum is readily available, so gypsum can be used where a quick response to sulphur is required. Gypsum has little if any effect on soil ph. It cannot be used as a substitute for lime to correct soil acidity, i.e. to raise the ph. Naturally occurring gypsum is a soft crystalline mineral which is found in arid inland areas of Australia. Naturally occurring gypsum ranges from white to yellow, through pink to brown in colour. The gypsum content usually varies between 35% and 85%. COMPOSITION AND LABEL INFORMATION 1 Analysis Pure gypsum (CaSO 4.2H 2 O) contains 18.6% sulphur (S) and 23% calcium (Ca). Under state legislation in Australia, gypsum is categorised into a number of grades: Grade 1 Grade 2 Grade 3 - a minimum of 15.0% S and 19.0% Ca - a minimum of 12.5% S and 15.5% Ca - a minimum of 10% S and 12.5% Ca 2 Sizing A fine particle size is important for products that are insoluble or have low solubility. The percentage of the gypsum that is capable of passing through a 2.0 mm sieve must be stated on the label. The solubility of gypsum is 0.26 kg/100l water at 20ºC. Gypsum Fact Sheet.docx Page 1 of 4
126 Most naturally occurring gypsums are coarse. Coarse gypsum takes longer to dissolve, which may be either advantageous or disadvantageous. A fine particle size may be of importance where gypsum is dissolved in irrigation water, or a quick response is required. USES OF GYPSUM Gypsum can be used as a fertiliser, to supply sulphur (S) and/or calcium (Ca); or as a soil conditioner. It may also be used to improve the infiltration rate of low conductivity irrigation water, and for water clarification. Use of Gypsum as a Sulphur Fertiliser Given its low analysis, it is usually uneconomical to use gypsum as a sulphur fertiliser if it has to be transported over any great distance. Its use is usually restricted to those districts in which gypsum is available locally at competitive prices. Normally, sulphur is applied along with other nutrients, e.g. nitrogen or phosphorus, using fertilisers like ammonium sulphate (Gran-am), ammonium phosphate sulphate fertilisers (Granulock 15) and single superphosphate (SuPerfect and Super). Situations where gypsum may be applied as a sulphur fertiliser include: In legume-based pastures on basaltic soils with high phosphorus levels, where fertiliser phosphorus is not required and legumes are relied on to fix nitrogen. In canola, as a pre-plant application, allowing high analysis nitrogen and phosphorus fertilisers with a low sulphur content to be used at planting and during the growing season. Notes It is often necessary to apply gypsum at about 300 kg/ha (45 kg/ha S) as it may be difficult to get application equipment to operate properly and spread gypsum uniformly at lower rates, particularly if the product has a fine particle size. Use of Gypsum as a Calcium Fertiliser Gypsum may be used as a calcium fertiliser, but it may not be the product of choice. Lime should be used on acid soils that are low in calcium. Not only does lime supply calcium, it also corrects acidity (raises the soil ph). However, while lime reacts in acid soils, it is ineffective in neutral and alkaline soils. A typical rate at which gypsum is applied as a calcium fertiliser where the ph does not need amending is t/ha. This would normally be applied during the fallow period, and can remain effective for several years. Gypsum Fact Sheet.docx Page 2 of 4
127 Use of Gypsum as a Soil Conditioner 1 Causes of Poor Soil Structure Poor soil structure can be attributed to many factors, such as over-cultivation, compaction and a loss of soil organic matter. It may also be associated with high concentrations of sodium and/or magnesium in the soil, compared to calcium. When soils with high exchangeable sodium are wet, the clay particles disperse, and the soil loses its defined structure resulting in reduced water infiltration and possible reduced seedling emergence. The structure of sodic and magnesic soils (soils high in sodium and magnesium) can be improved by applying calcium compounds such as gypsum (calcium sulphate) at high rates. As the gypsum dissolves, it releases calcium ions that displace sodium (or magnesium) on the clay colloids. Good rainfall (or irrigation) and drainage is necessary to leach the displaced sodium (and magnesium) from the topsoil deeper into the soil profile. 2 Recognition of Gypsum Responsive Soils To start, much can be learnt from the field, e.g. degree of surface crusting, ease of cultivation, ability to store and use soil moisture, and crop yields. Soil tests can further assist in confirming the cause of soil structural problems. 3 Gypsum Rates The rate at which gypsum is recommended will depend on the soil type (higher rates are required on heavy clays), the severity of the problem, the depth of incorporation, and the value of the crop. 4 Gypsum Applications and Timing Gypsum is broadcast on the soil surface. Where gypsum is applied to improve soil structural characteristics, apply it as early as possible prior to sowing a crop or pasture. After application, it should be thoroughly incorporated into the soil. Gypsum improves soil structure by displacing sodium (and magnesium) on the surface of clay particles with calcium. Gypsum (calcium sulphate) is sparingly soluble, but the sodium (and magnesium) sulphates that form in the soil solution are very soluble. Rain (or irrigation) is required to leach these soluble salts out of the topsoil deeper into the soil profile, away from zone in which crop roots will be growing. If this does not occur, soil structure may be improved, but crop growth may in fact be made worse due to the salt effect. 5 Before applying Gypsum to Sodic Soil check the Soil EC (Electrical Conductivity). If a soil test reveals high electrical conductivity, sodium and chloride, gypsum should not be recommended. The best way to ameliorate the soil will be to improve drainage, as most of the sodium will be present as soluble sodium salts and not exchangeable sodium. Gypsum Fact Sheet.docx Page 3 of 4

128 6 Use of Lime to improve Soil Structure Sodic and magnesic soils are typically alkaline, i.e. they have a high ph. Lime is insoluble and therefore ineffective if the ph is high. It only reacts in acid soil where, the solubility of lime is adequate to supply calcium and increase ph. Gypsum has little or no effect on soil ph. On soils that are both acid and sodic, lime should be used, or a combination of lime and gypsum. The gypsum will work quicker in improving soil structure than lime, but lime is necessary to increase the soil ph. Lime is of no use on alkaline sodic soils. Use of Gypsum to Improve Irrigation Water Infiltration Rates The use of low conductivity irrigation water can cause clay particles at the soil surface to disperse, causing the surface to seal, thereby reducing water infiltration rates. This can occur in soils of otherwise good structure. As gypsum is sparingly soluble, the use of agitators in the mixing tank can help get it to dissolve. Use of Gypsum as a Water Clarifier Gypsum can be used as a clearing (or flocculating) agent for muddy water, e.g. from dams, bores and in rice paddies. It causes the very fine suspended colloidal particles to clump together, forming particles too large to remain in suspension, so they fall to the bottom. A fine particle size is essential for the gypsum to dissolve quickly. A suggested application rate is 1 kg of gypsum per litres of water. WARNING The information contained in this publication is for use as a guide only. The use of fertilisers and soil amendments are not the only factors involved in producing a top yielding crop or pasture. Local soil, climatic and other conditions should also be taken into account, as these could affect responses. Because conditions of use, suitability of product and application conditions are beyond our control, Incitec Pivot Limited hereby expressly disclaim any liability to any person, property or thing in respect of any of the consequences of anything done or omitted to be done by any person in reliance, whether wholly or in part, upon the whole or any part of the contents of this publication. COPYRIGHT Copyright, All rights reserved. Incitec Pivot Limited Level 8, 28 Freshwater Place, Southbank, VIC 3006 ABN Freecall Gypsum Fact Sheet.docx Page 4 of 4
129 The Myth Linda Chalker-Scott, Ph.D., Extension Horticulturist and Associate Professor, Puyallup Research and Extension Center, Washington State University The Myth of Gypsum Magic Adding gypsum to your yard or garden will improve soil tilth and plant health Upon continued prodding from one of my university extension colleagues, I recently watched several episodes of a well-known gardening program on television. My kids joined me, alerted by my animated responses to the host s non-stop torrent of advice. Among many amazing discoveries I learned that by adding gypsum to my yard or garden I would improve my problem soils by changing the particle size and loosening compaction. Further searching on the web revealed that gypsum would also improve drainage, decrease acidity, and eliminate soil salts. Previously, I had heard of gypsum for use in soil reclamation projects, but not for a typical urban landscape. Since gypsum is simply calcium sulfate, could this chemical truly transform soil structure and serve as a fertilizer for yards and gardens? The Reality This myth falls into the category of agricultural practices misapplied to ornamental landscapes. Gypsum effectively changes the structure and fertility of heavy clay soils, especially those that are heavily weathered or subject to intensive crop production. Gypsum also improves sodic (saline) soils by removing sodium from the soil and replacing it with calcium. Therefore, one can see improvement in clay soil structure and fertility, and desalinization of sodium-rich soils, by using gypsum. What other effects will gypsum have on soil and plant health? There are a number of scientific studies on gypsum usage both in the literature and on websites. Briefly, researchers have found: Gypsum does not usually change soil acidity, though occasional reports of both increasing and decreasing ph exist; Gypsum can increase leaching of aluminum, which can detoxify soils but also contaminates nearby watersheds; Gypsum can increase leaching of iron and manganese, leading to deficiencies of these nutrients; Gypsum applied to acid soils can induce magnesium deficiency in plants on site; Gypsum applied to sandy soils can depress phosphorus, copper and zinc transport; Gypsum can have negative effects on mycorrhizal inoculation of roots, which may account for several reports of negative effects of gypsum on tree seedling establishment and survival; Gypsum is variable in its effects on mature trees; Gypsum will not improve fertility of acid or sandy soils; Gypsum will not improve water holding capacity of sandy soils; and Gypsum s effects are short-lived (often a matter of months) With the exception of arid and coastal regions (where soil salts are high) and the southeastern United States (where heavy clay soils are common), gypsum amendment is just not necessary in non-agricultural areas. Urban soils are generally amalgamations of subsoils, native and non-native topsoils, and in home landscapes high levels of organic and non-organic chemical additives. They are also heavily compacted and layered (and gypsum does not work well on layered soils). In such landscapes, it is pointless to add yet more chemicals in the form of gypsum unless you need to increase soil calcium levels. This nutrient deficiency can be quickly identified by any soil testing laboratory for less than a bag of gypsum costs. (If you need to improve sulfur nutrition, it s wiser to use ammonium sulfate). To reduce compaction and
130 improve aeration in nearly any landscape, application of an organic mulch is more economically and environmentally sustainable. The Bottom Line Gypsum can improve heavy clay soil structure and remove sodium from saline soils Gypsum has no effect on soil fertility, structure, or ph of any other soil type Most urban soils are not improved by additional gypsum Before adding gypsum or any chemical to a landscape, have soil analysis performed to identify mineral deficiencies, toxicities, and soil character Adding gypsum to sandy or non-sodic soils is a waste of money, natural resources, and can have negative impacts on plant, soil, and ecosystem health For more information, please visit Dr. Chalker-Scott s web page at
131 Gypsum Benefits and Misconceptions Each year, usually in the winter and early spring, we receive calls asking about the benefits of applying gypsum to Midwestern or Eastern farm fields. Typically, the grower is looking for a way to reduce soil compaction. This paper is intended to answer many of these questions. Gypsum is a naturally occurring mineral in many parts of the United States and the world. Gypsum is also often available as a by-product material. Gypsum is hydrated calcium sulfate. The chemical name of gypsum is calcium sulfate dihydrate. The chemical formula for pure gypsum is Ca(SO 4) 2(H 2O). In the chemically pure form, gypsum contains 23.28% calcium (Ca) and 18.62% sulfur (S) in the readily available sulfate form (SO 4). However, the typical gypsum sources that are commercially available for agricultural often contain impurities which result in a Ca level between 18%-23% Ca and 15%-19%. Gypsum is also available as a byproduct material. Some of the more common byproduct gypsum sources are flue gas desulfurization (FGD) gypsum and waste wallboard (also known as sheetrock or drywall). A few locations may have access to byproduct phosphogypsum from the production of P fertilizer, and some locations may have access to byproduct gypsum sources related to other industrial processes. Gypsum has many uses in addition to agriculture. A partial list of products and processes that use gypsum includes blackboard chalk, cement, wallboard, Plaster-of-Paris, dental molds, paint filler, toothpaste, molds for casting metals, Tofu coagulation, improving mineral content of brewing water, dietary calcium additives in breads and cereals, and pharmaceuticals. Table 1. Mineralogical composition of gypsum samples. Source Minerals * present Synthetic gypsum 1 gypsum, quartz Natural gypsum 2 gypsum, quartz, dolomite Cast gypsum 3 gypsum, quartz, anhydrite Drywall gypsum 4 gypsum, quartz, portlandite, calcite 1 Flue gas desulfurization (FGD) by-product. Samples obtained from the W.H. Zimmer Station in Moscow, OH, owned by Cinergy Corporation 2 Mined geologic deposits. Samples obtained from the Kwest Group at Port Clinton, OH 3 Cast gypsum from recycled molds. Samples obtained from Mansfield Plumbing Products, LLC of Mansfield, OH 4 Waste wallboard/drywall/sheetrock. Samples obtained from Transfer Services, LLC of Columbus, OH * gypsum = CaSO 4 2H 2O, quartz = SiO 2, dolomite = CaMg(CO 3) 2, anhydrite = CaSO 4, portlandite = Ca(OH) 2, calcite = CaCO 3 Ohio State University Extension Fact Sheet (ANR-20-05) entitled "Gypsum for Agricultural Use in Ohio-Sources and Quality of Available Products" lists some sources and properties of gypsum available in Ohio. This information is probably typical of that found in many places and is presented as an example of material that may be in your area. Please note that the descriptions in table 1 have been edited by Spectrum to clarify the description of the materials.
132 Material Synthetic gypsum Natural gypsum Table 2. Physical properties and price (as of 12/2004) of gypsum. Water content 1 % Particle size Price $/ton Insoluble residue 2 % 5.55 (3.04) μm (0.2) 0.38 (0.48) NA (8.1) Cast gypsum (0.21) NA NA 0.2 Drywall gypsum 1 Dried overnight at 60 degrees Celsius (12.8) < 0.5 inch (0.3) 2 Following dissolution for three days at ph < 3. 3 Standard deviation included in parentheses. 4 Material is not yet available for sale for agricultural application. NA = not available Measure Table 3. Selected macro- and micronutrient 1 concentrations in the gypsum samples. Unit s Museum specime n 2 Calcium % 22.6 Magnesiu m % 0.01 Sulfur % 18.6 Boron ppm < 13.1 Iron ppm < 1 Mangane se Phosphor us Synthet ic gypsum 23.0 (0.0) (0.01) 18.7 (0.1) 26.7 (8.7) 264 (129) ppm (2.3) ppm (9.4) Natur al gypsu m 19.1 (2.2) 1.35 (0.30) 15.1 (1.2) 9.4 (0.9) 1045 (148) 14.6 (2.9) 30.6 (7.6) Cast gypsu m 22.4 (0.0) 0.05 (0.00) 19.3 (0.2) 0.4 (0.4) 44 (7) 9.1 (0.0) 7.5 (0.3) 1 Micronutrient data obtained by EPA method 3050 (USEPA, 1996). 2 The museum specimen is included as a pure sample of gypsum. 3 Calculated content in a 100% pure product. 4 Standard deviation included in parentheses. Drywa ll gypsu m 21.9 (0.2) 0.22 (0.01) 18.1 (0.3) 7.3 (4.5) 547 (92) 9.4 (1.6) 51.6 (3.5) Ideal analysi s
133 Table 4. Trace metal content 1 of gypsum from different sources compared with U.S. EPA Part 503 pollutant concentration limits for excellent quality biosolids. Pollutant (ppm = mg kg -1 ) Museum specimen Arsenic < 0.52 Synthetic gypsum 0.56 (0.05) 3 Natural gypsum Cast gypsum < 0.52 < 0.52 Drywall gypsum 0.98 (0.11) Part 503 Table 3 2 Cadmium < 0.48 < 0.48 < 0.48 < 0.48 < Chromium (0.85) Cobalt < 0.48 < 0.48 Copper < (0.66) Lead < (.30) 1.38 (0.32) 0.53 (0.04) 1.33 (0.30) 2.92 (0.30) 0.07 (0.00) 1.09 (0.09) < 0.48 < 0.48 NR (0.21) 0.57 (0.08) 0.95 (0.14) 0.70 (0.02) Mercury < 0.26? < 0.26 < 0.26 < 0.26 < Molybdenum < 0.24 Nickel < 0.24 Selenium < 1.45 Zinc < (0.26) 0.73 (0.18) 5.51 (3.47) 3.88 (2.78) 1.28 (0.04) 1.42 (0.23) < 0.24 < < 0.24 < 1.45 < (0.49) 1 Data obtained by EPA method 3050 (USEPA, 1996). < (0.12) 1.85 (0.04) 3.08 (0.45) 2 Part 503-Standards for the Use or Disposal of Sewage Sludge; , Table 3. (USEPA, 1993). 3 Standard deviation included in parentheses. 4 NR = not regulated. 5 Ceiling concentration limit for molybdenum is 75 ppm; , Table 1. (USEPA, 1993)
134 "Claimed" Uses for Gypsum As a soil amendment, gypsum has the following proven benefits. Correcting the damaging effects of high soil sodium (Na) A source of readily plant-available Ca A source of readily plant-available SO 4-S Increase the ph of highly acid subsoils Reducing Al toxicity of highly acid subsoil Possible benefits by lessening the severity of soil surface crusting Gypsum can reduce ammonia volatilization from urea and UAN fertilizers These are the only demonstrated benefits derived from applying gypsum. Misconceptions about Gypsum There is a lot of confusion and misrepresentation about the benefits of gypsum for soils and plants. The following list is in response to the most common misconceptions. Gypsum will not correct the most common type of soil compaction High quality gypsum will not change the soil ph, although contaminants in some byproduct gypsum may have some effect (raising or lowering ph) on soils. Gypsum will not "de-toxify" most soil problems. Gypsum Effects on Soil Compaction Typically, there are three types of soil compaction that prompt growers to ask about using gypsum. They are Relatively deep and thick layers of compacted soil caused by mechanical compaction of clay-based soils 2. Surface crusting 3. Loss of soil structure caused by high sodium (Na) levels in the soil 1. One of the most common misconceptions is that gypsum will help reduce mechanical soil compaction in clay soils that are not damaged by excess Na (sodic soils). There is no research data to support the claim that gypsum has any significant effect on reducing mechanical soil compaction. The belief that gypsum will reduce soil compaction probably comes from its effect on crusting and sodic soils. It needs to be understood that both soil crusting is caused by a different process than mechanical compaction and that compaction caused by sodic soils is extremely rare in the vast majority of fields in this country. Nearly all compaction affecting farms is caused by production practices that mechanically compact the soil, not by a chemical process. Mechanical compaction is caused by field operations performed when the land was too wet and/or improper implement selection. It can only be corrected through proper soil management practices, such as deep tillage, not working the field when it is too wet, proper equipment selection, and others.
135 Table 5. Application of Flue-Gas Scrubber Desulfurization Sludge (Gypsum) Wynoose silt loam (F. Thicke, Ph.D. Thesis, 1988, Univ. Illinois} Product Rate 3-yr Corn Yield 4-yr Soybean Yield Soil ph 3- yr Exchangeable 1-yr Ca Mg 1 yr Bulk Density lb/a bu/a bu/a ppm ppm g/cu. cm , , , , Significant S S NS S S NS Material applied spring 1984, moldboard plow incorporation. Newton, IL 2. Soil crusting forms when the clay in the surface layer of soil becomes dispersed in water, then settles to form a thin, layer of interlocking clay particles on the soil surface. As this layer of deposited clay dries, it hardens and forms a barrier between the soil and the air. Such a crust can significantly reduce the water infiltration rate as well as the exchange of gasses with the atmosphere. This type of soil crust can increase erosion as well as degrade the growing conditions for the crop. As the thickness and strength of the crust increases, it may reach a point at which it physically inhibits seedling emergence. Several researchers have found that increasing the Ca saturation of the surface layer of the soil can reduce the possibility of crust formation as well as the damage caused by crust formation. The benefit of increasing the Ca saturation of the surface soil appears to be more important in soils with a high Mg content. Finely ground gypsum can be effective, at least in the short term, in reducing soil crusting in such soils when applied in the appropriate manner. It is recommended that gypsum applied to prevent or reduce soil crusting be surface applied and not incorporated. North Carolina State University recommends rates between 500 to 2,000 lb. of gypsum per acre for this purpose. Remember, soil crusting is not the same thing as mechanical soil compaction. Different processes are at work in the two problems and the fact that gypsum helps to alleviate crusting does not mean that it will improve compacted soils. Also, we found no data that compared the relative effectiveness of gypsum with mechanical cultivation to break soil crust. The effect of raindrop impact on bare soil is one of the factors that increase soil crusting in susceptible soil types. Therefore, the proper management of crop residues to shield the soil from raindrop impact is recommended as part of the soil management system. 3. Gypsum has long been recognized as being effective at improving the soil structure in sodic soils. When soil contains enough excess Na, the soil is unable to form aggregates. The result is similar to crusting, only it involves the entire topsoil layer, not just a fraction of an inch on the surface. Very few fields east of the dryer parts of the Great Plains have sodic soils that might benefit from gypsum. We find some in small areas around old oil wells where large volumes of salt water were pumped out onto the surface of the soil. Some years ago, researchers found that if they applied large amounts of gypsum (1-10 tons/acre) followed by large amounts of irrigation water, the excess Ca from the gypsum displaces the Na in the soil and the excess water leaches the displaced Na below the root zone of the planned crop. This permits a crop to be grown successfully on that land. Of course, the excess Ca will also displace other nutrient cations such as K and Mg, so the fertility program would need to be adjusted to compensate for this loss of nutrients. From this you can see that if a soil does
136 not have excess Na there is no mechanism for gypsum to provide relief from this source of compaction. Gypsum Effects On Soil ph This topic can get a little confusing due to the chemistry and causes of soil acidity, and the different ways in which lime and gypsum react in the soil. The short answer is that pure gypsum will not affect the ph of the topsoil when surface applied or incorporated by typical methods. However, gypsum is able to offset some of the toxic effects of extremely acid subsoil, in some soil types. Gypsum may even increase the ph of those subsoils to some degree. These seemingly contradictory statements can be explained by the differences in the chemistry between lime and gypsum, plus the somewhat unique nature of most acid subsoils. Some people think that gypsum will increase soil ph. This belief is apparently based on fact that gypsum contains a significant amount of Ca. Without getting too deeply into the chemistry of lime, a short description of how lime works will help to illustrate why gypsum will not neutralize soil acid. Typical agricultural lime is primarily composed of calcium carbonate (CaCO 3) and magnesium carbonate (MgCO 3). The principle acid-neutralizing power of agricultural lime is caused by the carbonate (CO 3) in both the calcium carbonate (CaCO 3) and magnesium carbonate (MgCO 3), not so much by the Ca nor Mg. Both lime minerals work in the same way to neutralize acid. Soil acid is defined as the hydrogen ion (H + ) content of the soil. To neutralize this acid, any soil amendment must either convert the H + into another non-acidic form of H or cause the minerals which generate the H + to stop or slow that process. Carbonates act directly upon the H + by causing it to combine with carbon dioxide (CO 2) to form water (see illustration). Since gypsum does not change the form of soil H + there is no change in soil ph. The beneficial effect of gypsum on some acid subsoil occurs by a different type of chemistry. If acid neutralizing power were the only consideration, then lime would be the material of choice to neutralize acid subsoils. The problem with lime is that it is not very mobile in the soil. Therefore, in order to neutralize acid subsoils in any reasonable amount of time, the lime must be physically mixed into the subsoil. This is not something that most farmers can accomplish. Gypsum can affect subsoil acidity in a shorter time frame because it is much more mobile in the soil and can be leached into the subsoil by irrigation or rainfall. In extremely acid subsoils (ph 5.0 and lower) excess soluble aluminum (Al +++ ) is the main problem. Excess soluble Al is toxic to plants. The primary damage from excess Al +++ is the death of the root growing points or root pruning. The non-toxic calcium ion (Ca ++ ) generated by gypsum is a competitive with Al +++. When the Ca ++ from the gypsum reaches the subsoil, it causes some of the Al +++ to be leached into greater soil depths (assuming enough water
137 passes through the subsoil). The more Ca ++ that leaches through the subsoil, the more Al +++ is leached. The same benefit would occur in the topsoil if it were at the same ph. However, in this case, we can use lime in which we get the benefits of acid neutralization plus the effects of Ca and Mg. Neither the lime nor the gypsum is an instant solution to excess Al +++. Depending on the nature and particle size of lime, it could require up to 18 months for the lime to completely react and neutralize acid topsoil. Gypsums effects on subsoil can take less time, depending on how fast it can be leached through the subsoil. Gypsum as a Nutrient Source Because gypsum is highly soluble, it is an excellent source of Ca and S, especially for acidloving crops and ornamentals, plus a few crops that are especially responsive to either Ca or S for reasons other than soil ph. Acid soils are by nature low in Ca. Where additional Ca is needed, gypsum is an ideal source for these crops. Potatoes are often grown in acid soil to control common scab. In these conditions, gypsum can improve tuber quality. Commercial Christmas tree producers have greatly improved the quality of their acid-loving species with applications of gypsum. Blueberry producers have also found gypsum to be benefit with that acid-requiring crop. The list of acid-loving ornamentals is much too long to include here, but any of these plants are likely to benefit from additional Ca that does not increase the soil ph. While peanuts do not require acid soils, they are very responsive to applied Ca as gypsum. Calculating Gypsum Requirement to Reduce soil Na and to build Soil Ca. These two uses for gypsum require somewhat more complicated calculations in order to determine the appropriate rate of application. Reducing soil Na levels is by far the more complicated process and the following is only a superficial discussion of correcting this problem. A much more in-depth discussion is presented in Spectrum Analytics paper entitled "A Guide to Interpreting Irrigation Water Analysis", which can be found in the Library at spectrumanalytic.com. Reducing Soil Sodium 1. Reducing Na to a "generally acceptable" level: The following formula is published by North Carolina State University. Lb. gypsum/acre = C.E.C. (%Na sat. - 5) Reducing Na to a particular saturation percent: The following calculation may be used when there is a specific percent Na saturation target to be achieved. Example (Assumptions): Soil CEC = 20; Na % saturation = 40%; Na % saturation goal = 10% Gypsum = 80% efficient at displacing excess soil Na Calculations: (Present % Na - Goal % Na ) = 30% 30% of 20 CEC, which is = 6 meq. of Na
138 6 meq. of Na 0.85 Tons of gypsum per meq. of Na = 5.1 Tons gypsum/a (at 100% efficiency) 5.1 Tons/a at 80% efficiency, which is 5.1 Tons/a 0.80 = 6.38 Tons gypsum/acre final requirement 3. Calculating gypsum to offset Na in irrigation water: (see "A Guide to Interpreting Irrigation Water Analysis" for an explanation of RSC) Gypsum requirements can be calculated from the residual sodium carbonate (RSC) value of the irrigation water from the following equation. RSC 234 = pounds of gypsum required to offset the excess sodium in 1 acre foot (325,852 gallons) of irrigation water Remember, gypsum alone does not solve a high Na problem, you must apply adequate irrigation water (or wait for enough rainfall) to leach the displaced Na out of the root zone. Increasing Soil Ca Saturation This calculation is to simply increase the soil Ca to some desired percent Ca saturation through the use of gypsum. The formula was published by North Carolina State University. Lb. gypsum/acre = C.E.C. (desired %Ca sat. - present %Ca sat) 18 The Myth of an Ideal Calcium to Magnesium Ratio Gypsum is sometimes recommended in order to adjust the soil Ca:Mg ratio to some desired value. The previous formula designed by N.C. State Univ. to Increase the soil Ca saturation could be used to achieve this goal. However, The idea that there is some "ideal" soil Ca:Mg ratio is a myth, and not worth pursuing. Competition between Ca and Mg for uptake by crops has become a perennial topic of discussion in agriculture. Generally, the discussion centers on the claim by some that there is an "ideal" soil Ca/Mg ratio that should be achieved through fertilization. Often times, the ideal Ca:Mg ratio is somewhere between 5:1 and 8:1. Some of the claimed benefits of this ideal soil Ca:Mg ratio include Improved soil structure. Reduced weed populations, especially foxtail and quackgrass, plus improved forage quality. Reduced leaching of other plant nutrients. Generally improved balance of most soil nutrients. The first publication of an ideal Ca/Mg ratio probably came from New Jersey in This early work recommended a "total" Ca to "total" Mg ratio in the soil of about 5/4. As we know today, the "total" soil content of CA, Mg, or any nutrient has little relationship to its availability or uptake by crops. It also has literally nothing to do with the general fertility of the soil.
139 In a 1945, a publication by Bear, again in New Jersey, suggested that an example of an ideal soil was one that had the following saturations of exchangeable cations 65% Ca, 10% Mg, 5% K, and 20% H. The cation ratios resulting from these idealizes concentrations are a Ca:Mg of 6.5:1, Ca:K of 13:1, and Mg:K of 2:1 (or a K:Mg or 0.5:1). It appears that since this time, these ratios have been seized upon by some people as the "ideal" ratios, rather than examples of good ratios. Since these published figures, we have seen that many top yields of many different crops have been produced in soils with cation nutrient ratios much different than those first published. Also, a significant amount of research has looked at the question of nutrient ratios and almost no results have supported the claim of some "ideal" ratio. Fertile soils commonly have a Ca:Mg ratio between 5:1 and 8:1. However, this does not mean that the specific Ca:Mg ratio is required, best, or even related to yield. Research results show that this ratio can be as narrow as 2:1 or as wide as 11:1 without negative effects, assuming that there is an adequate amount of each nutrient in the soil. In the mid-1980's the University of Wisconsin conducted research into the effect of Ca:Mg ratio on alfalfa growth. They found that while the Ca:Mg ratio in the plant tended to reflect the soil Ca:Mg ratio, the plant content of these nutrients was affected much less and in no case did the soil or plant ratio affect yield. In this work the plant Ca and Mg contents were never below the respective critical levels for each nutrient, even though the soil Ca:Mg ratios ranged from 2.28:1 to 8.44:1. They concluded that, assuming there are adequate levels of Ca and Mg present in the soil, variations in the Ca:Mg ratio over the range of 2:1 up to 8:1 have no effect on yield. In 1999 the University of Missouri, Delta Research Center published the results of an investigation into the effects of soil Ca:Mg ratio on cotton. They amended plots with gypsum or epsom salts to create soil Ca:Mg ratios between 3.8:1 and 11.7:1. They found that cotton yields were not significantly different between treatments. McLean, et al in Ohio, could find no specific cation ratios that predicted sufficiency or shortages of K, Mg, or Ca in several crops (Table 1). Notice that for all crops the Ca:Mg ratios of both the high and low yielding groups have essentially the same ranges. There is no trend or bias in the relationships between the Ca:Mg ratio and the relative yields of any crop. This indicates that the soil Ca:Mg ratio had little or no effect on yield and the researchers concluded the same. Table 1 Cation Ratio Yield Group Ranges of Soil Ca/Mg Ratio Ca/Mg Corn Soybeans Wheat Alfalfa High Low The obvious conclusion is that crop yields are not significantly affected by the soil Ca/Mg ratio as long as both nutrients are present in adequate amounts. According to Dr. Stanley Barber, the noted soil scientist at Purdue Univeersity, "There is no research justification for the added expense of obtaining a definite Ca:Mg ratio in the soilresearch indicates that plant yield or quality is not appreciably affected over a wide range of Ca:Mg ratios in the soil."
140 The Role of Gypsum in "De-Toxifying" Soils Gypsum is sometimes recommended based on the ability of soluble Ca to counteract the effects of toxic levels of micronutrients and heavy metals in the soil. There is a significant amount of evidence that soluble Ca can in fact be beneficial in counteracting these problems. However, the practical and economic benefits of this chemistry to most growers are doubtful for the following reasons. Land with toxic levels of these metals, are extremely rare. Where the land is highly polluted, much more drastic remedies are required. Research on problems shows that where gypsum provides some benefit, it is relatively small. Nearly all toxicities found in farm soils or landscapes are related to extremely acid soils. Lime is the proper solution to those problems. Some of the more common micronutrient toxicity questions are addressed in the following sections. Boron Toxicity: Like the misunderstandings about gypsums role in soil compaction, its role in alleviating B toxicity appears to be related to its use in reclaiming sodic soils. It is not uncommon for areas with high Na soils and irrigation water, to also have high levels of B in both the soil and water. In these areas, some or much of the B occurs in the form of easily soluble sodium metaborate. Applications of gypsum have been shown to convert much of the sodium metaborate to the much less soluble calcium metaborate. Where the dominant form of soil B is not sodium metaborate, which included most Midwestern and Eastern soils, the beneficial effects of gypsum for reducing excess soil B may be limited. Another factor that may have increased the reputation of gypsum in alleviating B toxicity is the role of soil ph in reducing B availability. It is well known that a high soil ph (> 7.2) can greatly reduce the availability of soil B. Since the most common cause of high ph is excess applications or soil content of calcium carbonate (lime), the role of Ca might get confused with the separate role of ph. Having said this, it is commonly accepted that there is a relationship between Ca and B in both soils and plant physiology. Clemson University has reported that "The relationship between boron and several other nutrients has been established. Calcium, potassium, and nitrogen can affect boron nutrition. The calcium-boron relationship is the most important. Soils high in calcium will require more boron. Lower rates of boron will be required for soils low in calcium, and chances of boron toxicity are greater." Based on this statement, if the chances of B toxicity are greater in low Ca soils, then it would seem logical that high soil Ca should reduce the chances of B toxicity. We were unable to find research results that proved the ability of gypsum to prevent or correct B toxicity to crops. It appears that in the event of an accidental application of excess B fertilizer, an emergency application of gypsum may offer a small chance of some benefit to the crop. However, it should not be expected to perform miracles. Copper: In preparing information for this paper, we ran across several claims of gypsum being instrumental in reducing the negative effects of excess soil Cu. After an extensive literature search on this subject, we found only one reference to this claim. In Reference 10 a list of recorded interactions of Cu with other elements in plant tissues listed the following reference... "Ca was shown to reduce Cu uptake in nutrient solution culture in lettuce". A
141 second reference to the effects of Ca on Cu uptake by a crop said... "Increasing Ca in solution culture improved reduced growth due to Cu toxicity in mungbean". The most common recommendation for amending soils exhibiting Cu toxicity was to lime the soil to a ph of 6.5 or a little higher. For example, the University of Florida says "diagnosis of copper toxicity can only be treated by liming the field for the next crop". While it is possible that the Ca in high application rates of gypsum may have some beneficial effect on copper contaminated soils, we believe that growers should not expect dramatic improvements, if any at all, from gypsum. Based on these findings we conclude that, if a soil contains toxic levels of Cu, applications of gypsum will have only marginal benefits at best. All known options for alleviating Cu toxicity have significant other negative effects. The best management approach is to avoid contaminating the soil with Cu in the first place. Iron: Direct Fetoxicity is extremely rare, therefore there is little need to apply gypsum to correct a problem that does not exist, regardless of any potentially beneficial effect that gypsum may have. Manganese: Manganese toxicity is virtually always associated with excessively acid soils. The solution to this is to correct the soil ph with lime. Therefore, there is no place for gypsum in this situation. Zinc: Zinc toxicity is also extremely rare in most soils and plant production situations. Therefore, any benefit that gypsum may have on reducing Zn toxicity is a solution to a problem that generally does not exist. One exception to this is in peanut production. Peanuts are exceptionally sensitive to Zn and can develop toxic reactions at soil Zn levels much lower that other plants. However, any benefits that gypsum may have for alleviating Zn toxicity in peanuts is probably already being taken advantage of by peanut growers. Peanuts are very responsive to having abundant amounts of soluble Ca in the soil zone where the nuts are forming. Knowing this, most growers already apply gypsum to each crop to insure a quality crop. Therefore, they are unlikely to gain from higher rates of gypsum. Calcium's Role in Reducing Ammonia Volatilization from Urea and UAN Fertilizers Beginning in the early 1980's Dr. Lloyd Fenn, of Texas A&M University began publishing the results of his research into using soluble calcium additives to reduce ammonia volatilization from urea applied to calcareous soil. It is beyond the scope of this paper to evaluate all of the work done in this area. However, we will give a brief outline of the work. It is well known that surface applying urea to calcareous soil often results in unacceptable N volatilization losses. Doctor Fenn found that including soluble Ca in the N application significantly reduced the amount of N lost in these conditions. Additionally, he found that there were similar, but often smaller, benefits from applications of soluble K and Mg with the urea. Doctor Fenn's work was confirmed by other researchers. In order to be effective, the additional cations (Ca, K, or Mg) that were applied had to be very easily soluble, or already in solution. Most of the work appears to have used calcium chloride as the Ca source. The ratio of the cation to amount of ammonium N was critical to success, plus. The application timing of the cations and N was important as well. Our files on this research did not have any examples where gypsum was used as the Ca source. However, it would seem that if calcium chloride works, high quality gypsum might also work reasonably well under the same conditions and methods. The problem with
142 recommending the practice of using co-applied cations with urea (or other urea containing fertilizers) to reduce N loss is that first you must have a significant N loss to prevent. The benefits of this practice will be limited to the estimated value of the N losses (in nutrient costs and/or yield loss) that were prevented. Conditions where there is little chance of significant N loss include the following. Where urea is applied to cool soils, such as winter wheat topdress Where the urea will be physically incorporated Where urea is likely to be leached into the soil with about inch of rainfall within a short time Where the soil ph is somewhat acid and there is little or no crop residue or other soil cover to prevent the urea granules from good soil contact. Of course the cost of the added cations must also be considered. Some publications suggest that to be effective, the final Ca:N ratio must be about 1:4. However, other investigators found that the required Ca:N ratio needed to be approximately 2:1 for significant effect on N loss. If a 1:4 ratio was effective in most situations, this practice might be economical. However, if the 2:1 ratio is needed, it is hard to see where the benefits will be. Since we can't easily or accurately predict the potential volatilization losses or their effects on yield, nor have researchers been able to give us a reliable Ca:N ratio, we really can't predict the economics of this practice. It is probably instructive to note that this work has been known by agronomists since its first publication and since then few agronomists have found it valuable enough to recommend. A Final Note Many growers will see promotions for gypsum use that emphasize the many beneficial roles that Ca plays in both plants and soils. Most of them are probably true, to one degree or another. However, the fact that these claims may be true does not mean that a grower needs gypsum or any other Ca source. The vast majority of soils contain abundant Ca and applying more will gain nothing for the crop or the grower. Before spending scarce money on inputs based on nothing more that claims, the grower must accurately evaluate his crops needs. This requires the proper use of soil tests, plant analysis, and some time spent evaluating research results and/or on-farm field trials. Scarce input dollars must be spent where there are the greatest chances for the largest returns on investments. In most cases, the best returns will be from the proper use of more conventional, such as lime, fertilizer, seed, etc. References 1. Gypsum for Agricultural Use in Ohio-Sources and Quality of Available Products, Ohio State University Extension Fact Sheet, ANR Effects of Exchangeable Ca:Mg Ratio on Soil Clay Flocculation, Infiltration and Erosion, Katrina Dontsova, L. Darrell Norton, 10 th Int'l Soil Cons. Org. Meeting, 5/24-29, Purdue Univ., 1999
143 3. Gypsum Amendment and Exchangeable Calcium and Magnesium Affecting Phosphorus and Nitrogen in Runoff, N. Favaretto, L.D. Norton, B.C.Jones, and S.M. Brouder, Soil Sci. Soc. Am. J. 70: (2006) 4. Uses of Ground Sheetrock (Gypsum) As A Soil Amendment, Soil Science Notes, No. 1, NC State Univ Infiltration and Erosion in Soils Treated with Dry PAM and Gypsum, Jian Yu, et al, Soil Soc. Am. J. 67: (2003) 6. Boron and Its Role in Crop Production, U.C. Gupta, CRC Press, Trace Elements in Soils and Plants, Alina Kabata-Pendias, CRC Press, Nutrient Management for South Carolina Based on Soil-Test Results, EC 476, Clemson University 9. Plant Tissue Analysis and Interpretation for Vegetable Crops in Florida, G. Hochmuth, et al, University of Florida, Institute of Food and Agricultural Sciences, Hs964, Handbook of Plant Nutrition, A.V. Barker and D.J. Pilbeam editors, CRC Press, Ammonia Loss and Associated Reactions of Urea in Calcareous Soils, L. B. Fenn & S. Miyamoto,, Soil Soc. Am. J. Vol. 45, No. 3, May-June Increased Agricultural Benefits Through Cost Effect Utilization of Urea Fertilizer, MP-1608, Texas A&M University, Improving the Fertilizer Efficiency of Urea ammonium Nitrate Solutions by adding Other Nutrients, G.J. Gascho, Journal of Fertilizer Issues, Vol. 3, No. 2, Pgs April-June 1986

144 SOIL CHEMICAL RESPONSES TO FGD GYPSUM AND THEIR IMPACT ON CROP YIELDS Malcolm E. Sumner Regents Professor Emeritus University of Georgia

145 CHEMICAL REACTIONS OF GYPSUM IN SOILS Aqueous phase Ion pair formation Ion activities in solution Solid phase Cation and anion exchange reactions Mineral dissolution/precipitation reactions Chemical effects in dispersion/flocculation
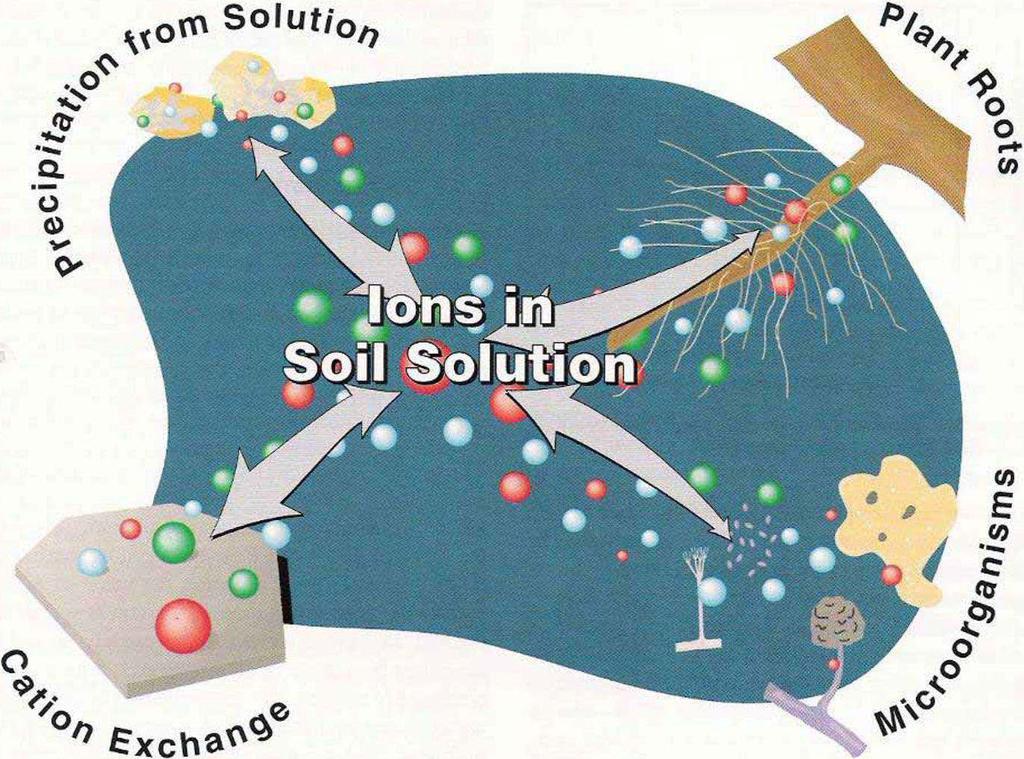
146
147 AQUEOUS PHASE REACTIONS Ion pair formation Soybean tap root length (mm) Al 3+ 3Cl - + CaSO 4.2H 2 O Ca 2+ 2Cl - + AlSO 4 + Cl - Toxic aluminum Gypsum Activity Al Activity Gypsum concentration (um) 260 Soybean tap root length (mm) Al 3 + AlSO Much less toxic AlSO4 + Activity


148 Evidence for Ion Pair Detoxification 1 inch 50 :M Ca 200 :M Al 1250 :M Ca 200 :M Al
149 SOLID PHASE REACTIONS Self-liming Effect (Ligand exchange OH W 2SO 4 ) [Fe,Al](OH) 2 + CaSO 4.2H 2 O [Fe,Al]OHSO 4- ½Ca 2+ + ½Ca(OH) 2 Iron/aluminum hydroxide Gypsum New negative charge On surface Hydrated lime 2Al Ca(OH) 2 2Al(OH) 3 + 3Ca 2+ Toxic aluminum Hydrated lime (Reeve & Sumner, 1972) Gibbsite insoluble ph increases Negative charge increases
150 EFFECT OF GYPSUM ON EXCHANGEABLE Al & Ca Exchangeable Al+H (cmolc/kg) Exch Ca (cmol c /kg) Control 4.5 T Gypsum/ac 10 Control 4.5 T/ac Gypsum Depth (in) 20 Depth (in)
151 Evidence for Self-Liming Effect (Sumner, 1990) I (mol/l) ph CaSO 4 CaCl 2 ph
152 Gypsum Increases Negative Charge (Sousa et al., 1986) Depth (cm) Negative charge (cmol c /kg) Control Gypsum (6t/ha)
153 Responsive Soils Exhibit Salt Sorption Treatment EC GCat sol GCat displ GAn sol GAn displ µs/cm mmol c /L x 10 CaSO 4 soln CaSO 4 + soil
ph (CaSO( 4 CaCl 2 ) Measure EC of 0.")
154 Test for Gypsum Responsive Soils (Sumner, 1994) Measure ph in M CaSO 4 and M CaCl 2 Calculate )ph (CaSO( 4 CaCl 2 ) Measure EC of M CaSO 4 before and after addition of soil Calculate amount of gypsum adsorbed Plot )ph vs gypsum adsorbed
 c,; u LO 0 0 0 0. 75 Q.SQ 0.")

155 u C U :::e LO 0 0,,. 0 "q' 0 V) c,; u LO Q.SQ 0.25 o.oo o O. - 0 cj (!J... il' I..@ l responsive 0 nonr,es-ponsive Gypsum sorbed (ppm)

156 IMPACT ON CROP YIELDS Enhanced Ca levels in soil solution Peanuts Tomatoes Cantalopes Reduced levels of toxic Al Alfalfa & Alfalfa/Bermuda Cotton Soybeans Improved clay flocculation Increased available water Better drainage Reduced subsoil hardpan strength


157 CROP RESPONSES TO GYPSUM Enhanced Soluble Ca Levels in Soils No gypsum Gypsum
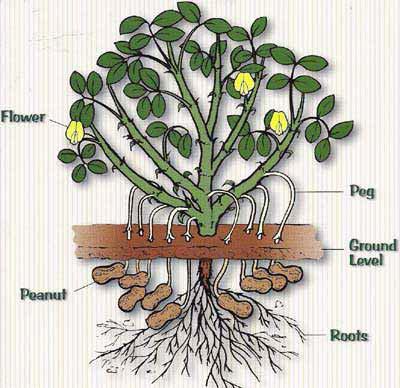
158 PEANUTS

159 PEANUTS Treatment Yield SMK* Value Seed Ca T/ac % $/ac % Control 2.1a 71a T FGD gypsum/ac 2.6b 75b * SMK = Sound mature kernels
160 Summary of Peanut Responses to Gypsum Increased income due to gypsum ($/ac) Total sites = 85 Positive responses = 70 Predicted by NaNO 3 method = 53 Predicted by Mehlich I method =

161 GYPSUM AND TOMATOES Treatment Yield Skin Ca Fruit rejection* T/ac % % Control 26.5a 0.21a 95 5 T FGD gypsum/ha 37.5b 0.34b 15 * After storage for 4 4 o C

162 Effect of Storage at Room Temperature for 4 Weeks

163 GYPSUM AND CANTALOUPES Treatment Yield Wt/fruit Skin Ca Fruit rejection* T/ha kg % % Control 6.71a 2.12a 1.07a T FGD gypsum/ha 10.17b 2.14a 1.24b 15 * After storage for 4 4 o C


164 No Gypsum Fruit Quality after 4 Weeks of 40 o F 0.5 T Gypsum/ac
165 CROP RESPONSES TO GYPSUM 8 Roots pruned High Al and Low Ca Cause Root Pruning
166 CROP RESPONSES TO GYPSUM Reduced Levels of Toxic Al Increased levels of soluble Ca Control Gypsum
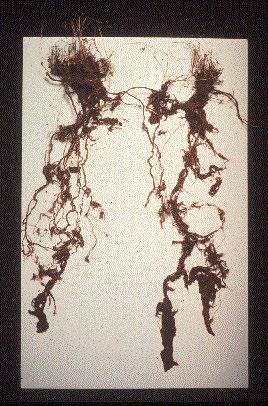
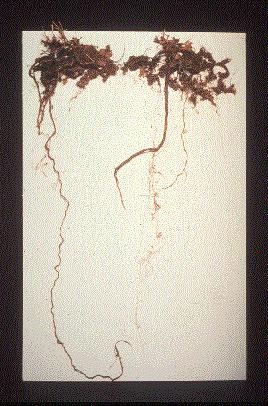
167 Root Development Control Gypsum

168 ALFALFA-BERMUDA Treatment Hay yield (lb/ac) Cut 1 Cut 2 Cut 3 Cut 4 Total Control T Gypsum/ac
169 ALFALFA-BERMUDA ph (KCl) Control Gypsum 10 Depth (in) 20 30
170 ALFALFA-BERMUDA Root weight (lb/ac) a b Depth (in) 20 a a b a Control 4 T Gypsum/ac 30 a a b b
 0 269.50 276.10 55.00 134.20 Cumul. Income ($) -125.00 144.50 420.60 475.60 609.")
171 COTTON RESPONSE TO GYPSUM Treatment Cotton lint yield (lb/ac) Control Gypsum Difference Value ($) Cumul. Income ($)

172 Gypsum Improves Tap Root Penetration

173 SOYBEANS 4.5 T/ac Gypsum No Gypsum

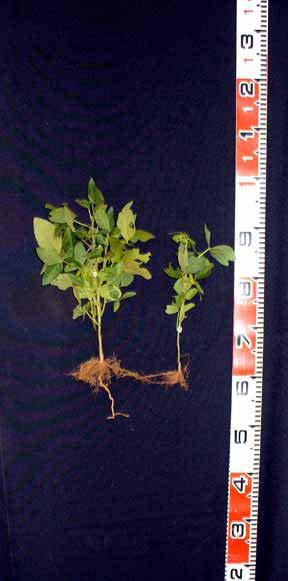
174 Soybeans No Gypsum Gypsum

175 CROP RESPONSES TO GYPSUM Improved Clay Flocculation

176 GYPSUM IMPROVES PERCOLATION No gypsum Gypsum
177 GYPSUM INCREASES INFILTRATION & PERCOLATION RATES IN CLAY SOIL Infiltration rate (mm/hr) Rainfall intensity = 2in/hr Time to ponding Control Treatment Control Gypsum Increased available water for crop 2 T Gypsum/ac Water infiltrated in 20 min in (68%) Steady state Percolation rate Time (min)

178 ROOTS & HARDPAN Hardpan Hardpan
179 GYPSUM SOFTENS SUBSOIL HARDPANS & IMPROVES AGGREGATION Depth (in) Cone index (MPa) T Gypsum/ac Control Stable aggregates (%) Depth in Control Gypsum Mesh size (mm)

180 Gypsum Gypsum CONCLUSIONS Supplies essential elements (Ca & S) to crops Reduces levels of toxic Al in subsoils Promotes clay flocculation Softens subsoil hardpans Improves aggregation Result Crop yields and quality improved No gypsum

181 Thank you for your attention
182 UNIVERSITY OF GEORGIA First Publicly Funded University in the United States


183 Spectrum Analytic, Inc. GUIDE TO INTERPRETING IRRIGATION WATER ANALYSIS Soil Analysis 1087 Jamison Road Plant Analysis PO Box 639 (740) Fertilizer Analysis Washington C.H., Ohio Fax: (740) Manure Analysis
Inherent Factors Affecting Soil ph. Soil ph Management
 Soil ph is a measure of soil acidity or alkalinity. It is an important indicator of soil health. It affects crop yields, crop suitability, plant nutrient availability, and soil micro-organism activity,
Inherent Factors Affecting Soil ph. Soil ph Management
 Soil ph is a measure of soil acidity or alkalinity. It is an important indicator of soil health. It affects crop yields, crop suitability, plant nutrient availability, and soil micro-organism activity
Soil. Acidic soils... 1/19/2014
 Soil Chapter 8 Acidic Soils & Salt Affected Soils Pages 229 262 About 2.5 billion acres of mostly cultivated lands are affected by soil salinity Treating ph problems is less difficult than managing and
Unit D: ph of Soil. Lesson : Identifying the ph Changes in Soil
 Unit D: ph of Soil Lesson : Identifying the ph Changes in Soil 1 KEY TERMS Soil ph Acid Lime Requirement 2 I. The ph scale measures how acidic or basic a substance is. A. It ranges from 0 to 14. 1. A ph
Nebraska Soil Science Curriculum
 Nebraska Soil Science Curriculum Soil ph: What affects it, what it affects, managing it and testing it Approximately 135 minutes ***Content and lab derived from the USDA-NRCS Guides for Educators. Please
Learning Objectives. C. Owen Plank
 www.ugaextension.com C. Owen Plank Extension Agronomist The University of Georgia Learning Objectives Soil components and their relative proportion in soils Texture of a soil & influence of texture on
ANIMAL, PLANT & SOIL SCIENCE D3-2 SOIL CHEMISTRY
 ANIMAL, PLANT & SOIL SCIENCE D3-2 SOIL CHEMISTRY Interest Approach Approach One: Show students different soil samples. Ask what makes one soil better than another. Encourage discussion that focuses on
Soils and Fertilizers. Leo Espinoza Soils Specialist
 Soils and Fertilizers Leo Espinoza Soils Specialist 2004 What is soil? A collection of organic and inorganic bodies on the earth s surface, modified by the surrounding environment or even made by humans,
A PowerPoint has been provided
 Unit D: ph of Soil Lesson 1: Identifying the ph Changes in Soil Student Learning Objectives: Instruction in this lesson should result in the students achieving the following objectives: 1. Identify soil
Soil Science Curriculum
 Soil Science Curriculum Content and lab derived from the USDA-NRCS Guides for Educators. Go to www.nrcs.usda.gov/soils for the Guides and additional pictures and diagrams. This lesson plan was adapted
THE FOREST NURSERY AND ITS SOILS
 THE FOREST NURSERY AND ITS SOILS Dr. Jack May, Professor School of Forestry University of Georgia Forest tree nurseries are located on a variety of soils ranging in texture from sand to silt loam in the
PASTURE AND HAY FIELDS: SOIL FUNDAMENTALS. Sanders County April 8, Clain Jones
 PASTURE AND HAY FIELDS: SOIL FUNDAMENTALS Sanders County April 8, 2015 Clain Jones clainj@montana.edu 994-6076 Objectives Present soil properties and how they interact with plant nutrients Illustrate the
Know Your Soil Getting the Dirt on Your Dirt FWAA. Dr. Steve Petrie Director of Agronomic Services
 Know Your Soil Getting the Dirt on Your Dirt FWAA Dr. Steve Petrie Director of Agronomic Services Crop productivity Genetics Soil Temperature Environ ment Crop Yield Moisture Manage ment Take the time
If your soil has a high salinity content, the plants
 E-60 7-01 Managing Soil Salinity Tony Provin and J.L. Pitt* If your soil has a high salinity content, the plants growing there will not be as vigorous as they would be in normal soils. Seeds will germinate
Sunlight. Chlorophyll
 Plant Nutrition & Soil Fertility Richard Smith Vegetable Crop and Weed Science Farm Advisor University of California Cooperative Extension Monterey, Santa Cruz and San Benito Counties Plant Nutrition 1.
Assessing and Amending Your Garden Soil Craig Cogger, Soil Scientist Emeritus Washington State University Puyallup
 Assessing and Amending Your Garden Soil Craig Cogger, Soil Scientist Emeritus Washington State University Puyallup The soil is the great connector of our lives, the source and destination of all. - Wendell
Title: Lecture 16 Soil Water and Nutrients Speaker: Teresa Koenig Created by: Teresa Koenig, Kim Kidwell. online.wsu.edu
 Title: Lecture 16 Soil Water and Nutrients Speaker: Teresa Koenig Created by: Teresa Koenig, Kim Kidwell online.wsu.edu Photos courtesy of Rich Koenig Photos courtesy of USDA NRCS Soil Water and Nutrients
Understanding the Balance
 Understanding the Balance Soil is the foundation that builds strong crops, plants, roots and turf. Micro Biology in the soil is an absolute must in order to grow anything properly.. The Soil must contain
Nutrient Management And Nutrient Cycling Raymond C. Ward, President Ward Laboratories, Inc Kearney, NE
 Nutrient Management And Nutrient Cycling Raymond C. Ward, President Ward Laboratories, Inc Kearney, NE www.rayward@wardlab.com Take Good Soil Samples to Evaluate Soil Fertility Status Take soils samples
Chapter 2.2. Basic Soil-Plant Interactions. learning objectives
 Basic Soil-Plant Interactions learning objectives Describe the process of cation exchange in soils and its implications for crop nutrition. Briefly explain the importance of soil organic matter for crop
Fertilizers and nutrient management for hops. Diane Brown, Michigan State University Extension
 Fertilizers and nutrient management for hops Diane Brown, Michigan State University Extension Pre plant nutrient management for hops Soil test! Correct major issues before planting ph 6.2 to 6.5 Lime season
SOILS. Sam Angima. OSU Extension Agent Lincoln County, Oregon
 SOILS Sam Angima OSU Extension Agent Lincoln County, Oregon Soils Introduction Definition & Function Soil Physical Properties Soil Chemical Properties Soil Biological Properties Soil Organic Matter Soil
Chapter 8: Soil ph and Lime Management
 Chapter 8: Soil ph and Lime Management Agustin Pagani, John E. Sawyer, and Antonio P. Mallarino / Department of Agronomy, Iowa State University Developed in cooperation with Lara Moody, TFI; John Davis,
Soil is the Key (Chapter 3)
") Soil is the Key (Chapter 3) Soils 101 Soil profile Soil sources, texture, chemistry, physical properties Soil Amendments Identifying your soil Soil Testing Fertilizers Soil Profile Vertical distribution
Soil is the Key (Chapter 3) Soils 101 Soil profile Soil sources, texture, chemistry, physical properties Soil Amendments Identifying your soil Soil Testing Fertilizers Soil Profile Vertical distribution
Soil is. Pieces of rock Minerals Decaying organic matter Water Air Living organisms All mixed together!
 Soil is. Pieces of rock Minerals Decaying organic matter Water Air Living organisms All mixed together! Soil Horizons the layers of soil O-horizon: the surface litter. Mainly black or brown A-horizon:
Soils: Components and basic chemistry
 Soils: Components and basic chemistry Justin Scheiner, Ph.D. Assistant Professor and Extension Viticulture Specialist Components of Soil 25% Water: atmosphere & soil reactions Minerals: decomposition of
Do Now: From which materials do you think soil is made? Are all soils the same? Think of some ways that they are different?
 Do Now: From which materials do you think soil is made? Are all soils the same? Think of some ways that they are different? Basics Soil is a major component of the biosphere It contains solids, liquids
Soils of Oahu. Outline. Soils and Plant Nutrient Supply 2/20/2014
 Soils of Oahu Jonathan Deenik Department of Tropical Plant and Soil Sciences Outline Importance of Soils Soil Diversity on Oahu Soil Properties Diagnosis and soil testing Management for Health Soils and
Anorganic Fertilizer. Lenny Sri Nopriani, SP.MP
 Anorganic Fertilizer Lenny Sri Nopriani, SP.MP Jargon Fertilizer Synthetic Fertilizers can be organic or inorganic Organic: from living material, contains C-C bonds; does not imply organic certification
SOIL SAMPLING AND ANALYSIS
 E AZ1412 ARIZONA COOPERATIVE TENSION College of Agriculture and Life Sciences College of Agriculture and Life Sciences 07/06 SOIL SAMPLING AND ANALYSIS This publication provides information on techniques
GEOL 408/508 INTRODUCTORY SOILS
 GEOL 408/508 INTRODUCTORY SOILS Lecture = 3 hrs/week Lab = 3hrs/week Course = 4 credits Name/Define the Following 1. N 2 2. NH 3 3. NH + 4 4. NO - 2 5. NO - 3 6. protein 7. organics 8. organic matter 9.
The Dirt on Soil Science
 The Dirt on Soil Science Dr. Laura Deeter deeter.7@osu.edu Ohio State ATI 1 Rough Outline Basic Michigan soil history Soil Basics What is soil Soil texture/particles ph Plant nutrients Organic Matter 2
Class 3: Soil Sampling and Testing. Chris Thoreau
 Class 3: Soil Sampling and Testing Chris Thoreau What is Soil Testing? What are We Testing For? Soil Sampling Methodologies Soil Testing Interpreting Soil Test Results What is Soil Testing? Soil testing
A Plant & Soil Ecosystem
 Introductory Study of Soils For the Master Gardeners Wendy Sue Harper, Ph.D. What We Will Cover Tonight Introduction Agroecological perspective to understanding the physical, chemical and biological properties
A Turf and Soil Fertility Product. Better Turf Performance Through Improved Soils.
 A Turf and Soil Fertility Product Better Turf Performance Through Improved Soils. Turf-Gyp+ Promotes Turf and Soil Fertility Turf-Gyp+ provides vital nutrients and is a soil conditioner in one product.
Soil Resources. Soil Horizons
 Soil Resources Soil Uppermost layer of earth s crust that supports plants, animals and microbes Soil Forming Factors Parent Material Time Climate Organisms Topography Soil Composition Mineral Particles
5.1 Introduction to Soil Systems IB ESS Mrs. Page
 5.1 Introduction to Soil Systems IB ESS Mrs. Page 2015-2016 I Am Soil Thinking Routine: See, Think, Wonder Look at the following images. For each image write down what you see Then write down what you
Soil Science Curriculum
 Soil Science Curriculum Content and lab derived from the USDA-NRCS Guides for Educators. Go to www.nrcs.usda.gov/soils for the Guides and additional pictures and diagrams. This lesson plan was adapted
Loam: About 40% sand, 40% silt, 20% clay. Mixture of pore sizes to balance water retention and aeration. Considered the best soil for growing crops.
 Soil Characteristics Soil is formed from a combination of two Primary sources: Weathering of Parent Rock ( ) = material introduced by plants, animals, and decomposers Minor sources: Nutrients incorporated
Pr gyp. A Soil and Plant Fertility Product. Improves Soil Fertility; Promotes Conservation and Sustainable Agriculture
 Pr gyp TM A Soil and Plant Fertility Product Improves Soil Fertility; Promotes Conservation and Sustainable Agriculture Progyp Promotes Soil and Plant Fertility and Sustainable Agriculture Progyp is a
SimpleWater, Inc. Soil, Water, Air Laboratory Sciences 1860 Leroy Ave, Berkeley, CA 94720
 SimpleWater, Inc. Soil, Water, Air Laboratory Sciences 1860 Leroy Ave, Berkeley, CA 94720 Tap Score ID # ABC123 Date Ordered July 21, 2018 Lab ID # H173a Date Received July 29, 2018 Sample ID # NAME -
Factoids on SC soils. Soils. What is Soil? Variability of soils in your yard. Soil Components. Soil Tilth 6/23/14
 Factoids on SC soils Soils Managing Soils Over 100 different soil types Soil type covering largest areas 7.0% Ben Lomond Complex 50-70% slope 5.6% Lompoc Felton Complex 50-75% slope 5.8% Lompoc Felton
Soils and Fertilizers Chapter 2. Sherry Kern Virginia Beach Master Gardener Tree Steward
 Soils and Fertilizers Chapter 2 Sherry Kern Virginia Beach Master Gardener Tree Steward Soil It s Not Dirt! outer, weathered superficial layer of the earth s crust physical, chemical, and biological factors
Farmers need to develop an understanding
 Fact Sheet 782 Basics of Soil and Plant Fertility Farmers need to develop an understanding of the basics of soil physiology and the factors that affect plant fertility. Not only is this knowledge essential
Soil Chemistry. Key Terms.
 Soil Chemistry Key Terms Key Terms in Soil Chemistry Buffering capacity - this is the soil's ability to resist changes in soil ph. Soils with a high buffering capacity require a great deal of amendment
HORT 102: Soil Properties. Cultivated Plants: Lecture 15. [Teresa Koenig] Slide #: 1 Slide Title: Intro Information Slide
![HORT 102: Soil Properties. Cultivated Plants: Lecture 15. [Teresa Koenig] Slide #: 1 Slide Title: Intro Information Slide](/thumbs/76/74082590.jpg "HORT 102: Soil Properties. Cultivated Plants: Lecture 15. [Teresa Koenig] Slide #: 1 Slide Title: Intro Information Slide") HORT 102: Soil Properties Cultivated Plants: Lecture 15 [Teresa Koenig] Slide #: 1 Slide Title: Intro Information Slide Title: Lecture 15 Soil Properties Speaker: Teresa Koenig Created by: Teresa Koenig,
HORT 102: Soil Properties Cultivated Plants: Lecture 15 [Teresa Koenig] Slide #: 1 Slide Title: Intro Information Slide Title: Lecture 15 Soil Properties Speaker: Teresa Koenig Created by: Teresa Koenig,
Soils and Fertilizer
 Soils and Fertilizer Objectives Discuss soil components, texture, chemistry Consider relationships between soil, water, plants and air Steps to prevent soil compaction and salt accumulation Identify common
Sandy, low CEC, irrigated soil Acidic ph High ph Cold soils Soil low in P content or available P
 Nutrient Nitrogen (N) Phosphorus (P) Potassium (K) Plant Response to Nutrient Influences color, shoot, shoot density, root, rhizome and stolon, high temperature stress, cold tolerance, drought resistance,
Restoration of Degraded Soils
 Restoration of Degraded Soils Saline Soils Electrical Conductivity (EC) 4dS m -1 Sodic Soils EC
General Training. A Healthy Foundation for Plant Growth. Physical. 700 different soils in Wisconsin. Chemical. Biological
 Healthy Soil = Healthy Plants General Training Take care of your soil and with a little help from you it will take care of your plants. A Healthy Foundation for Plant Growth Your Soil Soil is Complex 700
CMG GardenNotes #222 Soil ph
 CMG GardenNotes #222 Soil ph Outline: Soil ph, page 1 ph and nutrient availability, page 2 Managing alkaline soils, page 2 Lowering the ph, page 2 Raising the ph on acid soils, page 3 Home ph test kits,
1. The Nature of Soils and Soil Fertility
 1. The Nature of Soils and Soil Fertility The Ontario Soil Fertility Handbook contains information on the fundamental concepts of soil fertility. If you have ever wondered how nutrients make their way
Soil & Fertilizer. Pam Brown, Extension Agent Emeritus, Gardening Coach
 Soil & Fertilizer Pam Brown, Extension Agent Emeritus, Gardening Coach pamperedgardeners@gmail.com www.pamperedgardeners.com What do Plants Need? Temperature Water Nutrients Air Soil Soil Amendments Fertilizer
Soil ph is probably the most outstanding
 Is Reducing Soil ph Possible? QUICK TIP Fire ants, like all insects, require moisture. During hot and dry weather, fire ants will burrow deeper into the soil making control more difficult. Insecticide
Soil is formed by various processes and originates from parent material.
 Soils and sediments usually contain organic matter from decayed vegetation. A majority of the organic matter is humic substances. o Humic substances are naturally formed from the decomposition of vegetation.
Puricare s approach to Brackish Water Irrigation and Saline Soils
 Puricare s approach to Brackish Water Irrigation and Saline Soils During dry summer months many farmers experience serious problems with the increased salinity of irrigation water due to more intensive
Crop Management Practices. By Simon Bedasie
 Crop Management Practices Fertigation By Simon Bedasie Observations of a Visiting Consultant Water and fertilizer management looked like bucket chemistry. Very basic techniques for water and fertilizer
Understanding Your Virginia Soil Test Report
 Understanding Your Virginia Soil Test Report By Gil Medeiros, Fairfax Master Gardener Don t guess; soil test! As master gardeners, we frequently exhort gardeners to do the test, but we are not so helpful
Fertility Management of Cotton
 1 of 6 6/14/2010 11:36 AM University of Missouri Extension G4256, New March 1993 Fertility Management of Cotton David W. Albers State Extension Specialist-Cotton Delta Center Steve Hefner Research Associate
Unit 5: Soil - Stages of Soil formation
 Biology Form 3 Page 68 Ms. R. Buttigieg Unit 5: Soil - Stages of Soil formation Soil is the layer of material covering parts of the land, the home of many organisms and the area from which land plants
Soils and plant nutrients
 Soils and plant nutrients Soils and soil texture Soil texture triangle Plant nutrients Major nutrients Secondary nutrients Minor nutrients Exchange Capacity (CEC) Soil ph Soils Consists of a series of
Soils of Palau. Diversity and Fertility. Palau Livestock Management Workshop March 23-25, Jonathan Deenik, PhD University of Hawaii
 Soils of Palau Diversity and Fertility Jonathan Deenik, PhD University of Hawaii Palau Livestock Management Workshop March 23-25, 2011 Outline Plant nutrition Soil fertility Soil composition Texture and
Monitoring Nutrition for Crops
 Monitoring Nutrition for Crops Electrical conductivity ph Alkalinity Cation exchange and Anion exchange capacities Krishna Nemali, Ph.D. Why should you monitor nutrients for plants? $$ Nutrient deficiencies
Getting the Most out of Your Strawberry Soil Test Report. General Information
 gardening.cornell.edu Getting the Most out of Your Strawberry Soil Test Report 1. Be certain your soil ph is in the optimal range. 2. Add a nitrogen (N) source at the recommended rate and time. 3. Add
4/23/2018. Soil John Wiley & Sons, Inc. All rights reserved. Lecture 14
 Lecture 14 Soil Lecture 14 1. The Soil System 2. Soil Properties and Major Soil Types 3. Environmental Problems Related to Soil 4. Soil Conservation and Regeneration 1 The Soil System Soil Uppermost layer
Concepts in Soil Fertility Jonathan Deenik Assistant Specialist, Soil Fertility Department of Tropical Plant and Soil Sciences
 Soils of Hamakua Concepts in Soil Fertility Jonathan Deenik Assistant Specialist, Soil Fertility Department of Tropical Plant and Soil Sciences Outline Importance of Soils Concepts in Soil Fertiltiy -
Soil test recommendations
 Continuedbelow extractants have been developed, each with their own unique advantages and disadvantages (i.e. Bray, Olsen, Mehlich III, Morgan, Modified Morgan, Sodium bicarbonate); no extractant is perfect.
Fertilizers. TheBasics. Whats in a Fertilizer? Why use Fertilizer? Nitrogen (N) Nitrogen (N) Its on the Label! Other sources of Nitrogen
 Nitrogen (N) Its on the Label! Other sources of Nitrogen") Why use Fertilizer? Fertilizers TheBasics Expectations Want the Golf Course look. Helps in recovery from stress. Mowing, Heat, and Activities. New Hybrids of grass seed perform better than the older varieties,
Why use Fertilizer? Fertilizers TheBasics Expectations Want the Golf Course look. Helps in recovery from stress. Mowing, Heat, and Activities. New Hybrids of grass seed perform better than the older varieties,
Introduction to Environmental Science. Soil Characteristics. Chapter 11 Soil
 Chapter 11 Soil Soil Characteristics It s more than dirt Most soils are 100s of years old Weathering breaks down parent rock Soil Separates (particle types) Sand (largest) Silt Clay (smallest) Plants contribute
For nmental. Written By: Agustin o, Professor. Developed in. and justice for all. Department of. funded by activities. )
") Site-Specificc Nutrient Management For Nutrient Management Planning To Improve Crop Production, Environ nmental Quality, and Economic Return Presentationn Script: Potassium - Chapter 4 Written By: Agustin
Site-Specificc Nutrient Management For Nutrient Management Planning To Improve Crop Production, Environ nmental Quality, and Economic Return Presentationn Script: Potassium - Chapter 4 Written By: Agustin
Management of Sodic Soils in Alberta
 June 2010 Agdex 518-20 Management of Sodic Soils in Alberta The two main types of salt-affected soils found in Alberta are soils and sodic soils. Saline soils are soils with a high enough concentration
Soil Quality / Understanding Soil Health what are we missing?
 Soil Quality / Understanding Soil Health what are we missing? Soil Quality Test Kit Clarence Chavez Soil Scientist The USDA is an Equal Opportunity Provider and Employer Soils are not machines: It s an
SOIL TESTS. Circular of Information 587 Revised September 1963 Agricultural Experiment Station, Oregon State University, Corvallis
 SOIL TESTS Circular of Information 587 Revised September 1963 Agricultural Experiment Station, Oregon State University, Corvallis Interpretation of Soil Tests L. A. ALBAN, Associate Professor of Soils
Eco new farmers. Module 2 Soil and Nutrient Cycling. Section 1 Soils and soil fertility
 Eco new farmers Module 2 Soil and Nutrient Cycling Section 1 Soils and soil fertility Module 2 Soil and Nutrient Cycling Section 1 - Soils and soil fertility www.econewfarmers.eu 1. Introduction You will
The comfortable, sunny climate and numerous
 EC 1585-E September 2006 Acidifying Soil in Landscapes and Gardens East of the Cascades K. Locke, D. Horneck, J. Hart, and R. Stevens The comfortable, sunny climate and numerous recreational activities
Chapter 15 Soil Resources
 Chapter 15 Soil Resources Overview of Chapter 15 What is Soil? Soil Horizons Nutrient Cycling Soil Properties and Major Soil Types Soil Problems Soil Conservation and Regeneration Soil Uppermost layer
Nutrient Management of Irrigated Alfalfa and Timothy
 Nutrient Management of Irrigated Alfalfa and Timothy Irrigated Crop Production Conf. Lethbridge, AB Jan 19, 2016 Ross H. McKenzie Old Agronomist Lethbridge Introduction Alfalfa and Timothy are excellent
Soil Management: the basis of sustainable agriculture
 Soil Management: the basis of sustainable agriculture FAB-465 Lecture 11 Lecture Outline Soil Formation Soil Structure/Texture Indicators of Soil Health or Fertility Soil Conservation Practices 1 Soil
Overview of Chapter 14
 14 Soil Resources Overview of Chapter 14 The Soil System Soil Properties and Major Soil Types Environmental Problems Related to Soil Soil Conservation and Regeneration Soil Uppermost layer of earth s crust
Using Fertilizers: Feeding plants. Lydia Clayton UAF Cooperative Extension Service Kenai Peninsula District
 Using Fertilizers: Feeding plants Lydia Clayton UAF Cooperative Extension Service Kenai Peninsula District What to know before you grow? Proper fertilization is essential for: Disease control Weed control
Fertility and Crop Nutrition Jonathan Deenik Assistant Specialist, Soil Fertility Department of Tropical Plant and Soil Sciences
 Soils of Molokai Fertility and Crop Nutrition Jonathan Deenik Assistant Specialist, Soil Fertility Department of Tropical Plant and Soil Sciences Outline Importance of Soils Soils of Molokai Fertility
BASIC SOIL SCIENCE RICHARD A. WEISMILLER MARYLAND MASTER GARDENERS FEBRUARY 24, 2016
 BASIC SOIL SCIENCE MARYLAND MASTER GARDENERS FEBRUARY 24, 2016 RICHARD A. WEISMILLER PROFESSOR EMERITUS, UMCP DEPARTMENT OF ENVIRONMENTAL SCIENCE AND TECHNOLOGY SOIL OR DIRT WHATEVER!!!! SOIL SAY WHAT?
Soil compaction Soil Colour
 Soil compaction Soil compaction is defined as the method of mechanically increasing the density of soil. In construction, this is a significant part of the building process. If performed improperly, settlement
DIRT! APES Laboratory Activity
 Name: Part I: Soil Texture DIRT! APES Laboratory Activity Can one determine the texture of soil by examining the particles found in a particular sample? The purpose of this activity is to determine the
Vine Nutrition. A g e n d a 4/10/2017. Soil How to sample Sample submission sheet Lab analysis & results Interpretation
 A g e n d a 4/10/2017 Chris Clark, CCA Territory Sales Representative Vine Nutrition a major role in the life of a vineyard! Haily Henderson, CCA NMP/GPS Specialist & Agronomist Soil How to sample Sample
Soil: We Can t Grow without it!
 Outline Soil: We Can t Grow without it! Clay Robinson PhD, CPSS, CCA Associate Professor of Soils Illinois State University Which nutrients do plants need? Fertilizers: Which and how much? Nutrients and
This page intentionally left blank
 This page intentionally left blank The Nature and Properties of Soils, Global Edition Table of Contents Cover Title Page Copyright Page Contents Preface 1 The Soils Around Us 1.1 What Ecosystem Services
The Exciting World Beneath Our Feet.
 SOIL The Exciting World Beneath Our Feet. Physical properties of soil Texture Structure Particle density Bulk density Pore space Water relations Plasticity Soil tilth is the term used in publications aimed
G A Gardener's Guide for Soil and Nutrient Management in Growing Vegetables
 University of Nebraska - Lincoln DigitalCommons@University of Nebraska - Lincoln Historical Materials from University of Nebraska- Lincoln Extension Extension 1990 G90-945 A Gardener's Guide for Soil and
HEALTHY SOILS LANDHOLDER SERIES PROPERTY PLANNING GUIDE CHARACTERISTICS OF A HEALTHY SOIL LANDHOLDER SERIES - PROPERTY PLANNING GUIDE HEALTHY SOILS
 LANDHOLDER SERIES PROPERTY PLANNING GUIDE Soil health refers to the condition of the soil and its potential to sustain biological functioning, maintain environmental quality, and promote plant and animal
The Nature of Soil Soil Conservation Sustainable Ag.
 Chapter 6 & 7 The Nature of Soil Soil Conservation Sustainable Ag. Climate Soil Forming Factors Parent material Organisms Topography Time Value of Soil Soil is under appreciated Condition of soil affects
Definitions in Handbook
 HORT325: Soils & Fertilizers Soil Composition Soil Texture/Structure & Water Capacity Soil ph & Nutrient Availability Fertilizers Soil Testing Definitions in Handbook Soil Structure Soil Porosity Pore
EARTH SCIENCE CONCEPTS -Geologic time scale
 EARTH SCIENCE CONCEPTS -Geologic time scale -Plate Tectonics -Earthquakes *result of vibrations (often due to plate movement) deep in the Earth that release energy *often occur at transform boundaries
Soil Nutrient Management
 31 st May 2016 Soil Nutrient Management Christopher Johns Research Manager Northern Australia and Land Care Key Points The most basic components of soil are minerals, organic matter, water and air. Mineral
B. Land capability subclass - DELETED Determine Land Capability Subclass according to the following rules. Mark all subclasses that apply.
 1 Indiana Soils: Evaluation and Conservation (ID-72, 7/01; rev8/08) Summary of rule changes D. P. Franzmeier and G. C. Steinhardt The changes in rules and the reasons for making them are summarized here.
Statement of Purpose. What s New in 2014? Highlights of Changes in This Edition. Weed Management. Disease Management.
 Statement of Purpose The management practices, products, and cultivars discussed in this publication are the research- and experience-based recommendations of the institutions associated with the contributing
Soil Health and Fertilizer. Pam Brown, Extension Agent Emeritus, Gardening Coach
 Soil Health and Fertilizer Pam Brown, Extension Agent Emeritus, Gardening Coach pamperedgardeners@gmail.com www.pamperedgardeners.com What is Soil : Weathered rock, formed from a slow and sequential set
Plant Nutrition & Fertilizers WMAMG 1/31/17
 Plant Nutrition & Fertilizers WMAMG 1/31/17 By Dawn Pettinelli UConn Soil Nutrient Analysis Lab dawn.pettinelli@uconn.edu SOIL-PLANT SYSTEM From: Extension.org Relationships between plants & soils evolved
STEP BY STEP SITE ANALYSIS PROCEDURES FOR DEVELOPING A NATIVE LANDSCAPE PLAN
 STEP BY STEP SITE ANALYSIS PROCEDURES FOR DEVELOPING A NATIVE LANDSCAPE PLAN Neil Diboll Prairie Nursery P.O. Box 306 Westfield, WI 53964 800-476-9453 www.prairienursery.com Introduction Prior to planting
Saline and Sodic Field Demonstration project
 Saline and Sodic Field Demonstration project 2007-2013 Tile drainage will help decrease the soluble salt level over time but does not address parts of the field that have sodium issues as well. Reclamation