2016 OVERVIEW AND OUTLOOK 01. March 9,
|
|
|
- Sharon Hoover
- 6 years ago
- Views:
Transcription


1 March 9,
2 2016 OVERVIEW AND OUTLOOK 01 March 9,
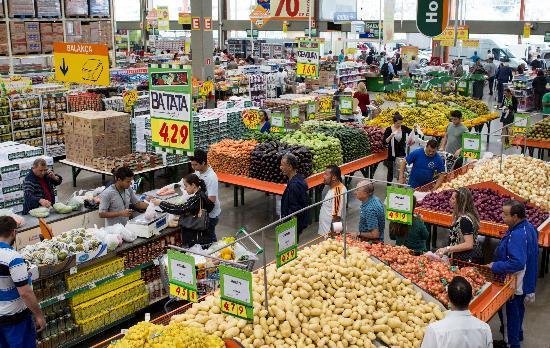
3 Carrefour, the reference in food retail OVERVIEW & OUTLOOK March 9,
4 A balanced portfolio Integrated countries Countries in partnership OVERVIEW & OUTLOOK March 9,
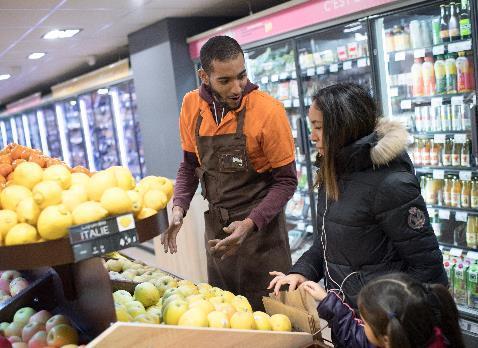
5 Carrefour: The reference in food retail Quality accessible to all Unique knowhow in fresh produce Pioneer in organic food and Quality Lines Powerful exclusive brands Sourcing expertise Food represents 83% of the Group sales in 2016 (growth of over 4% in 2016) OVERVIEW & OUTLOOK March 9,
6 CSR is at the heart of Carrefour s know-how Fight wastage Biodiversity Partnerships Food Climate Energy Packaging Waste Agroecology Sustainable fishing Sustainable forestry Beekeeping Diversity SMEs and Producers Nutrition/Health Solidarity Included in the Dow Jones Sustainability Index Europe in 2016 Present in the DJSI Europe, Stoxx Global ESG, FTSE4Good, Ethibel OVERVIEW & OUTLOOK March 9,


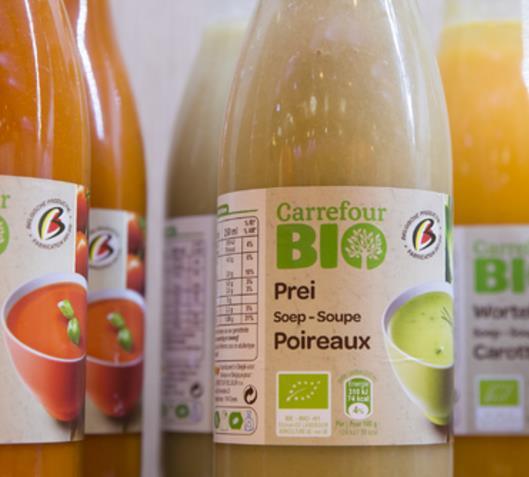
7 Carrefour, pioneer in organic products ROLL-OUT OF ORGANIC FOOD AREAS IN STORE DEVELOPMENT OF OFFER ACQUISITION OF GREENWEEZ ORGANIC FOOD SALES IN 2016: +32% 3,000 ORGANIC FOOD SKUs OF WHICH MORE THAN 800 UNDER PRIVATE LABELS PROGRAM TO ACCELERATE ORGANIC FARMING PARTNERSHIPS WITH 300 FARMS BY 2020 LEADING ONLINE ORGANIC FOOD RETAILER OVERVIEW & OUTLOOK March 9,


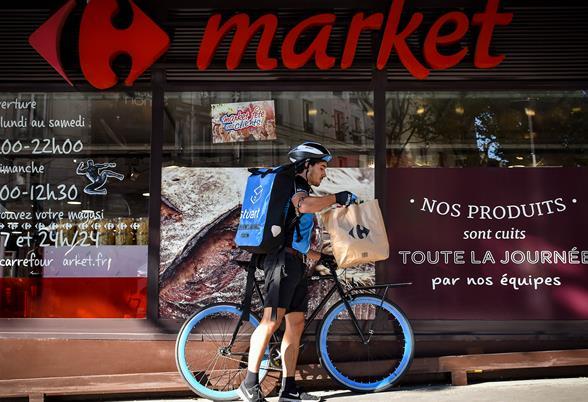
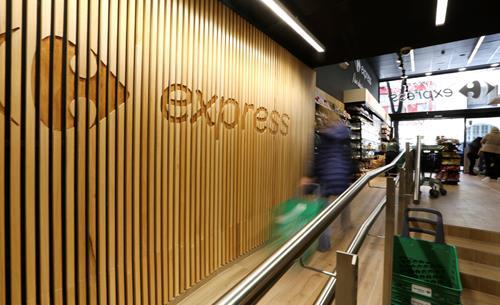
8 A multiformat Group: Everyone under one roof to First hypermarket Promodès Atacadão Acceleration in convenience Billa, Dia, Eroski Rue du Commerce OVERVIEW & OUTLOOK March 9,
9 The center of gravity is shifting towards convenience BREAKDOWN OF STORES UNDER BANNERS BY FORMAT GROSS SALES BREAKDOWN (%) 9,995 stores ,935 stores 305 1,328 14,500 stores ,700 Evolution 2012 vs. 2019e +100% +6% +24% 42% 49% >50% 1,366 3,227 2,986 5,479 7,075 9, % 58% 51% <50% e e Hypermarkets Other formats Convenience Supermarkets Hypermarkets Cash & Carry OVERVIEW & OUTLOOK March 9,
10 Multiformat accelerates growth EXAMPLES GAIN new clients +20% market share gain in Italy over 2 years CONVERT existing clients to multiformat 1.8x A Carrefour multiformat client spends 1.8x more than an exclusively hypermarket client* *Study on a panel in France in H OVERVIEW & OUTLOOK March 9,


11 E-commerce, an additional format HYPERMARKETS SUPERMARKETS CASH & CARRY CONVENIENCE E-COMMERCE Selected banners OVERVIEW & OUTLOOK March 9,


12 Rapid roll-out of e-commerce ALL COUNTRIES HAVE AN ONLINE OFFER TARGETED ACQUISITIONS FRANCE SPAIN ITALY BELGIUM POLAND ROMANIA ARGENTINA BRAZIL CHINA TAIWAN Food e-commerce in progress in progress Non-food e-commerce in progress Marketplace in progress in progress in progress Click & Collect OVERVIEW & OUTLOOK March 9,
13 2020 e-commerce prospects GROSS MERCHANDISE VOLUME 1.2bn in bn 2020 target Target x OVERVIEW & OUTLOOK March 9,
14 Omnichannel reinforces multiformat Increase in average basket +20% +10% Growth of traffic Gain new clients Hypermarket Hypermarket + Drive Hypermarket Hypermarket + Click & Collect Rejuvenate client base A CLIENT WHO ADOPTS DRIVE OR CLICK & COLLECT SPENDS MORE Source : 2016 study based on a panel in France and Spain OVERVIEW & OUTLOOK March 9,


15 Omnichannel multiplies contacts and enriches data LOYALTY AND MEANS OF PAYMENT ENHANCE CUSTOMER KNOWLEDGE 13 million clients per day 55 million households are loyalty cardholders 6.5 million active PASS cards OVERVIEW & OUTLOOK March 9,


16 Non-food and services dynamized by omnichannel A differentiated assortment Powerful exclusive labels E-commerce: A complementary and additional offer 3 countries have a Marketplace 6 countries by end million SKUs Services rolled out online OVERVIEW & OUTLOOK March 9,
17 Carrefour, a culture of innovation Formats Concepts Experiment Iterate Deploy Products Services OVERVIEW & OUTLOOK March 9,


18 Differentiated formats SUPECO: C&C FORMAT INSPIRED BY ATACADÃO AND ROLLED OUT IN 4 COUNTRIES TO DATE FRANCE: MARKET ST MARCEL ITALIE: CLUSTERIZATION GOURMET URBAN ATTRACTION OVERVIEW & OUTLOOK March 9,


19 Innovative concepts ITALY: TERRE D ITALIA RESTAURANT FRANCE: BULK WALL SPAIN: NEW LAYOUT FOR APPLIANCES FRANCE: ORGANIC FOOD AREA SPAIN: NEW FMCG LAYOUT BELGIUM: BEER CELLAR OVERVIEW & OUTLOOK March 9,


20 Products that make a difference FRESH PRODUCE: REAL KNOW-HOW REFLETS DE FRANCE: 600 SKUs ORGANIC FOOD SALES:+32% IN CARREFOUR BIO SKUs VEGGIE: THE 1 ST VEGETARIAN PRIVATE LABEL «REPACKAGING» OF OWN BRAND TEX: 22% MARKET SHARE IN HYPERS & SUPERS OVERVIEW & OUTLOOK March 9,


21 Services that facilitate daily life FINANCIAL SERVICES FRANCE: LAUNDROMAT IN-STORE POST OFFICE CORNER BELGIUM: BRINGR FRANCE: LIVRAISONEXPRESS.FR OVERVIEW & OUTLOOK March 9,


22 A new collaborative and agile spirit of innovation 2 HACKATHONS in participants 15 projects 6+ incubations France PIKIT Connected object allowing to shop online from home Innovation team dedicated to identifying innovative startups. OptiMiam: Fight against food waste Cargo Creation of a dedicated real estate company for logistics OVERVIEW & OUTLOOK March 9,
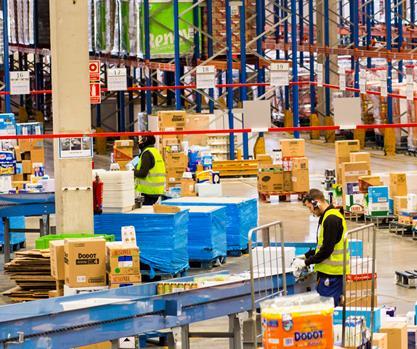
23 Operational efficiency is a priority (1/2) EXAMPLE OF CHINA: INTEGRATION AND OPTIMIZATION OF LOGISTICS BEIJING/TIANJIN DC 40 stores December 2015 % of goods supplied by our distribution centers: 2017 target: 80% WUHAN DC 35 stores October 2015 CHENGDU DC 42 stores May 2015 SHENYANG DC 30 stores July 2016 KUNSHAN DC 60 stores July 2014 GUANGZHOU DC 31 stores May 2016 Increase in assortment: in small- and mid-sized cities starting in % Development of convenience and e- commerce formats OVERVIEW & OUTLOOK March 9,
24 Operational efficiency is a priority (2/2) EXAMPLE OF FRANCE: REINFORCED NETWORK OF MULTIFORMAT WAREHOUSES 2018 CARAVELLE TARGETS* From 67 to 55 warehouses in France of which 34 are multiformat Number of Km -20% Cost of package -5% Product availability +2% *2018 targets versus OVERVIEW & OUTLOOK March 9,
25 CSR contributes to operational efficiency Energy Energy consumption reduced by -9.3% in 2016 Reducing wastage Reduce food waste by 50% by 2025 CSR: Doing our job well Training New skills: data scientists, innovation, job training Biodiversity Increase sales of products from Quality Lines and organic farming every year OVERVIEW & OUTLOOK March 9,
26 A model strongly focused on value-creation OVERVIEW & OUTLOOK March 9,
27 Decrease in capex and evolving mix as of 2017 BREAKDOWN OF CAPEX BY NATURE 2016 (ex Cargo) 21% 18% 29% 2.5bn 32% Remodeling Maintenance MEDIUM-TERM TRENDS Remodeling Maintenance Expansion IT & Omnichannel 2017 CAPEX 2.4bn NORMATIVE CAPEX 2.3bn to 2.5bn Expansion IT & Omnichannel 01. PRÉSENTATION DE 01. L ANNÉE 2016 OVERVIEW 2016 & PERSPECTIVES & OUTLOOK March 9 mars 9,
28 Value-creation drivers Solid generation of operating cash flow linked to improved results Disciplined Capex between 2.3bn and 2.5bn per year ( 2.4bn in 2017), with strict Return on Investment criteria and an evolution in the mix Control of Working Capital Requirements Balanced capital allocation, combining continued targeted acquisitions, 45-50% payout *, maintaining a BBB+ rating *of the adjusted net income, Group share OVERVIEW & OUTLOOK March 9,
29 Financial outlook 2017 & medium-term Total sales growth of 3% to 5% at constant exchange rates in 2017 Planned IPOs of Carmila and Brazilian operations in 2017, market conditions permitting Continued increase in Free Cash Flow, with a new increase in 2017 Capex decrease in 2017 to 2.4bn, and normative capex between 2.3bn and 2.5bn Continued tactical acquisitions Payout of between 45% and 50% of adjusted net income, Group share OVERVIEW & OUTLOOK March 9,
30 2016 FINANCIAL RESULTS 02 March 9,
31 2016 key figures NET SALES EBITDA MARGIN (2) RECURRING OPERATING INCOME ADJUSTED NET INCOME, GROUP SHARE FREE CASH FLOW EX. EXCEPTIONAL ITEMS NET DEBT 76,645m 5.1% 2,351m 1,031m 1,039m 4,531m up a a margin of or up an improvement of +2.7% (1) Stable margin 3.1% 1.39 /per share +9.2% 15m (1) At constant exchange rates (2) EBITDA: Recurring operating income before depreciation and amortization (including supply chain depreciation) 02. FULL-YEAR 2016 RESULTS March 9,
32 Organic growth of 3.0% in SALES EVOLUTION (in m and %) 76.9 bn +3.0% 0.0% +3.0% 79.2 bn -0.5% +0.2% +2.7% % bn -3.1% 76.6 bn 2015 net sales LFL ex petrol ex calendar Scope effect organic net sales ex petrol ex calendar Petrol & calendar effect Acquisitions/ disposals 2016 net sales at constant exch. rates Currencies impact 2016 net sales (1) Scope effect includes store openings/closings and temporary store closures 02. FULL-YEAR 2016 RESULTS March 9,
33 Further sales growth ORGANIC SALES GROWTH EVOLUTION EX PETROL TO 2016 (in %) +3.9% +3.0% +3.0% CAGR % +1.0% +2.3% FULL-YEAR 2016 RESULTS March 9,
34 Gross margin from recurring operations held up well GROSS MARGIN FROM RECURRING OPERATIONS +3.5% at constant exch. rates , (in m) 18,019 GROSS MARGIN FROM RECURRING OPERATIONS +10bp % 2015 (as a % of net sales) 23.4% 02. FULL-YEAR 2016 RESULTS March 9,
35 Good control of operating costs OPERATING COSTS +4.9% at constant exch. rates ,125 (in m) ,070 OPERATING COSTS +10bp % (as a % of net sales, ex. petrol) % 02. FULL-YEAR 2016 RESULTS March 9,
36 Stable asset costs as a percentage of sales ASSET COSTS +2.8% at constant exch. rates ,509 (in m) ,505 ASSET COSTS Stable % (as a % of net sales, ex. petrol) % 02. FULL-YEAR 2016 RESULTS March 9,
37 France: ROI reflecting investments to prepare for the future NET SALES 35,877m LFL (1) +0.3% ROI 1,031m MARGIN 2.9% (1) ex. petrol, ex. calendar 02. FULL-YEAR 2016 RESULTS March 9,
38 Other European countries: Strong increase in profitability NET SALES 20,085m LFL (1) +2.0% ROI 712m MARGIN 3.5% +70 bps % at constant exch. rates (1) ex. petrol, ex. calendar 02. FULL-YEAR 2016 RESULTS March 9,
39 Latin America: Continued strong momentum, driven by Brazil NET SALES 14,507m LFL (1) +13.5% ROI 711m MARGIN 4.9% Stable + 3.7% at constant exch. rates (1) ex. petrol, ex. calendar 02. FULL-YEAR 2016 RESULTS March 9,
40 Asia: Continued transformation in China and further growth in Taiwan NET SALES 6,176m LFL (1) -5.0% ROI (58)m MARGIN -0.9% (1) ex. petrol, ex. calendar 02. FULL-YEAR 2016 RESULTS March 9,
41 Adjusted net income, Group share (in m) EBITDA (1) 3,955 3,886 (in m) Net income from continuing operations 1, Recurring operating income 2,445 2,351 Net income from associates and JVs Non-recurring income Minority share of net income from continuing operations Net income from continuing operations, Group share EBIT 2,232 1,943 Net financial expenses Net interest expense Other net financial expenses Net income from discontinued operations, Group share 4-40 Net income, Group share Adjusted net income, Group share 1,113 1,031 Income before taxes 1,717 1,428 Income tax expense Effective tax rate 34.8% 34.6% Notes : (1) Recurring operating income before depreciation and amortization (including supply chain depreciation) 02. FULL-YEAR 2016 RESULTS March 9,
42 2016 Free cash flow (in m) Gross cash flow 2,733 2,964 Change in working capital Discontinued activities 3-11 Operating cash flow 2,818 3,305 Capital expenditure (ex. Cargo) -2,378-2,492 Net capital expenditure (Cargo) Change in net payables to fixed asset suppliers Asset disposals (business-related) Discontued operations 7 - Free cash flow Impact of Cargo Impact of exceptional items Free cash flow from continuing operations, excluding exceptional items 951 1, FULL-YEAR 2016 RESULTS March 9,
43 Slight drop in net debt (in m) Opening net debt (December 31) -4, Free cash flow Acquisitions Disposals Others Discontinued operations 0 16 Cash flow after acquisitions and disposals Dividends paid by parent company Dividends paid to non-controlling interests Capital increase Cost of net financial debt Disposal of treasury shares Acquisitions/disposals of investments without change in control Other changes in net borrowings Closing net debt (December 31) -4,546-4, FULL-YEAR 2016 RESULTS March 9,
44 Credit rating and debt maturity maintained DEBT REDEMPTION SCHEDULE (in %) 2.44% 5.25% 1.75% 4.00% 3.88% 1.75% 0.75% 1.25% On April 26, 2016, issua issuance of a 750m bond with a maturity of 8 years and a 0.75% coupon 1,250 1,000 1,000 1,000 1, In 2016, 667m of bonds reached maturity 279 At end 2016, the debt maturity was 4.1 years Credit rating maintainted: BBB issuance Average annual coupon 02. FULL-YEAR 2016 RESULTS March 9, 9,
45 Stable proposed dividend: 0.70 per share Dividend of 0,70 proposed to the General Shareholders meeting on June 15, 2017 Payout of 51% of adjusted net income, Group share, in line with our distribution policy Payment in shares or in cash 02. FULL-YEAR 2016 RESULTS March 9,
46 APPENDIX March 9,
47 2016 income statement (in m) Net sales 76,945 76,645 Net sales, net of loyalty program costs 76,393 76,054 Other revenue 2,464 2,720 Total revenue 78,857 78,774 Cost of good sold -60,838-60,789 Gross margin from recurring operations 18,019 17,985 SG&A -14,105-14,147 Recurring operating income before D&A (EBITDA) (1) 3,955 3,886 Depreciation and amortization -1,470-1,487 Recurring operating income (ROI) 2,445 2,351 Recurring operating income (ROI) including income from associates and joint ventures 2,489 2,315 Non recurring income and expenses EBIT 2,232 1,943 Financial expense Income tax expense Minority interests Net income from continuing operations, Group share Net income from discontinued operations, Group share 4-40 Net income, Group share Adjusted net income, Group share 1,113 1,031 Note : (1) Recurring operating income before depreciation and amortization (including supply chain depreciation) APPENDIX March 9,
48 2016 net sales and recurring operating income by region NET SALES RECURRING OPERATING INCOME (in m) Organic growth ex petrol ex calendar Variation at current exch. rates Variation at constant exch. rates Variation at current exch. rates France 36,272 35, % -1.1% 1,191 1, % -13.4% Other European countries 19,724 20, % +1.8% % +25.5% Europe 55,996 55, % -0.1% 1,758 1, % -0.9% Latin America 14,290 14, % +1.5% % +0.9% Asia 6,659 6, % -7.3% n/a n/a Emerging markets 20,949 20, % -1.3% % -9.0% Global functions n/a n/a TOTAL 76,945 76, % -0.4% 2,445 2, % -3.8% APPENDIX March 9,
49 Adjusted net income, Groupe share (in m) Net income from continuing operations, Group share Restatement for non-recurring income and expenses (before tax) Restatement for exceptional items in net financial expenses Tax impact (1) Restatement on share of income from minorities and companies consolidated by the equity method Adjusted net income, Group share 1,113 1,031 Note : (1) Tax impact of restated items (from non-recurring income and expenses and financial expenses) and non-recurring tax items APPENDIX March 9,
50 Earnings per share ( per share) Net income from continuing operations Net income from discontinued operations 0.00 (0.05) Net income, Group share Adjusted net income, Group share Weighted average number of shares pre-dilution (in millions) (1) Note : (1) Non significant dilutive impact in 2016 APPENDIX March 9,
51 Stores under banners 1 at end 2016 (#) Hypermarkets Supermarkets Convenience Cash & Carry Total France 243 1,062 4, ,670 Spain Belgium Italy ,068 Poland Romania Others Other European countries 439 1,777 2, ,541 Argentina Brazil Latin America China Taiwan Others Asia Others (2) Total 1,462 3,227 7, ,935 Notes : (1) including franchisees and partners; (2) Maghreb, Middle East and Dominican Republic APPENDIX March 9,
52 2016 gross sales Gross sales (in m) Change at current exch. rates inc. petrol Change at constant exch. rates inc. petrol Change at constant exch. rates ex. petrol LFL inc. petrol LFL ex. petrol ex. calendar Organic growth ex. petrol ex. calendar France 40, % -1.2% -0.5% -0.1% +0.3% -0.9% Hypermarkets 20, % -2.6% -1.7% -2.3% -1.5% -1.8% Supermarkets 12, % -0.9% +1.9% +0.4% +2.6% -0.3% Others, inc. convenience 6, % +3.2% -1.2% +7.9% +1.8% +0.8% International 45, % +6.1% +6.3% +4.8% +4.9% +6.0% Other European countries 22, % +1.9% +2.3% +1.6% +2.0% +1.8% Spain 8, % +1.2% +2.1% +1.3% +2.3% +2.2% Italy 5, % -1.0% -0.6% +1.8% +2.1% +0.9% Belgium 4, % +0.6% +0.6% +0.5% +0.3% +0.3% Latin America 16, % +16.6% +16.8% +13.4% +13.5% +16.7% Brazil 12, % +15.0% +15.1% +10.9% +11.0% +15.1% Asia 6, % -4.1% -4.1% -4.8% -5.0% -4.3% China 5, % -7.2% -7.2% -7.6% -7.8% -7.4% Group total 85, % +2.7% +3.3% +2.6% +3.0% +3.0% APPENDIX March 9,
53 2016 capex breakdown 2016 CAPEX BREAKDOWN OF CAPEX BY NATURE BREAKDOWN OF CAPEX BY REGION 2,492m (ex Cargo) 21% 18% 32% 29% 21% 25% 7% 6% 41% Remodelling Maintenance France DIA Europe Expansion IT & omnichannel Latin America Asia APPENDIX March 9,


54 Hypermarkets: The format for routine shopping needs With low prices all year round, in-store animations and promotions 1,328 stores ranging from 2,400 m² to 23,000 m² Banner : stores in France stores in other European countries 182 stores in Latin America 374 stores in Asia 90 stores in other countries APPENDIX March 9, 9,


55 Supermarkets: Choice close to home 3,227 stores ranging from 1,000m² to 3,500 m² Banners: 1,062 stores in France 1,777 stores in other European countries 168 stores in Latin America 38 stores in Asia 182 stores in other countries APPENDIX March 9, 9,

56 Convenience: Essential daily products Catering to daily shopping needs with extended shopping hours 7,075 stores ranging from 200 m² to 900 m² 4,222 stores in France Banners: 2,312 stores in other European countries 468 stores in Latin America 27 stores in Asia 46 stores in other countries APPENDIX March 9, 9,


57 Cash & Carry: Wholesale prices and customized services 305 stores Banners: 143 stores in France 13 stores in other European countries 134 stores in Latin America 2 stores in Asia 13 stores in other countries APPENDIX March 9, 9,
58 Disclaimer This presentation contains both historical and forward-looking statements. These forward-looking statements are based on Carrefour management's current views and assumptions. Such statements are not guarantees of future performance of the Group. Actual results or performances may differ materially from those in such forward-looking statements as a result of a number of risks and uncertainties, including but not limited to the risks described in the documents filed with the Autorité des Marchés Financiers as part of the regulated information disclosure requirements and available on Carrefour's website ( and in particular the Annual Report (Document de Référence). These documents are also available in the English language on the company's website. Investors may obtain a copy of these documents from Carrefour free of charge. Carrefour does not assume any obligation to update or revise any of these forward-looking statements in the future.
CARREFOUR INVESTOR PRESENTATION. May May
 CARREFOUR May 2017 May 2017 1 Carrefour s Multiformat & Omnichannel model CARREFOUR: THE REFERENCE IN FOOD RETAIL Quality accessible to all Unique knowhow in fresh produce Pioneer in organic food and Quality
Q Sales October 17 th 2018
 Q3 Sales October 17 th Q3 Highlights Acceleration in sales growth: +2.1% LFL Strong momentum in the roll-out of the Carrefour 2022 transformation plan Better momentum in France, driven by an improved commercial
CONTINUED SALES GROWTH IN THE SECOND QUARTER OF % in the quarter and +6.2% in the half
 CONTINUED SALES GROWTH IN THE SECOND QUARTER OF 2017 +6.1% in the quarter and +6.2% in the half Reported sales growth of +6.1% in Q2, reflecting a good like-for-like performance and expansion o Continued
FURTHER SALES GROWTH IN Q1 2017: +6.2% to 21.3bn CONTINUED PROGRESSION IN FOOD SALES
 FURTHER SALES GROWTH IN Q1 2017: +6.2% to 21.3bn CONTINUED PROGRESSION IN FOOD SALES Sharp increase in sales in the first quarter of 2017, reflecting the relevance of Carrefour s multiformat model and
FIRST QUARTER 2016 SALES: 20.1bn GOOD START TO THE YEAR, ACCELERATING GROWTH IN INTERNATIONAL MARKETS
 FIRST QUARTER 2016 SALES: 20.1bn GOOD START TO THE YEAR, ACCELERATING GROWTH IN INTERNATIONAL MARKETS REPORTED GROWTH OF +3.8% EX PETROL, +3.1% LIKE-FOR-LIKE International: Reported growth of +6.4% ex
STRONG ORGANIC SALES GROWTH: +4.9% IN Q Second quarter 2014 consolidated sales inc. VAT
 STRONG ORGANIC SALES GROWTH: +4.9% IN Q2 2014 Second quarter 2014 consolidated sales: 20.5bn, a strong +4.9% increase on an organic basis Europe : good performance, with organic growth of +1.9% o France:
Solid sales growth in Q3 2013: +2.7% at constant exchange rates Further sales growth in France Continued growth in Latin America and China
 Solid sales growth in Q3 2013: +2.7% at constant exchange rates Further sales growth in France Continued growth in Latin America and China Q3 2013: Solid sales growth, + 2.7% at constant exchange rates
Stable sales excluding petrol (at constant exchange rates) Q sales inc. VAT: 22.7bn
 Q sales inc. VAT: 22.7bn") Q1 2009 sales incl. VAT 16 April 2009 Stable sales excluding petrol (at constant exchange rates) Q1 2009 sales inc. VAT: 22.7bn o Q1 2009 sales including VAT: 22.7bn, 1.4% at constant exchange rates o
Q1 2009 sales incl. VAT 16 April 2009 Stable sales excluding petrol (at constant exchange rates) Q1 2009 sales inc. VAT: 22.7bn o Q1 2009 sales including VAT: 22.7bn, 1.4% at constant exchange rates o
Q Sales inc. VAT 11 October 2012
 Q3 2012 sales (inc. VAT): +2.1% to 22.6 bn Continued growth in emerging markets, notably Latin America, better quarter in France 9-month 2012 sales (inc. VAT) up 1.3% to 66.3 bn Q3 2012 sales: 22.6 bn,
Solid sales growth in Q (+1.9% LFL) Powerful transformation dynamic launched in 2018
 Powerful transformation dynamic launched in 2018") Solid sales growth in Q4 2018 (+1.9% LFL) Powerful transformation dynamic launched in 2018 Solid sales growth in the fourth quarter of 2018 o Group sales up +1.9% on a like-for-like basis, vs +1.1% over
Solid sales growth in Q4 2018 (+1.9% LFL) Powerful transformation dynamic launched in 2018 Solid sales growth in the fourth quarter of 2018 o Group sales up +1.9% on a like-for-like basis, vs +1.1% over
Q Sales inc. VAT 12 July 2012
 H1 2012 sales (inc. VAT) up 0.9% to 43.7 bn Q2 2012 sales (inc. VAT) down 0.3% at 21.7 bn Sustained growth in emerging markets, stabilization of sales trends in France and Europe H1 2012 sales: 43.7 bn,
AGENDA. Introduction Our strategy What was done so far
 1 AGENDA Introduction Our strategy What was done so far Focus on Brazil Implementing our strategy Becoming the preferred retailer in all our formats Improving our organization and operating model Being
Sales growth in the second quarter of 1.3% at constant exchange rates Sales growth in France ex. calendar impact Growth in Latin America and China
 Sales growth in the second quarter of 1.3% at constant exchange Sales growth in France impact Growth in Latin America and China Q2 2013 consolidated sales inc. VAT: 20.5bn, up 1.3% at constant exchange
CARREFOUR 2022 : A NEW AMBITION FOR THE GROUP
 CARREFOUR 2022 : A NEW AMBITION FOR THE GROUP Carrefour Group is presenting today its transformation plan, "Carrefour 2022", and adapting its model and organization to be the world leader of the food transition
Carrefour Q sales up 1.5% to 22.5bn Resilience in food, continued weakness in non food spending
 Carrefour Q1 2012 sales up 1.5% to 22.5bn Resilience in food, continued weakness in non food spending Q1 2012 sales (inc. VAT) of 22.5bn, +0.9%*, (+1.5% including petrol and at current exchange rates)
ScS Group Plc Interim Results For The 26 Weeks Ended 24 January 2015 March 2015
 ScS Group Plc Interim Results For The 26 Weeks Ended 24 January 2015 March 2015 October 2014 H1 2015 Highlights Financial Highlights: Like for like sales order intake up 7.8% Flooring up 13.0% Total sales
Institutional Presentation June, 2018
 Institutional Presentation June, 2018 THE LEADER IN BRAZILIAN RETAIL: OVERVIEW NATIONWIDE PRESENCE Multiformat and omnichannel platform 150 (3) Atacadão stores Hyper Convenience Drugstores 11% 23 Atacadão
Following is a presentation that is to be given at the Macquarie Australia Conference in Sydney today, Wednesday, 2 May 2018.
 2 May 218 The Manager Company Announcements Office Australian Securities Exchange Dear Manager, MACQUARIE CONFERENCE BRIEFING PRESENTATION Following is a presentation that is to be given at the Macquarie
RETAIL TRADE AS AN ACTOR IN BALANCED SPATIAL PLANNING AND SUSTAINABLE DEVELOPMENT
 AS AN ACTOR IN BALANCED SPATIAL PLANNING AND SUSTAINABLE DEVELOPMENT OVERVIEW OF THE CARREFOUR GROUP Gerard Castrie, Marketing director of Carrefour (France) 1 Discover the Carrefour group The Carrefour
B&M European Value Retail SA Interim Results Presentation 26 weeks to 23 rd September 2017
 B&M European Value Retail SA Interim Results Presentation 26 weeks to 23 rd September 2017 Interim FY18 Group Highlights Group revenues increased by 21.7% to 1,346.4m B&M LFL revenues +7.5%, Q2 LFL +7.7%
2011 Fourth Quarter Results
 2011 Fourth Quarter Results February, 2012 INVESTOR RELATIONS Disclaimer The financial information in this document are consolidated earnings results based on K-IFRS. The previous earnings results have
May 24, 2018 Frankfurt/Main. DVFA Analyst Meeting May 2018 HORNBACH Group 2018
 HORNBACH Baumarkt AG DVFA Analyst Meeting May 24, 2018 Frankfurt/Main Page 1 Financial Calendar 2018 HORNBACH Group June 22, 2018 Financial Update: 1st Quarter of 2018/19 as of May 31, 2018 July 5, 2018
Almacenes Éxito S.A. Consolidated Financial Results For the three-month period ended March 31. First Quarter 2013 Financial Highlights
 Almacenes Éxito S.A. Consolidated Financial Results For the three-month period ended March 31 2013 New Éxito Soledad in Atlántico First Quarter 2013 Financial Highlights Note: Consolidated figures include
JOINT VENTURE WITH HANIEL Delivering Shareholder Value. 16 December 2016
 JOINT VENTURE WITH HANIEL Delivering Shareholder Value Andy Ransom Chief Executive Jeremy Townsend Chief Financial Officer 16 December 2016 Executive Summary Today we have announced an agreement with Haniel
Preliminary Results 20 May Mothercare Preliminary Results
 Preliminary Results 20 May 2010 Mothercare Preliminary Results Ben Gordon Chief Executive Performance highlights Group network sales up 10.0% to 1.1 billion Underlying profit from operations up 16.6% to
Q3 2016/17 RESULTS PRESENTATION. 31 August 2017
 Q3 2016/17 RESULTS PRESENTATION 31 August 2017 DISCLAIMER AND NOTES To the extent that statements in this presentation do not relate to historical or current facts, they constitute forward-looking statements.
Kingfisher plc Sarah Levy. Director of Investor Relations
 Kingfisher plc Sarah Levy Director of Investor Relations Agenda Kingfisher at a Glance Strategic History Our Markets and Brands Creating the Leader Strategy Q1 2014/15 Summary Priorities for 2014/15 Appendix
Preliminary results 2003/04. Slides will be available at
 Preliminary results 2003/04 Slides will be available at www.kingfisher.com Sir Francis Mackay Chairman 2003 a landmark year Kesa Electricals demerger completed Non-core disposals completed Home Improvement
Corporate Presentation. November 2018
 Corporate Presentation November 2018 Company Profile FOURLIS GROUP is a leading retail group of companies of quality consumer goods in Southeast Europe. The initial company was founded in 1950. The group
Ben Gordon Chief Executive
 Interim Results 18 th November, 2009 Ben Gordon Chief Executive Performance highlights Group sales +7.9% to 387.3m Group network sales up 13.6% to 549.1m Group underlying profit before tax +11.1% to 10.0m
O KEY GROUP OVERVIEW. October 2017
 O KEY GROUP OVERVIEW October 2017 Disclaimer 2 By attending the meeting where this presentation is made, or by reading the presentation slides, you agree to be bound by the following limitations: The materials
Earnings Presentation First Quarter May 2012
 Earnings Presentation First Quarter 2012 May 2012 Company overview Key metrics (LTM 2012 1 ) Number of stores: 906 Selling space: 3,3 million sq 2 Number of customers: 800mm Number of employees: 139,082
The NASDAQ 35th Investor Program. November 30,
 R The NASDAQ 35th Investor Program November 30, 2016 1 Forward Looking Statements Certain statements made in this presentation that are not based on historical information are forward-looking statements
HORNBACH Baumarkt AG Group Q3/9M 2017/2018
 HORNBACH Baumarkt AG Group Q3/9M 2017/2018 Quarterly Statement as of November 30, 2017 2 HORNBACH BAUMARKT AG GROUP QUARTERLY STATEMENT: 3 RD QUARTER AND 1 ST NINE MONTHS OF 2017/2018 HORNBACH BAUMARKT
2016 First Quarter Results
 LOTTE SHOPPING CO., LTD 2016 First Quarter Results May, 2016 INVESTOR RELATIONS Disclaimer The financial information in this document are consolidated earnings results based on K-IFRS. This release includes
Matas FY/Q4 2016/17 Results
 Matas FY/Q4 2016/17 Results Forward Looking Statements This presentation contains statements relating to the future, including statements regarding Matas A/S future operating results, financial position,
Q3 2016/17 RESULTS PRESENTATION. 31 August 2017
 Q3 2016/17 RESULTS PRESENTATION 31 August 2017 DISCLAIMER AND NOTES To the extent that statements in this presentation do not relate to historical or current facts, they constitute forward-looking statements.
Electrical Products Group Conference. 21 / May / George Oliver, Chief Executive Officer
 Electrical Products Group Conference 21 / May / 214 George Oliver, Chief Executive Officer Forward-Looking Statements / Safe Harbor This presentation contains a number of forward-looking statements. In
O KEY GROUP ANNOUNCES OPERATING RESULTS FOR Q3 AND 9M 2017
 Press Release 27 Oct 2017 O KEY GROUP ANNOUNCES OPERATING RESULTS FOR Q3 AND 9M 2017 O KEY Group S.A. (LSE: OKEY, the Group ), one of the leading Russian food retailers, announces its unaudited operating
Almacenes Éxito S.A.
 Carulla express Olaya Herrera in Medellín BVC (The Colombian Stock Exchange): ÉXITO ADR Program: ALAXL Medellín, Colombia July 29, 2015 Almacenes Éxito S.A. ( Éxito or the Company ), the largest retail
FY 2015/16 RESULTS PRESENTATION. 14 December 2016
 FY 2015/16 RESULTS PRESENTATION 14 December 2016 DISCLAIMER AND NOTES To the extent that statements in this presentation do not relate to historical or current facts, they constitute forward-looking statements.
Preliminary Results 2006/07 20 June 2007
 Preliminary Results 2006/07 20 June 2007 John Clare Group Chief Executive Group performance Year of significant change Underlying sales Underlying Like for Like sales Underlying PBT Gross margins down
LATIN AMERICA EXECUTIVE CONFERENCE
 LATIN AMERICA EXECUTIVE CONFERENCE January 2013 FALABELLA CONSOLIDATED STATEMENTS BUSINESS UNITS INVESTMENT PLAN MORE THAN 120 YEARS OF HISTORY 1889 Salvatore Falabella opens the first large tailor shop
HORNBACH Holding AG & Co. KGaA Group. 1 st QUARTER 2017/2018
 HORNBACH Holding AG & Co. KGaA Group 1 st QUARTER 2017/2018 Quarterly Statement as of May 31, 2017 2 HORNBACH HOLDING AG & CO. KGaA GROUP QUARTERLY STATEMENT: 1 ST QUARTER OF 2017/2018 HORNBACH HOLDING
FULL YEAR RESULTS 2016/17
 PICTURE BOX Resize your image to this grey area only See example slide for reference FULL YEAR RESULTS 2016/17 24 May 2017 AGENDA Introduction Review of 2016/17 Progress update Guidance Q&A BUILDING A
Earnings Presentation Second Quarter September 2012
 Earnings Presentation Second Quarter 2012 September 2012 Key Issues First Half 2012 Cencosud Projects Second Quarter Results Company overview Key metrics (2Q12) Number of stores: 920 Selling space: 3,495,857
For the quarter and twelve-month period ended December 31, 2010
 Almacenes Éxito S.A. Consolidated Financial Results 20 Fourth Quarter 20 financial report Éxito Modelia: the first store converted from Cafam brand For the quarter and twelve-month period ended December
MADE TO TRADE. Investor Update. Investor Relations: September 2014 METRO AG 2014
 MADE TO TRADE. Investor Update Investor Relations: September 2014 METRO AG 2014 Disclaimer and Notes To the extent that statements in this presentation do not relate to historical or current facts, they
METRO GROUP achieves sales target and confirms EBIT guidance
 19 October 2015 1/5 METRO GROUP achieves sales target and confirms EBIT guidance Like-for-like sales growth of 1.5% in financial year 2014/15 Growth drivers online retail and delivery remain successful
Almacenes Éxito S.A. Consolidated Financial Results
 Almacenes Éxito S.A. Consolidated Financial Results 2011 For the quarter and twelve-month period ended December 31, 2011 The New Surtimax La Paz Bosa store. BVC (The Colombian Stock Exchange): ÉXITO ADR
HORNBACH Holding AG & Co. KGaA Group. 1 st QUARTER 2018/19
 HORNBACH Holding AG & Co. KGaA Group 1 st QUARTER 2018/19 Quarterly Statement as of May 31, 2018 2 HORNBACH HOLDING AG & CO. KGaA GROUP STATEMENT ON 1 ST QUARTER OF 2018/19 HORNBACH HOLDING AG & CO. KGaA
METRO GROUP continues operational improvement trend in 2014/15
 15 December 2015 1/11 METRO GROUP continues operational improvement trend in 2014/15 EBIT before special items totalling 1,511 million, influenced by the negative impact of exchange rate effects amounting
Company Presentation. 1H 2014 Results and Performance August 15, 2014
 Company Presentation 1H 2014 Results and Performance August 15, 2014 Disclaimer These presentations and/or other documents have been written and presented by Puregold Price Club, Inc. (PGOLD). PGOLD is
Interim Results 2009/10. Slides will be available at
 Interim Results 2009/10 Slides will be available at www.kingfisher.com Disclaimer The following presentation is being made only to, and is only directed at, persons to whom such presentation may lawfully
Almacenes Éxito S.A. Consolidated Financial Results
 Almacenes Éxito S.A. Consolidated Financial Results For the second quarter and six-month period ended June 30, Viva Caucasia Shopping Mall BVC (The Colombian Stock Exchange): ÉXITO ADR Program: ALAXL Medellín,
ANNUAL GENERAL MEETING February 2018
 ANNUAL GENERAL MEETING 2018 16. February 2018 DISCLAIMER To the extent that statements in this presentation do not relate to historical or current facts, they constitute forward-looking statements. All
Arun Nayar Senior Vice President, Finance and Treasurer
 Arun Nayar Senior Vice President, Finance and Treasurer November 18, 2010 Forward-Looking Statements / Safe Harbor Certain statements in this presentation are forward-looking statements within the meaning
O`KEY GROUP ANNOUNCES OPERATING RESULTS FOR Q1 2018
 Press Release 17 Apr 2018 O`KEY GROUP ANNOUNCES OPERATING RESULTS FOR Q1 2018 O`KEY Group S.A. (LSE: OKEY, the Group ), one of the leading Russian food retailers, announces its unaudited operating results
INVESTOR NEWS /16
 Düsseldorf, 14.12.2016 1/8 INVESTOR NEWS 1-2015/16 METRO GROUP meets sales and earnings targets in financial year 2015/16 EBIT from continuing operations before special items reaches 1,560 million (2014/15:
2018 HALF-YEAR RESULTS SHAREHOLDER QUICK GUIDE
 2018 HALF-YEAR RESULTS SHAREHOLDER QUICK GUIDE 1 GROUP PERFORMANCE SUMMARY We are pleased to provide shareholders with a summary of Wesfarmers Limited s results for the half-year ended 31 December 2017.
Canaccord Genuity 33 rd Annual Growth Conference August 14, 2013
 Canaccord Genuity 33 rd Annual Growth Conference Forward Looking Statements Certain statements made in this presentation that are not based on historical information are forward-looking statements which
DFVA Analyst Meeting 2017
 DFVA Analyst Meeting 2017 HORNBACH Holding AG & Co. KGaA September 28, 2017 Frankfurt/Main Page 1 Financial Year 2017/2018 1st Half/2nd Quarter (March August 2017) Page 2 since March 28, 2017 Shareholder
WESFARMERS FORECASTS CONTINUED STRONG GROWTH
 WESFARMERS FORECASTS CONTINUED STRONG GROWTH 13 June 2001 Wesfarmers Limited today announced its takeover offer for all of the shares in Howard Smith Limited and provided its bidder s statement (the Bidder
O`KEY GROUP ANNOUNCES OPERATING RESULTS FOR Q2 and 1H 2018
 Press Release 24 Jul 2018 O`KEY GROUP ANNOUNCES OPERATING RESULTS FOR Q2 and 1H 2018 O`KEY Group S.A. (LSE: OKEY, the Group ), one of the leading Russian food retailers, announces its unaudited operating
Full year results 2006/07. Slides will be available at
 Full year results 2006/07 Slides will be available at www.kingfisher.com Gerry Murphy Group Chief Executive 2006/07- Operating highlights UK Market tough, but stabilised in H2 B&Q grew in H2 Good progress
FY2017 Consolidated Business Results May 9, 2018 Toshiba Tec Corporation
 FY2017 Consolidated Business Results May 9, 2018 Toshiba Tec Corporation Content 01 Key Messages 02 FY2017 Consolidated Business Results 03 FY2018 Forecast 1 Key Messages Toshiba Tec achieved the highest
Steinhoff International, MARKUS JOOSTE HISTORY AND DEVELOPMENT OF STEINHOFF
 Steinhoff International, MARKUS JOOSTE HISTORY AND DEVELOPMENT OF STEINHOFF WELCOME 2 HISTORY: STEINHOFF INVOLVED IN HOUSEHOLD GOODS TRADING SINCE 1963 1963-1990: Sourcing in the East for the West City:
Leading in international home retail
 Leading in international home retail - strong brands Leading positions in Europe Sales bn Home Improvement Kingfisher Obi Praktiker Leroy Merlin 3.0 2.9 3.5 8.1 Electricals and Furniture Dixons group Media
FINANCIAL STATEMENTS Stockmann Group 15 February 2017
 FINANCIAL STATEMENTS 2016 Stockmann Group 15 February 2017 YEAR 2016: OPERATING RESULT BACK TO PROFIT Gross margin 53.4% (50.6%) Adjusted operating profit, EUR mill. -20.2 (-28.5) Reported operating profit,
Needham Growth Conference January 10,
 R Needham Growth Conference - 2017 January 10, 2017 1 Forward Looking Statements Certain statements made in this presentation that are not based on historical information are forward-looking statements
Q3 Report Johan Molin President & CEO
 Q3 Report 2011 Johan Molin President & CEO 1 Financial highlights Q3 2011 Good performance in a weak market Continued strong growth in Asia Stable but slow development in mature markets South America slowing
INVESTOR UPDATE. February 2015
 INVESTOR UPDATE February 2015 DISCLAIMER AND NOTES To the extent that statements in this presentation do not relate to historical or current facts, they constitute forward-looking statements. All forward-looking
Gerry Murphy. Chief Executive Officer
 Gerry Murphy Chief Executive Officer Kingfisher today Strong Q1 performance Retail sales 2615.8 million up 8.5%, LFL up 3.9% Retail profit 153.5 million, up 36.5% KESA demerger on track for Q2 New name
For the quarter and six-month period ended June 30, 2010
 2 1 Almacenes Éxito S.A Second Quarter Consolidated 2 financial report 1 financial results The converted Éxito Libertador store in Santa Marta For the quarter and six-month period ended June 3, 21 Working
Luis Amaral Entrepreneurship
 Luis Amaral Entrepreneurship November 2017 Eurocash. The Power of Modern Entrepreneur. 1 1. Where I started? Just an ordinary CV 1984: Graduate of Management at Catolica-Lisbon, School of Business & Economics
Q1 2014/15 RESULTS PRESENTATION. 10 February 2015
 2014/15 RESULTS PRESENTATION 10 February 2015 DISCLAIMER AND NOTES To the extent that statements in this presentation do not relate to historical or current facts, they constitute forward-looking statements.
16th Annual ICR XChange Conference January 13, 2014
 16th Annual ICR XChange Conference January 13, 2014 Forward Looking Statements Certain statements made in this presentation that are not based on historical information are forward-looking statements which
I. EXECUTIVE SUMMARY 3 III. MAIN EVENTS IN THE PERIOD 6 IV. RETAIL INDICATORS 7 V. REVENUES BY BUSINESS UNITS 9 VI. CREDIT INDICATORS 11
 I. EXECUTIVE SUMMARY 3 II. CONSOLIDATED INCOME STATEMENT AS OF SEPTEMBER 30, 2010 4 III. MAIN EVENTS IN THE PERIOD 6 IV. RETAIL INDICATORS 7 V. REVENUES BY BUSINESS UNITS 9 VI. CREDIT INDICATORS 11 VII.
For personal use only TOUCHCORP 1H2015 RESULTS PRESENTATION DATED: THURSDAY, 27TH AUGUST 2015
 TOUCHCORP 1H2015 RESULTS PRESENTATION DATED: THURSDAY, 27TH AUGUST 2015 DISCLAIMER The material in this presentation has been prepared by Touchcorp Limited ARBN 603 731 184 (Touchcorp) and is general background
2013 Annual Stockholders Meeting
 2013 Annual Stockholders Meeting AGENDA Operating Environment Financial Performance Mergers and Acquisitions Plans and Prospects Update: Tacloban Store Operations 1 MACROECONOMIC ENVIRONMENT: ROBUST PHILIPPINE
CORPORATE PRESENTATION BIST: BIZIM
 CORPORATE PRESENTATION BIST: BIZIM 1 DISCLAIMER AND NOTES This presentation contains forward-looking statements which are based on certain expectations and assumptions at the time of publication of this
The ADT Corporation Form 10
 The ADT Corporation Form 10 April 10, 2012 Forward-Looking Statements / Safe Harbor This presentation contains a number of forward-looking statements. Words, and variations of words, such as expect, intend,
NASDAQ OMX 30th Investor Program December 3, 2013
 NASDAQ OMX 30th Investor Program Forward Looking Statements Certain statements made in this presentation that are not based on historical information are forward-looking statements which are made pursuant
INVESTOR PRESENTATION DECEMBER 2017
 INVESTOR PRESENTATION DECEMBER 2017 AGENDA 01 G4S Overview 02 03 9M 17 Update Looking Ahead 04 Q&A 2 G4S TRANSFORMATION G4S TODAY Leading global security company: Secure and Cash Solutions Advantages of
Kingfisher plc Interim results for the 26 weeks ended 4 August 2007
 Thursday 20 September 2007 Kingfisher plc Interim results for the 26 weeks ended 4 August 2007 Group Financial Summary 2007/08 2006/07 Reported Change Constant Currency Change Likefor-like (LFL) change
19 September half year results. 6 months to 31 July 2018
 19 September 2018 Kingfisher plc half year results 6 months to 31 July 2018 Disclaimer You are not to construe the content of this presentation as investment, legal or tax advice and you should make you
Q order intake and sales
 Q1 order intake and sales Solid order intake: 3.0 billion, up 34% Sales: 3.4 billion, up 7.2% on an organic basis 1 (up 4.1% on a reported basis) All financial objectives confirmed Thales (Euronext Paris:
MADE TO TRADE. Annual Press Conference Short Financial Year December MADE TO TRADE. FY 2012 Results Presentation 0
 MADE TO TRADE. Annual Press Conference Short Financial Year 2013 12 December 2013 MADE TO TRADE. FY 2012 Results Presentation 0 20 March 2013 METRO AG 2013 Overview 1 Strong Progress Made in 2013 2 Financials
PUREGOLD PRICE CLUB, INC.
 Sa PUREGOLD PRICE CLUB, INC., Always Panalo! Company Presentation 1Q 2016 Results and Performance July 2016 Disclaimer These presentations and/or other documents have been written and presented by Puregold
Interim Report HORNBACH-BAUMARKT-AG GROUP
 Interim Report HORNBACH-BAUMARKT-AG GROUP 1st QUARTER 2006/2007 (MARCH 1 MAY 31, 2006) HORNBACH-Baumarkt-AG Group Interim Report (IFRS): First Quarter of 2006/2007 (March 1 May 31, 2006) 2 Pleasing business
O KEY GROUP ANNOUNCES OPERATING RESULTS FOR Q2 AND H1 2017
 Press Release 28 July 2017 O KEY GROUP ANNOUNCES OPERATING RESULTS FOR Q2 AND H1 2017 O KEY Group S.A. (LSE: OKEY, the Group ), one of the leading Russian food retailers, announces its unaudited operating
Sidoti Emerging Growth Investor Forum March 18, 2014
 Sidoti Emerging Growth Investor Forum March 18, 2014 Forward Looking Statements Certain statements made in this presentation that are not based on historical information are forward-looking statements
Q1 2015/16 RESULTS PRESENTATION. 11 February 2016
 Q1 2015/16 RESULTS PRESENTATION 11 February 2016 DISCLAIMER AND NOTES To the extent that statements in this presentation do not relate to historical or current facts, they constitute forward-looking statements.
Santander Conference Acapulco JAN 08
 Santander Conference Acapulco JAN 08 Consolidated Summary FALABELLA SNAPSHOT Chile based integrated retailer involved in the department store business, home improvement, supermarket and financial services.
WÜRTH GROUP DIRECT SELLING IN THE DIGITAL WORLD COMPANY PRESENTATION
 WÜRTH GROUP DIRECT SELLING IN THE DIGITAL WORLD COMPANY PRESENTATION Joachim Kaltmaier, CFO & Member of the Central Managing Board LBBW International Fixed Income Conference Stuttgart, 29 September 2015
KINGFISHER PLC HALF YEAR RESULTS
 6 months to 31 July 2017 KINGFISHER PLC HALF YEAR RESULTS 6 months to 31 July 2017 Disclaimer You are not to construe the content of this presentation as investment, legal or tax advice and you should
Whirlpool Corporation Q Financial Review Press Release July 25, 2006 SLIDE 1
 Whirlpool Corporation Q2 2006 Financial Review Press Release July 25, 2006 SLIDE 1 Whirlpool Corporation Second Quarter Performance Earnings from continuing operations of $100 million versus $96 million
KESKO S ROADSHOW JUKKA ERLUND MAY 2016
 KESKO S ROADSHOW JUKKA ERLUND MAY 2016 1 KESKO Q1/2016 ROLLING 12 MO Net sales 8,610m Operating profit* 250m ROCE* 12.4% Personnel 22,000 Shareholders 40,000 Market capitalisation 3.8bn (Mar. 31, 2016)
MADE TO TRADE. Deutsche Bank s dbaccess Global Consumer Conference. Investor Relations: 18 June 2014 METRO AG 2014
 MADE TO TRADE. Deutsche Bank s dbaccess Global Consumer Conference Investor Relations: 18 June 2014 METRO AG 2014 Disclaimer and Notes To the extent that statements in this presentation do not relate to