DFH JOINT VENTURE. Stormwater Management Report for Proposed Residential Subdivision at Graham Block, Pokeno
|
|
|
- Gilbert Parker
- 5 years ago
- Views:
Transcription
1 DFH JOINT VENTURE Stormwater Management Report for Proposed Residential Subdivision at Graham Block, Pokeno


2 DOCUMENT CONTROL RECORD Document: DFH Joint Venture Graham Block Stormwater Management Report CP Project No CP Document No. TR001 Date of Issue: Originator:... Alister Hood Civil Engineer Reviewed By:... Ryan Pitkethley Senior Civil Engineer Approved By:... Mike Smith Director Contact Details: Alister Hood CivilPlan Consultants Ltd PO Box 97796, Manukau 2241 P: M: E: Page ii
3 TABLE OF CONTENTS 1. Executive Summary Introduction Purpose of the Report Limitations Documents Referenced Existing Catchment Location Existing Land Use Topography Design Objectives Treatment targets Detention (flow mitigation) targets Peak flow mitigation targets Pipe network sizing Flooding and Overland Flows Catchment Rainfall Data Catchment Curve Numbers Catchment Impervious Areas Proposed Development Stormwater Quality Treatment Extended Detention Downstream Pipe Network Capacity Checks Flooding and Overland Flows Conclusion Page iii
4 APPENDICES APPENDIX 1 Drawings APPENDIX 2 Catchment Design Calculations APPENDIX 3 On-Lot Detention Tank Sizing Practice Note HCC04 for On-Lot Bioretention APPENDIX 4 Pond J Sizing Comparison Page iv
5 April 2017 Stormwater Management Report Graham Block, Pokeno DFH Joint Venture 1. Executive Summary This report details the stormwater management for a proposed development at Graham Block and for further intensification of the proposed development on the Pokeno Village Holdings land to the north and east. The catchment drains to the east via two streams which discharge to the existing stormwater pipe network. Extended detention for the development will be provided on-lot and in a proposed reserve on the development site. Treatment will be provided by the existing Pond J downstream of the catchment as well as forebays to provide pre-treatment of runoff to the streams on the site. Flooding and overland flow in the 100 year storm event will be confined to the site, within roads and the gully reserve. Minimum floor levels are proposed to protect houses on low-lying lots in extreme storm events. Climate change has been allowed for in all analyses. Page 1
6 April 2017 Stormwater Management Report Graham Block, Pokeno DFH Joint Venture 2. Introduction 2.1 Purpose of the Report This report details the stormwater management for a proposed development at Graham Block, in Pokeno, which is located at the end of Hitchen Road, and for further intensification of the proposed development on the Pokeno Village Holdings land to the north and east. There is an existing structure plan covering residential development on Graham Block to the west of Hitchen Road, and large lot residential subdivision on the Pokeno Village Holdings land to the north and east of Graham Block. This report is to support a proposed structure plan to allow intensification of the area currently designated as large lot residential (from approximately 70 proposed lots to 110), and to provide approximately 85 additional residential lots on Graham Block to the east of Hitchen Road, with the remainder of the block remaining as large lot rural or reserve. 2.2 Limitations This report has been prepared for DFH Joint Venture to support the proposed structure plan covering development of this site. 3. Documents Referenced The following documents and standards have been referenced to complete the stormwater design: Pokeno Stormwater Catchment Management Plan (CMP) Report and Drawings Franklin District Council, September Hamilton City Council Infrastructure Technical Specifications. Section 4 Drainage (ITS). Auckland Regional Council TP108 Guidelines for Storm Water Runoff Modelling in the Auckland Region. Auckland Regional Council TP10 Stormwater Management Devices: Design Guidelines Manual. Proposed Stormwater Discharge at Pokeno Resource Consent Application and Assessment of Effects on the Environment Harrison Grierson, February Existing Catchment 4.1 Location The site is located to the east of Pokeno Road and the North Island Main Trunk Line, being approximately 37ha in size. The site is within the Tanitewhiora Stream catchment, which has a total catchment area of 1,270 ha. Refer to Figures 1 and 2. Page 2

7 April 2017 Stormwater Management Report Graham Block, Pokeno DFH Joint Venture Figure 1 Proposed Development Site. Page 3

8 April 2017 Stormwater Management Report Graham Block, Pokeno DFH Joint Venture Figure 2 Existing catchment from the CMP drawing SW100. Site is highlighted yellow. 4.2 Existing Land Use The majority of the land is currently used for farming, with minimal impervious areas. 4.3 Topography Hitchen Road follows a ridgeline along the north side of the site and then runs north-south through Graham Block. The site falls away from Hitchen Road to the east and west. The proposed residential development drains to a stream running to the east through a reserve formed as part of the adjacent Lot 30 Gateway Industrial subdivision, and collected by the existing pipe network at Yashili Drive. The pipe network discharges to the Tanitewhiora Stream via a stormwater treatment pond identified as Pond J in the Catchment Management Plan. There is a second stream draining the proposed rural residential land on the southeast part of the site, which is also collected at the edge of the Lot 30 industrial site by the existing pipe network. The catchment for this stream also includes approximately 21 Ha of rural land upstream of the site. The proposed rural residential land on the southern corner of the site drains to a stream to the west of the site. Page 4
9 April 2017 Stormwater Management Report Graham Block, Pokeno DFH Joint Venture 5. Design Objectives The following sections summarise the design objectives targeted for the stormwater design. 5.1 Treatment targets The Infrastructure Technical Specification (ITS) requires a centralised TP10 based treatment device for a Water Quality Volume (WQV) equal to the runoff from a 24 hour storm event that is 1/3 of the 50% AEP (1 in 2 year) event, including climate change. The site is upstream of existing treatment Pond J which is designed with excess capacity. As detailed in section 9.1 below, the increased water quality volume from the proposed development is less than the excess capacity of the pond, therefore the existing pond size is adequate. The contaminant yield of the site will be low due to the nature of the development (i.e. generally comprising low level local roads and roof runoff), however to protect the streams on the site, which are upstream of Pond J, it is proposed to discharge via treatment forebays which will constructed in the reserve at the head of the gulleys. The forebays will be sized with a permanent pool volume of 15% of the water quality volume. 5.2 Detention (flow mitigation) targets Pond J was designed for treatment only, therefore extended detention must be provided on the development site to mitigate the increase in stream flows. In accordance with the ITS Extended Detention (temporary storage with a drain down period of 24 hours) will be provided for runoff from the roads and access lots for a 32.9mm rainfall event, being 1.2 x the Water Quality Volume storm event, including climate change. The detention volume will be provided in the proposed treatment forebays. In addition to the chambers in the reserve, all lots will require on-lot detention which is to be sized based on the lot area and allowing for impervious areas as per District Plan Rule A typical detail and sizing calculations are included in Appendix 3. Note that District Plan Rule requires detention of a 20% AEP 10 minute storm event. Extended detention volumes calculated based on the ITS are significantly larger and are thus conservative in relation to the District Plan. 5.3 Peak flow mitigation targets The catchment management plan identified the adjoining sites as being near the bottom of the catchment, and attenuation of the 50% AEP, 10% AEP, and 1% AEP storm events was not deemed necessary, as it would delay peak flows from the site, which would coincide with peaks from upper catchment areas, exacerbating peak flows for the catchment. Therefore Pond J was designed for treatment only. Hence, no peak flow mitigation is proposed for this development. 5.4 Pipe network sizing In accordance with the Infrastructure Technical Specification (ITS), it is proposed to use the 10 minute, 50% AEP + climate change event (1 in 2 yr + cc) rainfall intensity to size the pipe network within the residential subdivision, which equates to 70.8 mm/hr. Page 5
10 April 2017 Stormwater Management Report Graham Block, Pokeno DFH Joint Venture The downstream pipe network is in an industrial area so the downstream pipe capacities have been checked for the 20% AEP+ cc event (1 in 5 yr + cc) as per the ITS. The 15 minute rainfall intensity has been used as the length of the catchment increases the time of concentration for runoff from the proposed development. 5.5 Flooding and Overland Flows In the residential area overland flow through the development will be via roads which discharge to the stream reserve. In the rural area flow will be via existing streams and overland flow paths. Both streams on the east side of the site are collected by the existing pipe network and will flood in the event of a blockage or a storm event that exceeds the pipe capacity. TP108 calculations show that the storage volumes available in each stream exceed the total runoff volumes for the 100 year storm event, therefore even with 100% blockage of the downstream pipe network there would be no overland flow in the 100 year event from the site into Yashili Drive or the Lot 30 industrial site. It is proposed to set minimum floor levels on the site to 500mm above the downstream ground level, based on the potential in an extreme storm event for ponding up to that level before overland flow can leave the streams on the site. 6. Catchment Rainfall Data In accordance with Council requirements, rainfall for the site was taken from NIWA HIRDS v3 data, with rainfall for all storms increased by 16.8% to allow for 2 o C climate change: It is noted that the CMP uses the Auckland TP108 rainfall charts. These show higher rainfall depths than the HIRDS v3 data for the site. However the CMP did not consider climate change for the majority of storm events. Waikato Regional Council has confirmed that the TP108 rainfall depths are generated for Auckland and are not to be used in the Waikato region. The design rainfall depths are shown in Table 1. TABLE 1: Rainfall Event Design Rainfall Depths (mm) 24hr Rainfall Depth from HIRDS v3 Water Quality Volume (WQV) Extended Detention Volume (EDV) % AEP % AEP % AEP % AEP Catchment Curve Numbers 24hr Rainfall Depth including 16.8% Climate Change The existing soil type is classified as South Auckland Volcanic Field, which is identified in the CMP to correspond to a soil classification of A-B, with a pervious CN of 50 for pasture, and 43 for bush. In the Page 6
11 April 2017 Stormwater Management Report Graham Block, Pokeno DFH Joint Venture post-development condition it is assumed that pervious soils have a CN value of 74 to represent compacted, earth-worked soils. 8. Catchment Impervious Areas The runoff calculations are based on the following impervious areas: Estimates of existing impervious areas based on aerial photos. 0% for pasture, bush, and the proposed reserve. 35% roof area and an additional 20% impervious area for proposed residential lots up to 1000m². 350m² roof area and 200m² impervious area for each lot larger than 1000m². This is based on the District Plan rule requirement for stormwater management design. Roof areas and residential areas for each rural lot as per those for residential lots larger than 1000m², outlined above. 75% for proposed road corridors, as per the Catchment Management Plan. 75% for access lots. 90% for the downstream industrial area, as per the Catchment Management Plan. To calculate how much the proposed development will increase the water quality volume compared to development according to the existing Structure Plan, the large lot residential area in the existing Structure Plan was divided into 1200m² lots with 550m² of impervious area per lot. Page 7
12 9. Proposed Development Stormwater 9.1 Quality Treatment Downstream Treatment Pond J April 2017 Stormwater Management Report Graham Block, Pokeno DFH Joint Venture The water quality volume calculated for the site is summarised in Table 2 below. Refer to Appendix 2 for TP108 calculations. TABLE 2: Proposed Development Water Quality Volume (m³) WQV for development as per existing plan change WQV for proposed development Increase in WQV Northern stream 1,874 3,206 1,332 Southern stream Total Runoff from the site discharges to the downstream treatment Pond J via the existing streams on the site and downstream pipe networks. Pond J is identified in the Stormwater Discharge Report as exceeding the required design volumes, as summarised in Table 3 below. Based on the ITS requirements for pond sizing, the excess capacity of Pond J could treat an additional 4037m³ WQV. This exceeds the 1380m³ increase in WQV from the proposed development, therefore Pond J is adequately sized for the increased flows from the development. Note also that this assessment is conservative due to the proposal for extended detention on the site (i.e. upstream of the pond), and the EDV storm being 20% larger than the WQV storm. TABLE 3: Pond J Volumes (m³) Volume Required for 75% TSS removal Volume Provided Excess Volume Additional WQV that could be treated (based on ITS requirements for pond design) Main Pond 12,809 15, Excess Volume x 0.75 x 2 = 4,037 Forebay 765 1, Excess Volume x 0.75 x 2 x 10 = 11,025 For comparison, water quality volume calculations for the entire Pond J catchment are included in Appendix 4, based on the original Pond J sizing calculations, and the proposed development changing roughly 9.6ha of rural land to residential. These calculations are based on Curve Numbers that are higher than those taken from the Catchment Management Plan, and higher impervious areas (10% impervious area for rural residential and 65% impervious area for residential). The higher numbers are considered to be excessively conservative, but even using these numbers together with the current (larger) design storm, and ignoring the effect of extended detention on the development site, the pond would still achieve 75% sediment removal efficiency. Page 8
13 April 2017 Stormwater Management Report Graham Block, Pokeno DFH Joint Venture Treatment Forebays Road runoff will be discharged to the stream via treatment forebays located at the pipe outlets, and shown indicatively on the stormwater layout plan SK102. The forebays will be sized based on their contributing subcatchments, with a permanent wetland equal to 15% of the WQV, and detention storage equal to the EDV. Refer to Table 4 below for the design volumes and Appendix 2 for TP108 calculations. The forebays will be formed with a weir and low flow pipe which will be detailed at Consent stage On-Lot Treatment Devices The ITS and Three Waters Management Practice Notes require on-lot bioretention. Peak flows in the extended detention storm are calculated to reduce from existing (refer to section below), therefore it is proposed that these are sized for treatment only i.e. sized according to Practice Note HCC04 as a reduced at-source measure, at 2% of the trafficked impermeable area. This will be prescribed by consent notices on each title. 9.2 Extended Detention Runoff Volumes The proposed development will increase the runoff volume in the EDV storm from the site from 3,193m³ to 4,883m³, and will increase the peak flow rate from 0.08m³/s to 0.10m³/s in the southern stream subcatchment and from 0.37m³/s to 0.66m³/s in the northern stream subcatchment. However, due to the provision of extended detention as outlined below, peak flows in the streams are estimated to be attenuated to 0.34m³/s and 0.09m³/s, a net reduction of 4% from existing. Refer to the calculations in Appendix Treatment Forebays Detention for the road reserves and access lots will be provided in the treatment forebays located in the proposed reserve and sized based on their contributing subcatchments. No attenuation will be provided for the most eastern subcatchment adjacent to Hitchen Road (lots 1 to 18), as it discharges at the downstream end of the stream, so extended detention will have negligible benefit. The proposed devices are shown indicatively on the stormwater layout plan on drawing SK102, and indicative volumes shown in Table 4 below. Refer to Appendix 2 for TP108 calculations. Page 9
14 TABLE 4: Proposed Treatment Forebay Volumes Catchment (roads and access lots) (m²) EDV (m³) April 2017 Stormwater Management Report Graham Block, Pokeno DFH Joint Venture WQV (m³) Treatment Forebay Permanent Pool (m³) = 0.15 WQV Forebay 1 6, Forebay 2 9, Forebay 3 8, Forebay 4 2, Forebay 5 2, Forebay 6 1,254 NA Total 30, Total Forebay volume (m³) = 0.15WQV+ EDV On-lot detention All lots require tanks for roof areas to provide on-lot detention and reuse. The detention volume is to be sized based on capture of runoff from 35% of the lot, up to a maximum of 350m² for lots 1000m² or larger, which corresponds to a maximum required detention volume of 10.9m³. The reuse volume is to be 5m³ based on practice note HCC05. A tank typical detail and sizing calculations are included in Appendix 3. Specific design for onsite tanks will need to be considered at the time of construction of each dwelling, and will be prescribed by consent notices on each title. The tanks on the majority of the residential lots are proposed to connect to the reticulated network, which will discharge in the reserve at the locations of the treatment forebays. The remainder of the residential lots and rural lots are proposed to discharge on-lot via T-bar level-spreaders, shown indicatively on the plan. 9.3 Downstream Pipe Network Capacity Checks Existing pipe network The northern stream discharges via a pipe (Stormwater Line 2) running from Yashili Drive eastwards along Hitchen Road. The calculations which were used to size this pipe allowed for 2.46m³/s inflow from the stream, however parts of the pipe were installed at flatter grades and therefore the as-built capacity without surcharge is lower than the design capacity. The southern stream discharges via a pipe running across the Lot 30 industrial site and eastwards along Yashili Drive. There is also an 825mm pipe (Stormwater Line 6) from the northern stream southwards along Yashili Drive and connecting to the pipe from the southern stream (Stormwater Line 5), which was installed primarily as a temporary diversion while the pipe running along Hitchen Road was built. The inlet of Line 6 is lower than the inlet of Line 2. Page 10
15 April 2017 Stormwater Management Report Graham Block, Pokeno DFH Joint Venture Peak flow The two streams provide a significant storage volume which will attenuate peak flows. The post development peak runoff rates in the 5 year storm event without considering this attenuation are calculated as 2.89m³/s for the northern stream and 1.13m³/s for the southern stream Pipe Capacity Peak flows in the downstream pipe network have been modelled using XPStorm software both with and without considering attenuation due to storage in the streams. The model shows the pipe network has sufficient capacity in both cases. Peak flow outputs for the model without storage (the conservative case) are included in Appendix 2. The pipe capacity has also been verified by hand calculations. 9.4 Flooding and Overland Flows Table 6 below shows that the available storage in the two streams on the site exceeds the total runoff volumes for the 100 year storm event, therefore even with 100% blockage of the downstream pipe network there would be no overland flow in the 100 year event from the site into Yashili Drive or the Lot 30 industrial site. Refer to Appendix 2 for TP108 calculations. TABLE 6: Runoff Volumes from 1% AEP 24 Hour Storm Including Climate Change (m³) Catchment Runoff Volume (m³) Downstream RL (m) Storage in Stream (m³) Northern stream 16, ,927 Southern stream 6, ,522 The northern stream has storage of 17,219m³ below RL 28.0, therefore flooding from the 100 year storm will not exceed this level. The proposed lots are all above RL28.0 except approximately 70m² (9% of site area) at the rear corner of Lot 3. Due to the topography, lot owners are unlikely to build on the low-lying parts of lots, but minimum floor levels are proposed which will provide 500mm freeboard in the case of an extreme storm event causing ponding in the streams up to the downstream ground level refer to table 7 below. TABLE 7: Lots Proposed Minimum Floor Levels 1,2,3,8,9,16, 30,31,32 RL (rural lot) RL 32.5 Minimum Floor Level Page 11
16 April 2017 Stormwater Management Report Graham Block, Pokeno DFH Joint Venture 10. Conclusion The downstream Pond J has sufficient excess treatment capacity to cater for runoff from the proposed development. Road runoff in the development will discharging to the streams in the proposed reserve via treatment forebays constructed at the pipe outlets. Each lot will require a rain tank to provide extended detention and reuse and sized as detailed. Each lot will require bioretention to treat runoff from impervious areas, sized in accordance with HCC04 as a reduced-at-source measure. Extended detention will be provided on the site by on-lot detention tanks and the treatment forebays. Peak flows in the stream and therefore velocities will be attenuated in the EDV storm to approximately equal pre-development flows. The downstream pipe network has sufficient capacity to convey runoff from the development. There is sufficient storage in the streams on the site that there will be no overland flow into Yashili Drive and the Lot 30 industrial site in the 100 year storm. All residential lots are high enough to avoid flooding in the 100 year storm, however some lots should have a minimum floor level set as detailed in section 9.4 above, to avoid flooding in extreme storm events. S:\Jobs\ DFH Joint Venture Hitchen Block Stage 3\Graham Block\SW technical report - Graham block east\1950-tr001-ajh.docx Page 12
17 APPENDIX 1 Drawings
18 Gateway Park Drive HITCHEN ROAD 90,580 m² LEGEND EXISTING STRUCTURE PLAN BOUNDARY PROPOSED RESIDENTIAL 2 ZONE Road 31 Yashili Drive Yashili Drive PROPOSED RURAL OR COUNTRYSIDE LIVING INDICATIVE RESERVES Road ,554 m² 56,603 m² "LOT 30" INDUSTRIAL SITE INDICATIVE STORMWATER WETLANDS PROPOSED RESIDENTIAL 2 (MAX 2000m2) LOTS Road 29 Road 27 Road 23 Road 28 JOAL 30 Printed by: ALISTAIR@ // Filepath: S:\JOBS\ DFH JOINT VENTURE HITCHEN BLOCK STAGE 3\CAD\GRAHAM BLOCK\ SK100.DWG D1 STORMWATER REPORT AJH REV REVISION DETAILS BY DATE DRAWN: DATE: AJH CHECKED: DATE: AJH APPROVED: DATE: MSS THIS DRAWING (AND DESIGN) REMAINS THE PROPERTY OF CIVILPLAN CONSULTANTS LIMITED AND MAY NOT BE REPRODUCED OR ALTERED WITHOUT PRIOR AGREEMENT FROM CIVILPLAN CONSULTANTS LIMITED. CIVILPLAN CONSULTANTS LIMITED WILL NOT ACCEPT LIABILITY ARISING FROM UNAUTHORISED USE OF THIS DRAWING. Level 3, 3 Osterley Way, Manukau, Auckland. Phone: PROJECT TITLE: DFH JOINT VENTURE POKENO VILLAGE GRAHAM BLOCK 279,989 m² SHEET TITLE: GRAHAM BLOCK POSTDEVELOPMENT CATCHMENT PLAN ISSUE STATUS: SCALE: (A1/A3) 1:2500 / 1:5000 SCALE BAR 1:5000@A3 DRAWING NUMBER: SK101 FOR CONSENT m Rev: (NO REV.=DRAFT) (D=DESIGN) (C=CONSENT) (B=BUILD) (A=AS-BUILT / FINAL ISSUE) REV: D1
19 CP71 CP70 DCP73 SW11.11 Yashili Drive SW25.3 NOTES: 1. ALL LOTS TO HAVE ON-LOT BIORETENTION SIZED AT 2% OF IMPERVIOUS AREA EXCLUDING ROOF AREAS. REFER TO PRACTICE NOTE HC ALL LOTS TO HAVE ON-LOT REUSE AND DETENTION TANKS SIZED ACCORDING TO: REUSE VOLUME = 5m³ DETENTION VOLUME (m³) = LOT AREA (m²) 91.7 USE 1000m² FOR LARGE LOTS REFER TO CALCULATION SHEET FOR DETAILS 3. ROAD RUNOFF TO DISCHARGE TO RESERVE VIA TREATMENT FOREBAYS INDICATIVELY SIZED AS FOLLOWS: Road 23 SW38.6 SW3.21 SW3.20 SW3.19 CP89 CP90 SW3.18 SW38.1 HITCHEN ROAD CP68 CP69 SW43.1 SW3.16 SW3.17 CP65 CP64 CP66 CP67 SW34.6 SW34.9 SW34.8 DCP63 SW34.7 SW35.1 SW11.15 SW27.2 SW22.5 SW22.4 SW22.3 CP38 CP39 SW27.1 SW19.2 CP37 CP35 CP36 SW11.7 SW11.8 SW11.5 CP33 DCP34 SW25.1 SW11.6 SW25.2 SW11.12 SW11.9 SW11.14 SW11.13 SW11.16 SW11.10 SW23.1 BC2.15 DCP72 SW33.1 SW24.2 Road 31 EARTHWORKS BATTER TYPICAL FOREBAY DETAIL SW13.1 FULL CAPACITY WATER LEVEL ROCK, GABION OR TIMBER WEIR SW11.5 PERMANENT WATER LEVEL PLANTED WITH APPROPRIATE WETLAND PLANS. SOME EXCAVATION MAY BE REQUIRED TO ACHIEVE TREATMENT VOLUMES. Road 27 LOW FLOW PIPE TO MAINTAIN LONG TERM WETLAND LEVEL GULLY FLOOR FOREBAY 3 FOREBAY 2 SW11.6 SW9.5 SW9.4 FOREBAY 1 Road 23 Road 29 SW11.4 SW14.1 SW11.3 FOREBAY 4 SW11.2 Road 28 FOREBAY 5 FOREBAY 6 Printed by: ALISTAIR@ // Filepath: S:\JOBS\ DFH JOINT VENTURE HITCHEN BLOCK STAGE 3\CAD\GRAHAM BLOCK\ SK100.DWG D1 STORMWATER REPORT AJH REV REVISION DETAILS BY DATE DRAWN: DATE: AJH CHECKED: DATE: AJH APPROVED: DATE: MSS THIS DRAWING (AND DESIGN) REMAINS THE PROPERTY OF CIVILPLAN CONSULTANTS LIMITED AND MAY NOT BE REPRODUCED OR ALTERED WITHOUT PRIOR AGREEMENT FROM CIVILPLAN CONSULTANTS LIMITED. CIVILPLAN CONSULTANTS LIMITED WILL NOT ACCEPT LIABILITY ARISING FROM UNAUTHORISED USE OF THIS DRAWING. JOAL 30 Level 3, 3 Osterley Way, Manukau, Auckland. Phone: PROJECT TITLE: DFH JOINT VENTURE POKENO VILLAGE GRAHAM BLOCK SHEET TITLE: GRAHAM BLOCK POSTDEVELOPMENT STORMWATER LAYOUT "LOT 30" INDUSTRIAL SITE LEGEND ON-LOT LEVEL SPREADER OUTLET ISSUE STATUS: SCALE: (A1/A3) SCALE BAR 1:3000@A3 DRAWING NUMBER: STORMWATER LINE 6 STORMWATER LINE 5 TREATMENT FOREBAY (INDICATIVE) 1:1500 / 1:3000 STORMWATER LINE SK102 FOR CONSENT m Rev: (NO REV.=DRAFT) (D=DESIGN) (C=CONSENT) (B=BUILD) (A=AS-BUILT / FINAL ISSUE) REV: D1
20 APPENDIX 2 Catchment Design Calculations
21 Client: DFH Joint Venture Project: Graham Block Pokeno Job No: 1950 Designer: AJH Date: Revision: 1 STORMWATER PEAK FLOW RATE, RUNOFF DEPTH, AND RUNOFF VOLUME (ARC TP 108) SUMMARY OF RESULTS FOR: Catchment draining via northern stream (WQV check) WQV EDV 50% AEP+ 16.8%CC 20% AEP+ 16.8%CC 10% AEP+16.8%CC 1% AEP+16.8% CC Pre Development Peak flow rate (m³/s): Runoff volume (m³): Post Development Peak flow rate (m³/s): Runoff volume (m³): Difference Peak flow rate (m³/s): Runoff volume (m³):
22 Client: DFH Joint Venture Project: Graham Block Pokeno Job No: 1950 Designer: AJH Date: Revision: 1 STORMWATER PEAK FLOW RATE,RUNOFF DEPTH, AND RUNOFF VOLUME (ARC TP 108) CATCHMENT: TOTAL CATCHMENT AREA: SCENARIO: Catchment draining via northern stream (WQV check) Ha "PRE DEVELOPMENT" = DEVELOPMENT OF EXISTING STRUCTURE PLAN AREA AS 1200m² lots with 550m² IA NOTE: This spreadsheet calculates stormwater peak flow rates using ARC TP 108, Graphical Method. PERVIOUS CATCHMENT Runoff Curve Number (CN) and Initial Abstraction (Ia): Soil Type Soil Classification Cover Description (cover type, treatment, hydrological cond.) Curve No. CN Area Ha CN * Area South Auckland Volcanic Field A-B Pasture South Auckland Volcanic Field A-B Urban lawns South Auckland Volcanic Field A-B Replanted bush along stream South Auckland Volcanic Field A-B Reserve Total Pervious= CN (weighted) = Total product / Total Area = 55.5 Ia (weighted) = 5.0 mm Time of Concentration: Channelisation Factor (choose C=0.6 piped or C=0.8 engineered grass channels) C= 0.8 (Averaged) Catchment Length (measured along drainage path) L= 0.77 km Catchment Slope (calculated by equal area method) Sc= m/m Runoff Factor = CN/(200-CN)= RF= 0.38 tc = 0.14*C*L^0.66*((CN/(200-CN))^-0.55*Sc^-0.30 = tc= 0.45 hrs min. of 0.17hrs to be used SCS lag for HEC-HMS = tp = 2/3*tc= tp= 0.30 hrs Graphical Peak Flow Rate: Soil Storage Parameter S = ((1000/CN)-10)*25.4= mm WQV EDV 50% AEP+ 16.8%CC 20% AEP+ 16.8%CC 10% AEP+16.8%CC 1% AEP+16.8% CC Av. recurrence interval ARI= 1/3 2yr EDV 2yr+CC 5yr+CC 10yr+CC 100yr+CC 24hr rainfall depth (mm) (From HIRDS) P24= hr rainfall depth+cc (mm) (+16.8%) P24+CC= c* = (P24-2Ia)/(P24-2Ia+2S) c*= Specific Peak Flow Rate (from fig 5.1 in TP 108) q*= Peak Flow Rate (m³/s) A*P24*q*/100 qp= Runoff Depth (mm) (P24-Ia)^2/(P24-Ia+S) Q24= Runoff Volume (m³) 1000*Q24*A/100 V24= IMPERVIOUS CATCHMENT Runoff Curve Number (CN) and Initial Abstraction (Ia): Soil Type Soil Classification Cover Description (cover type, treatment, hydrological cond.) Curve No. CN Area Ha CN * Area South Auckland Volcanic Field A-B Residential lots South Auckland Volcanic Field A-B Roading at 75% IA Total Impervious= CN (weighted) = Total product / Total Area = 98.0 Ia (weighted) = 0.0 Time of Concentration: Channelisation Factor (choose C=0.6 piped or C=0.8 engineered grass channels) C= 0.8 (Averaged) Catchment Length (measured along drainage path) L= 0.77 km Catchment Slope (calculated by equal area method) Sc= m/m Runoff Factor = CN/(200-CN)= RF= 0.96 tc = 0.14*C*L^0.66*((CN/(200-CN))^-0.55*Sc^-0.30 = tc= 0.27 hrs min. of 0.17hrs to be used SCS lag for HEC-HMS = tp = 2/3*tc= tp= 0.18 hrs Graphical Peak Flow Rate: Storage S = ((1000/CN)-10)*25.4= 5.2 mm WQV EDV 50% AEP+ 16.8%CC 20% AEP+ 16.8%CC 10% AEP+16.8%CC 1% AEP+16.8% CC Av. recurrence interval ARI= 1/3 2yr EDV 2yr+CC 5yr+CC 10yr+CC 100yr+CC 24hr rainfall depth (mm) (From graphs in TP 108) P24= hr rainfall depth+cc (mm) (From graphs in TP 108) P24+CC= c* = (P24-2Ia)/(P24-2Ia+2S) c*= Specific Peak Flow Rate (from fig 5.1 in TP 108) q*= Peak Flow Rate (m³/s) A*P24*q*/100 qp= Runoff Depth (mm) (P24-Ia)^2/(P24-Ia+S) Q24= Runoff Volume (m³) 1000*Q24*A/100 V24= TOTALS: WQV EDV 50% AEP+ 16.8%CC 20% AEP+ 16.8%CC 10% AEP+16.8%CC 1% AEP+16.8% CC Peak flow rate (m³/s): Runoff volume (m³): AVERAGE SLOPE BY END AREA METHOD Elevation (m) h (m) x (m) delta x (m) average h (m) delta A (m²) Sc = 0.031
23 Client: DFH Joint Venture Project: Graham Block Pokeno Job No: 1950 Designer: AJH Date: Revision: 1 STORMWATER PEAK FLOW RATE,RUNOFF DEPTH, AND RUNOFF VOLUME (ARC TP 108) CATCHMENT: Catchment draining via northern stream (WQV check) TOTAL CATCHMENT AREA: SCENARIO: POST DEVELOPMENT Ha NOTE: This spreadsheet calculates stormwater peak flow rates using ARC TP 108, Graphical Method. PERVIOUS CATCHMENT Runoff Curve Number (CN) and Initial Abstraction (Ia): Soil Type Soil Classification Cover Description (cover type, treatment, hydrological cond.) Curve No. CN Area Ha CN * Area South Auckland Volcanic Field A-B Pasture South Auckland Volcanic Field A-B Urban lawns South Auckland Volcanic Field A-B Replanted bush along stream South Auckland Volcanic Field A-B Reserve Total Pervious= CN (weighted) = Total product / Total Area = 63.5 Ia (weighted) = 5.0 mm Time of Concentration: Channelisation Factor (choose C=0.6 piped or C=0.8 engineered grass channels) C= 0.6 (Averaged) Catchment Length (measured along drainage path) L= 1.12 km Catchment Slope (calculated by equal area method) Sc= m/m Runoff Factor = CN/(200-CN)= RF= 0.46 tc = 0.14*C*L^0.66*((CN/(200-CN))^-0.55*Sc^-0.30 = tc= 0.36 hrs min. of 0.17hrs to be used SCS lag for HEC-HMS = tp = 2/3*tc= tp= 0.24 hrs Graphical Peak Flow Rate: Soil Storage Parameter S = ((1000/CN)-10)*25.4= mm WQV EDV 50% AEP+ 16.8%CC 20% AEP+ 16.8%CC 10% AEP+16.8%CC 1% AEP+16.8% CC Av. recurrence interval ARI= 1/3 2yr EDV 2yr+CC 5yr+CC 10yr+CC 100yr+CC 24hr rainfall depth (mm) (From graphs in TP 108) P24= hr rainfall depth+cc (mm) (From graphs in TP 108) P24+CC= c* = (P24-2Ia)/(P24-2Ia+2S) c*= Specific Peak Flow Rate (from fig 5.1 in TP 108) q*= Peak Flow Rate (m³/s) A*P24*q*/100 qp= Runoff Depth (mm) (P24-Ia)^2/(P24-Ia+S) Q24= Runoff Volume (m³) 1000*Q24*A/100 V24= IMPERVIOUS CATCHMENT Runoff Curve Number (CN) and Initial Abstraction (Ia): Soil Type Soil Classification Cover Description (cover type, treatment, hydrological cond.) Curve No. CN Area Ha CN * Area South Auckland Volcanic Field A-B Residential lots at 55% IA with maximum 550m² South Auckland Volcanic Field A-B Roading at 75% IA South Auckland Volcanic Field A-B Rural lots IA at 550m² each Total Impervious= CN (weighted) = Total product / Total Area = 98.0 Ia (weighted) = 0.0 Time of Concentration: Channelisation Factor (choose C=0.6 piped or C=0.8 engineered grass channels) C= 0.6 (Averaged) Catchment Length (measured along drainage path) L= 1.12 km Catchment Slope (calculated by equal area method) Sc= m/m Runoff Factor = CN/(200-CN)= RF= 0.96 tc = 0.14*C*L^0.66*((CN/(200-CN))^-0.55*Sc^-0.30 = tc= 0.24 hrs min. of 0.17hrs to be used SCS lag for HEC-HMS = tp = 2/3*tc= tp= 0.16 hrs Graphical Peak Flow Rate: Storage S = ((1000/CN)-10)*25.4= 5.2 mm WQV EDV 50% AEP+ 16.8%CC 20% AEP+ 16.8%CC 10% AEP+16.8%CC 1% AEP+16.8% CC Av. recurrence interval ARI= 1/3 2yr EDV 2yr+CC 5yr+CC 10yr+CC 100yr+CC 24hr rainfall depth (mm) (From graphs in TP 108) P24= hr rainfall depth+cc (mm) (From graphs in TP 108) P24+CC= c* = (P24-2Ia)/(P24-2Ia+2S) c*= Specific Peak Flow Rate (from fig 5.1 in TP 108) q*= Peak Flow Rate (m³/s) A*P24*q*/100 qp= Runoff Depth (mm) (P24-Ia)^2/(P24-Ia+S) Q24= Runoff Volume (m³) 1000*Q24*A/100 V24= TOTALS: WQV EDV 50% AEP+ 16.8%CC 20% AEP+ 16.8%CC 10% AEP+16.8%CC 1% AEP+16.8% CC Peak flow rate (m³/s): Runoff volume (m³): AVERAGE SLOPE BY END AREA METHOD Elevation (m) h (m) x (m) delta x (m) average h (m) delta A (m²) Sc = 0.042
24 Client: DFH Joint Venture Project: Graham Block Pokeno Job No: 1950 Designer: AJH Date: Revision: 1 STORMWATER PEAK FLOW RATE, RUNOFF DEPTH, AND RUNOFF VOLUME (ARC TP 108) SUMMARY OF RESULTS FOR: Graham Block and Upstream Catchment draining via southern stream (WQV check) WQV EDV 50% AEP+ 16.8%CC 20% AEP+ 16.8%CC 10% AEP+16.8%CC 1% AEP+16.8% CC Pre Development Peak flow rate (m³/s): Runoff volume (m³): Post Development Peak flow rate (m³/s): Runoff volume (m³): Difference Peak flow rate (m³/s): Runoff volume (m³):
25 Client: DFH Joint Venture Project: Graham Block Pokeno Job No: 1950 Designer: AJH Date: Revision: 1 STORMWATER PEAK FLOW RATE,RUNOFF DEPTH, AND RUNOFF VOLUME (ARC TP 108) CATCHMENT: TOTAL CATCHMENT AREA: SCENARIO: Graham Block and Upstream Catchment draining via southern stream (WQV check) PRE DEVELOPMENT Ha NOTE: This spreadsheet calculates stormwater peak flow rates using ARC TP 108, Graphical Method. PERVIOUS CATCHMENT Runoff Curve Number (CN) and Initial Abstraction (Ia): Soil Type Soil Classification Cover Description (cover type, treatment, hydrological cond.) Curve No. CN Area Ha CN * Area South Auckland Volcanic Field A-B Pasture South Auckland Volcanic Field A-B Bush Total Pervious= CN (weighted) = Total product / Total Area = 48.6 Ia (weighted) = 5.0 mm Time of Concentration: Channelisation Factor (choose C=0.6 piped or C=0.8 engineered grass channels) C= 0.8 (Averaged) Catchment Length (measured along drainage path) L= 0.92 km Catchment Slope (calculated by equal area method) Sc= m/m Runoff Factor = CN/(200-CN)= RF= 0.32 tc = 0.14*C*L^0.66*((CN/(200-CN))^-0.55*Sc^-0.30 = tc= 0.47 hrs min. of 0.17hrs to be used SCS lag for HEC-HMS = tp = 2/3*tc= tp= 0.32 hrs Graphical Peak Flow Rate: Soil Storage Parameter S = ((1000/CN)-10)*25.4= mm WQV EDV 50% AEP+ 16.8%CC 20% AEP+ 16.8%CC 10% AEP+16.8%CC 1% AEP+16.8% CC Av. recurrence interval ARI= 1/3 2yr EDV 2yr+CC 5yr+CC 10yr+CC 100yr+CC 24hr rainfall depth (mm) (From HIRDS) P24= hr rainfall depth+cc (mm) (+16.8%) P24+CC= c* = (P24-2Ia)/(P24-2Ia+2S) c*= Specific Peak Flow Rate (from fig 5.1 in TP 108) q*= Peak Flow Rate (m³/s) A*P24*q*/100 qp= Runoff Depth (mm) (P24-Ia)^2/(P24-Ia+S) Q24= Runoff Volume (m³) 1000*Q24*A/100 V24= IMPERVIOUS CATCHMENT Runoff Curve Number (CN) and Initial Abstraction (Ia): Soil Type Soil Classification Cover Description (cover type, treatment, hydrological cond.) Curve No. CN Area Ha CN * Area Pokeno B Existing Roofs and Access Tracks Total Impervious= CN (weighted) = Total product / Total Area = 98.0 Ia (weighted) = 0.0 Time of Concentration: Channelisation Factor (choose C=0.6 piped or C=0.8 engineered grass channels) C= 0.8 (Averaged) Catchment Length (measured along drainage path) L= 0.92 km Catchment Slope (calculated by equal area method) Sc= m/m Runoff Factor = CN/(200-CN)= RF= 0.96 tc = 0.14*C*L^0.66*((CN/(200-CN))^-0.55*Sc^-0.30 = tc= 0.26 hrs min. of 0.17hrs to be used SCS lag for HEC-HMS = tp = 2/3*tc= tp= 0.17 hrs Graphical Peak Flow Rate: Storage S = ((1000/CN)-10)*25.4= 5.2 mm WQV EDV 50% AEP+ 16.8%CC 20% AEP+ 16.8%CC 10% AEP+16.8%CC 1% AEP+16.8% CC Av. recurrence interval ARI= 1/3 2yr EDV 2yr+CC 5yr+CC 10yr+CC 100yr+CC 24hr rainfall depth (mm) (From graphs in TP 108) P24= hr rainfall depth+cc (mm) (From graphs in TP 108) P24+CC= c* = (P24-2Ia)/(P24-2Ia+2S) c*= Specific Peak Flow Rate (from fig 5.1 in TP 108) q*= Peak Flow Rate (m³/s) A*P24*q*/100 qp= Runoff Depth (mm) (P24-Ia)^2/(P24-Ia+S) Q24= Runoff Volume (m³) 1000*Q24*A/100 V24= TOTALS: WQV EDV 50% AEP+ 16.8%CC 20% AEP+ 16.8%CC 10% AEP+16.8%CC 1% AEP+16.8% CC Peak flow rate (m³/s): Runoff volume (m³): AVERAGE SLOPE BY END AREA METHOD Elevation (m) h (m) x (m) delta x (m) average h (m) delta A (m²) Sc = 0.054
26 Client: DFH Joint Venture Project: Graham Block Pokeno Job No: 1950 Designer: AJH Date: Revision: 1 STORMWATER PEAK FLOW RATE,RUNOFF DEPTH, AND RUNOFF VOLUME (ARC TP 108) CATCHMENT: TOTAL CATCHMENT AREA: SCENARIO: Graham Block and Upstream Catchment draining via southern stream (WQV check) POST DEVELOPMENT Ha NOTE: This spreadsheet calculates stormwater peak flow rates using ARC TP 108, Graphical Method. PERVIOUS CATCHMENT Runoff Curve Number (CN) and Initial Abstraction (Ia): Soil Type Soil Classification Cover Description (cover type, treatment, hydrological cond.) Curve No. CN Area Ha CN * Area South Auckland Volcanic Field A-B Pasture South Auckland Volcanic Field A-B Existing bush South Auckland Volcanic Field A-B Urban lawns South Auckland Volcanic Field A-B 20m wide planting strip along stream Total Pervious= CN (weighted) = Total product / Total Area = 48.4 Ia (weighted) = 5.0 mm Time of Concentration: Channelisation Factor (choose C=0.6 piped or C=0.8 engineered grass channels) C= 0.6 (Averaged) Catchment Length (measured along drainage path) L= 0.92 km Catchment Slope (calculated by equal area method) Sc= m/m Runoff Factor = CN/(200-CN)= RF= 0.32 tc = 0.14*C*L^0.66*((CN/(200-CN))^-0.55*Sc^-0.30 = tc= 0.36 hrs min. of 0.17hrs to be used SCS lag for HEC-HMS = tp = 2/3*tc= tp= 0.24 hrs Graphical Peak Flow Rate: Soil Storage Parameter S = ((1000/CN)-10)*25.4= mm WQV EDV 50% AEP+ 16.8%CC 20% AEP+ 16.8%CC 10% AEP+16.8%CC 1% AEP+16.8% CC Av. recurrence interval ARI= 1/3 2yr EDV 2yr+CC 5yr+CC 10yr+CC 100yr+CC 24hr rainfall depth (mm) (From graphs in TP 108) P24= hr rainfall depth+cc (mm) (From graphs in TP 108) P24+CC= c* = (P24-2Ia)/(P24-2Ia+2S) c*= Specific Peak Flow Rate (from fig 5.1 in TP 108) q*= Peak Flow Rate (m³/s) A*P24*q*/100 qp= Runoff Depth (mm) (P24-Ia)^2/(P24-Ia+S) Q24= Runoff Volume (m³) 1000*Q24*A/100 V24= IMPERVIOUS CATCHMENT Runoff Curve Number (CN) and Initial Abstraction (Ia): Soil Type Soil Classification Cover Description (cover type, treatment, hydrological cond.) Curve No. CN Area Ha CN * Area South Auckland Volcanic Field A-B Rural lots IA at 550m² each Total Impervious= CN (weighted) = Total product / Total Area = 98.0 Ia (weighted) = 0.0 Time of Concentration: Channelisation Factor (choose C=0.6 piped or C=0.8 engineered grass channels) C= 0.6 (Averaged) Catchment Length (measured along drainage path) L= 0.23 km Catchment Slope (calculated by equal area method) Sc= m/m Runoff Factor = CN/(200-CN)= RF= 0.96 tc = 0.14*C*L^0.66*((CN/(200-CN))^-0.55*Sc^-0.30 = tc= 0.17 hrs min. of 0.17hrs to be used SCS lag for HEC-HMS = tp = 2/3*tc= tp= 0.11 hrs Graphical Peak Flow Rate: Storage S = ((1000/CN)-10)*25.4= 5.2 mm WQV EDV 50% AEP+ 16.8%CC 20% AEP+ 16.8%CC 10% AEP+16.8%CC 1% AEP+16.8% CC Av. recurrence interval ARI= 1/3 2yr EDV 2yr+CC 5yr+CC 10yr+CC 100yr+CC 24hr rainfall depth (mm) (From graphs in TP 108) P24= hr rainfall depth+cc (mm) (From graphs in TP 108) P24+CC= c* = (P24-2Ia)/(P24-2Ia+2S) c*= Specific Peak Flow Rate (from fig 5.1 in TP 108) q*= Peak Flow Rate (m³/s) A*P24*q*/100 qp= Runoff Depth (mm) (P24-Ia)^2/(P24-Ia+S) Q24= Runoff Volume (m³) 1000*Q24*A/100 V24= TOTALS: WQV EDV 50% AEP+ 16.8%CC 20% AEP+ 16.8%CC 10% AEP+16.8%CC 1% AEP+16.8% CC Peak flow rate (m³/s): Runoff volume (m³): AVERAGE SLOPE BY END AREA METHOD Elevation (m) h (m) x (m) delta x (m) average h (m) delta A (m²) Sc = 0.054
27 Client: DFH Joint Venture Project: Graham Block Pokeno Job No: 1950 Designer: AJH Date: Revision: 1 STORMWATER PEAK FLOW RATE,RUNOFF DEPTH, AND RUNOFF VOLUME (ARC TP 108) CATCHMENT: Catchment draining via northern stream TOTAL CATCHMENT AREA: SCENARIO: EDV calculation Ha NOTE: This spreadsheet calculates stormwater peak flow rates using ARC TP 108, Graphical Method. PERVIOUS CATCHMENT Runoff Curve Number (CN) and Initial Abstraction (Ia): Soil Type Soil Classification Cover Description (cover type, treatment, hydrological cond.) Curve No. CN Area Ha CN * Area South Auckland Volcanic Field A-B Urban lawns (road reserve and accessways only) Total Pervious= CN (weighted) = Total product / Total Area = 74.0 Ia (weighted) = 5.0 mm Time of Concentration: Channelisation Factor (choose C=0.6 piped or C=0.8 engineered grass channels) C= 0.6 (Averaged) Catchment Length (measured along drainage path) L= 1.12 km Catchment Slope (calculated by equal area method) Sc= m/m Runoff Factor = CN/(200-CN)= RF= 0.59 tc = 0.14*C*L^0.66*((CN/(200-CN))^-0.55*Sc^-0.30 = tc= 0.31 hrs SCS lag for HEC-HMS = tp = 2/3*tc= tp= 0.21 hrs Graphical Peak Flow Rate: Soil Storage Parameter S = ((1000/CN)-10)*25.4= 89.2 mm WQV EDV 50% AEP+ 16.8%CC Av. recurrence interval ARI= 1/3 2yr EDV 2yr+CC 24hr rainfall depth (mm) (From graphs in TP 108) P24= hr rainfall depth+cc (mm) (From graphs in TP 108) P24+CC= c* = (P24-2Ia)/(P24-2Ia+2S) c*= 0.11 Specific Peak Flow Rate (from fig 5.1 in TP 108) q*= Peak Flow Rate (m³/s) A*P24*q*/100 qp= 0.01 Runoff Depth (mm) (P24-Ia)^2/(P24-Ia+S) Q24= 6.6 Runoff Volume (m³) 1000*Q24*A/100 V24= 61 IMPERVIOUS CATCHMENT Runoff Curve Number (CN) and Initial Abstraction (Ia): Soil Type Soil Classification Cover Description (cover type, treatment, hydrological cond.) Curve No. CN Area Ha CN * Area South Auckland Volcanic Field A-B Roading at 75% IA Total Impervious= CN (weighted) = Total product / Total Area = 98.0 Ia (weighted) = 0.0 Time of Concentration: Channelisation Factor (choose C=0.6 piped or C=0.8 engineered grass channels) C= 0.6 (Averaged) Catchment Length (measured along drainage path) L= 1.12 km Catchment Slope (calculated by equal area method) Sc= m/m Runoff Factor = CN/(200-CN)= RF= 0.96 tc = 0.14*C*L^0.66*((CN/(200-CN))^-0.55*Sc^-0.30 = tc= 0.24 hrs SCS lag for HEC-HMS = tp = 2/3*tc= tp= 0.16 hrs Graphical Peak Flow Rate: Storage S = ((1000/CN)-10)*25.4= 5.2 mm WQV EDV 50% AEP+ 16.8%CC Av. recurrence interval ARI= 1/3 2yr EDV 2yr+CC 24hr rainfall depth (mm) (From graphs in TP 108) P24= hr rainfall depth+cc (mm) (From graphs in TP 108) P24+CC= c* = (P24-2Ia)/(P24-2Ia+2S) c*= 0.76 Specific Peak Flow Rate (from fig 5.1 in TP 108) q*= Peak Flow Rate (m³/s) A*P24*q*/100 qp= 0.13 Runoff Depth (mm) (P24-Ia)^2/(P24-Ia+S) Q24= 28.4 Runoff Volume (m³) 1000*Q24*A/100 V24= 785 TOTALS: WQV EDV 50% AEP+ 16.8%CC Peak flow rate (m³/s): 0.14 Runoff volume (m³): 847 AVERAGE SLOPE BY END AREA METHOD Elevation (m) h (m) x (m) delta x (m) average h (m) delta A (m²) Sc = 0.042
28 Client: Project: DFH Joint Venture Graham Block Pokeno Job No: 1950 Designer: AJH Date: Revision: 1 Post-Development mitigated peak flow estimate - EDV storm Subcatchment Flow (m³/s) Northern Stream Pervious areas (from TP108 calculation) 0.10 Detention tanks 205 dwelling m³/s 0.04 Treatment forebays 847m³ 24hrs 3600s assumed peaking factor Bioretention Runoff calculations are based on 20% paved and 35% roof area. Total IA for residential lots = 8.888Ha. So total paved area = = Ha Flow from total impervious area of Ha from TP108 calculation = 0.66m³/s So peak flow = = 0.18m³/s Assume bioretention at 2% of catchment area provides no attenuation of peak flow (conservative) 0.18 Northern Stream Total 0.34 Southern Stream Pervious areas (from TP108 calculation) 0.09 Detention tanks 5 dwelling x m³/s 0.00 Bioretention 20% 55% Ha = 0.1 Ha impervious area 0.1Ha 0.275Ha 0.01m³/s = 0.00m³/s peak flow 0.00 Southern Stream Total 0.09
29 Client: DFH Joint Venture Project: Graham Block Pokeno Job No: 1950 Designer: AJH Date: Revision: 1 STORMWATER PEAK FLOW RATE,RUNOFF DEPTH, AND RUNOFF VOLUME (ARC TP 108) CATCHMENT: TOTAL CATCHMENT AREA: SCENARIO: Catchment draining via southern stream including "Lot 30" industrial for pipe capacity check Ha POST DEVELOPMENT TOTAL RUNOFF NOTE: This spreadsheet calculates stormwater peak flow rates using ARC TP 108, Graphical Method. PERVIOUS CATCHMENT Runoff Curve Number (CN) and Initial Abstraction (Ia): Soil Type Soil Classification Cover Description (cover type, treatment, hydrological cond.) Curve No. CN Area Ha CN * Area South Auckland Volcanic Field A-B Pasture South Auckland Volcanic Field A-B Bush South Auckland Volcanic Field A-B Urban lawns South Auckland Volcanic Field A-B Reserve Total Pervious= CN (weighted) = Total product / Total Area = 48.9 Ia (weighted) = 5.0 mm Time of Concentration: Channelisation Factor (choose C=0.6 piped or C=0.8 engineered grass channels) C= 0.6 (Averaged) Catchment Length (measured along drainage path) L= 0.92 km Catchment Slope (calculated by equal area method) Sc= m/m Runoff Factor = CN/(200-CN)= RF= 0.32 tc = 0.14*C*L^0.66*((CN/(200-CN))^-0.55*Sc^-0.30 = tc= 0.35 hrs min. of 0.17hrs to be used SCS lag for HEC-HMS = tp = 2/3*tc= tp= 0.24 hrs Graphical Peak Flow Rate: Soil Storage Parameter S = ((1000/CN)-10)*25.4= mm WQV EDV 50% AEP+ 16.8%CC 20% AEP+ 16.8%CC 10% AEP+16.8%CC 1% AEP+16.8% CC Av. recurrence interval ARI= 1/3 2yr EDV 2yr+CC 5yr+CC 10yr+CC 100yr+CC 24hr rainfall depth (mm) (From graphs in TP 108) P24= hr rainfall depth+cc (mm) (From graphs in TP 108) P24+CC= c* = (P24-2Ia)/(P24-2Ia+2S) c*= Specific Peak Flow Rate (from fig 5.1 in TP 108) q*= Peak Flow Rate (m³/s) A*P24*q*/100 qp= Runoff Depth (mm) (P24-Ia)^2/(P24-Ia+S) Q24= Runoff Volume (m³) 1000*Q24*A/100 V24= IMPERVIOUS CATCHMENT Runoff Curve Number (CN) and Initial Abstraction (Ia): Soil Type Soil Classification Cover Description (cover type, treatment, hydrological cond.) Curve No. CN Area Ha CN * Area South Auckland Volcanic Field A-B Lot 30 Industrial development at 90% IA South Auckland Volcanic Field A-B Rural lots IA at 550m² each Total Impervious= CN (weighted) = Total product / Total Area = 98.0 Ia (weighted) = 0.0 Time of Concentration: Channelisation Factor (choose C=0.6 piped or C=0.8 engineered grass channels) C= 0.6 (Averaged) Catchment Length (measured along drainage path) L= 0.23 km Catchment Slope (calculated by equal area method) Sc= m/m Runoff Factor = CN/(200-CN)= RF= 0.96 tc = 0.14*C*L^0.66*((CN/(200-CN))^-0.55*Sc^-0.30 = tc= 0.17 hrs min. of 0.17hrs to be used SCS lag for HEC-HMS = tp = 2/3*tc= tp= 0.11 hrs Graphical Peak Flow Rate: Storage S = ((1000/CN)-10)*25.4= 5.2 mm WQV EDV 50% AEP+ 16.8%CC 20% AEP+ 16.8%CC 10% AEP+16.8%CC 1% AEP+16.8% CC Av. recurrence interval ARI= 1/3 2yr EDV 2yr+CC 5yr+CC 10yr+CC 100yr+CC 24hr rainfall depth (mm) (From graphs in TP 108) P24= hr rainfall depth+cc (mm) (From graphs in TP 108) P24+CC= c* = (P24-2Ia)/(P24-2Ia+2S) c*= Specific Peak Flow Rate (from fig 5.1 in TP 108) q*= Peak Flow Rate (m³/s) A*P24*q*/100 qp= Runoff Depth (mm) (P24-Ia)^2/(P24-Ia+S) Q24= Runoff Volume (m³) 1000*Q24*A/100 V24= TOTALS: WQV EDV 50% AEP+ 16.8%CC 20% AEP+ 16.8%CC 10% AEP+16.8%CC 1% AEP+16.8% CC Peak flow rate (m³/s): Runoff volume (m³): AVERAGE SLOPE BY END AREA METHOD Elevation (m) h (m) x (m) delta x (m) average h (m) delta A (m²) Sc = 0.054
30 Client: DFH Joint Venture Project: Graham Block Pokeno Job No: 1950 Designer: AJH Date: Revision: 1 STORMWATER PEAK FLOW RATE,RUNOFF DEPTH, AND RUNOFF VOLUME (ARC TP 108) CATCHMENT: Catchment draining via northern stream TOTAL CATCHMENT AREA: SCENARIO: Ha POST DEVELOPMENT TOTAL RUNOFF NOTE: This spreadsheet calculates stormwater peak flow rates using ARC TP 108, Graphical Method. PERVIOUS CATCHMENT Runoff Curve Number (CN) and Initial Abstraction (Ia): Soil Type Soil Classification Cover Description (cover type, treatment, hydrological cond.) Curve No. CN Area Ha CN * Area South Auckland Volcanic Field A-B Pasture South Auckland Volcanic Field A-B Urban lawns South Auckland Volcanic Field A-B Replanted bush along stream South Auckland Volcanic Field A-B Reserve Total Pervious= CN (weighted) = Total product / Total Area = 63.5 Ia (weighted) = 5.0 mm Time of Concentration: Channelisation Factor (choose C=0.6 piped or C=0.8 engineered grass channels) C= 0.6 (Averaged) Catchment Length (measured along drainage path) L= 1.12 km Catchment Slope (calculated by equal area method) Sc= m/m Runoff Factor = CN/(200-CN)= RF= 0.46 tc = 0.14*C*L^0.66*((CN/(200-CN))^-0.55*Sc^-0.30 = tc= 0.36 hrs min. of 0.17hrs to be used SCS lag for HEC-HMS = tp = 2/3*tc= tp= 0.24 hrs Graphical Peak Flow Rate: Soil Storage Parameter S = ((1000/CN)-10)*25.4= mm WQV EDV 50% AEP+ 16.8%CC 20% AEP+ 16.8%CC 10% AEP+16.8%CC 1% AEP+16.8% CC Av. recurrence interval ARI= 1/3 2yr EDV 2yr+CC 5yr+CC 10yr+CC 100yr+CC 24hr rainfall depth (mm) (From graphs in TP 108) P24= hr rainfall depth+cc (mm) (From graphs in TP 108) P24+CC= c* = (P24-2Ia)/(P24-2Ia+2S) c*= Specific Peak Flow Rate (from fig 5.1 in TP 108) q*= Peak Flow Rate (m³/s) A*P24*q*/100 qp= Runoff Depth (mm) (P24-Ia)^2/(P24-Ia+S) Q24= Runoff Volume (m³) 1000*Q24*A/100 V24= IMPERVIOUS CATCHMENT Runoff Curve Number (CN) and Initial Abstraction (Ia): Soil Type Soil Classification Cover Description (cover type, treatment, hydrological cond.) Curve No. CN Area Ha CN * Area South Auckland Volcanic Field A-B Residential lots at 55% IA South Auckland Volcanic Field A-B Roading at 75% IA South Auckland Volcanic Field A-B Rural lots IA at 550m² each Total Impervious= CN (weighted) = Total product / Total Area = 98.0 Ia (weighted) = 0.0 Time of Concentration: Channelisation Factor (choose C=0.6 piped or C=0.8 engineered grass channels) C= 0.6 (Averaged) Catchment Length (measured along drainage path) L= 1.12 km Catchment Slope (calculated by equal area method) Sc= m/m Runoff Factor = CN/(200-CN)= RF= 0.96 tc = 0.14*C*L^0.66*((CN/(200-CN))^-0.55*Sc^-0.30 = tc= 0.24 hrs min. of 0.17hrs to be used SCS lag for HEC-HMS = tp = 2/3*tc= tp= 0.16 hrs Graphical Peak Flow Rate: Storage S = ((1000/CN)-10)*25.4= 5.2 mm WQV EDV 50% AEP+ 16.8%CC 20% AEP+ 16.8%CC 10% AEP+16.8%CC 1% AEP+16.8% CC Av. recurrence interval ARI= 1/3 2yr EDV 2yr+CC 5yr+CC 10yr+CC 100yr+CC 24hr rainfall depth (mm) (From graphs in TP 108) P24= hr rainfall depth+cc (mm) (From graphs in TP 108) P24+CC= c* = (P24-2Ia)/(P24-2Ia+2S) c*= Specific Peak Flow Rate (from fig 5.1 in TP 108) q*= Peak Flow Rate (m³/s) A*P24*q*/100 qp= Runoff Depth (mm) (P24-Ia)^2/(P24-Ia+S) Q24= Runoff Volume (m³) 1000*Q24*A/100 V24= TOTALS: WQV EDV 50% AEP+ 16.8%CC 20% AEP+ 16.8%CC 10% AEP+16.8%CC 1% AEP+16.8% CC Peak flow rate (m³/s): Runoff volume (m³): AVERAGE SLOPE BY END AREA METHOD Elevation (m) h (m) x (m) delta x (m) average h (m) delta A (m²) Sc = 0.042

31 XPSTORM 5 yr peak flows - SW Line 2 without in-stream storage.png

32 XPSTORM 5 yr peak flows - SW Line 5-14 to 5-7 without in-stream storage.png

33 XPSTORM 5 yr peak flows - SW Line 6-3 to 5-1 without in-stream storage.png
34 APPENDIX 3 On-Lot Detention Tank Sizing Practice Note HCC04 for On-Lot Bioretention
35 GRAHAM BLOCK, POKENO ON-LOT DETENTION TANK CALCULATOR INPUT Lot area (use 1000m² if lot is larger than 1000m²*) L = m² Roof area to allow for A = 0.35 L m² * Based on District Plan Rule * Other impervious areas to be treated by bioretention sized at 2% of catchment area. Refer to Practice Note HCC04. Required Reuse Volume U = 5.0 m³ Extended Detention Volume storm depth based on Infrastructure Technical Specification HIRDS 50% AEP 24 hr rainfall 70.4 mm +16.8% for climate change 82.2 mm EDV storm (= WQV 1.2, where WQV = 50% AEP/3) 0.4 i = 32.9 mm Runoff Coefficient based on Infrastructure Technical Specification C = 0.95 CALCULATE Required Detention volume = Runoff volume V = C i A 1000 = L 91.7 m³ CHOOSE tank diameter D = m CALCULATE Tank Detention Depth H = 1.27 V D² m CALCULATE Tank Reuse Depth H2 = 1.27 U D² m ALLOW FOR ADDITIONAL HEIGHT FOR THE SUMP AND TO FIT IN THE OVERFLOW PIPE - REFER TO THE TYPICAL DETAIL BELOW Target time to drain is 24 hours, however this requires small orifices prone to blockage. Use 10mm diameter orifice instead. NON-POTABLE WATER SUPPLY TO TOILETS AND LAUNDRY 'RAIN BANK" TANK TOPUP SYSTEM PUMP FOR WATER REUSE DIAMETER (D) MAINS WATER SUPPLY TESTABLE DOUBLE CHECK BACKFLOW PREVENTION DEVICE INFLOW FROM DOWN PIPES. FIRST FLUSH DIVERTER TO BE FITTED DETENTION DEPTH (H1) REUSE DEPTH (H2) PUMP INTAKE MIN 100mm Ø OVERFLOW STRAPS TO FIX PIPE TO MANHOLE OUTLET PIPE SIZED TO BUILDING CODE REQUIREMENTS SCREW CAP WITH 10mm Ø DETENTION ORIFICE 100mm MIN
36 Client: DFH Joint Venture Project: raham Block Pokeno Job No: 1950 Designer: AJH Date: Revision: 2 GRAHAM BLOCK, POKENO ON-LOT DETENTION TANK CALCULATOR - LARGE LOT EXAMPLE INPUT Lot area (use 1000m² if lot is larger than 1000m²*) L = 1000 m² Roof area to allow for A = 0.35 L 350 m² * Based on District Plan Rule * Other impervious areas to be treated by bioretention sized at 2% of catchment area. Refer to Practice Note HCC04. Required Reuse Volume U = 5.0 m³ Extended Detention Volume storm depth based on Infrastructure Technical Specification HIRDS 50% AEP 24 hr rainfall 70.4 mm +16.8% for climate change 82.2 mm EDV storm (= WQV 1.2, where WQV = 50% AEP/3 0.4 i = 32.9 mm Runoff Coefficient based on Infrastructure Technical Specification C = 0.95 CALCULATE Required Detention volume = Runoff volume V = C i A 1000 = L m³ CHOOSE tank diameter D = 3.6 m CALCULATE Tank Detention Depth H1 = 1.27 V D² 1.1 m CALCULATE Tank Reuse Depth H2 = 1.27 U D² 0.5 m ALLOW FOR ADDITIONAL HEIGHT FOR THE SUMP AND TO FIT IN THE OVERFLOW PIPE - REFER TO THE TYPICAL DETAIL BELOW Target time to drain is 24 hours, however this requires small orifices prone to blockage. Use 10mm diameter orifice instead. NON-POTABLE WATER SUPPLY TO TOILETS AND LAUNDRY 'RAIN BANK" TANK TOPUP SYSTEM PUMP FOR WATER REUSE DIAMETER (D) MAINS WATER SUPPLY TESTABLE DOUBLE CHECK BACKFLOW PREVENTION DEVICE INFLOW FROM DOWN PIPES. FIRST FLUSH DIVERTER TO BE FITTED DETENTION DEPTH (H1) REUSE DEPTH (H2) PUMP INTAKE MIN 100mm Ø OVERFLOW STRAPS TO FIX PIPE TO MANHOLE OUTLET PIPE SIZED TO BUILDING CODE REQUIREMENTS SCREW CAP WITH 10mm Ø DETENTION ORIFICE 100mm MIN
37 Client: DFH Joint Venture Project: Graham Block Pokeno Job No: 1950 Designer: AJH Date: Revision: 2 ON-LOT DETENTION TANKS - CHECK OF ACTUAL DRAIN TIME ORIFICE DIAMETER INCREASES WITH LOT SIZE AND DECREASES WITH DETENTION DEPTH CHECK ACTUAL DRAIN TIME FOR MAXIMUM IA (1000m² LOT) AND RELATIVELY SHALLOW TANK SIZE DETENTION TANKS INPUT Lot area (use 1000m² if lot is larger than 1000m²*) L = m² CALCULATE Required Detention volume = Runoff volume V = C i A 1000 = L m³ CHOOSE tank diameter D = m CALCULATE Tank Detention Depth H1 = 1.27 V D² m CHECK ACTUAL DRAIN TIME Orifice diameter Check if 10mm is always suitable: mm Coefficient of discharge Cd Orifice area = π(diameter 1000)² E E E E-05 m² Average head = H m Average flow rate =Cd orifice area SQRT( average hea m³/s Actual time to discharge detention volume = V average flow rate hrs Maximum flow rate =Cd orifice area SQRT( H) m³/s CONCLUSION: Typical lot size is 600m² - to avoid draining in less than 24 hrs these lots require an orifice smaller than 10mm, which is prone to blockage To need a larger orifice diameter the tanks would need to be shallower and therefore impractically large The largest orifices would be required by the largest lots, but even for these, drain time does not exceed 24 hours for a 10mm orifice unless tanks are very large and very shallow. So use a standard 10mm orifice diameter in all cases.


38 THREE WATERS MANAGEMENT PRACTICE NOTE HCC 04: Bioretention systems (Raingardens) 1. INTRODUCTION This practice note 1 has been developed to provide general information on the minimum design and sizing requirements for bioretention systems which are used in residential and non-residential applications for on-site stormwater management. Design information is provided for a bioretention device designed to provide full water quality treatment and extended detention, and also for a bioretention reduced atsource measure sized for a smaller contributing catchment, refer to Sections 2 and 3 below. A raingarden is essentially a sunken garden with good well drained soil and an underdrain to which stormwater is directed. Tree pits which are used for planting trees along streets can also be used for bioretention as long as they are designed with an appropriate underdrainage system. 1.1 Bioretention systems Bioretention systems are specially designed garden beds which filter stormwater runoff from surrounding areas or from stormwater pipes. Bioretention is widely accepted as one of the best stormwater management practices. It makes uses of the chemical, biological and physical properties of plants, microbes and soils and is an effort to mimic nature. Plants in a bioretention system transpire some of the water that is directed into it back into the atmosphere. Unlined bioretention systems allow infiltration of stormwater into the underlying soils, hence volume reduction. Bioretention devices also provide water quality treatment through the filtering that occurs through the soil media layer. A bioretention swale is a long narrow sloping swale with a bioretention system along the base of the swale. It can be used to convey as well as treat stormwater. In this practice note, bioretention encompasses a number of different devices, including: - Raingardens - Bio-retention swales - Stormwater planters, and - Tree pits. A stormwater planter is an above ground garden in a large container with bioretention soil media and an underdrain to which stormwater is directed. 1.2 Advantages of a bioretention system Bioretention offers a number of benefits which is why it is one of the preferred methods for on-site stormwater management. The benefits include: Improved water quality by treating and filtering out contaminants. Improved hydrological response of stormwater peak flow and volume, especially for smaller rainfall events. Providing amenity and increased vegetative cover. Utilises the same space as is normally used for gardens. Providing better growing conditions (free draining soils) for plants and thus improves the garden, and Mimics nature and uses natural processes. 1 Three Waters Management Practice Notes are Hamilton City Council controlled documents and will be subject to ongoing review. The latest version can be downloaded from the Hamilton City Council website: HCC 04: Bioretention System Revision 3 12/09/2016

39 2. BIORETENTION FULL TREATMENT 2.1 Minimum design requirements The following information is intended as a guide only. All bioretention systems within Hamilton City require specific design by a suitably qualified person and approval from Hamilton City Council s Building Control Unit. General design requirements are presented below. Figure 1 presents the typical layers within a bioretention system: 1. Size and shape: Bioretention systems can be any shape. Shapes that blend in with the site can improve site amenity and look more natural. Bioretention systems are to be designed to cater to stormwater runoff from impermeable areas at your property. The bioretention system size refers to the AREA that is filled with planting soil mix and should be sized so that it has an area equivalent to 2% of the impermeable area draining it to provide water quality treatment, or 5% if providing extended detention and water quality treatment. The minimum size for a bioretention system is 2m Location: Devices should be located so that stormwater can flow to the device under gravity. The bulk and location of the bioretention system shall be in accordance with the requirements for onsite soakage systems, including being above the winter high water table Inlet design: Good inlet design is essential for a bioretention systems to work. The most important thing to consider is that the water must be able to flow into the device. Flow should be directed into the device in a sheet flow over a vegetated filter strip if possible, and should always flow into the device in a manner which avoids concentrated flows and scour. If possible high flows should bypass the device. For household raingardens the inlet can be provided with a factory made PVC flow spreader, a cost effective option. 4. Planting soil mix: The main component of the bioretention system is the planting soil mix (refer to Section 4 for more details). The minimum soil depth is 600mm (500mm of planting soil mix and 100mm transition layer) which should be increased to at least 1m when trees are planted. For rain gardens, stormwater planters and tree pits the surface of the planting soil should be flat and level to avoid localised ponding and blinding, while for bioretention swales the surface should be gently sloping. Soil compaction should be avoided, allowing natural compaction only. Install materials in 300mm layers and soak with water to aid natural compaction. Depending on the soil material, up to 20% natural compaction may occur over time. 5. Plants: Native plants are preferable but not essential. Any plants which suit your garden may be used. The plants should be able to tolerate short periods of inundation and longer dry periods, be perennial rather than annual, have deep fibrous root systems and have spreading rather than clumped growth forms. 2 Refer to Practice Note HCC 03: Soakage 04-2 HCC 04: Bioretention System Revision 3 12/09/2016 Note that the use of wetland plants is not recommended as these plants are not well suited to free draining soils. 6. Mulch: mm surface mulch layer. Note that the depth of mulch should be taken into account when setting the overflow level. Ensuring stormwater runoff doesn t wash mulch into drains and cause blockages can be addressed by good device design and selection of a mulch material that doesn t float. 7. Under drain: Bioretention systems typically require under drains. The under drain should be a perforated PVC pipe with a minimum diameter of 100mm and should have a minimum slope of 0.5% (5cm over 10m). For bioretention areas up to 10m 2 a single 100mm diameter pipe will suffice, for areas between 10m 2 and 20m 2 a single 150mm or two 100mm diameter pipes will suffice. For areas larger than 20m 2 a site specific design is required. Under drain spacing - there should be one under drain per 3m width of bioretention system. Under drains should be evenly spaced along the length of the device. They should be placed 75 to 300mm above the bottom of the drainage layer where no liner is present to allow for infiltration into the in-situ soils, or on top of the liner if one is used. There should be at least 25mm of drainage layer above the top of the under drain. The underdrain shall be connected an approved stormwater outfall in accordance with Council s drainage hierarchy. 8. Liner: An impervious liner is required when bioretention is used in geotechnically unstable or steep sites greater than 1V:5H. The use of stormwater planters should be considered in these situations. 9. Geofabric: The use of geofabric in the construction of bioretention systems is generally not recommended. Figure 1: Typical bioretention layers (images here and above from NSCC Bioretention Guidelines July 2008) 10. Root barrier: Consider using a root barrier when there are susceptible services such (as sewers), or foundations nearby. These are likely to be at risk from root penetration. The root barrier should only be placed adjacent to the services which require protection and not around the whole device. 11. Filter layer: A filter layer is required between the planting soil and the drainage layer. A geofabric is not recommended for this purpose. The filter zone should consist of 50mm of pea-gravel (US #8 (1.18mm - 9.5mm) with 50mm of washed sand (0.5mm 1mm) on top. 12. Ponding depth: Ponding should normally be designed for a depth of mm above the bed of the device. 13. Overflow: Ideally, when the capacity of the rain garden is exceeded, flows should be by-passed to an overflow located outside the rain garden. If an overflow is located within the rain garden then the overflow can be by means of a pipe/manhole which connects into the underdrain system, or it could be a gravel curtain which connects into the drainage layer. For household raingardens the overflow can be provided as a 100mm vertical pipe connecting to the underdrain with an elbow bend. When the raingarden is finished the overflow pipe should sit 100mm below the top edge of the raingarden and 100mm above the mulch level. Apply a cap or tape the top of the overflow pipe during construction to prevent debris entering the underdrain. 14. Access: Suitable access needs to be provided for routine maintenance. Small residential gardens may require access for a wheel barrow, while larger commercial gardens will require more substantial access, suitable for a small excavator.
40 3. BIORETENTION REDUCED AT-SOURCE MEASURE If there is an approved downstream stormwater management device providing stormwater flow attenuation and stormwater quality treatment for your site, you can provide bioretention on-lot designed as a reduced at-source measure only, referred to bioretention reduced (refer to HCC01 Overview for further discussion about this topic). 3.1 Minimum design requirements The following information is intended as a guide only. All bioretention systems within Hamilton City require specific design by a suitably qualified person and approval from Hamilton City Council s Building Control Unit. A bioretention reduced device should be designed in accordance with the minimum design requirements described above for the bioretention full treatment device, except the size of the reduced device is assessed differently, as outlined below: a) The bioretention reduced device is designed to cater to stormwater runoff from impermeable areas where cars drive and park at your property. The bioretention reduced device should be sized so that it has an AREA equivalent to 2% of the impermeable trafficked areas draining to it (i.e. roof area does not need to drain to a bioretention reduced device). The device should be located in such a way to maximise the collection of site runoff from trafficked areas. Refer to Figure 2 below for an indicative schematic of the typical arrangement for a bioretention reduced device. Ensure overflow from the device drains to approved overland flowpath. b) Refer to Section 2.1 Minimum design requirements for all other details. c) It is important to ensure the bioretention device is above the winter high water table as per 2 in Section 2.1 above. Figure 2: Schematic showing typical arrangement for bioretention reduced 3.2 Example The following example clarifies how to size a bioretention reduced device for a 500m 2 lot with: 250m 2 house and garage 125m 2 driveway and associated hardstand area (all trafficked) 04-3 HCC 04: Bioretention System Revision 3 12/09/2016 The bioretention reduced device is designed to cater to stormwater runoff from impervious areas where cars drive and park. For this site this equates to 125m 2. The bioretention reduced device is sized to have an area equivalent to 2% of the contributing catchment. Area of bioretention device = 125m 2 x 2% = 2.5m 2 The remaining design parameters for the bioretention reduced device are determined in accordance with Section 2.1 of this practice note - Minimum design requirements. 3.3 Indicative bioretention reduced device sizings The following table outlines indicative bioretention reduced device sizings for a range of connected impervious areas: Lot area (m 2 ) Bioretention reduced area (m 2 ) BIORETENTION FILTER MEDIA The bioretention filter media is required to support a range of plants (groundcovers to trees) that are adapted to freely draining soils with occasional flooding. The filter media should generally be a loamy sand with high permeability under compaction and should be free of rubbish and weeds. The filter media should contain some organic matter for increased water holding capacity but be low in nutrient content. General specifications for bioretention filter media are listed below: A mix of mature compost (approximately 15-25%), soil (approximately 15-25%) and sand (approximately 60%) is recommended. Allophanic (Ash) or Pumice Soils are preferred. Poorly structured clay or silty clay soils should not be used. Pumice sand is preferred. A uniform mix, free of stones, stumps, roots or other similar objects and free of brush or seeds from noxious plants. Hydraulic conductivity of mm/hr Organic matter content at least 2% (w/w) Seed germination score of 6 (out of 7) ph range CONSTRUCTION Ideally bioretention systems should not be built until the rest of the site has been constructed and the site stabilised. They must be protected from stormwater flows carrying high sediment loads during construction activities from your site or neighbouring sites. If they are not protected during construction then the planting soil mix will need to be replaced. If work on the bioretention system needs to commence before the rest of the site is stabilised then the device should be constructed, but not planted, and covered with a geofabric and topsoil. This will later be removed and the device planted once the rest of the site has been stabilised. 6. MAINTENANCE One of the important considerations with bioretention systems is long-term maintenance. Remember that a bioretention system is a garden and not just a drainage system they are generally low maintenance, not NO maintenance. They need water when it doesn t rain until the plants are established. During dry periods the under drain in the bioretention systems may cause the planting soil to dry out. Watering the vegetation on an as needed basis helps ensure a healthy condition and appearance. Mulch annually with hardwood mulch as this suppresses weeds and retains moisture. Every few years excess mulch may need to be removed. Weed regularly as you would with any garden. Don t park or drive on the device as this causes compaction and leaves ruts. Don t let (fine) sediment build up if a crust forms remove it & rework the top layer of soil. Keep an eye on the plants if they are unhappy they may need moving. Plants may need pruning, thinning or replacing from time to time. Strong water flows may cause erosion, this will need to be repaired and measures put in place to prevent recurrence. Check the overflow for clogging and remove any build-up of rubbish or debris regularly. 7. SUMMARY OF PLANNING REQUIREMENTS Your bioretention system must be consented either as part of the whole site s building consent or as a separate building consent. For details on building consents please contact Hamilton City Council s Building Control Unit phone (07) Bioretention systems are required to be designed by a suitably qualified person based on this practice note, council s Infrastructure Technical Guideline and other best practice guidance. As-laid plans, authorised by a registered installer, are required for the drainage components of the bioretention system and shall be provided to council.
41 APPENDIX 4 Pond J Sizing Comparison
42 Client: DFH Joint Venture Project: Graham Block Pokeno Job No: 1950 Designer: AJH Date: Revision: 1 STORMWATER PEAK FLOW RATE,RUNOFF DEPTH, AND RUNOFF VOLUME (ARC TP 108) CATCHMENT: TOTAL CATCHMENT AREA: SCENARIO: Total Pond J catchment as per original design Ha Original Pond J design storms NOTE: This spreadsheet calculates stormwater peak flow rates using ARC TP 108, Graphical Method. PERVIOUS CATCHMENT Runoff Curve Number (CN) and Initial Abstraction (Ia): Soil Type Soil Classification Cover Description (cover type, treatment, hydrological cond.) Curve No. CN Area Ha CN * Area South Auckland Volcanic Field B Rural Residential South Auckland Volcanic Field B Residential South Auckland Volcanic Field B Industrial South Auckland Volcanic Field B Bush Total Pervious= CN (weighted) = Total product / Total Area = 69.0 Ia (weighted) = 5.0 mm Time of Concentration: Channelisation Factor (choose C=0.6 piped or C=0.8 engineered grass channels) C= 0.8 (Averaged) Catchment Length (measured along drainage path) L= 1.40 km Catchment Slope (calculated by equal area method) Sc= m/m Runoff Factor = CN/(200-CN)= RF= 0.53 tc = 0.14*C*L^0.66*((CN/(200-CN))^-0.55*Sc^-0.30 = tc= 0.51 hrs min. of 0.17hrs to be used SCS lag for HEC-HMS = tp = 2/3*tc= tp= 0.34 hrs Graphical Peak Flow Rate: Soil Storage Parameter S = ((1000/CN)-10)*25.4= mm WQV 2 yr 10yr 100yr 30mm Av. recurrence interval ARI= 1/3 2yr 2 yr 10yr 100yr 30mm 24hr rainfall depth (mm) (+16.8%) P24+CC= c* = (P24-2Ia)/(P24-2Ia+2S) c*= Specific Peak Flow Rate (from fig 5.1 in TP 108) q*= Peak Flow Rate (m³/s) A*P24*q*/100 qp= Runoff Depth (mm) (P24-Ia)^2/(P24-Ia+S) Q24= Runoff Volume (m³) 1000*Q24*A/100 V24= IMPERVIOUS CATCHMENT Runoff Curve Number (CN) and Initial Abstraction (Ia): Soil Type Soil Classification Cover Description (cover type, treatment, hydrological cond.) Curve No. CN Area Ha CN * Area South Auckland Volcanic Field B Rural Residential South Auckland Volcanic Field B Residential South Auckland Volcanic Field B Industrial Total Impervious= CN (weighted) = Total product / Total Area = 98.0 Ia (weighted) = 0.0 Time of Concentration: Channelisation Factor (choose C=0.6 piped or C=0.8 engineered grass channels) C= 0.8 (Averaged) Catchment Length (measured along drainage path) L= 1.4 km Catchment Slope (calculated by equal area method) Sc= m/m Runoff Factor = CN/(200-CN)= RF= 0.96 tc = 0.14*C*L^0.66*((CN/(200-CN))^-0.55*Sc^-0.30 = tc= 0.36 hrs min. of 0.17hrs to be used SCS lag for HEC-HMS = tp = 2/3*tc= tp= 0.24 hrs Graphical Peak Flow Rate: Storage S = ((1000/CN)-10)*25.4= 5.2 mm WQV 2 yr 10yr 100yr 30mm Av. recurrence interval ARI= 1/3 2yr 2 yr 10yr 100yr 30mm 24hr rainfall depth (mm) (From graphs in TP 108) P24+CC= c* = (P24-2Ia)/(P24-2Ia+2S) c*= Specific Peak Flow Rate (from fig 5.1 in TP 108) q*= Peak Flow Rate (m³/s) A*P24*q*/100 qp= Runoff Depth (mm) (P24-Ia)^2/(P24-Ia+S) Q24= Runoff Volume (m³) 1000*Q24*A/100 V24= TOTALS: WQV 2 yr 10yr 100yr 30mm 0 Peak flow rate (m³/s): Runoff volume (m³):
43 Client: DFH Joint Venture Project: Graham Block Pokeno Job No: 1950 Designer: AJH Date: Revision: 1 STORMWATER PEAK FLOW RATE,RUNOFF DEPTH, AND RUNOFF VOLUME (ARC TP 108) CATCHMENT: Total Pond J catchment as per original design TOTAL CATCHMENT AREA: SCENARIO: Current ITS design storms Ha NOTE: This spreadsheet calculates stormwater peak flow rates using ARC TP 108, Graphical Method. PERVIOUS CATCHMENT Runoff Curve Number (CN) and Initial Abstraction (Ia): Soil Type Soil Classification Cover Description (cover type, treatment, hydrological cond.) Curve No. CN Area Ha CN * Area South Auckland Volcanic Field B Rural Residential South Auckland Volcanic Field B Residential South Auckland Volcanic Field B Industrial South Auckland Volcanic Field B Bush Total Pervious= CN (weighted) = Total product / Total Area = 69.0 Ia (weighted) = 5.0 mm Time of Concentration: Channelisation Factor (choose C=0.6 piped or C=0.8 engineered grass channels) C= 0.8 (Averaged) Catchment Length (measured along drainage path) L= 1.40 km Catchment Slope (calculated by equal area method) Sc= m/m Runoff Factor = CN/(200-CN)= RF= 0.53 tc = 0.14*C*L^0.66*((CN/(200-CN))^-0.55*Sc^-0.30 = tc= 0.51 hrs min. of 0.17hrs to be used SCS lag for HEC-HMS = tp = 2/3*tc= tp= 0.34 hrs Graphical Peak Flow Rate: Soil Storage Parameter S = ((1000/CN)-10)*25.4= mm WQV EDV 50% AEP+ 16.8%CC 20% AEP+ 16.8%CC 10% AEP+16.8%CC 1% AEP+16.8% CC Av. recurrence interval ARI= 1/3 2yr EDV 2yr+CC 5yr+CC 10yr+CC 100yr+CC 24hr rainfall depth (mm) (From graphs in TP 108) P24= hr rainfall depth+cc (mm) (From graphs in TP 108) P24+CC= c* = (P24-2Ia)/(P24-2Ia+2S) c*= Specific Peak Flow Rate (from fig 5.1 in TP 108) q*= Peak Flow Rate (m³/s) A*P24*q*/100 qp= Runoff Depth (mm) (P24-Ia)^2/(P24-Ia+S) Q24= Runoff Volume (m³) 1000*Q24*A/100 V24= IMPERVIOUS CATCHMENT Runoff Curve Number (CN) and Initial Abstraction (Ia): Soil Type Soil Classification Cover Description (cover type, treatment, hydrological cond.) Curve No. CN Area Ha CN * Area South Auckland Volcanic Field B Rural Residential South Auckland Volcanic Field B Residential South Auckland Volcanic Field B Industrial Total Impervious= CN (weighted) = Total product / Total Area = 98.0 Ia (weighted) = 0.0 Time of Concentration: Channelisation Factor (choose C=0.6 piped or C=0.8 engineered grass channels) C= 0.8 (Averaged) Catchment Length (measured along drainage path) L= 1.40 km Catchment Slope (calculated by equal area method) Sc= m/m Runoff Factor = CN/(200-CN)= RF= 0.96 tc = 0.14*C*L^0.66*((CN/(200-CN))^-0.55*Sc^-0.30 = tc= 0.36 hrs min. of 0.17hrs to be used SCS lag for HEC-HMS = tp = 2/3*tc= tp= 0.24 hrs Graphical Peak Flow Rate: Storage S = ((1000/CN)-10)*25.4= 5.2 mm WQV EDV 50% AEP+ 16.8%CC 20% AEP+ 16.8%CC 10% AEP+16.8%CC 1% AEP+16.8% CC Av. recurrence interval ARI= 1/3 2yr EDV 2yr+CC 5yr+CC 10yr+CC 100yr+CC 24hr rainfall depth (mm) (From graphs in TP 108) P24= hr rainfall depth+cc (mm) (From graphs in TP 108) P24+CC= c* = (P24-2Ia)/(P24-2Ia+2S) c*= Specific Peak Flow Rate (from fig 5.1 in TP 108) q*= Peak Flow Rate (m³/s) A*P24*q*/100 qp= Runoff Depth (mm) (P24-Ia)^2/(P24-Ia+S) Q24= Runoff Volume (m³) 1000*Q24*A/100 V24= TOTALS: WQV EDV 50% AEP+ 16.8%CC 20% AEP+ 16.8%CC 10% AEP+16.8%CC 1% AEP+16.8% CC Peak flow rate (m³/s): Runoff volume (m³): AVERAGE SLOPE BY END AREA METHOD Elevation (m) h (m) x (m) delta x (m) average h (m) delta A (m²) Sc = 0.042
44 Client: DFH Joint Venture Project: Graham Block Pokeno Job No: 1950 Designer: AJH Date: Revision: 1 STORMWATER PEAK FLOW RATE,RUNOFF DEPTH, AND RUNOFF VOLUME (ARC TP 108) CATCHMENT: Total Pond J catchment post development TOTAL CATCHMENT AREA: SCENARIO: Current ITS design storms Ha NOTE: This spreadsheet calculates stormwater peak flow rates using ARC TP 108, Graphical Method. PERVIOUS CATCHMENT Runoff Curve Number (CN) and Initial Abstraction (Ia): Soil Type Soil Classification Cover Description (cover type, treatment, hydrological cond.) Curve No. CN Area Ha CN * Area South Auckland Volcanic Field B Rural Residential South Auckland Volcanic Field B Residential South Auckland Volcanic Field B Industrial South Auckland Volcanic Field B Bush Total Pervious= CN (weighted) = Total product / Total Area = 69.0 Ia (weighted) = 5.0 mm Time of Concentration: Channelisation Factor (choose C=0.6 piped or C=0.8 engineered grass channels) C= 0.8 (Averaged) Catchment Length (measured along drainage path) L= 1.40 km Catchment Slope (calculated by equal area method) Sc= m/m Runoff Factor = CN/(200-CN)= RF= 0.53 tc = 0.14*C*L^0.66*((CN/(200-CN))^-0.55*Sc^-0.30 = tc= 0.51 hrs min. of 0.17hrs to be used SCS lag for HEC-HMS = tp = 2/3*tc= tp= 0.34 hrs Graphical Peak Flow Rate: Soil Storage Parameter S = ((1000/CN)-10)*25.4= mm WQV EDV 50% AEP+ 16.8%CC 20% AEP+ 16.8%CC 10% AEP+16.8%CC 1% AEP+16.8% CC Av. recurrence interval ARI= 1/3 2yr EDV 2yr+CC 5yr+CC 10yr+CC 100yr+CC 24hr rainfall depth (mm) (From graphs in TP 108) P24= hr rainfall depth+cc (mm) (From graphs in TP 108) P24+CC= c* = (P24-2Ia)/(P24-2Ia+2S) c*= Specific Peak Flow Rate (from fig 5.1 in TP 108) q*= Peak Flow Rate (m³/s) A*P24*q*/100 qp= Runoff Depth (mm) (P24-Ia)^2/(P24-Ia+S) Q24= Runoff Volume (m³) 1000*Q24*A/100 V24= IMPERVIOUS CATCHMENT Runoff Curve Number (CN) and Initial Abstraction (Ia): Soil Type Soil Classification Cover Description (cover type, treatment, hydrological cond.) Curve No. CN Area Ha CN * Area South Auckland Volcanic Field B Rural Residential South Auckland Volcanic Field B Residential South Auckland Volcanic Field B Industrial Total Impervious= CN (weighted) = Total product / Total Area = 98.0 Ia (weighted) = 0.0 Time of Concentration: Channelisation Factor (choose C=0.6 piped or C=0.8 engineered grass channels) C= 0.8 (Averaged) Catchment Length (measured along drainage path) L= 1.40 km Catchment Slope (calculated by equal area method) Sc= m/m Runoff Factor = CN/(200-CN)= RF= 0.96 tc = 0.14*C*L^0.66*((CN/(200-CN))^-0.55*Sc^-0.30 = tc= 0.36 hrs min. of 0.17hrs to be used SCS lag for HEC-HMS = tp = 2/3*tc= tp= 0.24 hrs Graphical Peak Flow Rate: Storage S = ((1000/CN)-10)*25.4= 5.2 mm WQV EDV 50% AEP+ 16.8%CC 20% AEP+ 16.8%CC 10% AEP+16.8%CC 1% AEP+16.8% CC Av. recurrence interval ARI= 1/3 2yr EDV 2yr+CC 5yr+CC 10yr+CC 100yr+CC 24hr rainfall depth (mm) (From graphs in TP 108) P24= hr rainfall depth+cc (mm) (From graphs in TP 108) P24+CC= c* = (P24-2Ia)/(P24-2Ia+2S) c*= Specific Peak Flow Rate (from fig 5.1 in TP 108) q*= Peak Flow Rate (m³/s) A*P24*q*/100 qp= Runoff Depth (mm) (P24-Ia)^2/(P24-Ia+S) Q24= Runoff Volume (m³) 1000*Q24*A/100 V24= TOTALS: WQV EDV 50% AEP+ 16.8%CC 20% AEP+ 16.8%CC 10% AEP+16.8%CC 1% AEP+16.8% CC Peak flow rate (m³/s): Runoff volume (m³): AVERAGE SLOPE BY END AREA METHOD Elevation (m) h (m) x (m) delta x (m) average h (m) delta A (m²) Sc = 0.042
 CATCHMENT: Total Pond J catchment post development TOTAL CATCHMENT AREA: SCENARIO: 106.")
45 Client: DFH Joint Venture Project: Graham Block Pokeno Job No: 1950 Designer: AJH Date: Revision: 1 STORMWATER PEAK FLOW RATE,RUNOFF DEPTH, AND RUNOFF VOLUME (ARC TP 108) CATCHMENT: Total Pond J catchment post development TOTAL CATCHMENT AREA: SCENARIO: Ha Original Pond J design storms NOTE: This spreadsheet calculates stormwater peak flow rates using ARC TP 108, Graphical Method. PERVIOUS CATCHMENT Runoff Curve Number (CN) and Initial Abstraction (Ia): Soil Type Soil Classification Cover Description (cover type, treatment, hydrological cond.) Curve No. CN Area Ha CN * Area South Auckland Volcanic Field B Rural Residential South Auckland Volcanic Field B Residential South Auckland Volcanic Field B Industrial South Auckland Volcanic Field B Bush Total Pervious= CN (weighted) = Total product / Total Area = 69.0 Ia (weighted) = 5.0 mm Time of Concentration: Channelisation Factor (choose C=0.6 piped or C=0.8 engineered grass channels) C= 0.8 (Averaged) Catchment Length (measured along drainage path) L= 1.40 km Catchment Slope (calculated by equal area method) Sc= m/m Runoff Factor = CN/(200-CN)= RF= 0.53 tc = 0.14*C*L^0.66*((CN/(200-CN))^-0.55*Sc^-0.30 = tc= 0.51 hrs min. of 0.17hrs to be used SCS lag for HEC-HMS = tp = 2/3*tc= tp= 0.34 hrs Graphical Peak Flow Rate: Soil Storage Parameter S = ((1000/CN)-10)*25.4= mm WQV 2 yr 10yr 100yr 30mm Av. recurrence interval ARI= 1/3 2yr 2 yr 10yr 100yr 30mm 24hr rainfall depth (mm) (From graphs in TP 108) P24+CC= c* = (P24-2Ia)/(P24-2Ia+2S) c*= Specific Peak Flow Rate (from fig 5.1 in TP 108) q*= Peak Flow Rate (m³/s) A*P24*q*/100 qp= Runoff Depth (mm) (P24-Ia)^2/(P24-Ia+S) Q24= Runoff Volume (m³) 1000*Q24*A/100 V24= IMPERVIOUS CATCHMENT Runoff Curve Number (CN) and Initial Abstraction (Ia): Soil Type Soil Classification Cover Description (cover type, treatment, hydrological cond.) Curve No. CN Area Ha CN * Area South Auckland Volcanic Field B Rural Residential South Auckland Volcanic Field B Residential South Auckland Volcanic Field B Industrial Total Impervious= CN (weighted) = Total product / Total Area = 98.0 Ia (weighted) = 0.0 Time of Concentration: Channelisation Factor (choose C=0.6 piped or C=0.8 engineered grass channels) C= 0.8 (Averaged) Catchment Length (measured along drainage path) L= 1.40 km Catchment Slope (calculated by equal area method) Sc= m/m Runoff Factor = CN/(200-CN)= RF= 0.96 tc = 0.14*C*L^0.66*((CN/(200-CN))^-0.55*Sc^-0.30 = tc= 0.36 hrs min. of 0.17hrs to be used SCS lag for HEC-HMS = tp = 2/3*tc= tp= 0.24 hrs Graphical Peak Flow Rate: Storage S = ((1000/CN)-10)*25.4= 5.2 mm WQV 2 yr 10yr 100yr 30mm Av. recurrence interval ARI= 1/3 2yr 2 yr 10yr 100yr 30mm 24hr rainfall depth (mm) (From graphs in TP 108) P24= 24hr rainfall depth (mm) (From graphs in TP 108) P24+CC= c* = (P24-2Ia)/(P24-2Ia+2S) c*= Specific Peak Flow Rate (from fig 5.1 in TP 108) q*= Peak Flow Rate (m³/s) A*P24*q*/100 qp= Runoff Depth (mm) (P24-Ia)^2/(P24-Ia+S) Q24= Runoff Volume (m³) 1000*Q24*A/100 V24= TOTALS: WQV 2 yr 10yr 100yr 30mm Peak flow rate (m³/s): Runoff volume (m³): AVERAGE SLOPE BY END AREA METHOD Elevation (m) h (m) x (m) delta x (m) average h (m) delta A (m²) Sc = 0.042
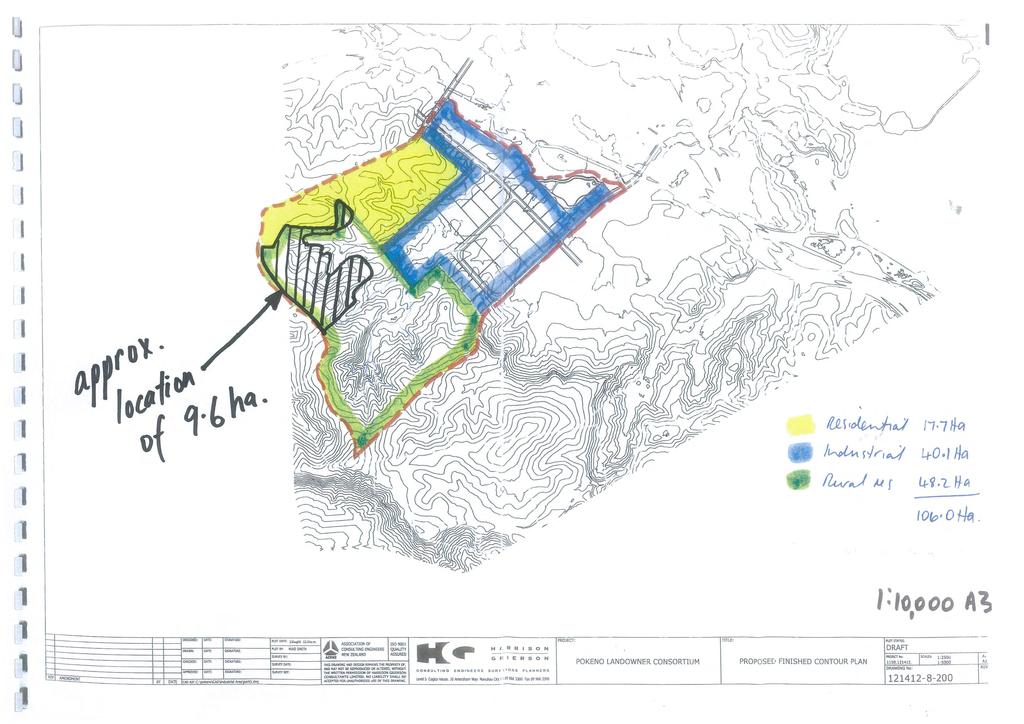
46
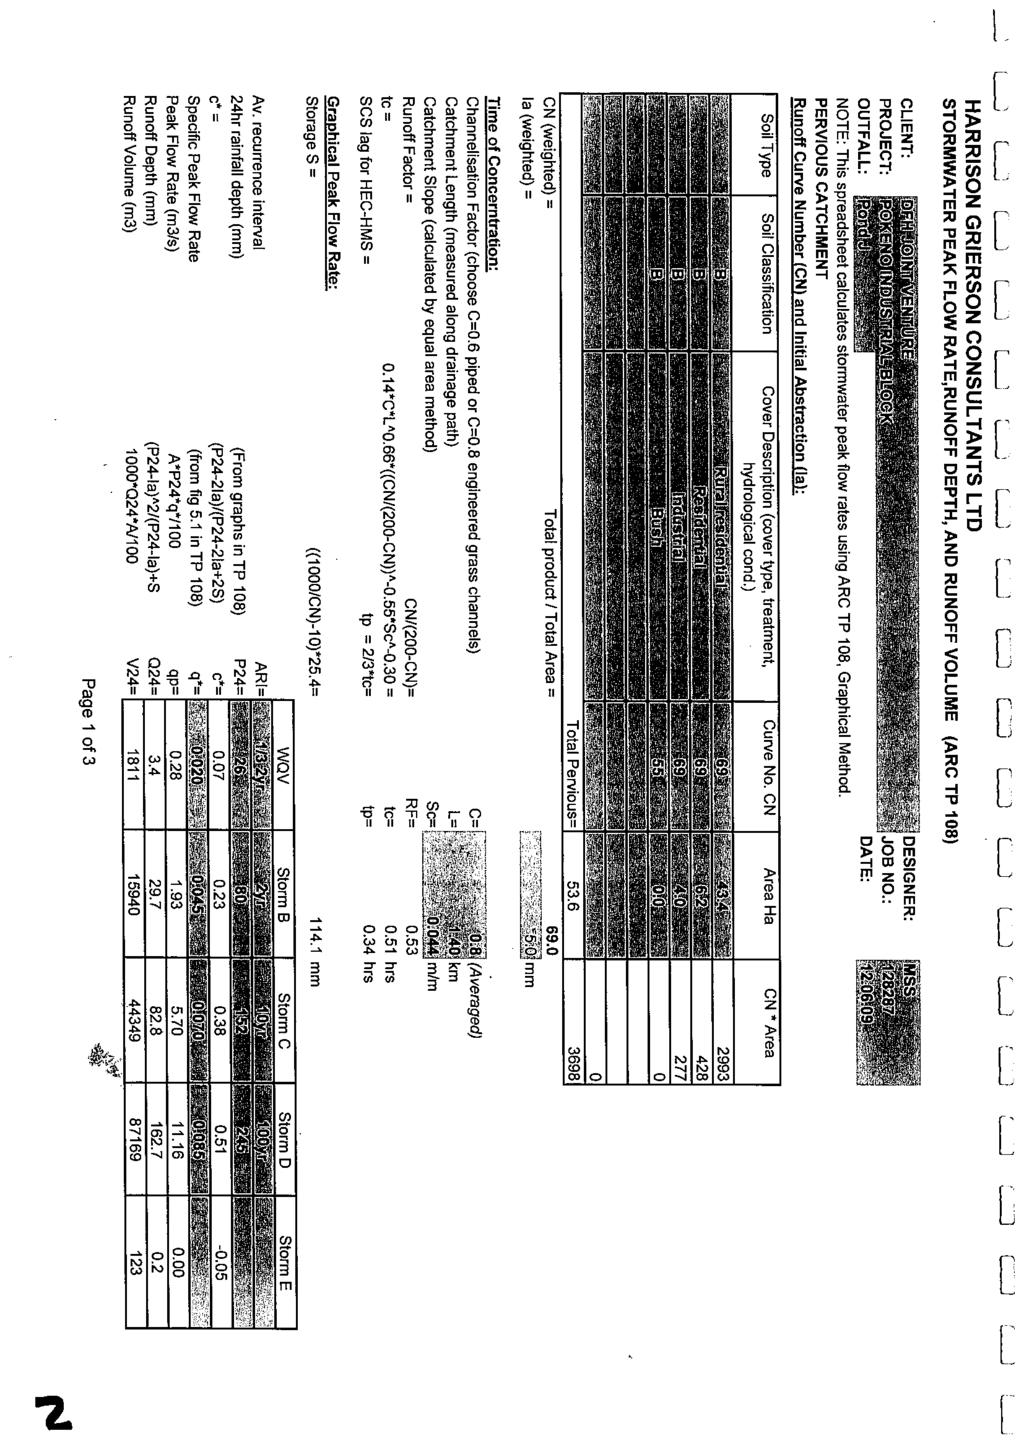
47
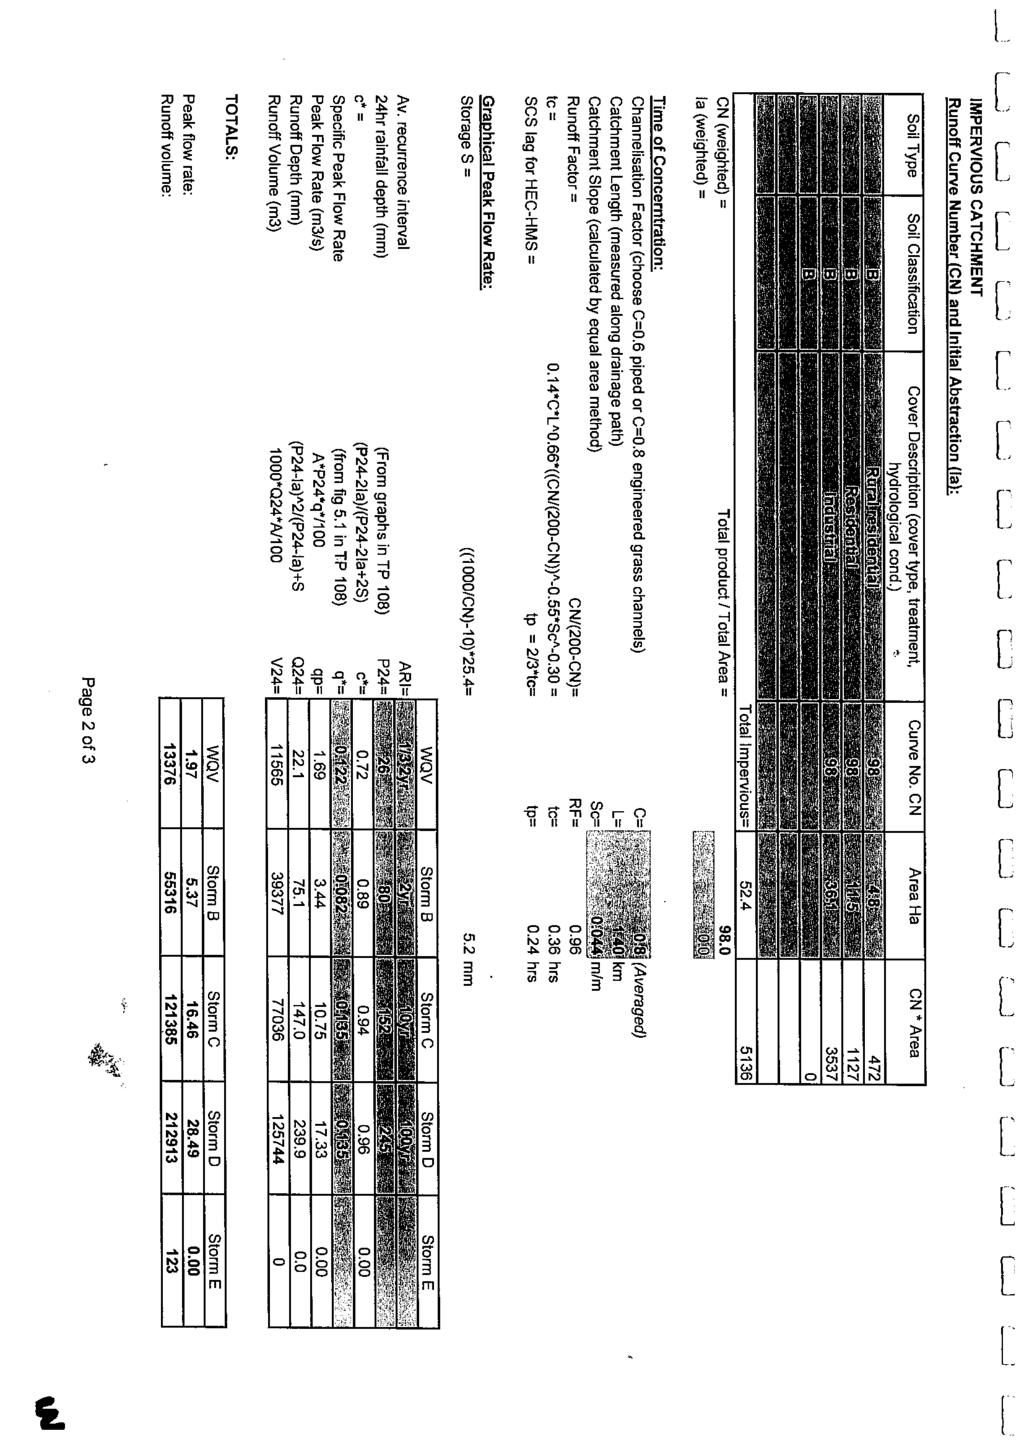
48
49
50
 All stormwater drainage from the site connects to the Tanitewhiora Stream via pond J.")
51 MEMO To: Chris Scrafton Date: 12 July 2017 From: Alister Hood CivilPlan Project No: 1950 Subject: Graham Block Development Plan Change RFI Response to Stormwater Matters With regard to the Council request for information dated 23 June, 2017, item 3: a) All stormwater drainage from the site connects to the Tanitewhiora Stream via pond J. Refer to the plan of the drainage below: Page 1
52 b) The pre- and post-development outlet hydrographs are below. These show that there will be minimal increase in peak flow compared to predevelopment, and after the peak there is about an hour (from 1pm, indicated by A) where the flow is increased from pre-development by approximately 0.5m³/s, after which it drops below predevelopment. Pre-development Hydrograph Discharge from SW Lines 2 and 5 Post-development Hydrograph Discharge from SW Lines 2 and 5 A This can be compared with the outputs from the overall model for the stream (produced for the Catchment G2 report), shown below, where stage peaks at about 3pm, and flow peaks about 2:30pm. Based on this, the increased flows from the development will be less than 1% of the total flow in the stream at the Pond J outlet, and will pass before the peak at the Pond J outlet. The effects can thus be considered less than minor. Page 1
53 Downstream Stage Node 129 (refer to location diagram below) Downstream Hydrograph - McDonald Road Culvert 11 July 2017 Graham Block Development Plan Change RFI - Stormwater Matters The period of increased flow discussed above is due to detention in the natural stream gulleys. We have assessed the effect of the treatment forebays and the proposed on-lot detention by modelling in HEC-HMS. The model output for the treatment forebays is shown below and shows that there is only a flow reduction between 6am and 11am, and a slightly increased flow (<20l/s) between 6pm and 9pm. The output for the on-lot detention is similar, which indicates that the extended detention will not affect peak catchment flows. Page 2


54 Treatment Forebays Combined Hydrograph Pond J outlet Location: Page 1
Stormwater Solutions for Residential Sites. Section 2 Stormwater Management Approach VERSION 1.0. EcoWater Solutions. Prepared for
 VERSION 1.0 Stormwater Solutions for Residential Sites Section 2 Stormwater Management Approach Prepared for EcoWater Solutions A Department of Waitakere City Council 113 Central Park Drive Henderson WAITAKERE
Figure 1 Cypress Street Study Area Location Map
 July 20, 2016 TO: FROM: Jim Massarelli Director of Engineering Jeff Julkowski, PE Michael Burke, PE SUBJECT: Cypress Street Study Area Stormwater Analysis (CBBEL Project No. 16-0058) At the request of
Pollutant Removal Benefits
 Bioswales Bioswales Similar to biocells, but have a slight, but positive grade toward an outlet Designed to convey the WQv event at very low velocities Promote filtration through native vegetation, infiltration
Placement of the soil should be in lifts of mm and loosely compacted (tamped lightly with a backhoe bucket).
.") 6 Rain Gardens Rain Gardens 6.1 Introduction A rain garden is used to attenuate peak flows and to provide stormwater treatment. Rain gardens use the concept of bioretention, a water quality practice in
6 Rain Gardens Rain Gardens 6.1 Introduction A rain garden is used to attenuate peak flows and to provide stormwater treatment. Rain gardens use the concept of bioretention, a water quality practice in
STORMWATER MANAGEMENT PLAN: ERAND GARDENS X70
 STORMWATER MANAGEMENT PLAN: ERAND GARDENS X70 Client: Central Developments 09 April 2018 _ Rev00 Report no: SWMP/410/00 SWMP FOR ERAND GARDENS X70 TABLE OF CONTENTS 1 INTRODUCTION... 1 2 GENERAL INFORMATION...
STORMWATER FLOOD REPORT
 OREWA COASTAL RETIREMENT RESORT 25 ANNALISE PLACE OREWA for COASTAL PROPERTIES LTD STORMWATER FLOOD REPORT Job No. 1847 March 2016 Orewa Coastal Retirement Resort Page 1 of 9 CONTENTS Item Description
BRISBANE BAYLANDS INFRASTRUCTURE PLAN FEBRUARY 2011 APPENDIX O DRAFT
 BRISBANE BAYLANDS INFRASTRUCTURE PLAN FEBRUARY 2011 APPENDIX O DRAFT PRELIMINARY STORM DRAIN CALCULATIONS ASSOCIATED WITH BRISBANE BAYLANDS REDEVELOPMENT BRISBANE, CALIFORNIA Prepared by BKF Engineers
TENNESSEE GAS PIPELINE COMPANY, L.L.C.
 TENNESSEE GAS PIPELINE COMPANY, L.L.C. HYDROLOGIC AND HYDRAULIC CALCULATIONS FOR ACCESS ROADS ALONG THE CONNECTICUT PIPELINE EXPANSION PROJECT CONNECTICUT LOOP Submitted by: Tennessee Gas Pipeline Company,
Bioretention cell schematic key
 Bioretention Cells Bioretention cell schematic key 1 3 Hardwood mulch 2 Curb cut 3 18-30 Modified soil 4 Stone aggregate choker layer 5 Stone aggregate base layer 6 Subdrain 7 Undisturbed soil 8 Overflow/Cleanout
Draft Rhode Island Stormwater Design and Installation Standards Manual
 Draft Rhode Island Stormwater Design and Installation Standards Manual Summary The May 2009 Public Review Draft version of the RI Stormwater Design and Installation Standards Manual consists of approximately
I611. Swanson North Precinct
 I611. Swanson North Precinct I611.1. Precinct Description Swanson North is located in the north eastern foothills of the Waitakere Ranges. It is outside the Waitakere Ranges Heritage Area Act and the Waitakere
Hydrologic Assessment of using Low Impact Development to Mitigate the Impacts of Climate Change. Chris Jensen, AScT Master of Science Thesis
 Hydrologic Assessment of using Low Impact Development to Mitigate the Impacts of Climate Change Chris Jensen, AScT Master of Science Thesis Bowker Creek Initiative April 12, 2012 Outline 1. Future Impacts
Youth Justice Redevelopment Project
 Youth Justice Redevelopment Project Youth Justice Facility Cherry Creek, Victoria February 15, 2018 Document control record Document control Report title Document ID YJRP-REP-CC-00-0001 Project Number
A LARGE MULTI-FUNCTIONAL BIORETENTION DEVICE
 A LARGE MULTI-FUNCTIONAL BIORETENTION DEVICE Stephen Priestley 1 ABSTRACT In 2015, Ports of Auckland Ltd further developed their Wiri Inland Port site. This comprised an 8ha development of hard standing
CHECKLIST FOR PHASE II DRAINAGE REPORT
 I. COVER SHEET CHECKLIST FOR PHASE II DRAINAGE REPORT A. Name of Project B. Address C. Owner D. Developer E. Engineer F. Submittal date and revision dates as applicable II. GENERAL LOCATION AND DESCRIPTION
4.6. Low Impact and Retentive Grading
 4.6. Low Impact and Retentive Grading Low Impact Grading techniques focus on utilizing existing topography during Site layout to minimize cost. Proposing structures, roads, and other impervious surfaces
When planning stormwater management facilities, the following principles shall be applied where possible.
 2.0 Principles When planning stormwater management facilities, the following principles shall be applied where possible. 2.0.1 Drainage is a regional phenomenon that does not respect the boundaries between
APPENDIX APPENDIX 6 STORMWATER MANAGEMENT REPORT
 APPENDIX APPENDIX 6 STORMWATER MANAGEMENT REPORT ECHO BAY NEW ROCHELLE, NEW YORK STORMWATER MANAGEMENT REPORT Prepared for: Forest City Residential Group 1 Metro Tech Center North Brooklyn, NY 11201 Prepared
October 7, City of Thornton 9500 Civic Center Drive Thornton, CO (303) RE: Maverik Thornton, CO - Drainage Report
 RE: Maverik Thornton, CO - Drainage Report") October 7, 2016 City of Thornton 9500 Civic Center Drive Thornton, CO 80229 (303) 538-7295 RE: Maverik Thornton, CO - Drainage Report As per your request, we are submitting to you the drainage report and
October 7, 2016 City of Thornton 9500 Civic Center Drive Thornton, CO 80229 (303) 538-7295 RE: Maverik Thornton, CO - Drainage Report As per your request, we are submitting to you the drainage report and
26 Attachment 2. Township of New Britain APPENDIX B STORMWATER MANAGEMENT DESIGN CRITERIA
 (26, APPENDIX B) 26 Attachment 2 Township of New Britain APPENDIX B STORMWATER MANAGEMENT DESIGN CRITERIA TABLE B-1 DESIGN STORM RAINFALL AMOUNT Source: Field Manual of Pennsylvania Department of Transportation
DRAFT DESIGN CRITERIA STORMWATER TREATMENT STANDARDS CITY OF OVERLAND PARK
 DRAFT DESIGN CRITERIA STORMWATER TREATMENT STANDARDS CITY OF OVERLAND PARK A. Authority As set forth in the Overland Park Municipal Code (OPMC), Chapter 16.210, the Director of Planning and Development
Edgehill Properties Limited c/o Wrighthaven Homes Ltd.
 Prepared By: Edgehill Properties Limited c/o Wrighthaven Homes Ltd. FUNCTIONAL SERVICING AND STORMWATER MANAGEMENT REPORT Granwood Gate Subdivision, Phase III Township of Centre Wellington (Elora) GMBP
APPENDIX B. Hydrologic and Hydraulic Analysis
 APPENDIX B Hydrologic and Hydraulic Analysis HYDROLOGIC AND HYDRAULIC ANALYSIS PETERSBURG ROAD IMPROVEMENTS DOT&PF Project No. 67879 Prepared for: State of Alaska Department of Transportation and Public
PHASE III DRAINAGE REPORT
 PHASE III DRAINAGE REPORT FOR Eastlake Assisted Living & Memory Care April 20, 2016 June 3, 2016 August 5, 2016 Prepared for: 3301 E 120 th Ave, LLC. 8200 E. Maplewood Ave., Suite 150 Greenwood Village
Old Mill Community Association Bioretention Facility
 Project Overview This project will install a bioretention facility in a community recreation area owned by the Old Mill Community Association, Inc. Drainage from the area is currently unmanaged and has
I602. Birdwood Precinct
 I602. Birdwood Precinct I602.1. Precinct description The Birdwood Precinct applies to an area west of Don Buck Road and south of Red Hills Road in west Auckland. It incorporates subdivision and development
STAFFORD TRACT NORTH OF US90A 1.0 INTRODUCTION 1.1 OBJECTIVE
 1.0 INTRODUCTION 1.1 OBJECTIVE This report, prepared for submittal to TxDOT, analyzes existing and proposed detention facilities draining into the TxDOT US90A storm sewer system. The results of the detailed
Evaluating Low Impact Development Practices for Stormwater Management on an Industrial Site in Mississippi
 Evaluating Low Impact Development Practices for Stormwater Management on an Industrial Site in Mississippi Dennis S. Painter, Tennessee Valley Authority, Nashville, Tennessee Donald Becker, Tennessee Valley
C ity of Grande Prairie Development Services Department
 C ity of Grande Prairie Development Services Department FAIRWAY DEVELOPMENT OUTLINE PLAN OP 08 09 Approved April 6, 2009 Prepared by: Focus Corporation Table of Contents 1.0. Introduction 2 3 1.1. Plan
PRELIMINARY DRAINAGE REPORT LATHAM 200 MMSCFD GAS PROCESSING PLANT
 PRELIMINARY DRAINAGE REPORT LATHAM 200 MMSCFD GAS PROCESSING PLANT LOTS B, RECORDED EXEMPTION 1211-2-1, RECX13-0096 LOCATED IN THE NORTH 1/2 OF SECTION 2, TOWNSHIP 3 NORTH, RANGE 66 WEST, 6 TH PRINCIPAL
Chapter 4 - Preparation of Stormwater Site Plans
 Chapter 4 - Preparation of Stormwater Site Plans The Stormwater Site Plan is the comprehensive report containing all of the technical information and analysis necessary for the City to evaluate a proposed
2I-5 Bioswales (Numbering pending)
") Iowa Stormwater Management Manual 2I-3 2I-5 Bioswales (Numbering pending) Source: Steve Anderson, 2011 BENEFITS Low =
Iowa Stormwater Management Manual 2I-3 2I-5 Bioswales (Numbering pending) Source: Steve Anderson, 2011 BENEFITS Low =
6.1. INTRODUCTION 6.2. EXISTING CONDITIONS
 Chapter 6: Stormwater Management 6.1. INTRODUCTION This Chapter describes the current drainage patterns on the Project Site, the stormwater management system that is proposed as part of the Proposed Project,
APPENDIX A SIMPLIFIED APPROACH TO STORMWATER MANAGEMENT FOR SMALL PROJECTS. In West Sadsbury Township, Chester County, Pennsylvania
 APPENDIX A SIMPLIFIED APPROACH TO STORMWATER MANAGEMENT FOR SMALL PROJECTS In West Sadsbury Township, Chester County, Pennsylvania TABLE OF CONTENTS I. Introduction 3 II. Importance of Stormwater Management
Attachment 2: Permeable Pavement Design Guidelines
 Attachment 2: Permeable Pavement Design Guidelines Design of permeable pavement systems is critical if they are to function properly and efficiently. The area and shape are dependent on the site design,
DEALING WITH STORM WATER MANAGEMENT
 December 2012 DEALING WITH STORM WATER MANAGEMENT This fact sheet provides information on the guiding principles of storm water management practices, explains the difference between structural and non-structural
Three Rivers Park District Administration Center Rain Garden
 Three Rivers Park District Administration Center Rain Garden Introduction There are significant changes to the hydrologic regime and nutrient loading following urban and industrial development. The post-development
Predicting Design Storm Runoff for the Six Mile Creek Watershed: Effects of the Potential Sprawl-Is-Us, Inc. Development
 Predicting Design Storm Runoff for the Six Mile Creek Watershed: Effects of the Potential Sprawl-Is-Us, Inc. Development Ross Guida Faulkner Consulting Engineers, Inc. December 19, 2008 1 Table of Contents
ENGINEERING & CONSTRUCTION MANAGEMENT
 DATE: PROJECT: DIVISION OF ENGINEERING & CONSTRUCTION MANAGEMENT PLAN REVIEW PERMITTING ENGINEERING CONSTRUCTION COUNTY PLAN FILE NUMBERS: DESIGN FIRM: PRELIMINARY SUBDIVISION PLAT CHECKLIST INSTRUCTIONS:
MASTER DEVELOPMENT DRAINAGE PLAN FOR MONUMENT HEIGHTS
 MASTER DEVELOPMENT DRAINAGE PLAN FOR MONUMENT HEIGHTS DRAINAGE REPORT STATEMENT ENGINEER'S STATEMENT: The attached drainage plan and report were prepared under my direction and supervision and are correct
PCE PRELIMINARY DRAINAGE ANALYSIS REPORT FOR WESTWOOD MIXED USE NEIGHBORHOOD PROJECT 772 NORTH FOREST ROAD TOWN OF AMHERST, ERIE COUNTY, NEW YORK
 PCE PRELIMINARY DRAINAGE ANALYSIS REPORT FOR WESTWOOD MIXED USE NEIGHBORHOOD PROJECT 772 NORTH FOREST ROAD TOWN OF AMHERST, ERIE COUNTY, NEW YORK MAY 19, 2014 Prepared By: Timothy M. Lavocat, P.E., CFM
MDOT Stormwater BMPs: The Challenge of Design. Janeen McDermott, PE Dan DeVaun, PE
 MDOT Stormwater BMPs: The Challenge of Design Janeen McDermott, PE Dan DeVaun, PE June 25, 2018 Outline Water Quality Treatment Water Quality Treatment Volume Guidelines Example Project BMP Design Challenges
Table of Contents G.1.a Water Resources - Surface Water - Drainage
 Table of Contents G.1.a Water Resources - Surface Water - Drainage 1. INTRODUCTION... 1335 2. ENVIRONMENTAL SETTING... 1335 a. Regional Hydrology... 1335 b. Local Hydrology... 1337 c. On-site Hydrology...
What is YOUR biggest challenge in stormwater control measure accounting/planning?
 Introduction Name Affiliation What is YOUR biggest challenge in stormwater control measure accounting/planning? 1 Opti-Tool Outreach Workshop Part 1 Research Based Stormwater System Accounting November,
Keele Campus Storm Drainage. Presented by Mark Hagesteijn September 24, 2013
 Keele Campus Storm Drainage Presented by Mark Hagesteijn September 24, 2013 1 Presentation Overview Urbanization Impact on the Hydrologic Cycle Why Do We Manage Stormwater? Typical Stormwater Management
Outfall Flow Analysis for the Oswego Canal and Blue Heron Canal
 DRAFT REPORT Outfall Flow Analysis for the Oswego Canal and Blue Heron Canal Prepared for: City of Lake Oswego, Oregon Prepared by: Pacific Water Resources, Inc. January 31, 2008 We Think the World of
SH16 Western Ring Route Henderson Creek to Huruhuru Road Bridge
 SH16 Western Ring Route Henderson Creek to Huruhuru Road Bridge Stormwater Management Report NZ Transport Agency SH16 Western Ring Route Henderson Creek to Huruhuru Road Bridge NZ Transport Agency Contents
5. LOW IMPACT DEVELOPMENT DESIGN STANDARDS
 5. LOW IMPACT DEVELOPMENT DESIGN STANDARDS Low Impact Development (LID) requires a shift in stormwater management away from conveying runoff to a small number of downstream points through hydraulically
City of Waco Stormwater Management Regulations
 1.0 Applicability: City of Waco Stormwater Management Regulations These regulations apply to all development within the limits of the City of Waco as well as to any subdivisions within the extra territorial
The use of low head weirs to. perennial streams with their floodplains:
 The use of low head weirs to reconnect severely entrenched perennial streams with their floodplains: An Anne Arundel County TMDL Watershed Implementation Plan Strategy presented by Hala Flores, P.E Mid
City of Hume Planning Scheme Amendment C207. Statement of Expert Evidence Provided to Planning Panels Victoria
 14 August 2017 Revision: 1 Reference: 1702 City of Hume Planning Scheme Amendment C207 Statement of Expert Evidence Provided to Planning Panels Victoria Stormwater Management Evidence for 35 Buckland Way
Assessing Directly Connected Impervious Areas in Residential Subdivisions in Western Sydney, NSW
 Assessing Directly Connected Impervious Areas in Residential Subdivisions in Western Sydney, NSW 1, 1 Cardno (APAC South), 203 Pacific Highway St Leonards, 2065. Email: Stephen.Gribble@cardno.com.au Key
 PSLS Surveyors' Conference Workshop Information Form Workshop Number: (leave blank if unknown) Hours: Workshop Title: Workshop Description: Suggested Speaker(s), affiliation/contact information 1. 2. 3.
Stormwater Management Plan (SWMP) Revision Date: 11/05
 Revision Date: 11/05") Stormwater Management Plan (SWMP) Revision Date: 11/05 SWMP Purpose: Sustainable stormwater management principles are adopted as Portland State University s (PSU) preferred approach for the management
Stormwater Management Plan (SWMP) Revision Date: 11/05 SWMP Purpose: Sustainable stormwater management principles are adopted as Portland State University s (PSU) preferred approach for the management
Planning the BMP. Region 2000 Planning District Commission Lynchburg, VA December 13, 20013
 Planning the BMP Region 2000 Planning District Commission Lynchburg, VA December 13, 20013 PLANNING THE BMP AGENDA BMP Selection BMP Design SWM Plan Preparation 2 BMP SELECTION Types of BMPs Structural
2E-4 Bioretention Cells
 Iowa Stormwater Management Manual 2E-4 2E-4 Bioretention Cells BENEFITS Low =
West Virginia Stormwater Management Manual: Methods.
 West Virginia Stormwater Management Manual: Methods Created to deliver targeted training on new tools and practices to improve the quality of stormwater runoff. www.cbstp.org www.chesapeakestormwater.net
City of Elmhurst. City of Elmhurst. Storm Sewer System Workshop November 22, 2010
 City of Elmhurst City of Elmhurst Storm Sewer System Workshop November 22, 2010 1 City of Elmhurst Watershed divide (green dashed line) through Elmhurst Area east of divide drains to Addison Creek Area
STORMWATER GREEN INFRASTRUCTURE AND PLANNING/ZONING BOARDS
 STORMWATER GREEN INFRASTRUCTURE AND PLANNING/ZONING BOARDS Source: Center for Watershed Protection, 2007 Southern Tier Central Regional Planning & Development Board Chemung County Stormwater Team OUTLINE
City of Columbia BMP Manual. Volume Calculation Tool and Examples
 City of Columbia BMP Manual Volume Calculation Tool and Examples July 24, 2013 Today s Agenda 1. Welcome 2. Review City s Design Aid Tools Example Project 3. Revisit City s BMP Maintenance Agreement Procedure
Beyond Runoff Reduction: Thorough Green Infrastructure Design. Zach Sample, PE Innovyze
 Beyond Runoff Reduction: Thorough Green Infrastructure Design Zach Sample, PE Innovyze Presenter Zach Sample, PE Stormwater Products Manager Innovyze Agenda Modern stormwater design (HINT: Runoff Reduction)
A. Regional Detention Requirements
 I. GENERAL DESIGN GUIDELINES A. Full-spectrum detention is provided for all new development, redevelopment or expansion of a site to provide for water quality and flood control detention. B. Detention
HEALTH SCIENCES BUILDING REDEVELOPMENT PROJECT
 INTRODUCTION In recent years, the University of Cincinnati (University) has demonstrated a commitment to identifying and implementing sustainable goals and objectives throughout University s Uptown Campuses.
Drainage Report. For: Owner/Developer:
 Drainage Report For: My Place Hotel Lot 6, Charles Ritz Subdivision Overland Park, KS Owner/Developer: Overland Park Holdings, LLC Matt Eller 104 Campus Drive, Suite 202 Huxley, IA 50124 Civil Engineer:
6.1. INTRODUCTION AND SUMMARY OF FINDINGS
 Chapter 6: Stormwater Management 6.1. INTRODUCTION AND SUMMARY OF FINDINGS A Stormwater Pollution Prevention Plan (SWPPP) has been prepared for the Proposed Project in accordance with the requirements
SUPPORTING DOCUMENT STORMWATER POLLUTION PREVENTION PLAN (SWPPP) NARRATIVE
 NARRATIVE") SUPPORTING DOCUMENT STORMWATER POLLUTION PREVENTION PLAN (SWPPP) NARRATIVE Please complete this narrative form and submit with your SWPPP drawings. Refer to Kitsap County Stormwater Design Manual Vol.
SUPPORTING DOCUMENT STORMWATER POLLUTION PREVENTION PLAN (SWPPP) NARRATIVE Please complete this narrative form and submit with your SWPPP drawings. Refer to Kitsap County Stormwater Design Manual Vol.
ARIZONA WATER COMPANY
 ARIZONA WATER COMPANY East Sedona Water Storage Facility February 21, 2018 Community Meeting STORMWATER RUNOFF Issue: Runoff sometimes flows out of the wash at bottlenecks in front of several homes on
Appendix I. Checklists
 Appendix I Checklists Town of Greenwich Drainage Manual Department of Public Works - Engineering Division Town Hall - 101 Field Point Road, Greenwich, CT 06836-2540 Phone 203-622-7767 - Fax 203-622-7747
Modeling Cumulative LID Features for Floodplain Impacts in an Urban Watershed in Houston, TX
 Modeling Cumulative LID Features for Floodplain Impacts in an Urban Watershed in Houston, TX Christina Hughes, Phil Bedient cmhughes@rice.edu May 2, 2014 1 Modeling Cumulative LID Features for Floodplain
County Council Of Howard County, Maryland
 County Council Of Howard County, Maryland 2010 Legislative Session Legislative Day No. 4 Resolution No. 38-2010 Introduced by: The Chairperson at the request of the County Executive A RESOLUTION revising
Moon Brook FRP BMP Summary Sheet. Ownership of Land where BMP is Located
 Outlet Retrofit Hitzel Terrace The town owned parcel along Hitzel Terrace is a natural wetland area which currently provides some level of stormwater detention and peak-flow attenuation. The proposed project
STORMWATER MANAGEMENT CODES ANALYSIS RICHLAND COUNTY, SC SITE PLANNING ROUNDTABLE
 STORMWATER MANAGEMENT CODES ANALYSIS RICHLAND COUNTY, SC SITE PLANNING ROUNDTABLE Codes analyses for each subcommittee were completed to assist participants of the Richland County Site Planning Roundtable.
WQ-23 MOUNTAINOUS AND STEEP SLOPE SITES
 Greenville County Technical Specification for: WQ-23 MOUNTAINOUS AND STEEP SLOPE SITES 1.0 Mountainous and Steep Slope Sites 1.1 Description The geographic locations of portions of Greenville County are
SUBMITTAL REQUIREMENTS: FINAL PLAN REVIEW- PROJECT DEVELOPMENT PLAN (PDP)
") 1) Application form and filing fee. Application Form.pdf Development Review Guide STEP 6 of 8 SUBMITTAL REQUIREMENTS: FINAL PLAN REVIEW- PROJECT DEVELOPMENT PLAN (PDP) 2) Transportation Development Review
1) Application form and filing fee. Application Form.pdf Development Review Guide STEP 6 of 8 SUBMITTAL REQUIREMENTS: FINAL PLAN REVIEW- PROJECT DEVELOPMENT PLAN (PDP) 2) Transportation Development Review
City of Elmhurst. Comprehensive Flood Plan. City of Elmhurst. City Council Meeting September 15, 2014
 City of Elmhurst City of Elmhurst Comprehensive Flood Plan City Council Meeting September 15, 2014 City of Elmhurst Presentation Overview Study Background Study Methodology Analysis of Three Additional
Urban Stormwater Management. Rebecca Leonardson Rui Teles Brooke Ray Smith
 Urban Stormwater Management Rebecca Leonardson Rui Teles Brooke Ray Smith Introduction Stormwater in Portugal Why urban stormwater is currently a problem What is green stormwater management? Why it is
STORMWATER CREDITS AND BETTER SITE DESIGN PRACTICES
 ..CHAPTER.. STORMWATER CREDITS AND BETTER SITE DESIGN PRACTICES 5.1 Introduction Stormwater management begins with the site planning and design process. Development projects can be designed to reduce their
Leduc Industrial Outline Plan SE W4
 Leduc Industrial Outline Plan SE 1-50-25-W4 Within the North Leduc Industrial ASP Prepared for: Leduc Energy Park Ltd. Prepared by: Stantec Consulting Ltd. File No. 1161 104655 V5 Table of Contents 1.0
Green Roofs and Stormwater Management Virginia Stovin
 Green Roofs and Stormwater Management Virginia Stovin Department of Civil and Structural Engineering Pennine Water Group University of Sheffield Outline Urban stormwater management Conventional solutions,
4. CONCEPT PLAN DEVELOPMENT
 4. CONCEPT PLAN DEVELOPMENT Concept Plan Step 1: Identify Site Constraints and Opportunities Review the existing site to identify constraints and opportunities for GI Practices to meet the RRv. Constraints
STORMWATER SITE PLAN INSTRUCTIONS AND SUBMITTAL TEMPLATE Medium and Large Projects
 DEPARTMENT OF COMMUNITY DEVELOPMENT 621 Sheridan Street, Port Townsend, WA 98368 Tel: 360.379.4450 Fax: 360.379.4451 Web: www.co.jefferson.wa.us/communitydevelopment E-mail: dcd@co.jefferson.wa.us STORMWATER
STORMWATER REPORT FOR WALMART SUPERCENTER STORE # SIOUX FALLS, LINCOLN COUNTY, SOUTH DAKOTA BFA PROJECT NO
 STORMWATER REPORT FOR WALMART SUPERCENTER STORE # 2443-00 SIOUX FALLS, LINCOLN COUNTY, SOUTH DAKOTA BFA PROJECT NO. 3286 March 1, 2012 I hereby certify that this engineering document was prepared by me
Green City, Clean Waters
 Green City, Clean Waters Green Infrastructure Maintenance Manual Consent Order & Agreement Deliverable VIII City of Philadelphia Combined Sewer Overflow Long Term Control Plan Update Submitted to The Commonwealth
Figure 1. Bioswale along roadside. Photo courtesy of CalTrans. Figure 2. Diagram of typical bioswale (adapted from UDFCD 1999)
") Design Manual: Biological Filtration Canal (Bioswale) Dayna Yocum, Bren School of Environmental Science and Management, University of California, Santa Barbara Figure 1. Bioswale along roadside. Photo
Design Manual: Biological Filtration Canal (Bioswale) Dayna Yocum, Bren School of Environmental Science and Management, University of California, Santa Barbara Figure 1. Bioswale along roadside. Photo
A Business Case for Best Practice Urban Stormwater Management: Case Studies
 A Business Case for Best Practice Urban Stormwater Management: Case Studies Version 1.1 September 2010 A companion document to A Business Case for Best Practice Urban Stormwater Management Water by Design
Page 1 of 6. Table 1a Structural BMPs
 DRAFT 3 Glossary of Stormwater BMP Types (Table 1a), Non-structural Practices (Table 1b) and Policy Decisions (Table 1c) That are Typically Reported to MDE Type Code Function CBP Urban Stormwater Workgroup
IMPLEMENTING STORMWATER MANAGEMENT REQUIREMENTS FOR DEVELOPMENT
 IMPLEMENTING STORMWATER MANAGEMENT REQUIREMENTS FOR DEVELOPMENT 4.1 Overview Description: Requirements and standards for controlling runoff from development are critical to addressing water quantity and
Village of New Maryland. Storm Water Management Master Plan
 Village of New Maryland Storm Water Management Master Plan Village of New Maryland Storm Water Management Master Plan Fredericton Office 80 Bishop Drive Fredericton NB E3C 1B2 Canada Telephone: +1 506
How to Update a Storm Water Management Program (SWMP) to Incorporate Total Maximum Daily Load (TMDL) BMPs
 to Incorporate Total Maximum Daily Load (TMDL) BMPs") How to Update a Storm Water Management Program (SWMP) to Incorporate Total Maximum Daily Load (TMDL) BMPs Janine Rybka Cuyahoga Soil & Water Conservation District About Habitat Habitats are the places
How to Update a Storm Water Management Program (SWMP) to Incorporate Total Maximum Daily Load (TMDL) BMPs Janine Rybka Cuyahoga Soil & Water Conservation District About Habitat Habitats are the places
ADMINISTRATION RECOMMENDATION(S) 2017 February 09. That Calgary Planning Commission recommends APPROVAL of the proposed Land Use Amendment.
 2017 February 09. That Calgary Planning Commission recommends APPROVAL of the proposed Land Use Amendment.") Page 1 of 10 EXECUTIVE SUMMARY This land use amendment application is to accommodate changes to the location of a stormwater retention pond and land use boundaries adjacent to Environmental Reserve in
Page 1 of 10 EXECUTIVE SUMMARY This land use amendment application is to accommodate changes to the location of a stormwater retention pond and land use boundaries adjacent to Environmental Reserve in
Huntington Stormwater Utility
 Huntington Stormwater Utility Stormwater Management & Sediment and Erosion Control Requirements for Construction Sites Authorized by Huntington City Code Articles: 971, 970, 930, 935, 955, Revised April
Baltimore, MD Lt. Gov. Boyd Rutherford
 MODEL STANDARD PLAN FOR POULTRY HOUSE SITE DEVELOPMENT ON MARYLAND S EASTERN SHORE MARCH 2011 1800 Washington Boulevard 410-537-3000 Gov. Larry Hogan Baltimore, MD 21230-1718 800-633-6101 Lt. Gov. Boyd
RLE.1 Rural Living Environment
 Index.1 Description and Expectations.2 Objectives.3 Policies.4 Guidance RLE.2 Landuse RLE.2.1 Eligibility Rules RLE.2.2 Notification Rules RLE.2.3 Discretionary Activities RLE.3 Subdivision RLE.3.1 Eligibility
I333 Three Kings Precinct
 I333. Three Kings I333.1. Precinct description The Three Kings Precinct provides for the development of a vibrant, sustainable urban village on the former quarries and the adjacent land at Three Kings.
Shelbyville, KY Stormwater Best Management Practices. Section 2 EROSION PREVENTION AND SEDIMENT CONTROL PLAN
 Section 2 EROSION PREVENTION AND SEDIMENT CONTROL PLAN 2.1 Requirements The City of Shelbyville, KY will require an Erosion Prevention and Sediment Control (EPSC) Plan for most types of development construction.
C-12. Dry Pond. Design Objective
 C-12. Dry Pond Design Objective The primary purpose of dry pond is to attenuate and delay stormwater runoff peaks. Dry ponds hold water immediately after a storm event and drain to be almost complete dry
Session 1E Non-Structural BMPs. Chesapeake Bay Stormwater Training Partnership 1
 Session 1E Non-Structural BMPs Chesapeake Bay Stormwater Training Partnership 1 Agenda Site Design (self-crediting) Soil Amendments Simple l Disconnection Sheet Flow Grass Channels Site Plan courtesy of
Development of LID Design Guide in Edmonton
 Development of LID Design Guide in Edmonton Xiangfei Li and Fayi Zhou, the City of Edmonton Dan Healy, AMEC Earth and Environmental Philadelphia LID Symposium September 26, 2011 Outline Why LID Why develop
Section 12B 12B Subdivision in Residential Zones
 Section 12B 12B Subdivision in Residential Zones The Residential Zones provide for a range of infill and greenfield living opportunities across the City for the community to accommodate current and future
12/7/2007. Christopher B. Burke Engineering West, Ltd Aux Sable Creek Watershed Plan Update 1
 The ABC s of BMP s Aux Sable Watershed Plan St. Charles, IL Why are BMP s Important Best Management Practices (BMPs) developed as a set of practices which help to achieve goals of the Clean Water Act and