Alimentation Couche-Tard Inc.
|
|
|
- Joanna Pierce
- 5 years ago
- Views:
Transcription


1 Alimentation Couche-Tard Inc. June 2014
2 Forward-Looking Information and Cautionary Language This presentation and the accompanying oral presentation contain forward-looking statements within the meaning of applicable securities legislation. Forward-looking statements are typically identified by words such as projected, estimate, may, anticipate, believe, expect, plan, intend or similar words suggesting future outcomes or statements regarding an outlook. All statements other than statements of historical fact contained in these slides are forward-looking statements. Forward-looking statements involve numerous assumptions, risks and uncertainties. A variety of factors, many of which are beyond Alimentation Couche-Tard Inc. s ( Couche-Tard ) control, may cause actual results to differ materially from the expectations expressed in its forward-looking statements. These factors include, but are not limited to, the effects of the integration of acquired businesses and the ability to achieve projected synergies, fluctuations in margins on motor fuel sales, competition in the convenience store and retail motor fuel industries, foreign exchange rate fluctuations, and such other risks as described in detail from time to time in documents filed by Couche-Tard with securities regulatory authorities in Canada, including those risks described in Couche-Tard s management s discussion and analysis (MD&A) for the year ended April 28, Couche-Tard s MD&A and other publicly filed documents are available on SEDAR at Unless otherwise required by law, Couche-Tard does not undertake to update any forward-looking statement, whether written or oral, that may be made from time to time by it or on its behalf. No financial information presented in this presentation as of a date more recent than April 28, 2013 has been audited. While the information contained in this presentation is believed to be accurate, Couche-Tard expressly disclaims any and all liability for any losses, claims or damages of whatsoever kind based upon the information contained in, or omissions from, this presentation or any oral communication transmitted in connection therewith. In addition, none of the statements contained in this presentation are intended to be, nor shall be deemed to be, representations or warranties of Couche- Tard and its affiliates. Where the information is from third-party sources, the information is from sources believed to be reliable, but Couche-Tard has not independently verified any of such information contained herein. This presentation is not, and under no circumstances is to be construed as, a prospectus, an offering memorandum, an advertisement or a public offering of securities. Under no circumstances should the information contained herein be considered an offer to sell or a solicitation of an offer to buy any securities. 1
3 Company Representatives Brian Hannasch Chief Operating Officer Raymond Paré Vice-President and Chief Financial Officer Tel: (450) ext
4 Table of Contents 1. Investment Highlights 2. Couche-Tard Today 3. SFR Update 4. Capital Structure & Debt Reduction Plan Appendix 1. Historical Industry Sales 3
5 1. Investment Highlights 4

6 Investment Highlights Disciplined Management Culture Management team with strong track record and founders have 22% equity ownership SFR s management team remains in place Decentralized operating model Broad Geographic Footprint with Leading Market Positions Leading C-store operator in North America, Scandinavia and Central and Eastern Europe Powerful local banners (Couche-Tard, Circle K, Mac s and Statoil) continue to drive traffic and sales World class Canadian retailer with most geographically diversified footprint Superior Product Offerings Increasing focus on private label and fresh food products Industry leading merchandise gross margin Powerful Financial Results Strong and consistent financial performance throughout all economic cycles Prolific history of positive same store sales comps and ~23% ROE Significant FCF generation ( CAGR of 65%) S&P: BBB- (Stable) Moody s: Baa3 (Stable) Attractive Sector Dynamics Steady industry performance throughout downturns with strong projected growth C-store sector well positioned to gain share from traditional food retail Industry-leading returns in recession proof industry Attractive SFR Synergy Potential Proven ability to extract significant synergies from acquisitions Transferring best practices across entire platform Track Record of Highly Disciplined Growth and Debt Reduction Proven ability to integrate acquisitions (~1,500 stores from 45 acquisitions since Circle K in 2003, excluding SFR) Well positioned to lead further consolidation in fragmented industry Committed to remain investment grade post SFR acquisition Couche-Tard is a disciplined c-store operator and integrator 5
7 2. Couche-Tard Today 6
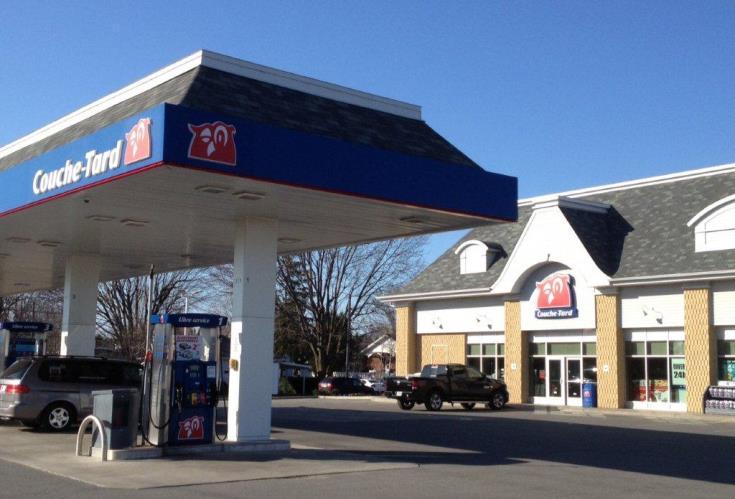
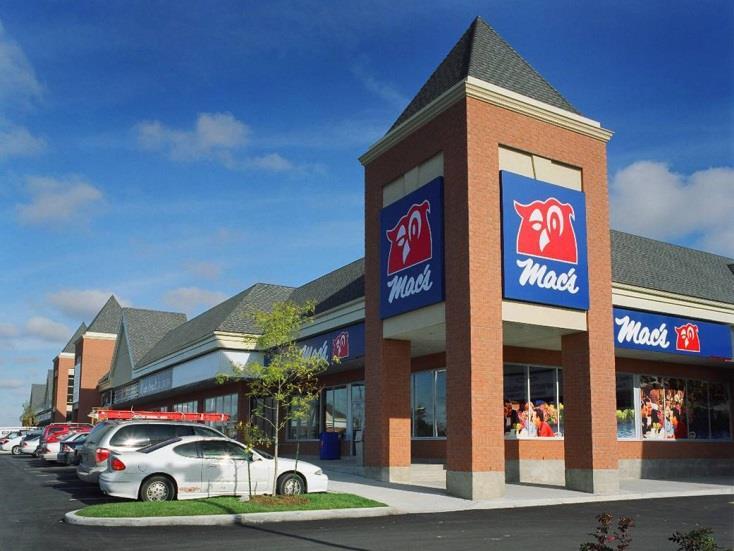
8 Key Highlights Couche-Tard is a leading global convenience store operator Largest operator in North America based on number of company-operated stores. Leader in convenience store and road transportation fuel in Scandinavian countries and in the Baltic countries Network of 6,234 corporate-operated stores, 614 CODO (1), 534 DODO (2) and 1,102 affiliated stores In addition to the stores above, under licensing agreements, 4,247 stores operated under the Circle K banner worldwide Well-recognized banners including Couche-Tard, Circle K, Statoil and Mac s Proven track record of disciplined growth and profitability Revenue, EBITDA and EPS CAGR of 18.3%, 23.2% and 27.4%, respectively LTM EBITDA of $1.6B Disciplined management culture with proven integration track record Decentralized operating model Successfully integrated ~1,500 stores from 45 acquisitions since Circle K transaction (excluding Statoil Fuel & Retail) Founders own ~22% of the Company Significant cash flow generator with historically strong credit metrics Free cash flow CAGR of 64.8% Largest operator of company-operated stores and disciplined consolidator in resilient industry (1) Company Owned Dealer Operated. (2) Dealer Owned Dealer Operated. 7
 (1) 3.1 1.5 1.2 1.8 1.7 1.")
9 Revenue ($) History of Highly Disciplined M&A Approach Couche-Tard s Consistent Acquisition Strategy Florida Oil Holdings, LLC Dickerson Petroleum Groovin Noovin RDK Joint Venture Compac Food Stores Pump N Shop Winners All Star Sterling Stores Moore Oil Spectrum Store Accel Marketing LLC Q Total Debt/ EBITDA (x) (1) Stores Acquired 1, ,506 (2) (3) 1.7 (3) 163 Superb track record of integrating acquisitions (1) Represents Total Debt/EBITDA at fiscal year end except for 2014 which represents YTD Q3. (2) Pro forma the acquisition of SFR. (3) Adjusted for non-recurring restructuration provision, curtailment gain and negative goodwill. 8

10 North American Footprint Network CENTRAL CANADA Corporate stores: 515 DODO: - Affiliated stores: 192 WESTERN CANADA Corporate stores: 303 DODO: - Affiliated stores: - v v QUEBEC EAST AND ATLANTIC Corporate stores: 301 DODO: - Affiliated stores: 13 WEST COAST REGION Corporate stores: 251 CODO: 142 DODO: 172 Affiliated stores: 253 QUEBEC WEST Corporate stores: 354 DODO: - Affiliated stores: 217 GREAT LAKES REGION Corporate stores: 524 DODO: - Affiliated stores: 115 MIDWEST REGION Corporate stores: 495 CODO: 41 DODO: 103 Affiliated stores: 58 ARIZONA REGION Corporate stores: 616 DODO: - Affiliated stores: 2 SOUTHWEST REGION Corporate stores: 271 CODO: 2 DODO: 3 Affiliated stores: 61 GULF REGION Corporate stores: 289 DODO: 7 Affiliated stores: 45 SOUTHEAST REGION Corporate stores: 278 DODO: 3 Affiliated stores: 110 FLORIDA REGION Corporate stores: 413 CODO: 15 DODO: 21 Affiliated stores: 36 Total network of 5,712 stores in North America and supplies fuel to an additional 509 sites As of February 2,
11 European Footprint NORWAY Corporate stores: 198 CODO: 248 DODO: 57 inc. automats: 180 SWEDEN Corporate stores: 612 CODO: 143 DODO: 27 inc. automats: 478 DENMARK Corporate stores: 311 CODO: 23 DODO: 51 inc. automats: 171 RUSSIA Corporate stores: 33 DODO: - inc. automats: - ESTONIA Corporate stores: 52 DODO: - inc. automats: 6 LATVIA Corporate stores: 65 DODO: 12 inc. automats: 6 POLAND Corporate stores: 277 DODO: 78 inc. automats: 86 LITHUANIA Corporate stores: 76 DODO: - inc. automats: 13 2,263 stores in 8 countries in Europe As of February 2,

12 International Presence Central / South America China 92 Asia Mexico 261 Japan 2,985 United Arab Emirates 29 Guam 13 Honduras 6 Macau 23 Vietnam 60 Hong Kong 335 Philippines Malaysia Indonesia 443 4,247 licensed Circle K stores in Asia, Mexico, Honduras and U.A.E As of February 2,
13 Couche-Tard as a World Leader ($ billions) North America Europe LTM (1) Revenue $25.2 $12.6 $37.8 Contribution 67% 33% 100% Gross Profit $3.3 $1.7 $5.0 Gross Margin 13.0% 13.7% 13.2% EBITDA (3) $1.6 EBITDA Margin 4.2% (2) Stores (#) 6,221 2,263 8,484 Couche-Tard is a leading global convenience store operator with EBITDA of $1.6 billion (1) LTM financial results as at February 2, (2) Includes Couche-Tard s Company-Owned/Dealer-Operated and Dealer-Owned/Dealer-Operated sites. (3) Adjusted for non-recurring restructuring provision, curtailment gain and negative goodwill. 12
14 Gross Margin Breakdown By Geography By Product Canada 17.4% Europe 34.7% US 47.9% Fuel Gross Margins Motor fuel 38.1% Merchandise, services and other 61.9% United States (cents per gallon) Europe (cents per litre) Canada (CA cents per litre) 5.87 Gross Margins (As a % sales) United States 32.7% Europe 43.2% Canada 32.7% Consolidated 34.1% Entry into resilient Scandinavian market with high margin motor fuel business LTM financial results as at February 2,
15 Disciplined Growth and Significant Free Cash Flow Sales Same-store sales ($in millions) 35,000 30,000 25,000 20,000 15,000 10,000 5, % CAGR 15,370-15,781-16,440-10,169 10,365 10,558 18,966-12,744 22, ,375 35,543 2,676 25,271 5,201 5,416 5,882 6,222 6,599 7, A 2009A 2010A 2011A 2012A 2013A Merchandise Motor fuel Other Q Q Q Q Q Q Q Q Q Q Merchandise same-store sales US 2.5% 3.4% 3.4% 2.8% 0.4% 0.8% 0.1% 2.7% 4.5% 3.8% Can 3.3% 3.1% 5.4% 5.0% 0.4% 1.7% 0.9% 0.7% 3.2% 2.2% Eur 1.9% 1.9% 0.9% Motor fuel same store volume US 0.2% 1.1% 0.2% 1.1% -0.5% 0.8% 1.1% 1.2% 1.7% 1.3% Can -3.0% 0.0% 0.1% 2.2% 0.2% -0.9% -1.4% -0.4% 1.5% 2.1% Eur 1.8% 2.2% 2.7% EBITDA Free Cash Flow ($ in millions) 1,500 1,300 1, % CAGR 1, % 3.7% 3.9% 3.9% 3.2% 3.7% 2008A 2009A 2010A 2011A 2012A 2013A ($ in millions) % CAGR A 2009A 2010A 2011A 2012A 2013A EBITDA % margin History of strong operational performance and FCF generation 14

 Based on most recent published last")
 Couche-Tard s most recent")
16 Industry Leading Returns Return on capital employed (1)(2) (3) Before Acquisition Current Susser Casey's Pantry CST Pro Forma NACS 2012 Grocery Stores Home Improv. Drugstores Mass Merchants Dollar Stores Industry Average Return on capital employed since 2003 Strong returns even in challenging economic conditions (1) Based on most recent published last 12 months results as of February 28, Pantry financials adjusted for non-recurring asset write-off (2) Couche-Tard s most recent published results are as of February 2, 2014 (Q3 2014) (3) As of April 29,


17 Operational Trademark In-store sales Innovation Differentiation Private and exclusive brands Food Store upgrades Technology Industry consolidation Gross margin improvement Procurement Price strategies Product loss reductions Increase efficiency Benchmarking Best practices Growth of the store network Acquisitions Store development People Forecourt execution Best-in-class retail operator 16
18 3. SFR Update 17
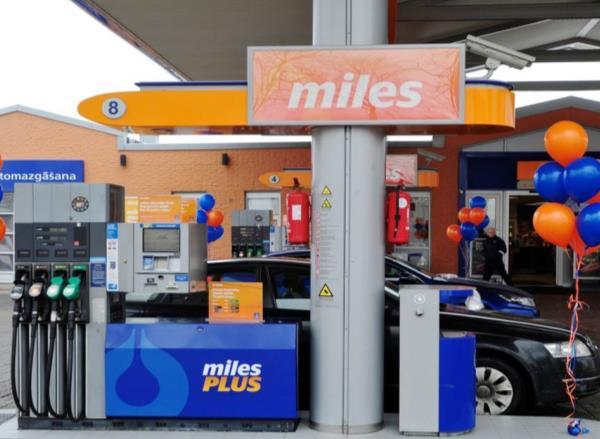
19 SFR Snapshot Broad network comprised of 2,263 stations 72% are company-operated Revenues of $12.6B and gross margin of $1.7B for the period from February 1 st, 2013 to January 31 st, 2014 ~8.5B fuel litres sold from February 1 st, 2013 to January 31 st, 2014 Convenience offering focused on fresh food (24% of merchandise sales) Turn around of negative comparable sales trend that existed when SFR was acquired Roll-out of Miles Coin offer Finalization of the implementation of a new ERP system. Only Poland and stabilisation remain. Realized YTD synergies of approximately $64.0M including cost reductions following the delisting of SFR, renegotiation of certain agreements with our suppliers, reduction of in-store costs and restructuring of certain departments. Couche-Tard maintains its goal of annual synergies ranging from $150.0 million to $200.0 million before the end of December 2015 Long history of >100 years in Scandinavia and >20 years in CEE (1) As of June 20,

 As at March 31, 2012, based on internal and market data.")
20 Market Leadership Market Position Market Share Store Count (1) Fuel (2) C-stores (3) Norway # % 33% Oslo Sweden # % 33% Denmark # % 33% Latvia # % 37% Estonia # % 41% Lithuania # % 23% Poland # % 7% The is the most recognized convenience brand across Scandinavia and the Baltics states Source: SFR estimates and AC Nielsen. (1) As at January 31, (2) As at March 31, 2012, based on internal and market data. (3) Based on market data, as at various dates, ranging from December 2011 to March
21 4. Capital Structure & Debt Reduction Plan 20


22 Adj. Net Debt / Adj. EBITDAR Strong Credit Metrics Support Investment Grade Rating Track record of deleveraging after acquisition 21


23 Current Liquidity and Credit Facilities As of February 2,
24 Appendix 1 Historical Industry Sales 23
25 Billions of U.S. Dollars Resilient and Growing Industry Industry s inside sales grow each year, even during recessions U.S. Convenience Stores Industry Sales Inside Sales Motor Fuel Sales Recession Consistent growth throughout economic cycles over the last 30 years Source: Industry data is from the «NACS Sate of the Industry Annual Report 2012 Data» 24
Arun Nayar Senior Vice President, Finance and Treasurer
 Arun Nayar Senior Vice President, Finance and Treasurer November 18, 2010 Forward-Looking Statements / Safe Harbor Certain statements in this presentation are forward-looking statements within the meaning
Combination to Create a Leading Commercial Real Estate Credit REIT with Approximately $5.5 Billion in Assets and $3.4 Billion in Equity Value
 Colony NorthStar, NorthStar Real Estate Income Trust and NorthStar Real Estate Income II Announce Creation of Colony NorthStar Credit Real Estate, Inc. Combination to Create a Leading Commercial Real Estate
The ADT Corporation Form 10
 The ADT Corporation Form 10 April 10, 2012 Forward-Looking Statements / Safe Harbor This presentation contains a number of forward-looking statements. Words, and variations of words, such as expect, intend,
DISPOSAL GALERIA KAUFHOF. 15 June 2015
 DISPOSAL GALERIA KAUFHOF 15 June 2015 DISCLAIMER AND NOTES To the extent that statements in this presentation do not relate to historical or current facts, they constitute forward-looking statements. All
News Release. ADC Media Relations: Mike Smith Office
 News Release FOR IMMEDIATE RELEASE Contacts: Tyco Electronics Media Relations: Joan Wainwright 610-893-9500 Office 609-903-5329 Mobile joan.wainwright@tycoelectronics.com ADC Media Relations: Mike Smith
JOINT VENTURE WITH HANIEL Delivering Shareholder Value. 16 December 2016
 JOINT VENTURE WITH HANIEL Delivering Shareholder Value Andy Ransom Chief Executive Jeremy Townsend Chief Financial Officer 16 December 2016 Executive Summary Today we have announced an agreement with Haniel
For personal use only TOUCHCORP 1H2015 RESULTS PRESENTATION DATED: THURSDAY, 27TH AUGUST 2015
 TOUCHCORP 1H2015 RESULTS PRESENTATION DATED: THURSDAY, 27TH AUGUST 2015 DISCLAIMER The material in this presentation has been prepared by Touchcorp Limited ARBN 603 731 184 (Touchcorp) and is general background
Introduction to ASSA ABLOY
 The ASSA ABLOY Group is the world s leading manufacturer and supplier of locks and associated products, dedicated to satisfying end-user needs for security, safety and convenience. Roadshow Q1 2001 Introduction
Casino takes a major step in further integrating its Latin American operations
 Casino takes a major step in further integrating its Latin American operations 30 July 2015 Table of contents Transaction summary Creation of a common platform consolidating Casino s operations in Latin
November 14, Rich Meelia President & CEO
 November 14, 2007 Rich Meelia President & CEO Forward-Looking Statements This presentation contains certain forward-looking statements within the meaning of the United States Private Securities Litigation
Pre-seen case study for Strategic level examinations Papers E3, P3 and F3. For examinations in May 2014 and September 2014
 Pre-seen case study for Strategic level examinations Papers E3, P3 and F3 For examinations in May 2014 and September 2014 PRE-SEEN MATERIAL, PROVIDED IN ADVANCE FOR PREPARATION AND STUDY FOR THE EXAMINATIONS
Supplemental Consolidated Financial Data for Fiscal 2011 Third Quarter and Nine Months ended December 31, 2010
 Supplemental Consolidated Financial Data for Fiscal 2011 and, 2010 February 2, 2011 Panasonic Corporation Note: SANYO and its subsidiaries became Panasonic s consolidated subsidiaries in December 2009.
Acquisition Butler Manufacturing Company
 Acquisition Butler Manufacturing Company Presentation to Investors Kirby Adams, CEO & Managing Director 16 February 2004 Acquisition Cost Cash offer of US$22.50 per share Transaction Value US$ Million
Creating a Global Industrial Leader
 Johnson Click to edit Master Controls title style and Tyco Creating a Global Industrial Leader NO OFFER OR SOLICITATION This communication is not intended to and does not constitute an offer to sell or
Electrical Products Group Conference. 21 / May / George Oliver, Chief Executive Officer
 Electrical Products Group Conference 21 / May / 214 George Oliver, Chief Executive Officer Forward-Looking Statements / Safe Harbor This presentation contains a number of forward-looking statements. In
CONSUMER BRANDS GROUP
 CONSUMER BRANDS GROUP AARON M. ERTER PRESIDENT CONSUMER BRANDS GROUP Forward Looking Statement The presentations today will contain certain forward looking statements," as defined under U.S. federal securities
Decorative Architectural Products. Jeff Filley / President Masco Coatings Group
 Decorative Architectural Products Jeff Filley / President Masco Coatings Group Safe Harbor Statement This presentation contains statements that reflect our views about our future performance and constitute
Q3 2016/17 RESULTS PRESENTATION. 31 August 2017
 Q3 2016/17 RESULTS PRESENTATION 31 August 2017 DISCLAIMER AND NOTES To the extent that statements in this presentation do not relate to historical or current facts, they constitute forward-looking statements.
2017 FULL YEAR RESULTS 8 MARCH 2018
 2017 FULL YEAR RESULTS 8 MARCH 2018 LEGAL DISCLAIMER Certain statements in this document are forward-looking statements. These forward-looking statements speak only as at the date of this document. These
2011 Fourth Quarter Results
 2011 Fourth Quarter Results February, 2012 INVESTOR RELATIONS Disclaimer The financial information in this document are consolidated earnings results based on K-IFRS. The previous earnings results have
BB&T Capital Markets Automotive Aftermarket Conference: Car Talk in the City August 17, 2011
 BB&T Capital Markets Automotive Aftermarket Conference: Car Talk in the City August 17, 2011 Forward Looking Statements The Company claims the protection of the safe-harbor for forward-looking statements
Annual General Meeting 2017 Review by the President and CEO. Mikko Helander
 Annual General Meeting 2017 Review by the President and CEO Mikko Helander Group Management Board Mikko Helander Jukka Erlund Johan Friman Terho Kalliokoski Anne Leppälä-Nilsson Matti Mettälä Lauri Peltola
Johnson Controls and Tyco Creating a Global Industrial Leader
 Johnson Controls and Tyco Creating a Global Industrial Leader Bernstein Strategic Decisions Conference June 3, 2016 George Oliver CEO Legal Disclosures NO OFFER OR SOLICITATION This communication is not
For personal use only
 PROPOSED MERGER OF AFTERPAY AND TOUCHCORP 30 MARCH 2017 INTRODUCTION MERGER IMPLEMENTATION AGREEMENT SIGNED BETWEEN AFTERPAY AND TOUCHCORP ON 30 MARCH 2017 RATIONALE ACCELERATE GROWTH PROFILE OF AFTERPAY
Company Presentation. 1H 2014 Results and Performance August 15, 2014
 Company Presentation 1H 2014 Results and Performance August 15, 2014 Disclaimer These presentations and/or other documents have been written and presented by Puregold Price Club, Inc. (PGOLD). PGOLD is
Interim Results 2009/10. Slides will be available at
 Interim Results 2009/10 Slides will be available at www.kingfisher.com Disclaimer The following presentation is being made only to, and is only directed at, persons to whom such presentation may lawfully
INVESTOR PRESENTATION
 TOUCHCORP LIMITED ASX:TCH WWW.TOUCHCORP.COM INVESTOR PRESENTATION $25.6M CAPITAL RAISING SEPTEMBER 2016 TOUCHCORP LIMITED 1 TOUCH SERVICE OFFERING TOUCHCORP NOW OFFERS ITS CUSTOMERS A COMPLETE OMNI-CHANNEL
Preliminary Results 20 May Mothercare Preliminary Results
 Preliminary Results 20 May 2010 Mothercare Preliminary Results Ben Gordon Chief Executive Performance highlights Group network sales up 10.0% to 1.1 billion Underlying profit from operations up 16.6% to
Year-end end report 2000
 The ASSA ABLOY Group is the world s leading manufacturer and supplier of locks and associated products, dedicated to satisfying end-user needs for security, safety and convenience. Year-end end report
WÜRTH GROUP DIRECT SELLING IN THE DIGITAL WORLD COMPANY PRESENTATION
 WÜRTH GROUP DIRECT SELLING IN THE DIGITAL WORLD COMPANY PRESENTATION Joachim Kaltmaier, CFO & Member of the Central Managing Board LBBW International Fixed Income Conference Stuttgart, 29 September 2015
Matas FY/Q4 2016/17 Results
 Matas FY/Q4 2016/17 Results Forward Looking Statements This presentation contains statements relating to the future, including statements regarding Matas A/S future operating results, financial position,
Steinhoff International, MARKUS JOOSTE HISTORY AND DEVELOPMENT OF STEINHOFF
 Steinhoff International, MARKUS JOOSTE HISTORY AND DEVELOPMENT OF STEINHOFF WELCOME 2 HISTORY: STEINHOFF INVOLVED IN HOUSEHOLD GOODS TRADING SINCE 1963 1963-1990: Sourcing in the East for the West City:
ScS Group Plc Interim Results For The 26 Weeks Ended 24 January 2015 March 2015
 ScS Group Plc Interim Results For The 26 Weeks Ended 24 January 2015 March 2015 October 2014 H1 2015 Highlights Financial Highlights: Like for like sales order intake up 7.8% Flooring up 13.0% Total sales
Steinhoff: is bigger better?
 Dirk van Vlaanderen - Associate Portfolio Manager From its humble beginnings in the 1960s - when German founder, Bruno Steinhoff, began sourcing Eastern European furniture for import to Western Europe
2010 Electrical Products Group Conference
 2010 Electrical Products Group Conference Ed Breen Chairman & Chief Executive Officer May 19, 2010 Forward-Looking Statements / Safe Harbor Certain statements in this presentation are forward-looking
Global Water Pipeline Leak Detection System (LDS) Market: Trends, Opportunities and Forecasts ( )
 Market: Trends, Opportunities and Forecasts ( )") Global Water Pipeline Leak Detection System (LDS) Market: Trends, Opportunities and Forecasts (2015-2020) By Technology Equipment, Inspection Service By Equipment Acoustic, Non Acoustics By Type Continuous
Global Water Pipeline Leak Detection System (LDS) Market: Trends, Opportunities and Forecasts (2015-2020) By Technology Equipment, Inspection Service By Equipment Acoustic, Non Acoustics By Type Continuous
Safe harbor statement
 1 Safe harbor statement During this presentation management may discuss certain forwardlooking statements concerning FEMSA s future performance that should be considered as good faith estimates made by
The NASDAQ 35th Investor Program. November 30,
 R The NASDAQ 35th Investor Program November 30, 2016 1 Forward Looking Statements Certain statements made in this presentation that are not based on historical information are forward-looking statements
Nestlé Investor Seminar
 Nestlé Investor Seminar BOB FLAHERTY V.P. of Wal Wal Mart Global Business Nestlé USA Nestlé Investor Seminar - Vevey June 8-9, 2005 Disclaimer This presentation contains forward looking statements which
EMBARGOED UNTIL 0700 HOURS - Thursday 2 June 2011
 EMBARGOED UNTIL 0700 HOURS - Thursday 2 June 2011 Kingfisher today reports total sales up 3.3% (+3.3% LFL) and retail profit up 19.1% for the first quarter Group Financial Summary (13 weeks ended 30 April
Canaccord Genuity 33 rd Annual Growth Conference August 14, 2013
 Canaccord Genuity 33 rd Annual Growth Conference Forward Looking Statements Certain statements made in this presentation that are not based on historical information are forward-looking statements which
Principal Brands UK and Northern Ireland
 Profile UK and Ireland based Building Materials Group Principal activities Builders and Plumbers Merchanting DIY Retailing in Ireland Dry Mortar Manufacturing Annualised turnover over 2.8 billion Market
The 29th Annual Cowen Health Care Conference March 18, Jim Green, President & CEO Analogic Corporation
 The 29th Annual Cowen Health Care Conference March 18, 2009 Jim Green, President & CEO Analogic Corporation 1 Safe Harbor Statement Any statements about future expectations, plans, and prospects for the
Q3 Report Johan Molin President & CEO
 Q3 Report 2011 Johan Molin President & CEO 1 Financial highlights Q3 2011 Good performance in a weak market Continued strong growth in Asia Stable but slow development in mature markets South America slowing
KESKO S ROADSHOW JUKKA ERLUND MAY 2016
 KESKO S ROADSHOW JUKKA ERLUND MAY 2016 1 KESKO Q1/2016 ROLLING 12 MO Net sales 8,610m Operating profit* 250m ROCE* 12.4% Personnel 22,000 Shareholders 40,000 Market capitalisation 3.8bn (Mar. 31, 2016)
2 ELECTROLUX Q PRESENTATION
 2 ELECTROLUX Q4 2017 PRESENTATION Q114 Q214 Q314 Q414 Q115 Q215 Q315 Q415 Q116 Q216 Q316 Q416 Q117 Q217 Q317 Q417 (SEKm) Q4 2017 Q4 2016 Change Sales 32,366 32,144 0.7% Organic growth 4.0% Acquisitions
CREATING TWO INDEPENDENT INTERNATIONAL LEADERS. 30 March 2016
 CREATING TWO INDEPENDENT INTERNATIONAL LEADERS 30 March 2016 To the extent that statements in this presentation do not relate to historical or current facts, they constitute forwardlooking statements.
WESFARMERS FORECASTS CONTINUED STRONG GROWTH
 WESFARMERS FORECASTS CONTINUED STRONG GROWTH 13 June 2001 Wesfarmers Limited today announced its takeover offer for all of the shares in Howard Smith Limited and provided its bidder s statement (the Bidder
P R E S S R E L E A S E
 P R E S S R E L E A S E from ASSA ABLOY AB (publ) Stockholm 8 November, 1999 no. 16/99 INTERIM REPORT JANUARY-SEPTEMBER 1999 Sales increased by 19% to SEK 7,532 M (6,317) Income before taxes increased
FY 2015/16 RESULTS PRESENTATION. 14 December 2016
 FY 2015/16 RESULTS PRESENTATION 14 December 2016 DISCLAIMER AND NOTES To the extent that statements in this presentation do not relate to historical or current facts, they constitute forward-looking statements.
NASDAQ OMX 30th Investor Program December 3, 2013
 NASDAQ OMX 30th Investor Program Forward Looking Statements Certain statements made in this presentation that are not based on historical information are forward-looking statements which are made pursuant
HONEYWELL ANNOUNCES PLANNED PORTFOLIO CHANGES
 Contacts: Media Investor Relations Scott Sayres Mark Macaluso (480) 257-5921 (973) 455-2222 scott.sayres@honeywell.com mark.macaluso@honeywell.com HONEYWELL ANNOUNCES PLANNED PORTFOLIO CHANGES Plans to
A World of Opportunity. Investor Presentation
 A World of Opportunity Investor Presentation October 2018 Forward-looking Statements Certain of the statements in this presentation may include forward-looking statements as defined in the Private Securities
May 24, 2018 Frankfurt/Main. DVFA Analyst Meeting May 2018 HORNBACH Group 2018
 HORNBACH Baumarkt AG DVFA Analyst Meeting May 24, 2018 Frankfurt/Main Page 1 Financial Calendar 2018 HORNBACH Group June 22, 2018 Financial Update: 1st Quarter of 2018/19 as of May 31, 2018 July 5, 2018
O KEY GROUP ANNOUNCES OPERATING RESULTS FOR Q4 AND 12M 2017
 Press Release 26 Jan 2018 O KEY GROUP ANNOUNCES OPERATING RESULTS FOR Q4 AND 12M 2017 O KEY Group S.A. (LSE: OKEY, the Group ), one of the leading Russian food retailers, announces its unaudited operating
Needham Growth Conference January 10,
 R Needham Growth Conference - 2017 January 10, 2017 1 Forward Looking Statements Certain statements made in this presentation that are not based on historical information are forward-looking statements
B&M European Value Retail SA Interim Results Presentation 26 weeks to 23 rd September 2017
 B&M European Value Retail SA Interim Results Presentation 26 weeks to 23 rd September 2017 Interim FY18 Group Highlights Group revenues increased by 21.7% to 1,346.4m B&M LFL revenues +7.5%, Q2 LFL +7.7%
PENTAIR AND TYCO FLOW
 PENTAIR AND TYCO FLOW A Powerful Combination, A Stronger Future MARCH 28, 2012 Randall J. Hogan Chairman and Chief Executive Officer Pentair, Inc. Edward D. Breen Chairman and Chief Executive Officer Tyco
2010 Green Product Portfolio
 2010 Green Product Portfolio Forward Looking Statements This presentation contains statements that we believe are forward-looking statements within the meaning of the Private Securities Litigation Reform
HORNBACH Baumarkt AG Group Q3/9M 2017/2018
 HORNBACH Baumarkt AG Group Q3/9M 2017/2018 Quarterly Statement as of November 30, 2017 2 HORNBACH BAUMARKT AG GROUP QUARTERLY STATEMENT: 3 RD QUARTER AND 1 ST NINE MONTHS OF 2017/2018 HORNBACH BAUMARKT
STARHILL GLOBAL REIT REPORTS 11.4% INCREASE IN 2Q 2010 GROSS REVENUE
 Media release by: YTL Starhill Global REIT Management Limited (YTL Starhill Global) Manager of: Starhill Global Real Estate Investment Trust (Starhill Global REIT) STARHILL GLOBAL REIT REPORTS 11.4% INCREASE
The ASSA ABLOY Group is the world s leading manufacturer and supplier of locks and associated products, dedicated to satisfying end-user needs for
 The ASSA ABLOY Group is the world s leading manufacturer and supplier of locks and associated products, dedicated to satisfying end-user needs for security, safety and convenience. Nine months report 2000
16th Annual ICR XChange Conference January 13, 2014
 16th Annual ICR XChange Conference January 13, 2014 Forward Looking Statements Certain statements made in this presentation that are not based on historical information are forward-looking statements which
KESKO PRESENTATION SEPTEMBER 2016 RIIKKA TOIVONEN
 KESKO PRESENTATION SEPTEMBER 2016 RIIKKA TOIVONEN 1 KESKO Q2/2016 ROLLING 12 MO Net sales 8,993m Operating profit* 253m ROCE* 12.6% Personnel 30,000 Shareholders 40,000 Market capitalisation 3.7bn (June
Following is a presentation that is to be given at the Macquarie Australia Conference in Sydney today, Wednesday, 2 May 2018.
 2 May 218 The Manager Company Announcements Office Australian Securities Exchange Dear Manager, MACQUARIE CONFERENCE BRIEFING PRESENTATION Following is a presentation that is to be given at the Macquarie
2017 HALF YEAR RESULTS 9 AUGUST 2017
 2017 HALF YEAR RESULTS 9 AUGUST 2017 ASHLEY ALMANZA CHIEF EXECUTIVE OFFICER LEGAL DISCLAIMER Certain statements in this document are forward-looking statements. These forward-looking statements speak only
DRESSER-RAND GROUP INC.
 DRESSER-RAND GROUP INC. FORM 8-K (Current report filing) Filed 4/6/2007 For Period Ending 4/5/2007 Address PAUL CLARK DRIVE OLEAN, New York 14760 Telephone (716) 375-3000 CIK 0001316656 Industry Misc.
Q3 2016/17 RESULTS PRESENTATION. 31 August 2017
 Q3 2016/17 RESULTS PRESENTATION 31 August 2017 DISCLAIMER AND NOTES To the extent that statements in this presentation do not relate to historical or current facts, they constitute forward-looking statements.
INVESTOR NEWS /16
 Düsseldorf, 14.12.2016 1/8 INVESTOR NEWS 1-2015/16 METRO GROUP meets sales and earnings targets in financial year 2015/16 EBIT from continuing operations before special items reaches 1,560 million (2014/15:
Investor Briefing. ADT Caps Acquisition. SK Telecom
 ADT Caps Acquisition SK Telecom 208. 5. 8 0 ADT Caps Acquisition Disclaimer This presentation contains forward-looking statements with respect to the results of operations and business of SK Telecom (the
METRO GROUP continues operational improvement trend in 2014/15
 15 December 2015 1/11 METRO GROUP continues operational improvement trend in 2014/15 EBIT before special items totalling 1,511 million, influenced by the negative impact of exchange rate effects amounting
Earnings Presentation Second Quarter September 2012
 Earnings Presentation Second Quarter 2012 September 2012 Key Issues First Half 2012 Cencosud Projects Second Quarter Results Company overview Key metrics (2Q12) Number of stores: 920 Selling space: 3,495,857
Sidoti Emerging Growth Investor Forum March 18, 2014
 Sidoti Emerging Growth Investor Forum March 18, 2014 Forward Looking Statements Certain statements made in this presentation that are not based on historical information are forward-looking statements
Corporate Presentation. November 2018
 Corporate Presentation November 2018 Company Profile FOURLIS GROUP is a leading retail group of companies of quality consumer goods in Southeast Europe. The initial company was founded in 1950. The group
METRO GROUP achieves sales target and confirms EBIT guidance
 19 October 2015 1/5 METRO GROUP achieves sales target and confirms EBIT guidance Like-for-like sales growth of 1.5% in financial year 2014/15 Growth drivers online retail and delivery remain successful
LENTA SALES AND OPERATING HIGHLIGHTS FOR THE FIRST QUARTER ENDED 31 MARCH 2018
 LENTA SALES AND OPERATING HIGHLIGHTS FOR THE FIRST QUARTER ENDED 31 MARCH 2018 St-Petersburg, Russia; 19 April, 2018 Lenta Ltd, (LSE, MOEX: LNTA / Lenta or the Company ) one of the largest retail chains
Earnings Presentation First Quarter May 2012
 Earnings Presentation First Quarter 2012 May 2012 Company overview Key metrics (LTM 2012 1 ) Number of stores: 906 Selling space: 3,3 million sq 2 Number of customers: 800mm Number of employees: 139,082
Growth opportunities in Asia Pacific and the Middle East. January 2009
 Growth opportunities in Asia Pacific and the Middle East January 2009 Nick Buckles Chief Executive Officer Agenda G4S overview Asia Pacific and Middle East security markets overview G4S in Asia Pacific
Results and strategy of CCC Group
 01 Results and strategy of CCC Group Strategy of dynamic foreign expansion will be continued with the CEE countries being the most important part of the future growth. Besides Poland, Czech Republic, Slovakia
SGREIT reports DPU of 1.17 cents for 2Q FY17/18
 Media release by: YTL Starhill Global REIT Management Limited (YTL Starhill Global) Manager of: Starhill Global Real Estate Investment Trust (SGREIT) SGREIT reports DPU of 1.17 cents for 2Q FY17/18 HIGHLIGHTS
Adding Value to Our Customers Products and Services ANNUAL REPORT 06 FTK
 Adding Value to Our Customers Products and Services 20 ANNUAL REPORT 06 FTK FLOTEK INDUSTRIES IN SUMMARY Flotek Industries, Inc is a diversified global supplier of drilling and production related products
Making the world a safer place to travel QUIXOTE CORPORATION
 Making the world a safer place to travel QUIXOTE CORPORATION MISSION ENHANCE THE SAFETY, EFFICIENCY & SECURITY OF TRANSPORTATION SYSTEMS WORLD WIDE. BUSINESS SEGMENTS PROTECT & DIRECT: Provide products
LEADERSHIP FOR GROWTH GOSH, April 2016 METRO AG 2016
 LEADERSHIP FOR GROWTH GOSH, April 2016 METRO AG 2016 MADE FOR SUCCESS: METRO GROUP AT A GLANCE. One of the world s leading retail and wholesale companies Successful stock-listed company Presence in over
Johnson Rice Energy Conference
 Johnson Rice Energy Conference October 5, 2011 Forward-Looking Statements This document contains forward-looking statements and information regarding the Company and Quinn s Oilfield Supply ( Quinn ),
Acquisition of a Chinese plasma fractionator. 13 June 2017
 Acquisition of a Chinese plasma fractionator 13 June 2017 Legal Notice Forward looking statements The materials in this presentation speak only as of the date of these materials, and include forward looking
AVANTE LOGIXX INC. Welcomes you to the Annual General Meeting. September 19, 2017
 AVANTE LOGIXX INC. Welcomes you to the Annual General Meeting September 19, 2017 AVANTE LOGIXX - BRANDS AVANTE SECURITY INC. INTO-ELECTRONICS INC. CITY WIDE LOCKSMITHS LTD. ARCHITRONICS LIMITED AVANTE
Press release from ASSA ABLOY AB (publ)
") Press release from ASSA ABLOY AB (publ) 5 November, 1998, No. 16 INTERIM REPORT, JANUARY-SEPTEMBER, 1998 Sales increased by 28% to 6317 MSEK (4949) The organic sales growth for comparable units amounted
Press release from ASSA ABLOY AB (publ) 5 November, 1998, No. 16 INTERIM REPORT, JANUARY-SEPTEMBER, 1998 Sales increased by 28% to 6317 MSEK (4949) The organic sales growth for comparable units amounted
PUREGOLD PRICE CLUB, INC.
 Sa PUREGOLD PRICE CLUB, INC., Always Panalo! Company Presentation 1Q 2016 Results and Performance July 2016 Disclaimer These presentations and/or other documents have been written and presented by Puregold
United States Oil and Gas Pipeline Leak Detection System (LDS) Market (By Equipment, By Application, By Region) - An Analysis: 2017 Edition
 Market (By Equipment, By Application, By Region) - An Analysis: 2017 Edition") United States Oil and Gas Pipeline Leak Detection System (LDS) Market (By Equipment, By Application, By Region) - An Analysis: 2017 Edition By Equipment - Flow meters, Pressure Sensors, Fibre Optics and
United States Oil and Gas Pipeline Leak Detection System (LDS) Market (By Equipment, By Application, By Region) - An Analysis: 2017 Edition By Equipment - Flow meters, Pressure Sensors, Fibre Optics and
Third Quarter 2016 Results Summary
 Third Quarter 2016 Results Summary Disclaimer This presentation contains forward-looking statements within the meaning of the Private Securities Litigation Reform Act of 1995. Statements regarding expectations
FY2017 Consolidated Business Results May 9, 2018 Toshiba Tec Corporation
 FY2017 Consolidated Business Results May 9, 2018 Toshiba Tec Corporation Content 01 Key Messages 02 FY2017 Consolidated Business Results 03 FY2018 Forecast 1 Key Messages Toshiba Tec achieved the highest
LOWE S SECURITY ANALYSIS TERRY ASANTE
 LOWE S SECURITY ANALYSIS TERRY ASANTE THE OUTLINE 1. Theme 2. Business Analysis 3. Financial Analysis 4. Stock Valuation 5. The moat 6. Risk 7. Bulls vs.. Bears 8. Investing Strategies THE THEME Lowe s
Handelsbanken's Mid/Small Cap seminar SVP, Arja Talma June 16, 2014 Stockholm
 Handelsbanken's Mid/Small Cap seminar SVP, Arja Talma June 16, 2014 Stockholm Kesko today Kesko s net sales 9.3bn - K-Group s sales 11.6bn 2,000 stores in eight countries Over 1.3 million customer visits
Q1 2014/15 RESULTS PRESENTATION. 10 February 2015
 2014/15 RESULTS PRESENTATION 10 February 2015 DISCLAIMER AND NOTES To the extent that statements in this presentation do not relate to historical or current facts, they constitute forward-looking statements.
Market Characteristics
 Market Characteristics Cash Solutions Key Characteristics Above group average margins Consolidated markets Very high G4S competitive expertise Cost base fixed in short term Long Term Growth Drivers Development
Almacenes Éxito S.A. Consolidated Financial Results
 Almacenes Éxito S.A. Consolidated Financial Results For the second quarter and six-month period ended June 30, Viva Caucasia Shopping Mall BVC (The Colombian Stock Exchange): ÉXITO ADR Program: ALAXL Medellín,
Kingfisher plc Sarah Levy. Director of Investor Relations
 Kingfisher plc Sarah Levy Director of Investor Relations Agenda Kingfisher at a Glance Strategic History Our Markets and Brands Creating the Leader Strategy Q1 2014/15 Summary Priorities for 2014/15 Appendix
SEB Seminar. CFO Jukka Erlund Copenhagen
 SEB Seminar CFO 8.1.2015 Copenhagen Kesko today Kesko s net sales 9.2bn - K-Group s sales 11.4bn Net sales Q4/13-Q3/14 9,166m 2,000 stores in eight countries Over 1.3 million customer visits every day
Stable sales excluding petrol (at constant exchange rates) Q sales inc. VAT: 22.7bn
 Q sales inc. VAT: 22.7bn") Q1 2009 sales incl. VAT 16 April 2009 Stable sales excluding petrol (at constant exchange rates) Q1 2009 sales inc. VAT: 22.7bn o Q1 2009 sales including VAT: 22.7bn, 1.4% at constant exchange rates o
Q1 2009 sales incl. VAT 16 April 2009 Stable sales excluding petrol (at constant exchange rates) Q1 2009 sales inc. VAT: 22.7bn o Q1 2009 sales including VAT: 22.7bn, 1.4% at constant exchange rates o