Kelowna Fire Department Strategic Plan An evidence based, flexible & dynamic approach for the City of Kelowna s Fire Service
|
|
|
- Nickolas Bradford
- 5 years ago
- Views:
Transcription


1 Kelowna Fire Department Strategic Plan An evidence based, flexible & dynamic approach for the City of Kelowna s Fire Service 1 P a g e
2 Table of Contents EXECUTIVE SUMMARY... 5 OVERVIEW... 5 METHODOLOGY... 6 SUMMARY OF ASSESSMENT FACTORS... 9 SUMMARY OF OPTIONS SUMMARY OF RECOMMENDATIONS SUMMARY OF COSTS CONCLUSION ACKNOWLEDGEMENTS SECTION 1 INTRODUCTION PREFACE SECTION 2 CITY OF KELOWNA OVERVIEW PURPOSE STANDARDS AND REFERENCES STUDY METHODOLOGY SECTION 3 RISK ASSESSMENT COMMUNITY GROWTH AND RISK ASSESSMENT RISK ANALYSIS Risk Evaluation Matrix COMMUNITY RISK CONSIDERATIONS Risk Management RISK ANALYSIS CATEGORIES City Foot Print Residential Construction Types; Interface Risks (wildland/forest fire risks) Rate of Growth and Demographics Industrial/Commercial Activities Transportation Systems and Growth in Traffic Volumes P a g e
3 3.4.7 Water Flows for Firefighting PREDICTIVE MODELLING AND DYNAMIC DEPLOYMENT SYSTEM (PM/DDS) SECTION 4 PROGRAM AND SERVICES HUMAN RESOURCES VISION AND VALUES SERVICES PROVIDED FIRE PREVENTION FIRE TRAINING REGIONAL SERVICES Fire Dispatch Emergency Management Regional Rescue Services FIRE OPERATIONS SECTION 5 RESOURCES AND PERFORMANCE CURRENT STATIONS DISPATCH CENTRE TRAINING AREAS APPARATUS AND EQUIPMENT AND OTHER MAJOR EQUIPMENT EMERGENCY VEHICLE EFFCIENCIES COMMUNITY COMPARABLE ANALYSIS RESPONSE STATISTICS SERVICE EFFECTIVENESS FIRE COMPANY SIZE EMERGENCY RESPONSE SERVICES SUMMARY CURRENT STAFFING AND CRITICAL TASKING ALARM ASSIGNMENT SYSTEM PAID ON CALL FIREFIGHTERS SECTION 6 GAP ANALYSIS AND OPTIONS SUMMARY OF ASSESSMENT FACTOR FIRE UNDERWRITERS SURVEY P a g e
4 6.3 TURN OUT TIME ANALYSIS STATION ANALYSIS PM/DDS AND STATISTICAL ANALYSIS PM/DDS Response System Maps Comparison: Status Quo Recommended Station FIRST MEDICAL RESPONSE/EMERGENCY MEDICAL RESPONSE CONTRACTED AREA LAKE COUNTRY FIRE PREVENTION STAFFING TRAINING & FACILITY FIRE DISPATCH SERVICES COSTS AND BUDGETING SUMMARY SECTION 7 SUMMARY APPENDIX A ACRONYMS APPENDIX B CRITICAL TASK TIME CHARTS APPENDIX C FUS TABLE OF EFFECTIVE RESPONSE APPENDIX D OPTION A COSTS & CAPITAL REQUIREMENTS APPENDIX D OPTION B COSTS & CAPITAL REQUIREMENTS CONT APPENDIX E COMPARATIVE COMMUNITY RESPONSE TIME ANALYSIS APPENDIX F AGRICULTURAL LAND COMMISSION DECISION P a g e
5 EXECUTIVE SUMMARY OVERVIEW The purpose of this report is to establish a strategic plan that will guide the Kelowna Fire Department (KFD), the City Executives, and the Mayor and Council over the next 14 years in the delivery of valued protective services to the citizens of Kelowna. The scope of this report includes a comprehensive analysis on all programs and services delivered by the KFD. This Executive Summary focuses on the current and future emergency response system with an emphasis on the collection of data, scientific analysis and evidence based decisions. All services including fire suppression, training, fire prevention and education and Regional Services including Dispatch, Emergency Management and technical rescue are highlighted. The conclusions and recommended options for consideration are outlined in section 6.6 Resource Deployment Model & Staffing Options. The development of this plan followed a typical strategic planning system of evaluating the current state, determining where KFD should be and how to get there, followed by implementation that includes an accountability and reassessment process. Current State: Environmental Scan Strategic Framework Data Collection Strenths, Weaknesses, Opportuntiess & Threats (SWOT) Organization & Resources Previous KFD studies Where KFD Should Be and how to get there:: Vision & Mission Define Strategic Outcomes Leading Practices & Innovation Develop Performance Targets & Outputs Recommendations & Goals Implementation: Accountability Performance Targets Measurement Reassessement 5 P a g e

6 The strategic outcomes are a key aspect of this plan in that they establish the criteria to evaluate the options and recommendations contained in this report. The following applies: Risk based levels of service for all areas of the City of Kelowna Realistic and achievable performance targets Alignment with Corporate goals and objectives Establishes accountability measures Optional implementation based upon priorities A peer review was conducted by 3 contemporary Fire Chiefs as part of the feedback and validation process. Their feedback and comments have been considered and integrated into this report. METHODOLOGY The KFD Strategic Plan provides a framework for the cost-effective and efficient delivery of service to the City, its partners and other stakeholders. The illustration below provides a visual representation of the strategic framework considered in the development of this plan: This plan strives to meet current and future demands for KFD service delivery requirements over the next 14 years. Further it establishes a foundation for service delivery beyond this time period. 6 P a g e
7 The KFD Strategic Plan is built on risk analysis, the use of predictive modeling including historical data analysis, industry leading practices, community comparative, and Subject Matter Expert (SME) input that lead to improved service delivery targets and realistic performance measures. In order to achieve this, the KFD Strategic Plan will: Ensure service levels are balanced with community expectations with defined risks Utilize evidence based data to support decisions Ensure costs are sustainable and economically feasible for the City Satisfy all legislative and regulatory requirements Align with corporate direction including the Strategic Plan, Official Community Plan (OCP)and other related decisions and plans Be dynamic, flexible and adaptable to change Engage stakeholders, expand partnerships and build relationships Compare services to other similar communities This plan is based on the thorough collection of data and analyses that lead to evidence based recommended service level options. The illustration below provides a visual representation of this process: SME Community Expecation Sound Fiscal Responsibility Comparitive Municipalities Wildland Development Plan Legislation NFPA Standards/ Fire Underwriters Study /Leading practices PM/DDS (Historic Response Data) Identified Assessment Factors Risk Assessment Community Profile/Growth Of particular note is the Predictive Modelling and Dynamic Deployment System (PM/DDS). Across North America leading fire services are using PM/DDS to improve the overall efficiency and effectiveness of the emergency response system. In 2014, City Council approved the procurement of PM/DDS for the KFD from Deccan International Inc. This computer based system located in Fire Dispatch employs risk 7 P a g e
8 tolerance decisions based upon historical data and other related factors to determine the optimum deployment system for the concentration and distribution of emergency response resources. Two modules of the software are currently in use. The first uses historical data to inform what is and maps call volumes, response times and coverage, identifying gaps. The second module shows what if and allows multiple operational deployment models to be measured for effectiveness, efficiency and how best to address current gaps in service delivery. Historically, fire departments have employed a geographic response model. This is where stations, staff and equipment are strategically placed throughout the community to effectively respond to any type of emergency within an established response area. Progressive departments are now moving beyond the simple geographical response model and are considering both dynamic deployment and risk based response. PM/DDS allows for the balance of future considerations to be based on all 3 types of deployment models: geographic, dynamic deployment and risk based response to assess and determine the most effective coverage to meet Kelowna s needs. The 3 types of deployment models are described below: Geographical Response: is the establishment of response zones based on the community s geography. This is the traditional use of natural and human made boundaries, transportation system and distances to determine the station location and response area. Dynamic Deployment: is the strategic positioning and deployment of staffing and related resources based on peak call volume times, and known risk factors. An example of this is deploying resources to a specific area for peak call volume times only. Risk Based Response: is identifying what resources and related training are required for a specific response to identified risks. An example is deploying smaller response units such as a bush truck to medical response instead of a fully staffed Engine company. The full implementation of PM/DDS will ensure future operational and strategic decisions are based on using modern analytics in conjunction with local experience to create effective and efficient deployment of units. This allows for the maintenance of service level standards in a growing community within reasonable fiscal constraints. This tool supports the development of relevant key performance indicators that will measure the success of future innovations in the deployment models. 8 P a g e
9 SUMMARY OF ASSESSMENT FACTORS Throughout the report several Assessment Factors have been highlighted as having a direct impact on the development of performance targets. The following is a summary of these factors: 1. Emergency response performance targets will be evidence based data with consideration for the City footprint; residential construction types; interface risks (wildland/forest fire risks), rate of growth and demographics; Industrial/commercial activities; transportation systems, growth in traffic volumes and available water flows for firefighting. 2. Emergency response performance target options will be developed by applying geographic coverage, dynamic deployment and risk based responses as efficiency and operational effectiveness measures. 3. PM/DDS will provide the evidence based data to develop emergency response targets. 4. Emergency response performance targets will ensure compliance with provincial safety and training standards legislation. 5. To enhance operational effectiveness and efficiency, life cycle replacement Engines will be tendered as multi-purpose Engine/Rescues. The existing fleet will be examined to determine if a retrofit is possible to create the multipurpose capability. 6. In comparison to similar sized cities, KFD has the highest call volume, the second lowest ratio of career Firefighters per capita and the third highest population. 7. Distribution and concentration of KFD resources will be based upon mitigating fire related death, injury and dollar loss trends 8. Emergency response performance targets will be realistically related to effective response time for initial assignment (first vehicle on emergency scene). 9. Emergency response performance target options will include: Minimum staffing of Engines to remain at 4 Firefighters Role and limitations of the Paid On Call (POC) system KFD current Effective Response Force (ERF) is limited to mitigating a single event low to moderate risk situations. High & Maximum risk events will require additional resources above the ERF and may include external agencies and/or mutual aid from neighboring communities. 9 P a g e
10 SUMMARY OF OPTIONS The analysis contained in this report indicates there are two underserved areas within the City (Glenmore/UBC/YLW and KLO/Gordon/Pandosy). The assessed risk tolerance requires the increase of career stations from 4 to 5 as soon as possible. This will address the service gap in the Glenmore/UBC/YLW area. The KLO/Gordon/Pandosy area will be served through the use of dynamic deployment and risk based responses until such time as a 6 th station is required. This assertion is based upon the City risk and Assessment Factors and other relevant considerations identified in this report. This analysis is consistent with the previous four studies (Section 1.5) conducted on KFD and the service delivery gaps within the PGB for the initial response in the Glenmore/UBCO/YLW and KLO/Gordon/Pandosy areas. The PM/DDS evidence based analysis serves to substantiate these previous studies through leading technology. The preferred implementation would be to renovate Station 8 in Glenmore as an interim facility until the new Station 5 is completed and hire 20 firefighters in Understanding the need for financial constraint incremental staffing has been identified as follows: Table 23 Incremental staffing options Staffing Options Comments Option A 12 8 New Station 5 completed Option B New Station 5 completed Addresses geographic and risk coverage in Glenmore/UBC/YLW area. The ability of Station 1 to mobilize the 2 Firefighter Rescue unit for risk and dynamic deployments particularly in the KLO/Gordon/Pandosy areas is delayed until 2019 Provides partial geographic coverage and risk in Glenmore/UBC/YLW area. May require increased overtime or reduced service levels depending upon available staffing. The ability of Station 1 to mobilize the 2 Firefighter Rescue unit for risk and dynamic deployments particularly in the KLO/Gordon/Pandosy areas is delayed until 2019 It is important to note that KFD, as part of the annual business plan and budget process will review the response system performance utilizing PM/DDS. This is not 10 P a g e
11 only to monitor performance target progress but to look for further opportunities to increase efficiencies and operational effectiveness. The following section provides a more in-depth comparison of the current traditional centralized support model with the recommended Station 5 Glenmore/UBCO/YLW Area - Convergent Support Model Recommended: Station 5 Glenmore/UBCO/YLW Area - Convergent Support Model Response Capacity: 5 career stations, 5 Engine companies, Rescue unit of 2 Firefighters and 3 POC Stations. The need for Station 5, as a replacement for the current Station 8, has been identified previously in 4 studies and has been most recently confirmed through the use of PM/DDS Analytics. As the area continues to develop, Engine companies from Stations 1 and 2 are facing increasing travel times, reducing effective response while also removing critical assets from some of the City s busiest areas, particularly Station 2 s downtown coverage area. Station 5 will require the addition of 20 new Firefighters, resulting in a fifth career Engine company within the City. This Engine company will continue to be supported by the other career stations and the POCs in the Glenmore and McKinley areas, but will considerably reduce response times for incidents in those areas. It is understood that construction of Station 5 will not be complete by 2017; therefore, the units will be temporarily based out of Station 8 until the new Station 5 is complete. In reviewing the analytics and the need to address an underserved area (Glenmore/UBCO/YLW), the Engine company will be committed to geographic coverage the majority of the time during the day time period where the call volume is historically higher. The MDS will increase to 23. The addition of another Engine company will aid in convergent support to Station 1. In addition, OT and call backs will be reduced significantly by an estimated $125,000 with the increased response capacity to support the City during larger incidents or incidents that commit resources for extended periods such as Marine Rescue and the majority of single family residential fires. With the additional staffing, a more dynamic deployment approach to resource deployment will be achieved. As part of this model, the Rescue unit would be available for dynamic deployment and risk based responses. The primary focus will be coverage for the KLO/Pandosy area and response to lower risk calls as identified by PM/DDS. 11 P a g e
12 The operational costs including incremental staffing options is in the range of $3.1 million per year over the next 14 years. Staffing option B is on average $38,000 less per year than option A over the same 14-year period. Advantages: Incremental implementation that reduces overall interim costs as compared to full staffing and addresses existing service gap without delay. Allows for much of the flexibility with deferred costs through incremental staffing. Demonstrates efficiencies and effectiveness on an ongoing basis. Risk model can be adjusted and is based upon, and validated by scientific data. Does not result in a degradation of current service levels and will improve overall efficiencies by redistributing/redeployment of existing resources. Deletion/revision of DLC contracted fire suppression service resulting in a potential savings of approximately $280,000 in Enhances response service level for McKinley area. Fire Engines at the outer perimeter of all quadrants of the response zones allowing a convergent response from the perimeter. Delays the need for Station 6 through risk based responses and dynamic deployments once full implementation has occurred. Disadvantages: Until full implementation of the new Station 5 is completed utilization of dynamic deployment and risk based responses is not possible. This may result in extended response time for the KLO/Pandosy area. Once the Rescue unit is reestablished at Station 1, the dynamic deployment coverage for this area will be possible. Rescue/Engine is deployed beyond the core area for an interim period. Current Traditional Centralized Support Model Response Capacity: 4 career Stations, 4 Engine Companies, and Rescue Unit of 2 Firefighters and 3 POC Stations. The current MDS is 19. POC staffing is 45. The current traditional model utilizes Station 1 staff to provide support to each of the other Engine Companies located at Stations 2, 3 and 4 along with responses in the 3 POC Stations 7, 8 and 9. Station 1 is staffed with a 4 firefighter Engine Company and a 2 Firefighter Rescue unit. The Rescue unit provides all FMR responses within Station 1, 7, 8 & 9 areas. POC Stations 7 and 9 co-respond when available for FMRs in their respective areas. 12 P a g e
13 Advantages: Cost containment is achieved as there is no increase in service, staff, Stations or equipment. Increased use of dynamic deployment with the Rescue unit to support other stations, including potential to use smaller more mobile vehicles in responding to medical calls. POCs remain a viable and critical support resource. Disadvantages: Does not address identified risks in growing areas, most notably Glenmore/UBCO/YLW and the KLO/Pandosy area. Maintains the traditional service delivery system that is based upon geographic coverage only and considered to be inefficient. Degradation in service delivery is inevitable due to population and construction growth. Requires callback of off duty staff for Marine Rescue calls and single family structure fires. POC attendance cannot be relied upon depending upon the time of day etc. Response times do not align with risk assessment, preferred performance target, or comparative communities. Below is a comparison table that evaluates the current traditional centralized support model with the recommended Station 5 Glenmore/UBCO/YLW Area - Convergent Support Model: Strategic Goals: Criteria Risk based levels of service for all areas of the City Innovative and Non-traditional Realistic and achievable performance targets Current traditional centralized support model No: 2 areas with identified service gaps KLO/Pandosy and Glenmore/UBCO/YLW areas Traditional geographic coverage deployment model None formally established. Current response system is 9:31 minutes inside PGB, 14:30 minutes outside PGB. Well beyond comparative communities, industry guidelines and leading practices. Increase risks for public, firefighters and property loss Recommended 5 Glenmore/UBCO/YLW Area - Convergent Support Model Yes: addresses identified service gaps with full implementation. Service gap in KLO/Pandosy area not addressed until full staffing of station 5 and then dynamic deployment will be utilized until Station 6 is required. Non-traditional, innovative convergent model. Using PM/DDS technology dynamic and risk based responses integrated with geographic coverage Yes: based upon PM/DDS analytics response system targets will be: 7:40 minutes in 90% inside PGB, 11:40 minutes outside PGB 13 P a g e
14 Alignment with Corporate goals and objectives Establishes accountability measures Optional implementation based upon priorities No: Shortfall in Corporate Framework &Plan A well run City A safe City No: Performance targets not monitored corporately at this time. Current system capacity if adopted can be monitored. Not applicable Yes: achieves performance excellence through continuous improvement Provides rapid fire emergency response throughout the City Yes: Performance target objectives will be continuously monitored for achievement or adjustment Yes: part of Corporate annual budget approval process SUMMARY OF RECOMMENDATIONS RECOMMENDATION 1 That the City identifies an appropriately zoned parcel of land for the construction and career staffing of a new Station (#5) in North Glenmore at or near the intersection of Glenmore Rd and John Hindle Dr (near or inside the #3 Area Structure Plan). RECOMMENDATION 2 KFD will set a performance target to achieve an average turnout time of 1:40 minutes for fire responses and 1:20 minutes for medical responses. Ongoing system reviews will be conducted for continuous improvement of turnout times. RECOMMENDATION 3 KFD will base the preferred PM/DDS analysis on geographic coverage along with incident volume (risk based response). RECOMMENDATION 4 KFD will establish performance targets for response times within the PGB to have the first fire truck arriving (dispatch to on scene time) within 7:40 minutes 90% of the time of being dispatched for all emergency types. For areas outside of the PGB, the deployment is the same with the first fire truck arriving within 11:40 minutes 90% of the time of being dispatched to arriving on scene. RECOMMENDATION 5 The City will increase the KFD resource deployment capacity to 5 career stations. This will require the construction of a new station in the Glenmore/UBC/YLW area, the addition of 20 firefighters and a replacement Engine and Bush truck. 14 P a g e
15 RECOMMENDATION 6 That KFD and the City conduct a complete review and audit of the contracted area fire suppression service with the view to establish performance measures for District of Lake Country (DLC) or alternatively determine if KFD can provide an equivalent level of service within the current or proposed performance targets recommendations contained in this report. RECOMMENDATION 7 KFD will monitor the need for 1 additional Fire Inspector. This position would be dedicated to the public education and pre fire planning functions. RECOMMENDATION 8 That the opportunity to incorporate a dedicated training center as a potential source of revenue to be included in the planning and funding of the future Station 5. RECOMMENDATION 9 That KFD continue to further market dispatch services to both traditional and nontraditional clients, with a focus on managing current costs to the City, while maintaining or enhancing critical service levels. SUMMARY OF COSTS A summary of the costs associated with this Strategic Plan is located at Section: 6.12 Costs & Budgeting Summary. A complete cost estimate schedule of this Strategic Plan up to 2030 is attached as Appendix D. The operational costs including incremental staffing options is in the range of $3.1 million per year over the next 14 years. Staffing option B is on average $38,000 less per year than option A over the same 14-year period. The final capital costing of a new station, apparatus, equipment and land acquisition has been estimated in a rough order of magnitude to be $9.1 million. More accurate estimates will be determined within the City Infrastructure and Community Planning Departments along with KFD input. CONCLUSION In Canada, all orders of government are facing strong demands for cost management and increased value in the delivery of services to citizens. Elected officials and government administrators are constantly searching for ways to balance public expectations within financial constraints. It is challenging to deliver valuable services and programs, while maintaining fiscal restraint amidst global, international, national and local economic realities. It is this fiscal restraint that has stimulated the need for 15 P a g e
16 today s Fire Chiefs to undertake a more businesslike approach to leading/managing their respective departments. They must be proactive and in line with corporate priorities, and examine all aspects of the service delivery to find efficiencies. The KFD Strategic Plan has utilized leading technology along with multiple layers of data, evidence analyses and relevant information to develop an innovative and efficient service delivery system that balances risk, firefighter and public safety with the fiscal realities that the City faces today and into the next 14 years. 16 P a g e
17 ACKNOWLEDGEMENTS This report required significant effort from a number of the City and KFD staff. By enlarge it was a total team project and the support from all those involved is greatly appreciated; Deputy City Manager, Paul Macklem Divisional Director, Human Resources & Corporate Performance Stu Leatherdale KFD Human Resource Manager Cornelia Bulgaria Financial Services Director and KFD Liaison Genelle Davidson Financial Analyst, Jennifer Grills Urban Planning Manager Terry Barton Manager, Parks & Buildings Planning, Robert Parlane Building Services Manager Martin Johansen Deputy Chief Administration, Fire Prevention & Training Lou Wilde Deputy Chief Operations Larry Hollier Deputy Chief Communications & Emergency Programs Travis Whiting Finance and Administration Supervisor Sandy Scott Platoon Captain Tim Light KFD Secretary Candace Friesen IAFF Executive Team: Dennis Miller, Mike Hill, Jason Picklyk & Troy Mamchur 17 P a g e
18 1. SECTION 1 INTRODUCTION 1.1 PREFACE The scope of this report is focused on operational outputs for KFD. This includes analysis on all programs and services delivered by the Department with an emphasis on the emergency response system. Options and recommendations are included based upon the risk assessment and other relevant factors contained throughout the report. The intent is to provide a plan for the future that will guide the Department, the City Executives Leadership Teams, the Mayor and Council in the delivery of valued essential services to the citizens of Kelowna. The use of a modern Predictive Modeling and Dynamic Deployment System (PM/DDS) software program was instrumental in determining the most efficient and effective use of resources to balance risks, firefighter and public safety with financial sustainability. The strategic outcomes are a key aspect of this plan in that they establish the criteria to evaluate the options and recommendations. The following applies: Risk based levels of service for all areas of the City Realistic and achievable performance targets Alignment with Corporate goals and objectives Establishes accountability measures Optional implementation based upon priorities 2. SECTION 2 CITY OF KELOWNA OVERVIEW The City is the 7 th largest city in the province with 124,000 residents and the 43 rd largest city in Canada. On any given day of the year on average, an additional 4500 people visit Kelowna and an unknown number of commuters come to Kelowna for work or to reside. The percentage of seniors (age 65+) will continue to increase over the coming years. As the rate of natural population increase is expected to continue to decline, population growth in Kelowna will continue to rely on migration, particularly those moving here from other parts of BC. The City is focused on creating vibrant urban centers with a diverse range of housing options to help meet the changing demographics. Changes in anticipated population growth and composition will also be incorporated into broader strategies as part of the next OCP update, scheduled to begin in Nearly 96% of Kelowna residents feel they have a good or very good quality of life, while listing transportation and growth management among the top issues facing the City. As a contributor to quality of life, the crime rate and crime severity are 18 P a g e
19 declining. Recognizing safety is a priority for residents, a new police services building is being constructed downtown to give the RCMP the support system and efficiencies they need to keep Kelowna neighbourhoods, business areas and downtown safe well into the future. The overall picture of the local economy appears to be positive, with economic measures showing modest improvements in performance, evidence of recovery from the economic downturn. However, meeting the labour market requirements of local employers will need to be addressed to sustain economic growth in the long term. In 2014, Council approved a new Innovation Centre that will play a key role in fostering innovation and growth in the region, driving the creation of new jobs and helping to build economic prosperity and diversity. Kelowna s ownership housing market has remained relatively steady and is forecast to return to moderate growth over the next 2 years in a balanced market. The rental market, however, is constrained with a decreased vacancy rate and increased rental costs. The City continues to pursue partnership opportunities with both private and public sectors, and to offer financial incentives to encourage the development of rental housing. While early in the measurement process, data suggests that Kelowna residents are making changes for the betterment of the environment. Over the past few years, Kelowna has experienced reductions in Green House Gas (GHG) emissions, energy and water consumption and increases in more sustainable transportation choices. The expansion of the transit and active transportation networks, and the development of a Pedestrian and Cycling Master Plan (currently underway), will provide opportunities for residents to reduce automobile dependency and GHG s. The OCP details how the City is configured with 5 de-centralized urban cores within the identified PGB where lands may be considered for urban uses within the 20 year planning horizon ending in This creates an urban/ suburban/ rural mosaic for KFD to deliver service within as opposed to a traditional center urban core surrounded by a suburban zone melding into rural. According to the City Planning Department, there is nearly 8,700 hectares of agricultural land reserve inside the City boundary, 674 hectares of which are inside the PGB. Essentially, this means that for many moderate and high risk responses, fire resources are responding from an urban area through suburban and rural zones to support operations in another urban zone. 2.1 PURPOSE The KFD Strategic Plan provides a goal orientated framework for costeffective and efficient provisions for service delivery to the City, including partners, residents, customers and clients. 19 P a g e
20 The illustration below provides a visual representation of the strategic framework considered in the development of this plan: This plan strives to meet current and emerging emergency response, fire prevention, training, fire dispatch and emergency program requirements over the 14-year period and establishes a foundation for service delivery beyond this time period. The KFD Strategic Plan is largely built on risk, predictive modelling based upon historical data, industry leading practices, comparative community analysis, SME input, and establishing performance measures as service delivery targets. In order to achieve this, the KFD Strategic Plan must: Balance community expectations with defined risks while ensuring costs are sustainable and economically feasible for the City. Utilize evidence based data to support decisions to the highest extent. Meet current legislative and regulatory requirements. Align with the corporate strategies and priorities and other related decisions. Be dynamic and adaptable to change. Involve stakeholders input and recognize relationships. Consider fire services provided in comparable communities. 20 P a g e
21 2.2 STANDARDS AND REFERENCES This review considered the following references and standards: Basic Guide for Fire Prevention & Control Master Planning (United States Fire Administration) British Columbia Fire Services Act British Columbia Health Act British Columbia Emergency Response Management System (BCERMS) British Columbia Community Charter British Columbia Wildfire Act and Regulation Clarks Fire Fighting Principles and Practices Code of Practices for the Fire Service Compensation and Disaster Financial Assistance Regulation Emergency Program Act Health Emergency Act (BC) International Association of Fire Chiefs (IAFC) 10 Rules of Structural Engagement Fire Underwriters Survey (FUS) Commission on Fire Accreditation International (CFAI) National Fire Protection Association s (NFPA) Standards and Guidelines WorkSafe BC (WCB) Act and Regulations 2.3 STUDY METHODOLOGY In order to develop the KFD Strategic Plan, an extensive process was utilized to analyze the numerous studies that have been completed since In addition, it considered other factors that would substantiate KFD s preferred direction while providing alternative strategies. This process included a review of the following: Strategic planning cycle framework (methodology) 2007 Consultant s report on Assumptions About Demand by Process Four (Jim Sumi) KFD Strategic Plan, Results Management Services Inc KFD Draft Strategic Plan, KFD 2006 IAFF Geographic Information System (GIS) Study (staffing and response based) the City 2012 FUS (identified effective firefighting forces, RFFs and assigned FUS grading to specific response zones) NFPA industry standards Risk Assessment Matrix (probability/consequence) Review of the City OCP Community Wildfire Protection Plan 21 P a g e
22 Consultant s Report on KFD Draft Strategic Plan Draft by Nelson- Welch Consulting Inc. (confidential) Financial Impact Analysis 2012 City Council feedback Core Service Review/Corporate Alignment Historical emergency response data from the Fire Department Management System (FDM) data base In order to assess and provide recommendations that have the greatest impact on service delivery for KFD and the City, the following key factors were examined: Total geographical area of review Population and Demographics Future growth Financial resources Economics o Tourism o Agriculture o Construction o Industrial activity o Manufacturing o Utilities o Transportation system (including dangerous goods routes) o Retail businesses and other services Multi-jurisdictional requirements and cooperation Impact of Government legislation Support services dispatch, maintenance Public education and prevention Service delivery methods Leading practices and fire service technology Current and future development impact on risk and response Benchmarking with comparative communities 3. SECTION 3 RISK ASSESSMENT 3.1 COMMUNITY GROWTH AND RISK ASSESSMENT Risk Assessment is a process used to identify the community s inherent risks coupled with fire protection and other emergency service needs. KFD s FDM provides the basic source of data and information in order to logically and rationally define the fire department s mission. The overall purpose of using a risk assessment process is to establish a long-range general strategy for the operation of the fire department. Two main areas must be considered to evaluate risk. The first is the existing risk based on calculable criteria or statistics. The second is identifying possible future 22 P a g e
23 risks and a means of evaluating to ensure that a situation can be mitigated to an acceptable level. Conducting a risk assessment is the first step towards establishing an effective strategic plan. It is intended to collect the information required by a municipality in order to make informed decisions about levels of protection, fire prevention and other activities necessary to effectively manage community risk based upon local needs and circumstances. Every municipality has both common and unique challenges when it comes to ensuring the safety of its citizens. It is the unique challenges and the community s identified risk tolerances that requires the fire department to modify their structure and equipment to best serve the citizens. Municipalities have a fundamental and legislative responsibility to conduct community risk assessments in order to provide effective public safety and private property protection. In general terms, needs and circumstances relate to a municipality's economic situation, geography, population, demographics, community and building/infrastructure profiles, and service delivery system. 3.2 RISK ANALYSIS The evaluation of fire risks must take into account the frequency and severity of fires and other significant human or nature caused incidents. Determining risk by analyzing past statistical information and projected growth is essential to the development of an appropriate level of service, staffing model, and performance matrix. The risk assessment can be divided into 4 quadrants, which pose different requirements for commitment of resources in each area (See Figure 1 page ). The challenge for the City will be to ensure the proper balance of resources between prevention and response services that will provide suitable distribution and concentration of resources to meet current and future needs. Throughout this report Assessment Factors will be highlighted. These factors will be collated in Section 5 as part of the Gap Analysis. The Assessment Factors form the foundation for the development of recommendations and service delivery options. 23 P a g e

24 3.2.1 Risk Evaluation Matrix Figure 1: Risk Evaluation Matrix PROBABILITY Different quadrants of the risk matrix require different response requirements. The 4 possible relationships between structures or conditions and the distribution of resources can be defined as follows: CONSEQUENCE Decision makers and fire service management must understand the relationships between probability and consequence and the community s adopted service level goals to determine the needed concentration and distribution of both emergency prevention and response resources. Distribution: The location and deployment of apparatus and staff designed to provide the initial response to any type of emergency call. For KFD, current distribution is based on a minimum of 1 Engine at every station, capable of providing an initial (first-in) response to any type of incident. Concentration: The deployment of additional and specialized apparatus and staff designed to meet specific demands and risks. Increased risk requires increased concentration of resources. For KFD, stations with high call volumes or other specific risks present are served by additional resources such as second Engines and specialized apparatus, equipment, and personnel suited to the area s risks, (for example the marine rescue boat at Station 2 and the rescue unit operating out of Station1). Other units include hazardous materials (HAZMAT) equipment, and technical rescue resources. Optimal concentration of resources provides the entire Effective Response Force (ERF) required for any type of incident, beyond the initial apparatus that arrives first on scene. Probability: The likelihood that a particular event will occur within a given time period. An event that occurs daily is highly probable. An event that occurs only once a century is very unlikely. 24 P a g e
25 Consequence: There are 3 primary components when considering possible consequences: 1. Life Safety: (including incidents that risk the lives of occupants, and the lives of responding personnel, and the amount of personnel and equipment required to rescue or protect the lives of occupants from life threatening situations which include: fire, hazmat, medical, motor vehicle incidents, extreme weather, flooding and all types of rescue situations); 2. Economic Impact: (the losses of properties, income, or irreplaceable assets), and; 3. Environmental Impact: (consequences include the risk of irreversible or long term damage to the environment). Other consequences such as impact to the community (the loss of historic buildings, recreation facilities, or community infrastructure) are identified but do not impact resource deployment. Low Risk = Low Probability and Low Consequence This category is limited to areas or incidents which are defined as having a low probability of fire risk and low consequence for the potential of economic loss or loss of life. Fires in isolated, non-residential structures such as sheds Areas with low fire risk such as vacant land and parks without structures Moderate Risk = High Probability and Low Consequence The majority of responses fall under this category. This includes miscellaneous explosions, standbys, smoke, odours, garbage fires, detached garages, single detached or multi unit residential fires, and small non residential buildings less than 600 square meters. Motor Vehicle Collisions Spill clean-up Midsize residential fires, etc Carbon Monoxide detection Emergency medical Monitoring/local alarms Vehicle fires Hazmat incidents with small quantities of a known product (20 litres or less), outdoor odours (natural gas or unknown) Water rescue incidents 25 P a g e

26 High Risk = Low Probability and High Consequence There are very few properties that are considered high probability, high consequence. These properties can be categorized as large properties, over 600 square meters, without adequate built in fire protection systems, that have large concentrations of people or have a significant impact on the local economy. Commercial, industrial warehouse fires or major events Elevator or Technical Rescue including trench or high angle Hazmat incidents with large quantities of known products (75 litres or more), unknown products or large exposure Vehicle fires in parkades Care facilities and retirement home fires Wildland and interface fires Ignition sources such as outdoor fire pits and lightning strikes Maximum Risk = High Probability and High Consequence This category of risk can be generally categorized as properties over 600 square meters that have high economic value in the form of employment or are not easily replaceable, or natural disasters occurring in highly populated areas, creating high life and property loss potential and strains on department and other agency resources. Damage to properties in this category could result in temporary job loss or permanent closure of the business. Such properties are highly regulated or possess built in fire protection systems. Large interface fires Large vehicle accidents, pile ups Quantities of known products (20 to 75 litres), indoor natural gas odour Confirmed natural gas leak Underground pipeline eruption 3.3 COMMUNITY RISK CONSIDERATIONS Specific challenges that have a correlation with community risks include the following: Industrial Economic Rate of population growth in the community Demographics of the community Annexation of lands Transportation (i.e. Road, Rail, etc.) Natural disasters 26 P a g e
27 3.3.1 Risk Management Risk management is the analysis of the chance of an event occurring and the resulting damage that could occur as a result of the event. In this study KFD used the Risk Evaluation Matrix (See Figure 1, Section 3.2.1) to categorize risk using probability and consequence as a method of assigning risk to individual properties. All properties in the City have been be reviewed and assigned to 1 of 4 different risk levels. The challenge in community risk management does not lie solely in the work necessary to assess the probabilities of an emergency event in a community by SMEs. It is the policymakers who on the basis of recommendations made by SMEs will support the level of service to be delivered to the area being served. The illustration below (see figure 2 below) provides a visual representation of the various layers of information, data and evidence that lead to the recommended level of service: Figure 2 Assessment Pyramid SME Community Expecation Sound Fiscal Responsibility Comparitive Municipalities Wildland Development Plan Legislation NFPA Standards/Fire Underwriters Study /Leading practices PM/DDS (Historic Response Data) Identified Assessment Factors Risk Assessment Community Profile/Growth 3.4 RISK ANALYSIS CATEGORIES Part of the processes to quantify risk within the area would include the categorization of the various low, moderate and high risk structures by utilizing the risk evaluation model. The actual numbers of structures in the different risk categories has been determined and are shown below. The low risk category has not been included as this type of risk does not present an immediate life safety or fire risk. (Table 1: Typical Distribution of Structure Risk Levels on next page) 27 P a g e
28 Kelowna has a typical mix of residential, commercial/industrial, and institutional land use for a City with a population around 124,000 people. While the current types and extent of development are well-served by KFD, there are factors related to land use interface and community growth that do present higher than normal risks and should be considered as part of Kelowna s emergency response system. These factors include: City Footprint; Residential construction types; Interface risks (wildland/forest fire risks); Rate of growth and demographics; Industrial/commercial activities; and Transportation systems and growth in traffic volumes. Water flows for firefighting. Table 1: Typical Distribution of Structure Risk Levels Number % of Risk of Units Total Sources Low - - Moderate approx 33,000 86% Vacant Lands (urban and rural park land, residential lots and privately owned agricultural land). Risk level varies on time of year, terrain, fuel density and slope. Residential Structures/Units High approx 5,300 Total 38,300 14% A (assembly), B (institutional), D (business), E (mercantile), F1 (high hazard industrial), F2 (medium hazard industrial), F3 (low hazard industrial) **There are about 40 high risk properties that are considered a special risk in that any significant damage or shut down could result in varying impact on infrastructure, employment, sociological and/ or environmental damage to the community. The list includes chemical manufacturing/ storage, private care facilities, sewage and water treatment etc. *Statistics from KFD s FDM Properties and the City Planning Department P a g e
29 3.4.1 City Foot Print In 1973, provincial legislation resulted in the amalgamation of the City which brought small neighbourhood communities into the City. These neighbourhoods still maintain their own character and identity to some extent in the OCP. The OCP identifies 5 urban centers and 5 village centers, creating multiple core areas where KFD must focus the distribution and concentration of resources Residential Construction Types; Nearly all residential structures in Kelowna are constructed of standard wood frame components. The KFD advocates for residential sprinklers or combustible resistant building materials such as asphalt shingles or tile roofing as opposed to cedar shakes along with cement composite siding or brick/ rock veneer siding rather than wood or vinyl siding. Combustible resistant building materials are an integral part of making a structure FireSmart and more resilient to wildland interface fires Interface Risks (wildland/forest fire risks) It is important to note that during summer months the wildland interface threat to some of Kelowna s residential neighborhoods is higher due to steep terrain, amount of natural fuels (vegetation) and limited access and egress for traffic. Due to these factors, what would normally be rated as a moderate risk residential fire could in fact be rated as a higher risk as the threat to neighbouring structures is greatly increased. Response times in some suburban and rural areas are delayed as they are performed by local POC Firefighters. Understandably the response time is greater for career fire crews as they are responding from stations in the core areas Rate of Growth and Demographics The OCP identifies a focus on city core densification within the PGB rather than urban sprawl and predicts the City s population will be 141,689 by 2020 and 161,701 by the year The forecasted growth in the following areas of the city is of particular interest to KFD: North Glenmore Valley: McKinley Beach (Shayler Rd) and Lakeside Communities (Clifton Rd): living units and 6-8 commercial. McKinley Beach (Granite): 132 units in townhouses and 116 units in 4 multifamily buildings. Wilden: ongoing development with phase 2 and 3 with 200 living units Diamond Mountain on John Hindle Drive: 1000 (potential) living units UBCO/ Quail Ridge: Academy Way: 800 living units Quail Ridge: 90 additional living units 6 story hotel with 116 units across from YLW. UBCO student population projections: 8,376 (2015), 8,957 (2017), 9,424 (2020) 29 P a g e
30 Downtown/ Midtown/ South Pandosy Core Densification: expected to add 7,000 living units by Westcorp Tower hotel (Queensway) Central Green(Richter) with 1000 living units Rutland: Black Mountain 300 living units Tower Ranch 300 living units Kirschner Mountain 700 living units Mission/ South Slopes: The Ponds/Thompson Flats 1,000 living units Industrial/Commercial Activities Kelowna has a number of low to medium hazard type industries or commercial businesses. KFD has identified over 40 higher risks industrial/ commercial businesses such as fuel and oil distributors and pesticide distributors that could pose a potential environmental risk in the event of fire or accident. There are also a number of properties/infrastructure that if compromised by fire or accident, could pose a significant sociological and economic hardship on the city and its residents. These would include water treatment/provider facilities, sewage treatment facilities, the landfill and the Kelowna International Airport (YLW) Transportation Systems and Growth in Traffic Volumes The great majority of Kelowna s roadways are adequate to handle regular volumes of traffic on the two provincial highways or municipal roads. The significant transportation issues are: The lone access and egress to the city from the south over the WR Bennett Bridge. An average of 60,000 vehicles travel the bridge daily so a significant event involving the bridge can have a compounding effect on the local traffic negatively affecting response times. Currently there is no roadway link from the Glenmore Valley to the University of British Columbia Okanagan (UBCO). The planned link from Glenmore Road to Academy Way referred to as John Hindle Drive will greatly improve emergency service response in this area. With the recent purchase of the 22km rail line, all HAZMAT that were once transported via rail are now being transported by the highway corridor and road system throughout Kelowna. 30 P a g e
31 A great portion of KFD s service area is relatively flat however some neighborhoods have roadways as steep as 13% grade. The Knox and Dilworth Mountains with their steep slopes and wildland interface characteristics creates a fire defence challenge by semi isolating neighborhoods like Clifton Rd, McKinley, Wilden, Dilworth and Quail Ridge. Mission Creek runs 17km from Gallagher s Canyon to Okanagan Lake and divides the community with only 5 crossing points. The southern perimeter of South East Kelowna (SEK) and Mission neighborhoods are a continuous boarder of steep ridges and gullies covered with the challenge of wildland interface issues Water Flows for Firefighting KFD s service area gets its water supply from 5 large water utilities and 13 smaller water service providers. There are 4,300 hydrants in the service area of which 757 are private. In accordance with the municipal bylaw, they are serviced once each year as detailed in the NFPA 25 standard and they are spaced no more than 200 meters in residential area and no more than 100 meters in high density residential/commercial/industrial areas. The rural areas of the Mission and SEK have water systems with more sparsely spaced hydrants requiring water tenders to be included on the resource deployment in these areas. 3.5 PREDICTIVE MODELLING AND DYNAMIC DEPLOYMENT SYSTEM (PM/DDS) Across Canada and the United States leading fire services have or are implementing PM/DDS to improve overall efficiency and effectiveness of emergency responses. In 2014, the City Council approved the procurement of PM/DDS for the KFD. This computer based system that employs risk tolerance decisions based upon historical incident and response data and other related factors to determine the optimum deployment system for concentration and distribution of resources. Assessment Factor 1 Emergency response performance targets will be evidence based data with consideration for the City footprint; residential construction types; interface risks (wildland/forest fire risks), rate of growth and demographics; Industrial/commercial activities; transportation systems and growth in traffic volumes and available water flows for firefighting. With the use of PM/DDS, the KFD has been able to verify previous fire protection areas within the City that expose service delivery gaps. The computer based system is comprised of 4 separate modules, two of which have been installed by KFD and were key in the development of this strategic plan. These two modules answer two baseline questions needed to assess future operational needs: what has happened CAD Analyst and what if ADAM? 31 P a g e
32 CAD Analyst: This application filters and processes key data from existing CAD or Records Management System (RMS) and utilizes that historical information to evaluate response performance. This answers the question what has happened? CAD Analyst generates objective data concerning current response performance. This application filters and processes historical data from the existing CAD and RMS. It then utilizes that information to evaluate historical KFD response performance against current (or new) response time targets. ADAM: Working in tandem with CAD Analyst, ADAM calibrates to match actual performance and calculates the impact of changes in workloads. The deployment analysis is displayed as colour coded maps. This addresses the question of what if? ADAM helps answer questions regarding changes by using historical data, Predictive Modeling and Dynamic Deployment System (PMDDS) and mathematical formulas. It is also fed data such as street networks and speed limits to increase prediction accuracy. ADAM simulates various deployment scenarios to effectively test and evaluate the impact of changes if these scenarios were implemented in the field. The tool calibrated to match actual performance will: Evaluate impact of apparatus deployment changes on response target performance. Analyze impact of station/apparatus relocation. Compare the performance of alternate/new station locations. Demonstrate impact on service/performance due to proposed changes. Assess response performance between career and volunteer stations. Analyze strengths and weakness of established/proposed staffing levels. Calculate and predict average response times, anticipate workloads, identify unit availability and potential number of calls per day for multiple options. The system based on the two modules above, the historical data analysis and response target options are displayed as color-coded maps allowing consideration of different deployment models and options for service delivery (See Section 6.5.1). With the use of PM/DDS, variable historical comparisons can be produced using travel time, geography and incident formulas. Having a broadly understood and accepted system for determining deployment helps policy makers at all levels understand the deployment resources needed. Historically, fire departments have employed a geographic response model. This is where stations, staff and equipment are strategically placed throughout the community to effectively respond to any type of emergency within an established response area. 32 P a g e
33 Moving forward, innovations are being found by departments moving beyond simple geographical response and considering both dynamic deployment and risk based response. PM/DDS has allowed this strategic plan to balance future considerations on all 3 types of deployment models: geographic, dynamic deployment and risk based response to assess the most effective coverage based on Kelowna s needs. The 3 types of deployment models are described below: Geographical Response: is the establishment of response zones based on the community s geography. This is the traditional use of natural and human made boundaries, transportation system and distances to determine the station location and response area. Home insurance companies refer to the FUS Dwelling Protection Grade system when quoting home fire insurance. The grading system takes into consideration: water supply availability, fire truck size, firefighting staff (career/ volunteer) and distance to a station. This is consistent with the historical geographical response deployment model. Dwelling Protection Grades vary from: Grade 1 (fully protected) with a water system designed in accordance with FUS standards, response with a fire truck within 8 kilometers with 4 on- duty career staff. Grade 2 (semi protected) with a water system designed in accordance with FUS standards, response with a fire truck within 8 kilometers with 1 career on- duty staff and 15 trained volunteers or recalled career staff. Grade 3A (semi protected) with a water system designed in accordance with FUS standards, response with a fire truck within 8 kilometers with 15 trained and scheduled volunteers. Grade 3B (semi protected) no water system required, 15 scheduled and trained volunteers, fire trucks with a minimum of 1500 gallons of water and Station within 8 kilometers. Grade 4 (semi protected) no water system required, 10 scheduled and trained volunteers, 800 gallons of water and a station within 8 kilometers. Grade 5 (unprotected) areas without fire protection meeting grades 1 through 4. Each insurance provider uses the Dwelling Protection Grades to integrate with their own internal policies in establishing insurance rates depending on a property s location and use (commercial, industrial or residential). 33 P a g e
 being outside of the full coverage home insurance parameters.")
34 The map below illustrates an 8 kilometer travel time from current stations (green shaded areas) which shows the Quail Ridge subdivision and beyond the 5700 block of Lakeshore Road (grey shaded areas) being outside of the full coverage home insurance parameters. 34 P a g e
35 Dynamic Deployment: is the strategic positioning and deployment of staffing and related resources based on peak call volume times, and risk factors. An example of this is deploying resources to a specific area for peak call volume times only. The implementation of a dynamic deployment model which includes apparatus redeployment guidelines will enhance the management of resources based on identified risks, probability of occurrence, reliability of response resources, and service demands. The model applies this systematic approach based on risk rather than blanket (geographic) response. It is used for apparatus redistribution and the day-to-day backfilling or repositioning of resources to improve response performance. This system will identify optimum station locations including the identification of gaps in service, redundancies or over resources in certain locations and enhancements, along with the more effective utilization of equipment and staffing levels. It is apparent that many departments largely driven by economic factors coupled with increasing call-volumes are employing peak time resource redistribution. This is where resources (equipment and staff) are shifted from one station to another in order to manage changing risk in the community throughout the day. In some cases, stations might be left vacant or apparatus not staffed during identified quiet times. The City of Toronto is one example of this. KFD is currently implementing dynamic deployment at a very basic level. As previously indicated, given the Station locations and distance from back up responses the coverage needs to include a geographic element. For example, the 2 person rescue unit from Station 1 is deployed to Station 2 during peak periods on weekends during the summer months. Further implementation of PM/DDS will allow for the matching of resources to the identified risk. Risk Based Response: is identifying what resources and related training are required for a specific response to identified risks. An example is deploying smaller units to medical responses instead of a fully staffed Engine company. KFD is on the threshold of implementing a risk based approach to responses. The recently procured Engine/rescue vehicle will be assigned as a mobile unit within the City. Having a multi-use capacity, this unit will be used for lower risk calls such as medical responses, needle pickups, etc. In addition, a recent change has been implemented to use the smaller bush truck units for responses to the SEK district in support of POC operations in the rural area and First Medical Responses (FMR) throughout the City. This approach was introduced in July 2015 with ongoing evaluation and complete review early in 2016 for operational effectiveness and efficiencies. 35 P a g e
36 Assessment Factor 2 Emergency response performance target options will be developed by applying geographic coverage and dynamic deployment and risk based responses as efficiency and operational effectiveness measures. Two additional modules of PM/DDS aid in the operational deployment of resources based on the model selected through the analysis. These two modules are BARB and LiveMUM: BARB: As part of developing the response logic (standard apparatus assigned to a call type) for dispatching, BARB validates the effective and efficient use of resources, by determining the closest most effective resources to send to incidents. Until now, defining the geographic boundaries between station response areas has been an intuitive process, drawing on the knowledge and experience of Fire Service SME, rudimentary tools such as map books, stopwatches and limited GIS mapping support provided by outside experts. Using advanced GIS tools and mathematical formulas, combined with KFD s data on streets and speed limits, this tool generates recommendations for response areas using computed running routes to every street address in the city. These recommendations are then validated against historical events to ensure accuracy. These results are mapped and then uploaded directly into the CAD System to inform the dispatchers of the most appropriate apparatus and routing to a particular address or request for service. LiveMUM: Connecting with the CAD in real time, LiveMUM identifies gaps in coverage or changes in a unit s status then recommends instantaneously the optimal move-ups for apparatus. The system employs what is known as Bayesian inference to probability calculations which is a mathematical formula that determines the probability of an event occurring based on historical incidences of similar events. Factors such as location, time of day and day of the week are part of this calculation. As a result, a repositioning of resources to a particular area would be recommended at times/days when the area s call volume is typically high, but not at times/days when it is typically low. This is a non-traditional approach from the standard of providing full standby fire coverage for all areas at all times. Simply put, stations are backfilled even when the chance of a call is minimal. 36 P a g e
37 LiveMUM has been implemented on Vancouver s North Shore for the past 2 years where there has been a demonstrated improvement to service and response time with existing resources. The system has eliminated guesswork on when and which units are repositioned in order to ensure coverage. The full implementation of PM/DDS will ensure future operational and strategic decisions are based on modern, scientific analytics as opposed to emotionally driven decisions. This approach combined with local experience creates cost effective and efficient deployment of resources to meet service levels in a growing community. This tool will also assist in the development of performance indicators that measure the impact of future innovations in the deployment models. Assessment Factor 3 PM/DDS will provide the evidence based data to develop emergency response targets. 4. SECTION 4 PROGRAM AND SERVICES 4.1 HUMAN RESOURCES In 1905, KFD was inaugurated as a volunteer fire department. Career Firefighters began to be hired in the 1950 s for the Water Street Station known today as Station 2. At that time the Fire Department also provided Fire Dispatch Service and Ambulance Service to the community. The Provincial Government assumed the Ambulance Service role in the mid 1980 s. In 1973, the City amalgamated the surrounding areas of Glenmore, Rutland, Benvoulin, SEK and the Mission. KFD hired a number of members in the mid 1970 s to provide the basics of a career fire service to the newly formed city. From 1954 to 1987, KFD provided the only ambulance service within the Regional District of Central Okanagan (RDCO) as part of its integrated service. The KFD continues to provide prehospital care through the First Medical Responder (FMR) Program, Emergency Health Services Commission (EHSC) as assistance to the British Columbia Ambulance Service (BCAS). In 1989, all Firefighters were trained to the FMR level 3 as the BCAS became the primary pre-hospital health care provider. In 1989, the KFD took the lead on the development of the Regional Rescue Program to provide auto extrication, HAZMAT response and technical rescue to the citizens and visitors of the RDCO. Currently 6 fire departments in the RDCO provide auto extrication and low embankment rescue; 3 provide marine rescue and 2 provide technical rescue. In 1993, the KFD developed the Regional Emergency Management Program which became a RDCO Bylaw in This program provides regional coordination and training for emergency management under the Provincial Legislation. 37 P a g e
38 Past major regional emergencies, such as wildfires and floods have enabled the Regional Emergency Management Program to become a model emulated by other fire and emergency service providers. In 2000, to comply with WorkSafe regulations, all career Engines were staffed with 4 Firefighters. This was done in order to enable a first arriving crew to make entry into a burning building complying with the 2 in 2 out regulation. In 2010, a squad company of 2 Firefighters was implemented to cross staff Rescue 1, Ladder 1, Bush 1 and Tender 1. Today, the KFD is a composite department comprised of 122 career staff (96 Firefighters) and 45 POC staff based out of 7 stations. Fire Prevention is staffed with 5 fire Inspectors, Training with 2 Training Officers, Department Administration with 3, Communications/Dispatch with 10, Communications Administration Officers with 2, Chief Officers with 4 and Emergency Support Service Volunteers with 104, for a total of 299 people. Staffing: Fire Chief Deputy Chief of Operations Deputy Chief of Administration Training & Fire Prevention Deputy Chief of Communications & Emergency Management 4 Platoon Captains 16 Captains Paid-On-Call -3 District Chiefs -3 Assistant Chiefs -1 Training Coordinator -7 Captians - 31 Fire Fighters Administration & Finance Supervisor 2 Fire Secretaries Training Officer Assistant Training Officer Fire Prevention Officer 4 Fire Inspectors Admin Officer 1 & 2 10 Dispatchers Emergency Support Services Lieutenants 72 Fire Fighters 38 P a g e
39 4.2 VISION AND VALUES In 2012, the City launched its vision, values and mission statement in an effort to create a cohesive resilient organization that has the capacity and depth to deliver valued services to its citizens while preparing to meet future challenges. This work provided a strategic direction for the Corporation and is the foundation for how staff will interact with internal and external stakeholders. Vision: To be the best mid-sized city in North America. Values: The City values are embodied in the acronym BEST: Mission: Balance: We balance priorities to ensure environmental, economic, social and cultural sustainability. Excellence: We pursue excellence and commit to continuous improvement. Service: We put people first and focus on service. Teamwork: Teamwork powers our decision making Leading the development of a safe, vibrant and sustainable city. Community Strategic Plan: The City is also guided by the Community Strategic Plan, a direction set out by City Council and the citizens of Kelowna. The Corporate Plan builds the corporate capacity necessary to deliver on City Council s directions and the goals of the community. The Corporate Plan focuses on 6 priorities: Performance Excellence Passionate Public Service Responsive Customer Service Engaged Communities Pioneering Leadership Sustainable City KFD Alignment: KFD is directly aligned with the corporate direction, with a vision to be the best mid-sized Fire Department in North America. 39 P a g e
40 Using innovative approaches such as PM/DDS analytics, KFD will develop Performance Targets, providing measurable outcomes to assess our success in supporting and achieving the corporate vision. The recommendations within this strategic plan are aimed at using innovation to deliver a service response level that meets or exceeds community expectations while working within current financial constraints and realities. 4.3 SERVICES PROVIDED In Canada, the provision of fire services by municipal governments is discretionary. In BC, there is no legislation mandating the levels or type of fire services that any municipality provides. However, if a Municipality decides to establish a fire service, regardless of whether it is staffed by POC or career Firefighters, there are general safety regulations that do apply. The occupational specific WCB interior firefighting regulations must be met requiring 2 in and 2 outside a structural fire before entry can be made to affect a rescue or interior operations. Along with the 2 in and 2 outside, a Rapid Intervention Team (RIT)/Firefighter Rescue of 2 members must be assembled within 10 minutes of entry or the interior attack team must exit the structure. In addition, the training standards, as identified in the Office of the Fire Commissioner (OFC) Training and Standards Playbook also apply. Other services such as technical rescue, hazardous material response and medical response also have their own standards in terms of training, equipment, and core disciplines; however, the delivery of these services is entirely at the discretion of the municipality. The Fire Service Act in BC does require municipalities to investigate and report fires, as well as to conduct inspections on public buildings/facilities. In the case of inspections, the municipality has the discretion to set the cycle or number of inspections per year. Assessment Factor 4 Emergency response performance targets will ensure compliance with Provincial safety and training standards legislation. KFD provides a variety of services, as detailed below. These services are provided by a staffing complement of Career and POC Firefighters. 4.4 FIRE PREVENTION The Fire Services Act requires Municipalities to provide for a regular system of fire safety inspections carried out by Local Assistant s to the Fire Commissioner (LAFC) under the relevant sections of the Fire Services Act and in accordance to the British Columbia Building Code (BCBC) and British Columbia Fire Code (BCFC). 40 P a g e
41 The BCFC establishes the minimum standard for fire prevention, fire protection and life safety in existing buildings and includes provisions for: The ongoing maintenance and use of the life safety and fire protection features incorporated in buildings. The conduct of activities that might cause fire hazards in and around buildings. The establishment of fire safety plans. Fire safety at construction and demolition sites. In a municipality that maintains a fire department, the Fire Chief and persons authorized in writing by the Fire Chief to exercise the powers of a LAFC have the powers of a peace officer for the purposes of the Fire Services Act. The KFD Fire Prevention Branch provides a variety of services including Fire Inspections, Fire Investigations, Public Education and Development/Construction Plan Review. The Fire Prevention Branch consists of 1 Fire Prevention Officer, and 4 Fire Inspectors. All Fire Prevention Branch staff are authorized LAFC in accordance to the Fire Services Act. All KFD Fire Inspectors undergo extensive training to meet NFPA standards for Fire Inspectors, Fire Investigators and Fire and Life Safety Educators. Fire Inspections: Fire Inspectors are responsible for the inspection of over 6,100 properties in Kelowna each year with a total building value over 12.4 billion dollars. There are over 32,000 inspection items inspected each year for compliance. The fire inspections are completed by Fire Inspectors, Engine companies and the Rescue Squad based on frequency levels established under Council Policy #181 and in accordance to the BCFC, BCBC and the Fire Services Act. To improve corporate effectiveness, fire inspections also include checking for business licenses on behalf of the Bylaw Department. The Bylaw Department is notified for follow up when a business license is out of date or non-existent. Fire Investigations: The KFD Fire Inspectors are certified Cause & Origin Fire Investigators level 2 and 3, and must investigate all fires occurring in the municipality in accordance with the Fire Services Act. Immediately after a fire investigation, the fire reports must be submitted to the OFC containing all the facts ascertained about the cause, origin and circumstances of the fire. Public Education: KFD dedicates ¾ of a full time Fire Inspector s hours to coordinate all Public Education events and act as a liaison to School District 23, numerous volunteer groups, strata councils and agencies. School District 23 events range from station tours and pumper visits, Fire Safety House visits for K-3, Fire Chief for the Day during Fire Prevention Week, Middle School extinguisher training for shop and cooking classes as well as career fairs and presentations on opportunities for young people interested in the fire service as a career. KFD has teamed up with the Kelowna Senior s Community 41 P a g e
42 Outreach Center to provide fire safety and fall awareness programs and conducted training on what to do after a fire for strata councils and companies. Juvenile Firesetters: KFD fire prevention staff is trained on counselling children who have initiated a fire. This program offers opportunity for children and their parents to see the ramifications of lighting fires. The child and parents are invited to the station to learn about what firefighters do and the services they provide and how intentional fires take them away from helping those in need. They also learn about the types of injuries that can result from playing with fire. On average KFD provides this service/counselling to 6-8 juveniles and their parent/ guardian each year. Development/Construction Plan Review: Plan review is conducted by the Fire Prevention Officer when development and or construction plans are forwarded from the City for review. The plans are reviewed for life safety code compliance, fire and life safety systems, water supply, hydrant location and fire department access. It is important to note that this service is coordinated in close consultation with the City Building Services Branch. The BCBC and the BCFC both have specific requirements on new construction, alterations, change of use and demolitions. The BCBC covers the fire safety and fire protection features that are required to be incorporated in a building at the time of its original construction. The BCFC covers the fire and life safety systems of the building and the ongoing testing and maintenance after the building is occupied. Pre-incident Planning: KFD dedicates ½ of a fulltime Fire Inspector s hours to review and conduct pre-incident planning for larger high risk structures. This typically includes medium and high risk industrial and commercial buildings. This Fire Inspector co-ordinates this work with the Platoon Captain responsible for pre-incident planning. 4.5 FIRE TRAINING The Fire Training branch consists of 1 Career Training Officer (TO) and 1 Career Assistant Training Officer (ATO) based at the main station. The POC stations have Assistant Chiefs. The TO oversees all training for Career and POC members. Both the TO and ATO are certified Justice Institute of British Columbia (JIBC) Instructor/Evaluators. Each platoon has instructors for the following disciplines: FMR, Emergency Vehicle Operations (EVO), RIT, technical rescue and HAZMAT. All career fire officers are certified to NFPA 1021 for Fire Officer I & II. The department s technical rescue teams are certified to NFPA 1006 Standards in High Angle Rescue, Tower Crane Rescue, Swift Water Rescue and Ice Rescue. The department s HAZMAT Teams are certified to NFPA 472 Standards to the Technician Level. All shift officers conduct monthly training drills as assigned by the Training Branch through the Web Based Target Solutions Training System and conduct monthly 42 P a g e
43 practical training drills. Crews train an average of 22,000 hours each year, both on and off duty in order to maintain skills and proficiencies in all disciplines provided by the fire department. 4.6 REGIONAL SERVICES Kelowna Fire Dispatch provides a number of critical services on a regional basis through a strong partnership with the RDCO. This innovative approach allows the Region to benefit from the full time career capacity of a large fire department, while providing support to KFD in relation to core funding for training, equipping and planning for major emergencies and regional communications. Regional services can be broken into 3 main components: Fire Dispatch Emergency Management Regional Rescue Services Fire Dispatch The Regional Fire Dispatch Centre is located in Station 1 and provides service to the municipalities and rural electoral areas within the RDCO. Through contract, service is also provided to the fire departments in the Regional District of Okanagan Similkameen (RDOS). In addition to fire dispatch, KFD continues to look at alternative revenue opportunities in non-traditional service provision. Examples of these services include current service agreements to provide alarm monitoring, lone worker monitoring, and Bylaw dispatch and after hours call-out for local government staff across the Region. Dispatch also plays an important part in the Regional Emergency Management Program, providing the first point of contact for both the public and responders during the initial phase of any major emergency incident. KFD continues to work on identifying additional revenue opportunities that support ongoing improvements to our existing technology and response systems while potentially offsetting the costs to the current dispatch partners in the region. This initiative will be expanded upon in Section 5 of this report Emergency Management The Regional Emergency Management Program is administered by KFD, supported by an agreement with RDCO and consistent with the Regional Emergency Management Bylaw. KFD is responsible to plan, train, maintain resources and prepare for emergency incidents or disasters that may occur within the RDCO. This includes ensuring the Emergency Operations Centre (EOC) located at KFD Station 1 is ready for activation at all times, and that a broad range of essential staff, from across the region are trained and able to respond. During an emergency, representatives come together at the EOC to coordinate response and recovery actions and necessary resources that support frontline response 43 P a g e
44 personnel. The EOC is where coordination and management decisions are facilitated, and all official communications regarding the emergency originate. Representation may include local government staff, first responders, and representatives from various stakeholders such as health, utilities, education or provincial ministries such as Ministry of Transportation and Infrastructure (MOTI). Emergency Management also administers the Emergency Support Services (ESS) program. This program relies heavily on many dedicated trained and experienced volunteers who provide relief for residents displaced from their homes during an emergency. The ESS team is very active, and supports numerous events annually ranging from single house fires (termed Level 1 activations) up to and including mass evacuations for events such as wildfires (Level 3). The Regional Emergency Program conforms to the best practices provided by Emergency Management British Columbia (EMBC), such as BC Emergency Management Response System (BCERMS). Direction on program development and training are provided throughout the year. During EOC activations, EMBC will open a Provincial Regional Emergency Operations Centre (PREOC) to coordinate resources and provide financial support, including potential cost recovery for activities taken to respond to or recover from a large emergency event or disaster Regional Rescue Services In 1989 the KFD spearheaded development of the Regional Rescue Program to provide auto extrication (road rescue), HAZMAT and technical rescue to all of the citizens of the RDCO. Technical rescue includes marine, ice, swift water, low embankment, confined space and high angle rope rescue. The service remains under the administration of the KFD, with cost recovery for all equipment, training and operations provided through the RDCO. The training and equipment administered by KFD is deployed to departments within the RDCO based on local response capacities and service levels. For example, most departments take part in Road Rescue and Low Embankment Rescue, but the KFD directly provides the only Hazmat Response Unit in the region. Operationally, service delivery is organized into 3 areas: (road rescue, technical rescue and Hazmat response): Road Rescue (Motor Vehicle Incidents (MVI)/Auto Extrication): Auto extrication is provided by the majority of departments in the region, with the exception of Ellison Fire and Wilson s Landing. In Kelowna, the closest equipped Engine company and/or rescue unit will respond to MVI where extrication is or may be needed in support of medical aid, whether fire suppression is required or not. Training and equipment is standardized within the region and managed through the KFD, with funding provided by RDCO. 44 P a g e
45 Technical Rescue: Includes 6 disciplines of varying complexity and staffing requirements. Technical rescue includes: marine, low embankment, ice, swift water, confined space and technical high angle (which includes tower crane rescue). Ice and Low Embankment Rescue: As with auto extrication, both ice rescue and low embankment rescue are provided by KFD and 5 other local community fire departments. This allows for quick, consistent response to incidents across the region. Within Kelowna, calls for ice rescue and low embankment rescue are responded to by members at Station 1 on Enterprise Way. Training and equipment is standardized within the region and managed through the KFD, with funding provided by RDCO. Technical High Angle Rope/Swift Water and Confined Space: Each of the 4 KFD career platoons has a technical rescue team consisting of 6 designated members. The members are not seconded full time to the team, but are part of the regular on duty compliment and may be located at any one of the KFD stations. In the event of a technical rescue call within the city for swift water, confined space or technical high angle rescue, the closest KFD Engine company responds directly to assess the situation. Outside of Kelowna, but within the RDCO, local community fire departments or other first responding agencies (generally BCAS or RCMP) will provide the initial assessment. Team members from KFD respond to Station 1 to assemble the Technical Rescue Team and equipment and then respond directly to the incident. In late 2015, West Kelowna Fire Rescue formally began providing technical high angle rope/swift water and confined space rescue under agreement with the RDCO for areas across the lake from Kelowna. The 2 teams will enhance the rescue response time across the region. These teams are working together ensuring a consistent response, providing back up and support to each other as required. Marine Rescue: Marine Rescue is provided through 3 regional rescue boats operated by KFD, Peachland and Lake Country. The KFD Marine Rescue Team is based out of Station 2 on Water Street. When needed, staff responds from the Kelowna Yacht Club in a specialized marine rescue vessel. In addition to the regional fire rescue boat program, support for marine search operations may also involve the volunteers and boat from Central Okanagan Search and Rescue (COSAR), which is also moored at the Yacht Club. 45 P a g e
46 Hazardous Material Response: Each of the 4 career platoons have a hazardous material response team consisting of 6 members on each team. Specially trained KFD team members are located at various stations as part of the normal duty rotation. In the event of a HAZMAT incident, the closest Engine company responds directly to assess the situation. On confirmation from the Incident Commander that the event is higher than a Level I response, the team members respond to Station 1 to assemble the Hazmat Team and equipment. 4.7 FIRE OPERATIONS Fire Operations consists of fire suppression, first medical response, MVIs or auto extrication, technical rescue (low embankment, high angle, tower crane, ice rescue, swift water rescue, confined space rescue, and marine rescue), Hazmat response, pre-incident planning, fire inspections, and apparatus maintenance functions. Fire Suppression: Minimum (career) Duty Strength (MDS) per shift is 19 Firefighters. Crews are notified by Fire Dispatch and receive call notification via radio and pager system as well as verified Rip n Run reports which are printed at each responding station at the time the call is committed to the apparatus. Apparatus are now equipped with onboard computers that provide incident details, electronic maps and pre-incident plans. Each Engine company is staffed by 1 Officer and 3 Firefighters with the exception at the Station 1 where an additional Rescue Unit is staffed at a minimum of 2 members (1 Lieutenant & 1 Firefighter). Any additional staff above the MDS is assigned to alternate apparatus such as the ladder and rescue units. There are written protocols for a wide variety of emergencies all of which can be adapted to increase or decrease the level of response depending on the incident needs. First Medical Response: All members are trained to Emergency Medical Assistant First Responder Level III with Automatic External Defibrillator (AED) and Spinal Endorsements. The Department is registered with the EHSC as a provider for FMR and responds to all Level I Medical Calls as indicated by the BCAS Medical Priority Dispatch System (MPDS) system. This program represents on average 65% of the total calls for service (emergency responses) for KFD. 5. SECTION 5 RESOURCES AND PERFORMANCE 5.1 CURRENT STATIONS Stations are community buildings that are frequented by school children, service clubs, and the members of the public. As such, these buildings must be maintained to the City s standards and must serve to promote a professional image and a sense of public confidence and safety. The Deputy Chief of Operations liaises with the Building Services Manager to communicate and prioritize routine and annual maintenance as well as priority refurbishment projects in all stations. The Building Department s 2030 Capital Plan identifies future refurbishment plans. 46 P a g e
47 Station 1 A building condition assessment of Station 1 was conducted in 2007 at which time it was considered to be half way through its useful life. The assessment identified and categorized issues for Building Services to prioritize and address. Major renovations to Station 1 over the years have included the expansion of the front reception and fire dispatch in 1994, overhead door replacement in 2010 and renovations completed in 2012 to provide additional office space for Fire Prevention, as well as female washrooms and change room. Station 2 In 2014, a masonry condition assessment was conducted on Station 2 (built in 1924) which included a review of seismic aspects. Since 1924, the building has undergone several additions, most notably in 1945, 1951, 1971 and The exterior of each addition has been constructed with brick pattern similar to the original construction, in an attempt to maintain a consistent look throughout. The station is currently listed on the City Heritage Register. The Building Department s 2030 Capital Plan identifies 2017 for major refurbishments to the station such as the reconditioning of the masonry (this is not included in the financial analysis within this report). Ninety years ago this Station was in an ideal central location. Today it is situated on the western edge of its 15 square kilometer response zone. In recent years the increased densification of the downtown core, increased traffic flow in front of the Station and the installation of traffic signals at Lawrence and Leon Avenues has resulted in severe traffic congestion in front of the Station. This creates operational challenges for the response vehicles exiting the station and upon return. For example, when the Engine returns to the station a U-turn in the middle of the street is required in order to back into the vehicle bay. Station 3 In 1998, Station 3 was refurbished to include new updated living quarters and overhead doors. The Building Department s 2030 Capital Plan identifies major refurbishments for this Station in 2022 (this is not included in the financial analysis within this report). Station 4 In 2014, Station 4 received a significant upgrade to the exterior envelope of the building with new siding, windows and roofing. There are no other refurbishments identified in the Building Department s 2030 Capital Plan. Stations 7, 8 and 9 There are no major refurbishments identified in the Building Department s 2030 Capital Plan for the POC Stations however, there are condition assessments conducted annually to identify annual maintenance and repairs. 47 P a g e


48 Station 1 Opened in 1975 and located at 2255 Enterprise Way, Station 1 is KFD s headquarters and primary station. It accommodates the Administration staff, Fire Prevention Branch, Dispatch, Training and Management staff. It is also home to multitude of apparatus including a Command unit, Engine, Ladder truck, Rescue unit, Water Tender, Gator (ATV), Bush truck, and Reserve pumpers. Station 1 is staffed with 1 Platoon Captain, 1 Captain, 1 Lieutenant and 4 Firefighters. In 2014 there were 2,094 responses in Station 1 s response zone. Station 2 Built in 1924 and located in downtown Kelowna at 1616 Water Street. Station 2 is staffed by a Captain and 3 Firefighters and is KFD s busiest response zone with 3,165 responses in This Station houses 1 fire Engine and a Ladder truck. The Firefighters from this station also staff the Regional District s Marine Rescue boat located at the Kelowna Yacht Club. 48 P a g e


49 Station 3 Built in 1966 and located at 310 Rutland Rd N. Station 3 is shared with the RCMP s Rutland Community Policing Office and houses a fire Engine, Bush truck and the RDCO s HAZMAT truck. Station 3 is staffed by a Captain and 3 Firefighters. There were 2,241 responses in Station 3 s response zone in Station 4 Built in 1974 and located at 619 Dehart Rd. Station 4 is staffed by a Captain and 3 Firefighters and houses a fire Engine, Bush truck and Water Tender. There were 1,454 responses in Station 4 s response zone in Station 7 Built in 1974 and located at 3275 Gulley Rd. Station 7 is the busiest of the POC Stations with 186 responses in There are 22 POCs based out of this Station staffing a fire Engine and a Bush truck. 49 P a g e


50 Station 8 Built as a twin to Station 7 in 1974 and located at 550 Valley Rd N. The 19 POCs based out of this Station staff a fire Engine and responded 130 times in Station 8 also serves as a back-up location for fire dispatch. Station 9 Built in 1993 and located at 2160 Bennett Rd. The 6 POC members based out of this Station staff a fire Engine and responded 18 times in The POC members are an integral part of promoting FireSmart wildfire prevention program in this isolated neighbourhood. 5.2 DISPATCH CENTRE KFD Fire Dispatch is located in the main station on Enterprise Way. Within the Dispatch Centre are 3 complete workstations, of which two are staffed 24/7. During peak times or emergent events the third position will be staffed as well. An additional two workstations are set up in the administration offices at Station1 to allow support by one or both of the KFD Administrative Officers within that division. Currently, the centre is in the midst of an upgrade of its dispatch consoles, expected to be completed in early As part of this upgrade, the current consoles will be 50 P a g e


51 relocated to the Station in Glenmore as a backup location to our main Dispatch Centre. 5.3 TRAINING AREAS Besides daily theoretical training that takes place at each station, KFD has a training ground at Station 1 on Enterprise Way where firefighters can train on a multitude of disciplines from pumping water, high rise firefighting evolutions, and confined space rescue to high angle rope rescue. At Station 7 in SEK, KFD maintains a smoke house for practical fire training. In 2015, KFD constructed a burn building at the landfill where live fire training can be conducted while on duty. KFD also has a flashover simulator training prop at the landfill for demonstrating the pending conditions of a flashover and the science behind fire growth. Flashover Simulator Burn Building SEK Smoke House 51 P a g e


52 5.4 APPARATUS AND EQUIPMENT AND OTHER MAJOR EQUIPMENT The following represents the current equipment and apparatus complement of the KFD: Unit # Station 1 Enterprise Way This Station houses 7 front line apparatus. Description PC Dodge 4X4 pick up. This vehicle is assigned to the Platoon Captain who manages the on duty firefighting staff. The vehicle also serves as the command post to coordinate resources during emergency incidents. ENGINE Spartan/ Rosenbauer 1500 gpm with 500-gallon water tank 50 aerial ladder This is the primary firefighting vehicle based at Station 1 that backs up all areas of the city during fires. This unit is staffed with a Captain and 3 Firefighters. LADDER Spartan/ Smeal 100 Foot Tower Ladder 1800 gpm with 300-gallon water tank This unit is cross staffed with a firefighter. 52 P a g e


53 RESCUE Freightliner/Hub Rescue Truck. This truck carries equipment for fires, auto extrication, rope rescue and swift water rescue. This unit is cross staffed with a Lieutenant and 1 Firefighter. BUSH Ford 4X4 for wildland firefighting 100 gpm with 250-gallon water tank This unit is cross staffed with a Lieutenant and 1 Firefighter Western Star water tender TENDER gpm with 2500-gallon water tank This unit is cross staffed with a Lieutenant and 1 Firefighter. QUAD John Deere Gator. This All- Terrain Vehicle (ATV serves 3 primary purposes: Wildland firefighting with a skid pack that carries 50- gallons of water and a small pump. Wilderness Rescue with a skid pack for carrying equipment & transporting a patient over rough terrain. This unit can be equipped with a plough blade for clearing snow. This unit is cross staffed with a Firefighter. 53 P a g e


54 Station 2 Water Street This station is staffed with 1 Captain and 3 Firefighters who cross staff the 3 units. ENGINE Spartan/Superior 1500 gpm with 500-gallon water tank This is one of the busiest units in the province averaging over 3100 responses each year. LADDER Spartan/Smeal 100 aerial ladder 1750 gpm with 400-gallon water tank MARINE RESCUE Boston Whaler Hurricane This unit is owned by the RDCO and operated by KFD. Besides marine rescue, this unit is capable of pumping 490 us gpm for firefighting. 54 P a g e


55 Station 3 Rutland Rd. This station is staffed with a Captain and 3 Firefighters that cross staff the 3 units. ENGINE Spartan/ Rosenbauer 1500 gpm pump with 500-gallon water tank BUSH Ford 4X4 for wildland firefighting 125 gpm with 200-gallon water tank HAZMAT Freightliner HAZMAT unit This unit is owned by RDCO and operated by KFD. KFD owns an accompanying 16 cargo trailer that carries additional equipment for the Regional HAZMAT Team. Station 4 Dehart Rd. This station is staffed with 1 Captain and 3 Firefighters that cross staff 3 units. ENGINE Spartan/Superior 4X gpm with 500-gallon water tank 55 P a g e


56 BUSH Ford 4X4 for wildland firefighting 125 gpm with 200-gallon water tank TENDER International Water Tender 250 gpm with 2500-gallon water tank Station 7 Gulley Rd. This station is staffed with 22 POC Firefighters that train weekly and respond via pager when required. ENGINE Freightliner/ Hub 4X gpm with 1000-gallon water tank 56 P a g e


57 BUSH Ford 4X4 for wildland firefighting 250 gpm with 250-gallon water tank Station 8 Dry Valley Rd. This station is staffed with 17 POC Firefighters that train weekly and respond via pager when required. ENGINE Freightliner/ Hub 1500 gpm with 500-gallon water tank Station 9 Paley Rd. This station is staffed with 6 POC Firefighters that train weekly and respond via pager when required. ENGINE Freightliner. Pierce 4X gpm with 750-gallon water tank 57 P a g e


58 Reserve Apparatus These units are housed at Station 1 to replace frontline units during repairs. These units are also backfilled when necessary during major events where frontline units are committed for an extended period of time. PUMPER Spartan/ Superior Originally was Engine 3 that was moved to reserve status in 2009 after 15 years of front line service. This unit is due to be decommissioned after 21 years of service. PUMPER 11 BACK UP RESCUE 1996 Spartan/ Superior Originally was Engine 1 that was moved to reserve status in 2011 after 15 years of front line service. This unit is due to be decommissioned after 19 years of service Mack/ Superior The former Engine 2 was converted to a backup Rescue Truck to be used when the front line Rescue is out of service. This unit is due to be decommissioned in 2016 after 25 years of service. 58 P a g e
, Ford Transit, Mazda Tribute Fire Training/ Safety Officers Training")

59 Fire Prevention/ Public Education/ Fire Investigation Fire Prevention Branch The Fire Prevention Branch is based out of Station 1 with a Fire Prevention Officer and 4 Fire Inspectors whose primary duties include: Fire Inspections Public Education Fire Investigation Vehicles include: Ford Focus, Chevy Aveo, VW Beetle (donated), Ford Transit, Mazda Tribute Fire Training/ Safety Officers Training Branch The Training Branch is staffed with a TO and ATO whose primary duties include: Co-ordinate and deliver instruction to Career and POC staff. Perform as Safety Officers at emergency incidents assisting the incident commander. Vehicle: Ford F EMERGENCY VEHICLE EFFCIENCIES KFD continually monitors its fleet for adjustments to meet the needs for the City based on services provided. As the city has expanded over the years, variations in apparatus types and response capability has been evaluated and altered to best fit the needs of the community while creating efficiencies. A new multi-purpose Rescue truck with pumping capability is under construction and is expected to be in service in The multi-purpose capability establishes a dynamic deployment and risk based response function for KFD which will be deployed to areas for peak periods, respond to lower risk calls and can initiate exterior operations in the event of a structural fire. This will be the first Rescue truck with pumping capabilities to enter KFD s fleet. The current Rescue 1 will remain central to provide additional 59 P a g e
60 rescue activities within the City as well as a reserve apparatus for mechanical downtime. All future Engine procurements will include the basic extrication equipment allowing further dynamic deployment of all apparatus. Currently KFD (depending upon the specifics of the incident) dispatches an Engine and Rescue 1 for MVIs. The reason for this is to provide the required tools for extrication purposes. Assessment Factor 5 To enhance operational effectiveness and efficiency, life cycle replacement Engines will be tendered as multi-purpose Engine/Rescues. The existing fleet will be examined to determine if a retrofit is possible to create the multi-purpose capability. A trial utilizing a smaller vehicle of FMR deployments in Stations 1 and 7 response areas is underway. Previously, the Rescue unit was the responding apparatus to all medicals within Station 1 and Station 7 fire protection areas. This trial has switched the response to a smaller and more manoeuvrable Bush truck allowing Rescue 1 to remain central within the city. In addition, a smaller unit is now the responding FMR unit in the Station 7 area. This pilot project also has an impact on reducing fuel consumption, repair costs, and reducing unnecessary wear and tear on large more expensive replacement apparatus. After a 6-month trial, all results will be analyzed and staff feedback received to extend the deployment or look for another alternative model. If the results are as expected, a new dynamic deployment model may be initiated for FMRs in all career stations. The Ladder truck is currently assigned to Station 2 and scheduled for replacement in 2022 at an estimated $1.2 million. Prior to the scheduled replacement date, KFD is prepared to enter into talks with neighbouring municipalities on a formal ladder agreement. If an agreement can be reached, the current ladder would not be replaced allowing nearly $1.2 million in replacement costs to be avoided. With the amount of forested area around and within the City, interface fire threat continues to be a high probability risk with further development within the interface areas. Additional smaller apparatus need to be looked at closely in the event of any further station openings. Larger fire Engines that once were the multi-use vehicles have been phased out in actual attack of a wildfire and replaced by smaller Bush trucks equipped with pump and water capabilities. In 2015, the first Utility Transport Vehicle (UTV) unit was added to the fleet of emergency response vehicles. This addition has proven to be highly successful for wildland fires and rescue operations in limited access conditions this past year. 60 P a g e
61 Since 1997, the City has contracted fire suppression services (including FMR) to the District of Lake Country (DLC) for the northern area of the City Limits. The primary response for emergencies occurring in the contracted area is the Lake Country Volunteer Fire Department (LCVFD). Response statistics indicate an average response time of 12:37 minutes. The City pays the DLC approximately $280,000 to provide fire protection and FMR services to this area of the City. This is discussed in more detail in Section 6.8 of this report with a view to fully examine the need for this contract. 5.6 COMMUNITY COMPARABLE ANALYSIS KFD, like the entire fire service, is challenged to provide excellent customer service for a variety of emergencies in a timely manner while being cost efficient. Below is a comparison of fire departments in like sized communities with information supplied by the respective Fire Chief. The response time standards of the fire departments surveyed strive to respond as quickly and effectively as possible but are unable to meet the NFPA standard of a 4-minute travel time for the first unit on scene 90% of the time. Like KFD, many of these communities have set a local standard that are more obtainable ranging from 4 to 8-minutes travel time in urban areas. Not all of the surveyed communities utilize POCs as part of their operations. KFD s call volume consists of on average 66% first medical responses. This is consistent amongst the surveyed departments which ranged from 42% to 70%. Of note is that KFD performs more FMRs than 5 of the other 7 departments total call volume (see table below). Engine 2 based at the Water Street Station responded 3,165 times in In comparison to even larger cities, Vancouver s busiest fire Engine had 2,382 responses and Surrey s busiest fire Engine had 2,489 responses in Table 2: Community Comparative Analysis City Population Area (sq.km.) Career FF/ population Call Volume Stations Career/ POC Firefighters Career/ POCs Busiest Response Zone Kelowna 124, : /3 96/ Delta 100, : /0 161/ Kamloops 99, : /2 104/ Prince George 78, : /0 104/ Saanich 111, : /0 98/ Nanaimo 100, : /1 81/ Abbottsford 138, : /4 82/ Coquitlam 140, : /0 162/ P a g e

62 Assessment Factor 6 In comparison to similar sized cities, KFD has the highest call volume, the second lowest ratio of career Firefighters per capita and the third highest population. 5.7 RESPONSE STATISTICS The requests for services have been consistent over the past 5 years with a peak volume occurring in 2012 at just over 10,300 calls resulting in an average of 9,676 incidents per year. It is anticipated that request for service calls will increase as the population and development increases. The chart below shows how busy each station has been over the last 5 years. Station 2 is the busiest station with a 5-year average of 3,185 responses annually. The next busiest Station is station 3 with a 5-year average of 2,200 annual responses, ranking above 3 other cities in the comparison above. 3,500 Incidents Trend by Response Zone 3,000 2,500 2,000 1,500 1, P a g e


63 The 3 charts below provide an analysis of the response volumes; by month, by day and by hours in a day: Oct 9% Sep 9% Incidents by Month Aug 9% Nov 8% Dec 8% Jul 10% Jan 7% Feb 7% Mar 8% Jun 9% Apr 8% May 8% Friday 15.47% Incident by Day Saturday 12.29% Sunday 11.55% Monday 14.25% Thursday 15.29% Tuesday 15.24% Wednesday 15.91% 600 Incidents by Hour P a g e
64 The chart below illustrates how 6 basic incident types are dispersed throughout KFDs service area for a typical year such as The chart gives a percentage for the incident type in each basic response zone. For example, over 72% of rescues take place in area 2 (downtown) as most are marine rescues. These statistics also help confirm resource assignments in terms of distribution and concentration. For example, this data confirms the necessity to locate the Rescue truck at Station 1 as approximately 40% of the MVIs occur in area 1 (Enterprise). 80% 70% 60% 50% 40% 30% 20% 10% 0% Station 1 Station 2 Station 3 Station 4 Station 7 Station 8 Station 9 Other - Aiport & Out of Area The chart below illustrates how each station s call volume was represented within the 6 basic incident types in % 70% 60% 50% 40% 30% 20% 10% 0% FMR FIRE EMERGENCY NON FIRE EMERGENCY MVI RESCUE OTHER 64 P a g e
65 Over the past 5 years, KFD has experienced an average dollar loss of $11.9 million the highest categories being $5.76 million loss in multi-family residential occupancies and $2.39 million loss in single family homes, vehicles and outdoor fires (non-inspectable). This data coupled with the previous graph helps KFD identify fire loss trends and areas of concentration to focus fire prevention initiatives, public education and emergency response target options for deployment of firefighting resources. The 5-year dollar loss by occupancy type city wide is detailed below. Table 3: 5 Year Dollar Loss by Occupancy Dollar Loss YTD 2010 % 2011 % 2012 % 2013 % 2014 % Total Dollar Loss $12,400, % $17,800, % $5,900, % $19,100, % $4,300, % Assembly $16, % $38, % $338, % $66, % $0 0.00% Institutional $ % $3, % $4, % $1, % $0 0.00% Multi - Residential $840, % $11,279, % $1,045, % $15,225, % $437, % Single Family Residential* $1,046, % $2,214, % $3,920, % $3,034, % $1,713, % Commercial $399, % $1,816, % $5, % $15, % $ % Mercantile $44, % $2,139, % $157, % $3, % $0 0.00% Industry (High Hazard) $5,000, % $0 0.00% $0 0.00% $704, % $5, % Industry (Medium Hazard) $5,073, % $291, % $383, % $69, % $2,132, % Industry (Low Hazard) $0 0.00% $8, % $0 0.00% $75, % $0 0.00% *Includes Vehicle & Outdoor Fires Assessment Factor 7 Distribution and concentration of KFD resources will be based upon mitigating fire related death, injury and dollar loss trends. 5.8 SERVICE EFFECTIVENESS The components of service effectiveness are comprised of response time sequence, the ERF, industry standards, staffing of emergency response vehicles, MDS and critical tasks. For clarity the ERF is the minimum number of personnel that are required to manage an event and is necessary to minimize the loss of life and property as well as maintaining firefighter safety. The MDS is the total career staff on duty. For example, the ERF for a residential house fire is 16 Firefighters whereas the MDS is 19 Firefighters on duty. The following section will discuss these components. To effectively respond to an identified risk, it is necessary to have an understanding of what types of equipment and numbers of properly trained personnel are needed to mitigate each risk category for each service provided. This is accomplished through a critical task analysis process. Firefighter safety is the first priority at any incident or when delivering any type of service. The deployment of the appropriate number of firefighters increases the 65 P a g e

66 effectiveness of those firefighters in completing tasks and will maximize the safety of all responding personnel. The responsibilities of the first in apparatus and those of the initial deployment apparatus identified in the critical tasking analysis are defined as the ERF. Response Time Sequence: Effective response time with adequate resources is necessary to limit threat to life, property and the environment. The intent of an effective and timely response is to act on the fire prior to flashover where the all the room s contents have heated to their ignition point where the fire grows exponentially as illustrated below. In a fire s timeline, KFD has influence on the amount of time it takes to receive and process a response and, on the amount time it takes to receive and process a call from the public reporting a fire and, the time necessary to alert firefighters. The NFPA 1221 standard time to process the emergency call is 95% of calls are answered in 15 seconds and 90% of calls are processed in 60 seconds. KFD Dispatch Centre is able to meet these standards. The next component that KFD has influence over is the amount of time it takes firefighters to get ready and respond to the alarm. This is referred to as turn out time. The NFPA 1710 industry benchmark for turn out time is 60 seconds for medical responses and 80 seconds for fire responses. While the NPFA turnout time standard is recognized throughout the fire service industry it is a standard that is not readily met due to several factors such as: Station layout Personnel location in Station Personal Protective Equipment (PPE) Requirements Length of dispatch message 66 P a g e
67 Time of day Speed of Rip and Run Activity at time of call Apparatus deployment In 2014, KFD conducted several time trials to determine if it was possible to lower the turn out times for both medical and fire responses. Variables tested were Station wear (uniforms); as well as a pre alert system to 911 emergency calls. The Pre Alert system is an audible alert over the existing intercom system that notifies firefighters that a call is being created for their station. After considerable live trials, it was determined that station wear made a marginal difference compared to a pre alert system. The pre alert system was disclosed to the Information Services (IS) department to see if it could further build on the program for all Stations. Additionally, emergency intervention for medical incidents is just as imperative. The sooner Cardio Pulmonary Resuscitation (CPR) and defibrillator protocol begins, the better the patient s chance of survival. A victim s chance of surviving cardiac arrest is highest when CPR is initiated within 5 minutes of the heart stopping and defibrillation within 10 minutes. KFD s participation in the FMR program is done so without the requirement for additional staff or response vehicles. FMR is provided within the fire suppression response system s existing capacity. Travel Time: Travel time to emergency calls is directly related to the concentration and distribution of resources of Stations, staff and equipment, and geographic coverage. The NFPA 1710 standard for a single family dwelling fire is 4 minutes 90% of the time for the first unit to be on scene. Travel time is based on departure from the Station to arrival on scene of the incident. Response time is travel time plus the turnout time. This report will focus on response times as the performance targets measurement. While NFPA standards provide timelines, apparatus deployment and staffing on various emergency types, the KFD has administratively adopted local specific goals for response time and resource allocation depending upon the type and severity of the event. Within the PGB the goal is to have the first truck response time arriving within 7:40 minutes 90% of the time of being dispatched for all emergency types. For areas outside of the PGB, the deployment is the same with the first truck arriving within 11:40 minutes 90% of the time of being dispatched. The map on the next page depicts the City boundaries for the PGB. It is important to note that the 5-year average indicates that 93% of all calls for service that KFD receives are within the PGB. 67 P a g e

68 68 P a g e
69 Assessment Factor 8 Emergency response performance target options will be realistically related to effective response time for initial assignment (first emergency vehicle on scene). 5.9 FIRE COMPANY SIZE A fire company is defined as the team of firefighters assigned to a fire apparatus. An April 2010 report issued by the National Institute of Standards and Technology identifies 5 as the optimum number of firefighters for an Engine for most effective operations over 22 critical fire ground tasks at a typical single 2000 square foot family residential fire. As previously indicated, the WBC 1 regulations stipulate that if firefighters enter a structure fire s hazardous atmosphere, a minimum of 2 Firefighters must be together and there must be at least one firefighter outside to run communications during the event. This does not include the operator of the fire pump who is integral to ensuring that the interior attack team has water to combat the fire and protect themselves. Essentially, this means that the first arriving Engine is not legally able to perform entry into any structure fire to attack the fire or perform a rescue until 4 Firefighters are on the scene. The standard goes on to state that within 10 minutes of entry, an additional 2 member RIT must be available standing by outside to perform a firefighter rescue or the 2-member interior team must exit and abandon interior operations. It should also be noted that no specific tasks that would interfere or delay RIT deployment can be assigned to the RIT team members. Their sole purpose on scene is for firefighter safety and rescue if required. In 2000, the City Council made the decision to establish 4 firefighter Engine companies based upon the WCB Legislation. This required an increase in staffing of 16 Firefighters. In 2013 the City Council reviewed the 4 firefighter Engine company as part of the KFD Draft Strategic Plan review. At that time Council supported the continuation of the 4 firefighter Engine company. The KFD Standard Operational Guideline (SOG) for resource deployment to a fire in a single family residence is based on the WorkSafe legislation and fire industry guideline for residential fires. These identify a minimum ERF of 16 Firefighters is required to perform critical tasks at this type of emergency incident. The composition of the ERF of 16 includes a Safety Officer that is one of the KFD TOs. During normal dayshift work hours, they respond to fire responses. After day shift hours responses requires the recall of an off duty TO and they may or may not be available. 1 WorkSafe BC Entry Into Buildings 69 P a g e
70 These tasks include: Command and Control Scene Safety Search and Rescue RIT Fire Attack Water Supply Pump Operations Ventilation The following section provides basic information on the department s emergency response services, the general resource capability, and the KFD staff resources for that service EMERGENCY RESPONSE SERVICES SUMMARY The current KFD deployment system has been analysed to determine the 90 percentile and table 4 below indicates the average performance response time inside and outside the PGB: Table 4: Average Performance Inside & Outside the PGB Inside PGB 90 Outside PGB 90 Percentile Percentile Service Gaps 9:31 14:30 Inside PGB: Glenmore/UBCO/YLW area and Lakeshore/Pandosy/Gordon for call volume or risk Outside PGB: McKinley, and north Glenmore and contracted area 70 P a g e
71 The following tables depict the MDS, resource assignments and staffing configuration; Table 5: MDS and Resource Table Service Fire Suppression General Resource/ Asset Capability 4-4 member staffed Engines 1-2 member staffed Squad (cross staffed Ladder/ Rescue/Tender/Bush/Gator) 1 Platoon Captain 1 Safety Officer (day shift or recalled off duty) Additional cross staffed equipment: 1 Ladder Truck 2 Bush Trucks 2 Water Tenders 1 Fire Boat 1 UTV Gator POC Units 3 POC Engines 2 Back up Pumpers 1 Back up Rescue 1 Bush Truck Basic Staffing Capability/ Shift 19 MDS Suppression minimum staffing (24/7) Call back Career staff 45 POC members Staffing Distribution: The table below depicts the staffing configuration/ranks and MDS: Table 6: Staffing Configuration/Ranks & MDS Career Staff: Suppression Number Minimum on Duty POC Suppression Staff: Platoon Captains 4 1 All ranks are on call 24/7 Captains 16 4 and utilized on as required basis in accordance within Lieutenants 4 1 the Alarm Assignment Firefighters Guideline. Current staffing levels as indicated below: TOTAL Station 7 (SEK) 22 Station 8 (Glenmore) 17 Station 9 (McKinley) 6 July 2015 TOTAL P a g e
72 5.11 CURRENT STAFFING AND CRITICAL TASKING The KFD service area has a wide variety of challenges from the densely populated urban areas with risks associated with high rise residential and commercial/industrial buildings to the unique challenges of the rural areas in wildland interface fires and back country type rescues. By evaluating the risk potential to firefighters, people, the environment and basic infrastructure, KFD has developed a standard operating procedure for all types of incidents. This guideline enables a systematic method to elevate the resource deployment and call back staff (off duty career and POC) to assist at large events or to provide geographic coverage for the City. At the beginning of 2015, a time based assessment on the call back of off duty career staff took place. The purpose was to determine the average time for a fire Engine to be fully staffed to the operation requirement from call back. For entry into a building in the event a second fire incident occurring while on duty staff were initiating suppression activities at the original emergency, the required number of Firefighters is 4. On average from the call back logs analyzed, the average time to assemble a complete fire suppression crew was minutes per occurrence at Station 1. It must be emphasized that KFD s current on duty staffing has the critical task capability to handle one single family residential fire provided it has not extended beyond the structure of origin. Any larger event such as multiple structures, commercial or industrial fires, wildland fires, HAZMAT or technical rescue requirements would overwhelm the on-duty contingent requiring the back filling of reserve apparatus with off duty staff on OT and POCs. Fire service critical tasks are those tasks that are essential to perform at fire and emergency scenes in order to provide an efficient and effective response to any kind of incident in an appropriate time. A critical task analysis of the various common types of responses including time line and specific operational tasks is provided at Appendix B. The following tables overviews the alarms assignment guideline and staffing for the common types of responses: Alarm Incidents: Table 7: Wildland Fire minor (1st alarm) Unit Type Number Total Personnel Notes of units Engines 1 4 For example: a fire in short grass/low angle terrain/manageable area Bush truck POC in 7,8,9 1 ERF 3 6+ POCs 72 P a g e
73 Table 8: Wildland Fire (2nd alarm) Unit Type Number Total Personnel Notes of units Engines 2 8 Heavy wildland fuel areas/steeper slope/structure proximity Bush truck 1 1 POC in 1,7,8,9 Water Tender 1 1 DC notified Safety Officer 1 1 Career call backs to restaff Station(s) Dispatcher 1 Dispatcher called back Incident Commander 1 1 ERF POCs Career call back to incident Table 9: Wildland Fire major (3rd alarm) Unit Type Number Total Personnel Notes of units Engines 2 8 Heavy wildland fuel areas/steeper slope/structure proximity Bush Truck 4 4 POC in 7,8,9 Water Tender 1 or 2 2 Safety Officer 1 1 Career call backs to restaff Station(s) and incident Dispatcher 1 Dispatcher called back Incident Commander 1 1 Deputy Chief notification Station 1 POCs Deputy Chief 1 1 ERF POCs Table 10: Single Family Residential Unit Type Number Total Personnel Notes of units Engines 3 12 Career call backs to restaff Station(s) Squad 1 2 Safety Officer 1 1 Incident Commander 1 1 Deputy Chief notification POC in 7,8,9 1 ERF P a g e
74 Table 11: Multi Family Residential/ Commercial/ Industrial Fire Unit Type Number Total Personnel Notes of units Engines 4 16 Career call backs Squad (Ladder) 1 or 2 2 To re-staff station(s) and incident Safety Officer 1 1 POC Incident Commander 1 1 Career call backs Deputy Chief 1 1 Deputy Chief respond to scene Firefighter call back As required ERF Table 12: HAZMAT minor (1st alarm) Unit Type Number Total Personnel Notes of units Engines 1 4 For example: small fuel spill from vehicle ERF 1 4 Table 13: HAZMAT (2nd alarm) Unit Type Number Total Personnel Notes of units Engines 1 4 Career call backs to restaff Station(s) HazMat truck 2 1 Safety Officer 1 1 POC in 7,8,9 Incident Commander 1 1 Deputy Chief notification HazMat Team 6 On duty Hazmat team assembles ERF 5 13 Table 14: HAZMAT (3rd alarm) Unit Type Number Total Personnel Notes of units Engines 1 4 Career call backs HazMat truck 2 1 To re-staff station(s) Safety Officer 1 1 POC in 7,8,9 Incident Commander 1 1 HazMat Team 6 On duty Hazmat team assembles HazMat technicians 0 As required by called back Incident Command 74 P a g e
75 Dispatcher 1 Dispatcher called back Deputy Chief 1 1 Deputy Chief responds to scene ERF Assembles Table 15: Motor Vehicle Accident with Extrication Unit Type Number of units Total Personnel Engines 1 4 Rescue truck 1 2 POC in 7,8,9 1 ERF 3 6+ POCs Notes Table 16: Alarm activation by automatic system Unit Type Number Total Personnel Notes of units Engines 1 4 POC in 7,8,9 1 Add: 2 nd Engine and Command unit for high life occupancies 1 5 Additional units respond to places such as schools and rest homes. ERF POCs Table 17: First Medical Response Unit Type Number Total Personnel Notes of units Engines 1 4 Stn 2,3,4 Squad in area 1,7,8,9 1 2 Stn 1,7,8,9 POC in 7,9 1 ERF 2 4+ POCs Table 18: Technical Rescue Unit Type Number Total Personnel Notes of units Engines 1 4 Patient contact/medical aid Technical Rescue Team 1 or 2 6 TRT assembles Career call backs to restaff station(s) and to the incident ERF 2/3 10 Deputy Chief notification 75 P a g e
76 Table 19: Aircraft Incident (2nd alarm) Unit Type Number Total Personnel Notes of units KFD Engines 2 8 KFD Rescue truck 1 2 KFD Incident Commander 1 1 KFD Deputy Chief 1 1 KFD Safety Officer 1 1 ERF = 13 KFD staff YLW Airport Crash Trucks 2 4 YLW Duty Manager 1 YLW Fire Chief and Asst. 2 ERF = 7 YLW staff Chief Effective Response Force *Other agencies such as RCMP and BCAS also respond as per their internal protocols. Table 20: Aircraft Incident (3rd alarm) Unit Type Number Total Personnel Notes of units KFD Engines 2 8 KFD Rescue truck 1 2 KFD Incident Commander 1 1 KFD Deputy Chief 1 1 Responds to scene KFD Safety Officer 1 1 KFD Water Tender 1 1 ERF = 14KFD staff YLW Airport Crash Trucks 2 4 YLW Duty Manager 1 YLW Fire Chief and Asst. 2 ERF = 6 YLW staff Chief Mutual Aid Engines 2 4+ Mutual Aid Water 1 2+ ERF = 6+ Mutual Aid staff Tenders *Other agencies such as RCMP and BCAS also respond as per their internal protocols 5.12 ALARM ASSIGNMENT SYSTEM The minimum staff on scene must be 4 Firefighters to make entry into a burning structure and to carry out suppression, search and rescue, and overhaul. These initial 4 Firefighters are committed to the following critical tasks: 2 are designated as an attack team 1 is designated as a Pump Operator 1 is designated to outside communications While Fire Departments across North America utilize NFPA 1710 as a staffing model, it is based on response times, firefighting personnel, apparatus staffing and several 76 P a g e
77 other factors. KFD utilizes an alarm assignment guideline to best meet these operational and regulatory requirements. To summarize, for a typical single family residential fire, the alarm assignment utilizes 16 of the available 19 career staff on duty. All 16, which includes the Training Officer assembled at the scene play a significant role in rescue and suppression and would be classified as a second alarm. A call back system is in place to staff an additional fire Engine with 4 Firefighters leaving a total of 8 Firefighters to cover the remaining city areas. For a general alarm assignment, all 19 on duty Firefighters would respond to the incident and call back of all off duty career would be initiated to respond to the scene. The POC Firefighters would then be called to report to their respective stations for geographic coverage or if necessary respond to major events and support the career operation PAID ON CALL FIREFIGHTERS The POC system is complicated with defined limitations in mid-sized cities such as Kelowna. There must be a balance between training hours and responses otherwise POC members become overwhelmed and do not stay. They need to be assigned to a station that is close to their respective residence or place of work. Even though some employers may grant time away from work, others do not. While some of the POCs have the goal to secure a career position; others simply just want to give back to their community. KFD s challenges with recruitment and retention of POCs are not unique. Volunteer services across Canada are experiencing similar issues. The 44% turnover rate in 7 years is typical amongst the 5 departments surveyed. The fact is, approximately 40% of POCs are seeking career opportunities either with Kelowna, neighbouring communities and/or other cities. The continued turnover of POC s resulting in additional budgetary pressures for KFD is further exacerbated by the new training standards (OFC Playbook). The recurring costs include basic recruit training with costs for the trainer, recruitment, and PPE as well as certification costs. Notwithstanding the above, it must be emphasized that the POC contingent is a valued component of the emergency response system in Kelowna and are a cost efficient support service for KFD. In 2015, the KFD completed city wide recruitment for POC members for all 3 POC Stations. In an effort to staff Station 7 with a higher number due to call volume and the inability to staff a fire truck completely for fire calls and medical calls, the recruitment only yielded 4 candidates. Station 8 yielded 5 candidates and Station 9 yielded zero applicants. While overall the city received over 60 applicants, many did not live within the catchment area required to be effective in the delivery of service in the response areas. 77 P a g e
78 It should be noted that while the POC members are dedicated and highly regarded members of the KFD, there is no way of being able to predict the number of members that are available to respond to an emergency. In some occurrences there has been no POC response to calls within the City. POC members are an integral part of the KFD resource deployment however depending upon the time of day, weekday, month, etc., there is no guarantee of responder attendance. The role of the POC members based out of the McKinley, SEK and Glenmore Stations are as part of the initial response to all incidents in the rural area due to the greater response time and to support career operations in the PGB. All POC response areas are responded to by career staffed Stations. To date, there is a shortfall of POC Firefighters stationed in McKinley with 6 members currently active. Assessment Factor 9 Emergency response performance target options will include: Minimum staffing of Engines to remain at 4 Firefighters Role and limitations of the POC system KFD current ERF is limited to mitigating a single event low to moderate risk situations. High and Maximum risk events will require additional resources above the ERF and may include external agencies and/or mutual aid from neighboring communities. 6. SECTION 6 GAP ANALYSIS AND OPTIONS Across Canada, all levels of government are facing strong demands for cost reduction and increased value in the delivery of services. Politicians and government executives are relentlessly looking for strategies that balance public expectations, and deliver valued services/programs, while maintaining fiscal restraint amidst global, international, national and local economic realities. This environment has resulted in the need for Fire Chiefs to adopt a more private sector businesslike approach to leading/managing their respective fire service. They must be proactive and along with the Chief Administration Officer (CAO) examine all aspects of the service delivery systems to look for innovative efficiencies and effectiveness. In essence run the fire service as a business. This requires a shift from the typical caretaker approach of maintaining the current systems to a predominate focus on creating the future that is responsive to change, and is sustainable and efficient. This section will discuss service delivery gaps and/or additional assessment factors as a result of the data and analysis previously introduced in this report. The development of options or recommendations will be supported by evidence based 78 P a g e
79 considerations with the overarching goals to position KFD as an innovative, efficient and effective fire service. 6.1 SUMMARY OF ASSESSMENT FACTOR Throughout the report several Assessment Factors have been identified that will have direct impact on the development of meaningful performance targets. The following is a summary of the key assessment factors: 1. Emergency response performance targets will be evidence based data with consideration for the City footprint; residential construction types; Interface risks (wild-land/forest fire risks), rate of growth and demographics; Industrial/commercial activities; transportation systems and growth in traffic volumes and available water flows for firefighting. 2. Emergency response performance target options will be developed by applying geographic coverage and dynamic deployment and risk based responses as efficiency and operational effectiveness measures. 3. PM/DDS will provide the evidence based data to develop emergency response targets. 4. Emergency response performance targets will ensure compliance with Provincial safety and training standards legislation. 5. To enhance operational effectiveness and efficiency, life cycle replacement Engines will be tendered as multi-purpose Engine Rescues. The existing fleet will be examined to determine if a retrofit is possible to create the multi-purpose capability. 6. In comparison to similar sized cities, KFD has the highest call volume, the second lowest ratio of career firefighters per capita and the third highest population. 7. Distribution and concentration of KFD resources will be based upon mitigating fire related death, injury and dollar loss trends. 8. Emergency response performance targets must be realistically related to effective response time for initial assignment (first emergency vehicle on scene. 9. Emergency response performance target options will include: Minimum staffing of Engines to remain at 4 Firefighters Role and limitations of the POC system KFD current ERF is limited to mitigating a single event low to moderate risk situations. High and Maximum risk events will require additional resources above the ERF and may include external agencies and/or mutual aid from neighboring communities. 79 P a g e
80 6.2 FIRE UNDERWRITERS SURVEY 2012 In 2012, the KFD contracted the services of SCM Risk Management Services Inc. to evaluate the community s fire protection programs referred to as a Fire Underwriters Survey (FUS). The purpose of the assessment was to determine whether the community s current fire insurance grading classifications are representative of the fire protection programs and fire protection resources that are currently in place within the community. The report used over 34,000 points of Required Fire Flow (RFF) data to grade the community by KFD response zones. RFF may be described as the amount and rate of water application and fire company response, required in firefighting to confine and control the fires possible in a building. The FUS credits are another layer of data that KFD used to evaluate current distribution and concentration of resources and identify gaps in service by response zone. The results of the 2012 FUS grading for the Distribution of Fire Companies is detailed below. This is a highly weighted portion of the FUS grading as it identifies the actual response available to each building in the community. RFF calculation is completed for each building and the resultant response is read from the FUS Table of Effective Response (See Appendix C ). The actual response to the building is then measured against what is actually available using GIS analysis and a percentage credit is applied to the response area. This means that the higher the credit received for a response area, the more KFD is theoretically prepared to combat a fire in the response area (note: this grading does not consider wildland fire threat). Table 21: FUS Distribution of Fire Companies Urban Centers (OCP) KFD Response Zone(s) FUS Credit Received City Center (2-1-4) 78.5% Midtown (West) (1-2-3) 53% Midtown (East) (1-3-2) 97.5% South Pandosy (2-4-1) 25.5% Capri/ Landmark Center (2-1-4) 78.5% Rutland (3-1-2) 38.5% Village Centers (OCP) KFD Response Zone(s) FUS Credit Received South Gordon (4-1-2) 6.5% University South (3-1-2) 38.5% Glenmore (suburban) (1-8-2) 32% Guisachan (2-1-4) 78.5% Black Mountain (3-1-2) 38.5% 80 P a g e
81 Other Areas KFD Response Zone(s) FUS Credit Received SEK (7-1-4) (7-1-3) 45.75% McKinley (9-1-2) 65% Industrial area bordering Lake Country (71-1-3) 0% Airport(aviation/nonaviation) ARFF + (3-1-2) 0% NOTE: KFD response zones are correlated as near as possible to identified OCP urban and village centers. The results of the FUS indicated that the Glenmore/UBCO/YLW and South Pandosy/Gordon response zones received the lower FUS credits. To reduce KFD s gap in emergency service delivery a number of data sources was reviewed including: Historical response data FUS credit ratings FUS RFF value weightings Home insurance coverage rankings Wildland interface risk assessment Impending land development and population growth Addition of Station 5 The FUS report consultants were requested to include a hypothetical score for the Glenmore/ UBCO area with the completion of John Hindle Drive, extension of Curtis Road and the addition of Station 5 located at the intersection of John Hindle Drive and Glenmore Road. The results improved from a credit rating from the mid 30% to as high as 74%. In addition, the RCMP as part of their Community Crime Reduction Strategy and Police Zone response concept are looking for a facility in the Glenmore area. Construction of the new Station 5 should consider future opportunities to share space with other city services such as the RCMP Community Policing, similar to Station 3. It must be noted that utilization of the existing Station 8 in Glenmore and Curtis road as a primary response route was considered in this plan. In light of the City s and Agricultural Land Commission decision dated 22 November 2011 (appendix F) that the current Station 8 site would be reclaimed as Agricultural Land Reserve (ALR) and that Curtis Road is a private road, this option is not deemed feasible to address the service gap. 81 P a g e
82 From this analysis, it is recommended: RECOMMENDATION 1 That the City identifies an appropriately zoned parcel of land for the construction and career staffing of a new Station (#5) in North Glenmore at or near the intersection of Glenmore Rd and John Hindle Dr. (near or inside the #3 Area Structure Plan). Addition of Station 6 The FUS report consultants where also requested to include a hypothetical score for the South Pandosy/Gordon/ Benvoulin area. The addition of Station 6 near the intersection of Gordon Drive and KLO Road would improve the credit rating from 6.5% to as high as 61.5%. It is important to note that this additional station is not anticipated until after Building Services has included the construction of Station 6 in the 2030 Capital Infrastructure Plan. In the interim, the preferred option identified in this report includes a dynamic deployment and risk based response system in this area until such time as the additional station is required. This is discussed in more detail in Section 6.6 of this report. 6.3 TURN OUT TIME ANALYSIS As discussed in Section 45.2, turn out time is a segment of the response sequence where firefighters are alerted, don their PPE and move to the response units. This segment ends when the response unit moves out of the station. The NFPA 1710 industry benchmark for turn out time is 1 minute for medical responses and 1:20 minutes for fire responses. In 2014, KFD conducted several time trials to determine if KFD could lower the times that were identified on both medical and fire responses with no significant improvement. Given this, and that the comparative fire departments surveyed as part of this study also could not meet the NFPA standard, KFD will establish a turnout time performance target that can be realistically achieved. The monthly dashboard report that measures this segment indicates that for both fire and medical responses the turnout times are consistently exceeded by approximately 50 seconds (medical = 1:39 minute, fire = 1:56 minutes). RECOMMENDATION 2 KFD will set a performance target to achieve an average turnout time of 1:40 minutes for fire responses and 1:20 minutes for medical responses. Ongoing system reviews will be conducted for continuous improvement of turnout times. 6.4 STATION ANALYSIS The location of Stations in any community is a long term decision that involves a significant number of factors. This includes the changing role of the fire service, the risk assessment factors identified in Section 6.1 of this report and the level of service the City can afford. These factors all apply to the City. Seven of the current KFD stations have remained in their original location, though in many cases they have 82 P a g e
83 been modernized since their original commissioning. In the forty years since the last career station was built, the population of Kelowna has increased by 250%, going from 50,000 in 1975 to an estimated 124,000 in The question becomes at what point are additional stations added due to growth and development, and increased risks? Growth in population may be a starting point in determining the requirement for additional stations. Density is one of several factors that need to be considered. The City amalgamated the surrounding areas of Cedar Creek, Glenmore, Rutland, Benvoulin, SEK and Mission in 1973 which brought small neighbourhood communities into the city. Each of these smaller communities had already established fire services with the stations located within their respective boundaries. With the exception of Benvoulin and Cedar Creek the existing stations are used today as the KFD distribution infrastructure. It must be noted that the station locations are not optimum and result in response time challenges. This factor has been identified in the previous KFD strategic plan studies. For this reason, the emergency response time target options will include geographical coverage as a key factor. Using PM/DDS there are geographic service gaps currently in the northern the City limits. The PM/DDSS computer generated maps number 1; (Section 6.5.1) illustrates where KFD is currently achieving the 7:20 minute goal by the highlighted green area and where the gaps are identified in red. Map number 2; (Section 6.5.1) depicts the performance target enhancement if a Station 5 was to be constructed and staffed with career Firefighters. It is important to note that the data is compared to the response times predicted by PM/DDS and there is a significant congruence with all the previous studies. This serves to validate the previous studies completed on KFD s capabilities. 6.5 PM/DDS AND STATISTICAL ANALYSIS As previously discussed the two PM/DDS modules currently in use at KFD have provided actual response data to address two basic questions to assess future operational needs for KFD; 1. What has been happening in terms of call volumes, types of emergencies and response system performance? 2. What if the distribution and concentration of resources was enhanced to meet gaps in service coverage? The analytics provided by PM/DDS result in a plethora of options in the development of performance targets. The concentration and distribution of KFD resources will apply, geographic, dynamic deployment and risk based responses. Several proportions of risk and geographic coverage percentages were analyzed along with various response time targets. Given the City risk factors identified in Section 6.1 of this report the analysis in this report will focus on geographic and incident volume. 83 P a g e
84 RECOMMENDATION 3 KFD will base the preferred PM/DDS analysis on geographic coverage along with incident volume (risk based responses). Additionally, PM/DDS provides the opportunity to apply various response time increments ranging from the NFPA recommended 5:20 minutes and the current KFD 90 th percentile of 9:31 for PGB and 14:30 for the rural area (note these include the turnout time increment). While somewhat subjective, the cumulative consideration of the Assessment Factors identified in this report, comparison with similar sized communities, industry standards and legislation, previous KFD studies and KFD s current capabilities were applied in the development of a preferred travel time performance target. The overarching goal is to provide the optimum level of service that result in a cost efficient and operationally effective travel time target. RECOMMENDATION 4 KFD will establish performance targets for response times within the PGB to have the first fire truck arriving (dispatch to on scene time) within 7:40 minutes 90% of the time of being dispatched for all emergency types. For areas outside of the PGB, the deployment is the same with the first fire truck arriving within 11:40 minutes 90% of the time of being dispatched to arriving on scene. It must be noted that PM/DDS can apply any coverage/risk proportions or time increments in the development of performance target criteria. In general terms, shorter response time equates to more stations/firefighters, long response times creates service delivery and safety challenges for the public and firefighters, higher percentages in call volumes equate to geographic coverage gaps and vice versa. Using PM/DDS analytics the illustrations below have been recreated from using actual historical response data. The first illustration shows our current coverage within the City and the second illustration shows how the addition of Station 5 in the Glenmore area would enhance fire response within the City. It must be noted that a single station not only services the response zone it is located in but also responds to all areas within the City for additional resources due to the nature of the call. In addition, the recommended performance targets have been developed by SMEs considering all the relevant factors identified in this report. The 7:20 response target within the PGB places Kelowna in the middle of the fire departments surveyed for this report which ranged from 6 to 8 minutes. 84 P a g e


.")
85 6.5.1 PM/DDS Response System Maps The maps on page 85, illustrate the current geographic coverage (Map 1) and the 7:40 response time based on geography and incidents after the new adding Station 5 (Map 2). Map 1 Current System Map 2 Addition of Station 5 85 P a g e
86 6.6 RESOURCE DEPLOYMENT MODEL & STAFFING OPTIONS The analysis contained in this report indicates there are two underserved areas within the City (Glenmore/UBC/YLW and KLO/Gordon/Pandosy). The assessed risk tolerance requires the increase of career stations from 4 to 5 as soon as possible. This will address the service gap in the Glenmore/UBC/YLW area. The KLO/Gordon/Pandosy area will be served through the use of dynamic deployment and risk based responses until such time as a 6 th station is required. This assertion is based upon the City risk and Assessment Factors and other relevant considerations identified in this report. This analysis is consistent with the previous four studies (Section 1.5) conducted on KFD and the service delivery gaps within the PGB for the initial response in the Glenmore/UBCO/YLW and KLO/Gordon/Pandosy areas. The PM/DDS evidence based analysis serves to substantiate these previous studies through leading technology. RECOMMENDATION 5 The City will increase the KFD resource deployment capacity to 5 career stations. This will require the construction of a new station in the Glenmore/UBC/YLW area, the addition of 20 firefighters and a replacement Engine and bush truck. The preferred implementation would be to renovate Station 8 in Glenmore as an interim facility until the new Station 5 is completed and hire 20 firefighters in Understanding the need for financial constraint incremental staffing has been identified as follows: Table 22 Incremental staffing options Staffing Options Comments Option A 12 8 New Station 5 completed Option B New Station 5 completed Addresses geographic and risk coverage in Glenmore/UBC/YLW area. The ability of Station 1 to mobilize the 2 Firefighter Rescue units for risk and dynamic deployments particularly in the KLO/Gordon/Pandosy areas is delayed until Provides partial geographic coverage and risk in Glenmore/UBC/YLW area. May require increased overtime or reduced service levels depending upon available staffing. The ability of Station 1 to mobilize the 2 Firefighter Rescue unit for risk and dynamic deployments particularly in the KLO/Gordon/Pandosy areas is delayed until P a g e
87 It is important to note that KFD, as part of the annual business plan and budget process will review the response system performance utilizing PM/DDS. This is not only to monitor performance target progress but to look for further opportunities to increase efficiencies and operational effectiveness Comparison: Status Quo Recommended Station 5 The following section provides a more in-depth comparison of the recommended Station 5 Glenmore/UBCO/YLW Area - Convergent Support Model with the current traditional centralized support model. Recommended: Station 5 Glenmore/UBCO/YLW Area - Convergent Support Model Response Capacity: 5 career stations, 5 Engine companies, Rescue unit of 2 Firefighters and 3 POC Stations. The need for Station 5, as a replacement for the current Station 8, has been identified previously in 4 studies and has been most recently confirmed through the use of PM/DDS Analytics. As the area continues to develop, Engine companies from Stations 1 and 2 are facing increasing travel times, reducing effective response while also removing critical assets from some of the City s busiest areas, particularly Station 2 s downtown coverage area. Station 5 will require the addition of 20 new Firefighters, resulting in a fifth career Engine company within the City. This Engine company will continue to be supported by the other career stations and the POCs in the Glenmore and McKinley areas, but will considerably reduce response times for incidents in those areas. It is understood that construction of Station 5 will not be complete by 2017; therefore the units will be temporarily based out of Station 8 until the new Station 5 is complete. In reviewing the analytics and the need to address an underserved area (Glenmore/UBCO/YLW), the Engine company will be committed to geographic coverage the majority of the time during the day time period where the call volume is historically higher. The MDS will increase to 23. The addition of another Engine company will aid in convergent support to Station 1. In addition, OT and call backs will be reduced significantly by an estimated $125,000 with the increased response capacity to support the City during larger incidents or incidents that commit resources for extended periods such as Marine Rescue and the majority of single family residential fires. With the additional staffing, a more dynamic deployment approach to resource deployment will be achieved. 87 P a g e
88 As part of this model, the Rescue unit would be available for dynamic deployment and risk based responses. The primary focus will be coverage for the KLO/Pandosy area and response to lower risk calls as identified by PM/DDS. The operational costs including incremental staffing options is in the range of $3.1 million per year over the next 14 years. Staffing option B is on average $38,000 less per year than option A over the same 14-year period. Advantages: Incremental implementation that reduces overall interim costs as compared to full staffing and addresses existing service gap without delay. Allows for much of the flexibility with deferred costs through incremental staffing. Demonstrates efficiencies and effectiveness on an ongoing basis. Risk model can be adjusted and is based upon, and validated by scientific data. Does not result in a degradation of current service levels and will improve overall efficiencies by redistributing/redeployment of existing resources. Deletion/revision of DLC contracted fire suppression service resulting in a potential savings of approximately $280,000 in Enhances response service level for McKinley area. Fire Engines at the outer perimeter of all quadrants of the response zones allowing a convergent response from the perimeter. Delays the need for Station 6 through risk based responses and dynamic deployments once full implementation has occurred. Disadvantages: Until full implementation of the new Station 5 is completed utilization of dynamic deployment and risk based responses is not possible. This may result in extended response time for the KLO/Pandosy area. Once the Rescue unit is reestablished at Station 1, the dynamic deployment coverage for this area will be possible. Rescue/Engine is deployed beyond the core area for an interim period. Current Traditional Centralized Support Model Response Capacity: 4 career Stations, 4 Engine Companies, and Rescue Unit of 2 Firefighters and 3 POC Stations. The current MDS is 19. POC staffing is 45. The current traditional model utilizes Station 1 staff to provide support to each of the other Engine Companies located at Stations 2, 3 and 4 along with responses in the 3 POC Stations 7, 8 and 9. Station 1 is staffed with a 4 firefighter Engine Company and a 2 Firefighter Rescue unit. 88 P a g e
89 The Rescue unit provides all FMR responses within Station 1, 7, 8 & 9 areas. POC Stations 7 and 9 co-respond when available for FMRs in their respective areas. Advantages: Cost containment is achieved as there is no increase in service, staff, Stations or equipment. Increased use of dynamic deployment with the Rescue unit to support other stations, including potential to use smaller more mobile vehicles in responding to medical calls. POCs remain a viable and critical support resource. Disadvantages: Does not address identified risks in growing areas, most notably Glenmore/UBCO/YLW and the KLO/Pandosy area. Maintains the traditional service delivery system that is based upon geographic coverage only and considered to be inefficient. Degradation in service delivery is inevitable due to population and construction growth. Requires callback of off duty staff for Marine Rescue calls and single family structure fires. POC attendance cannot be relied upon depending upon the time of day etc. Response times do not align with risk assessment, preferred performance target, or comparative communities. Below is a comparison table that evaluates the current traditional centralized support model with the recommended Station 5 Glenmore/UBCO/YLW Area - Convergent Support Model: Table 23: Strategic Goals Comparison Table Strategic Goals: Criteria Risk based levels of service for all areas of the City Innovative and Non-traditional Current traditional centralized support model No: 2 areas with identified service gaps KLO/Pandosy and Glenmore/UBCO/YLW areas Traditional geographic coverage deployment model Recommended 5 Glenmore/UBCO/YLW Area - Convergent Support Model Yes: addresses identified service gaps with full implementation. Service gap in KLO/Pandosy area not addressed until full staffing of station 5 and then dynamic deployment will be utilized until Station 6 is required. Non-traditional, innovative convergent model. Using PM/DDS technology dynamic and risk based responses integrated with geographic coverage 89 P a g e
90 Realistic and achievable performance targets Alignment with Corporate goals and objectives None formally established. Current response system is 9:31 minutes inside PGB, 14:30 minutes outside PGB. Well beyond comparative communities, industry guidelines and leading practices. Increase risks for public, firefighters and property loss No: Shortfall in Corporate Framework & Plan A well run City A safe City Yes: based upon PM/DDS analytics response system targets will be: 7:40 minutes in 90% inside PGB, 11:40 minutes outside PGB Yes: achieves performance excellence through continuous improvement Provides rapid fire emergency response throughout the City Establishes accountability measures Optional implementation based upon priorities No: Performance targets not monitored corporately at this time. Current system capacity if adopted can be monitored. Not applicable Yes: Performance target objectives will be continuously monitored for achievement or adjustment Yes: part of Corporate annual budget approval process Summary Station 5 is critical given the growth and densification in the Glenmore/UBCO/YLW area and the increase in size of the University. The construction of the new station, which will replace the current Station 8 has been the focus of numerous reports and now has been also supported through the use of PM/DDS analytics. Although growth is occurring in many areas, KFD is committed to maintaining service levels through efficient use of resources, utilizing dynamic deployment and risk based responses within a new convergent support model. The Station 5 incremental staffing approach provides a way of deferring a portion of the ongoing operational costs for 2 years, which will closely coincide with the construction of the new Station by While full staffing of the existing Station 8 (as an interim) until the completion of the new Station 5 is preferred, KFD recognizes the need for constraint and is recommending an incremental approach. KFD supported by modern analytics, the repositioning of the new station and the addition of a staffed Engine/Rescue company will allow the department to enhance the current service levels towards the achievement of recommended performance targets. The use of PM/DDS provides an evidence based approach to address the KLO/Gordon/Pandosy call volume risk by utilizing alternative deployment methods and delaying a new Station 6 until risk and call volume indicates otherwise. The department will also continue to recognize the value of community driven POC members to support the rural areas. KFD continues to be committed to considering ways of reducing or constraining costs. Additional efforts are being made to move 90 P a g e
91 towards smaller, fuel efficient vehicles for calls such as medical or non-emergency public service. The projected response time system performance based upon PM/DDS analytics will be as follows: Glenmore/UBCO/YLW Inside PGB 90 Percentile Outside PGB 90 Percentile Service Gaps Challenges 7:40 minutes 11:40 minutes Until 2019 service gaps will remain in the Glenmore area, and the KLO/Gordon/Pandosy area. Planned growth in the Glenmore area will increase the risk over the interim period when Station 5 is operational. KLO/Gordon/Pandosy Inside PGB 90 Percentile Outside PGB 90 Percentile Service Gaps Challenges 7:40 minutes 11:40 minutes KLO/Gordon/Pandosy area will be managed by dynamic deployment from Station 1 While not a recommended option for station construction or staffing at this time, the KLO Pandosy Corridor should be monitored for increasing incidents and service gap shortfalls as the number of incidents rise utilizing PM/DDS 6.7 FIRST MEDICAL RESPONSE/EMERGENCY MEDICAL RESPONSE The primary objective of the FMR program is to improve the continuity of patient care provided throughout the Province for pre-hospital emergencies. By recognizing that police and fire. The KFD has provided the FMR service since 1989 and today makes up about 66% of the total response call volume. As previously indicated the FMR service is delivered within KFD s basic fire and rescue response capacity requiring no additional staff or emergency vehicles. The costs for the City to participate in the FMR program are incremental for items such as medical supplies, vehicle maintenance, fuel, and occasional OT when responses extend beyond shift change. In 2014 the incremental costs were approximately $72,300 and ongoing participation in the program was 91 P a g e
92 approved by the City Council in 2011 as a low cost, high valued service for the citizens of Kelowna. An analysis conducted in 2014 identified the lives of 10 citizens saved by the KFD and the FMR program. The revision of the BCAS Resource Allocation Plan (RAP) in 2013 that downgraded a number of code 3 responses (lights and sirens on immediate responses) has resulted in delayed responses. These occurrences have been well documented throughout BC including the City. Several BC fire departments (including KFD) have continued to respond to the RAP downgraded code 3 calls in an effort to provide the best possible care for their citizens. In Delta, the Fire Department has enhanced their service level to EMR as a method to enhance pre-hospital care and resolve a perceived service deficiency within BCAS. This move has prompted legal action by BCAS and an ongoing political debate amongst many BC Municipalities. KFD will continue to monitor the trends throughout the Province regarding the FMR program or other related service enhancements. 6.8 CONTRACTED AREA LAKE COUNTRY Since 1997, the City has contracted fire suppression services (including FMR) to the DLC for the northern area of the City Limits. The area covered under this contract includes commercial, industrial and includes approximately 900 living units in modular homes and recreational vehicles on the Okanagan Indian Band (OKIB) Reserve and entirely outside the PGB. The primary response for emergencies occurring in the contracted area is the Lake Country Volunteer Fire Department (LCVFD). Response statistics indicate an average response time of 12:37 minutes. Over the last 3 years the total call volume was 412 responses of which 312 were FMR calls to the OKIB Reserve. In this same period of time there were 5 structure fires. Due to the dated contract/agreement not including any performance measures or service levels, a complete review and audit is required to determine if this arrangement is the most efficient and effective way to deliver fire suppression services. The City pays the DLC approximately $280,000 to provide fire protection and FMR services to this area of the City. In addition, KFD will conduct an analysis utilizing PM/DDS to determine if a KFD response from the existing Station 3 or from the proposed new Station 5 in Glenmore would be operationally adequate rather than contracting LCVFD. RECOMMENDATION 6 That KFD and the City conduct a complete review and audit of the contracted area fire suppression service with the view to establish performance measures for DLC or alternatively determine if KFD can provide an equivalent level of service within the current or proposed performance targets recommendations contained in this report. 6.9 FIRE PREVENTION STAFFING As mentioned earlier in this report, KFD dedicates ¾ of a fire inspector s hours to public education, leaving ¼ of his/her time to conduct fire inspections. This member coordinates KFD public education events and liaises with numerous public service and community groups to deliver fire safety. KFD has made great headway in the area of 92 P a g e
93 public education by partially dedicating a staff member to coordinate and deliver this task. The department has seen the demand and opportunity for public fire education grow each year. Another fire inspector dedicates half of their time to conducting prefire planning of critical buildings and facilities. In order to keep pace with the demand and opportunity to deliver public education and the increase workload of fire inspections and pre-fire planning, an additional fire inspector will be requested in This will enable the Fire Prevention Branch to reorganize and dedicate 1 Full Time Employee (FTE) to public education and pre-fire planning. RECOMMENDATION 7 KFD will monitor the need for 1 additional Fire Inspector. This position would be dedicated to the public education and pre fire planning functions TRAINING & FACILITY The flashover simulator (built in 2008) and burn building (built 2014) training props located at the landfill have proven to be invaluable tools in training firefighters. These facilities provide safe, controlled hands-on fire attack that would cost KFD $65,000 annually on facility rental and wages since training can be conducted on duty rather than sending staff to the North Okanagan Regional District s burn facility in Vernon. KFD currently conducts this live fire training within the day to day operations of the landfill and although it is a good location and is well accommodated by the landfill staff and management, the surrounding area in not an ideal environment since it is close to the public with limited access and uneven ground surface that puts extra wear and tear on equipment. When the burn props were constructed at the landfill, it was understood between KFD and the Landfill staff that the props were portable and able to be moved as required. The challenge, however is that these props are located in close proximity to one of the few hydrants on the site. As operations increase at the Landfill the burn building and flashover simulated will need to be moved. There are several similar sized fire departments in BC that have training centers. They include cities such as Abbotsford, Kamloops, Nanaimo, Salmon Arm and Vernon (RDNO). There are 2 options for the future of the burn props at the landfill: Option 1 (Status Quo): Continue to train on the props as they are currently and move them as operations at the landfill dictate. KFD s day to day operations would continue as normal and fire companies relocated if necessary to cover the city while staff are at the training ground. Option 2 (Permanent Training Facility): Ideally, KFD would have a permanent designated area of 2-3 acres of the property that was fenced for safety and where training props could be located on asphalt and have a fire hydrant close by. It is advantageous to have the training facility in close proximity to a future station to 93 P a g e
94 enable staff to train but remain in the heart of their response zone and continue to be available for service if needed. The future fire training center would have classroom and shower/ locker room facilities for staff. With a training facility as described, there is opportunity to recover some of the operational costs by renting out the training facilities and contracting out the training. Before any recommendation from staff, a separate viability study on contracting out the facility and services and to evaluate the opportunity to increase the Training Branch staff by producing income from renting out the training facility to local agencies. RECOMMENDATION 8 That the opportunity to incorporate a dedicated training center as a potential source of revenue to be included in the planning and funding of the future Station FIRE DISPATCH SERVICES In 2011, the City capitalized on an opportunity to expand fire dispatch service to the RDOS, creating a new revenue stream and demonstrating the ability for dispatch to successfully expand its business model. This expansion, combined with an innovative approach to new business that now includes bylaw, law enforcement, alarm monitoring and after hour call outs. In addition, dispatchers also support additional duties such as: Response map updating Hydrant database maintenance Fire alarm monitoring database maintenance EOC activation requests and ESS notification The result of these expansions has been an increase in marketable skills and proven capacity, with dispatch providing high levels of customer support in a manner that meets each customer s unique needs. Currently, the dispatch centre is managed by KFD, with all assets owned by the City. RDCO provides core funding based on a quarterly remittance. This funding covers dispatcher staff time, training and equipment. The City contributes support to the centre as in-kind in regards to human resources, IS, management oversight (KFD Deputy Chief) and location (no costs are associated with housing the centre). In February of 2014, staff were directed to work with RDCO on a partnership model to better reflect the relationship of the centre to the region overall. It is well recognised the value the centre provides to local responders. This has been demonstrated numerous times, especially during EOC activations to support our local communities in response to wildland interface fires, where communication between site and the EOC is helped during the critical initial phase of activation. 94 P a g e
95 Under a new partnership model, the centre will realize a number of benefits most important of which is the longer term stability of a regional model, equally cost shared by all partners. This will need to recognise all costs of the dispatch centre, including those currently provided in-kind by the City. Further, the process of evaluating the partnership model and the financial needs of the service have identified a lack of capital planning, and under the new model, it would be proposed that an appropriate Capital and Operational Reserve be established to ensure the centre maintains reasonable technology and equipment needed to provide the agreed upon service levels. Although independent dispatch centres may not initially be the lowest cost service delivery model, there are two important considerations to make. First is the functional and operational value of a local dispatch centre, especially given the nature and risks of wildland interface fires and a growing community. Second, the professional standards, high level of customer service and experienced staff will allow the centre to be marketed to new customers, all of which will serve to begin offsetting the costs to each partner, while allowing for potential improvements to staffing levels and equipment. Our current contracts for fire dispatch with RDOS and other specialized services such as alarm monitoring, after hours contact and law enforcement are already set to reduce costs to the partners. Moving forward the goal will be to market the centre to other areas of the province and other potential customers of a 24/7 dispatch centre, including non-fire related agencies. The costs of these services will need to be established within a competitive environment that reflects our actual costs of service provision, but are based on developing a volume of business that allows the partnership to benefit financially. The immediate short term goal for the centre will be the formalization of the partnership model through a formal agreement with the RDCO, including a transparent financial model that reflects true costs and includes an appropriate Capital and Operational Reserve Program. Moving forward, it is recommended that the centre aggressively look for new business opportunities, with a lens for innovation that looks beyond traditional fire dispatch. This growth will need to be methodical and considered to allow for stable levels of service provision, accurate staffing levels and managed financial accountability. RECOMMENDATION 9 That KFD continue to further market dispatch services to both traditional and nontraditional clients, with a focus on managing current costs to the City, while maintaining or enhancing critical service levels. 95 P a g e
96 6.12 COSTS AND BUDGETING SUMMARY Life Cycle Capital Program and Vehicle Equipment Reserve KFD has been working closely with Financial Services in addressing Fire Equipment Replacement Reserve financing requirements. In the 2016 regular budget supplement process, KFD will be requesting an increase in the Fire Equipment Capital Reserve appropriation by $100,000 per year up until the year The current base appropriation to reserve is $400,000 annually. This will increase the reserve appropriation to an annual amount of $800,000 per year thereafter. Based on this amount KFD will have sufficient capital reserves to meet the long-term life cycle requirements for the fleet. On an annual basis, KFD will conduct a review of Fire Equipment Capital Reserve by working with Financial Services and Fleet Services to ensure the contributions are adequate and that the replacement planning is meeting operational requirements. Condition surveys on all KFD units will determine if the life cycle can be altered to create cost efficiencies with the Fire Equipment Capital Reserve Plan. Below are a summary of costs and savings that will occur by implementing the recommendations as presented in this report. A Fire Equipment Capital Reserve Plan showing the replacement schedule for apparatus is shown in Appendix D along with a complete cost estimate schedule of this Strategic Plan up to 2030 for option A and B. Cost Comparison Incremental Staffing Options A and B The cost of implementing option B based on a 14-year average is $3,070,000 per year. Furthermore, the first year cost of option B is $108,124; taking into account any offsetting reductions that will occur. If option A was to be implemented instead of option B, it would cost $38,000 more per year over the same 14-year period. Station 5 Building Costs The final capital costing of a new station, apparatus and equipment, and land acquisition has been estimated in a rough order of magnitude to be $9.1 million. More precise estimates will be determined within the City Infrastructure and Community Planning Departments along with KFD input. Station 5 Apparatus An increase in responding apparatus will be required for the newly constructed Station 5. This will include a replacement Engine and new Bush truck with applicable equipment costing approximately $1,148,000: Engine 5 $828,000 Bush 5 $150,000 Equipment - Engine 5 & Bush 5 $170,000 Total $1,148, P a g e
97 Station 8 Renovation Costs In order to accommodate career staff in the interim and before Station 5 is completed, Station 8 would need to undergo some renovations in the range of $40,000. In addition, additional space will be required and the preferred option is a temporary trailer. The lease of this trailer is estimated to be $27,000 for 4 years. The total interim costs are estimated to be $67,000: Potential Cost Reductions Station 8 Renovations $40,000 Temporary Trailer Rental Fees (4 Years) $27,000 Station 8 Costs $67,000 KFD has analyzed its current processes and has been able to identify a potential for some annual cost savings. By eliminating the DLC contract, reducing staff call backs and implementing some POC cost saving measures, KFD would be able to save a total of $420,000 annually. Reduction of DLC Contract Area $280,000 Reduction of Call Backs $125,000 POC Deployment $15,000 Total Cost Savings $420, P a g e
98 7. SECTION 7 SUMMARY 7.1 APPENDIX A ACRONYMS ADAM AED ATO BCAS BCBC BCERMS BCFC BARB CAD CAO CFAI the City COSAR CPR DLC EHSC EMBC EOC ERF ESS EVO FDM FMR FTE FUS GHG GIS HAZMAT IAFC IAFF IS Apparatus Deployment Analysis Module (PMDDS) Automated External Defibrillator Assistant Training Officer British Columbia Ambulance Service British Columbia Building Code British Columbia Emergency Response System British Columbia Fire Code Box Area Run Card (PMDDS) Computer Aided Dispatch Chief Administration Officer Commission on Fire Accreditation International City of Kelowna Central Okanagan Search and Rescue Cardio Pulmonary Resuscitation District of Lake Country Emergency Health Services Commission Emergency Management British Columbia Emergency Operations Center(RDCO) Effective Response Force Emergency Support Services Emergency Vehicle Operations Fire Department Management System First Medical Responder Full Time Employee Fire Underwriters Survey Green House Gas Geographic Information System Hazardous Materials International Association of Fire Chiefs International Association of Fire fighters Information Services 98 P a g e
99 JIBC KFD LAFC Live MUM MPDS MDS MOTI MVI NFPA OCP OFC OKIB OT PGB PMDDS PPE PREOC POC RAP RFF SEK SME SOG TO RDCO RDOS RIT RMS UBCO UTV WCB Justice Institute of British Columbia Kelowna Fire Department Local Assistant to the Fire Commissioner Live Move Up Module (PMDDS) Medical Priority Dispatch System Minimum Duty Strength Ministry of Transportation and Infrastructure Motor Vehicle Incident National Fire Protection Association Official Community Plan Office of the Fire Commissioner Okanagan Indian Band Overtime Permanent Growth Boundary Predictive Modeling and Dynamic Deployment System Personal Protective Equipment Provincial Regional Emergency Operations Center Paid on Call (Firefighter) Resource Allocation Plan Required Fire Flow South East Kelowna Subject Matter Expert (Fire Service) Standard Operational Guideline Training Officer Regional District of the Central Okanagan Regional District of Okanagan Similkameen Rapid Intervention Team Records Management System University of British Columbia Okanagan Utility Transport Vehicle WorkSafe BC 99 P a g e


100 7.2 APPENDIX B CRITICAL TASK TIME CHARTS 100 P a g e

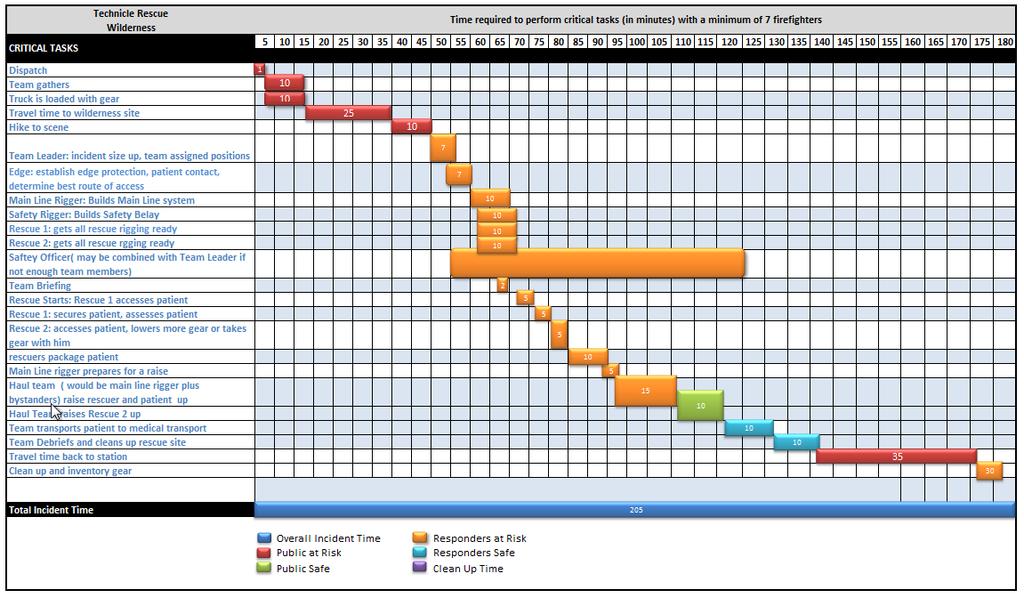
101 101 P a g e

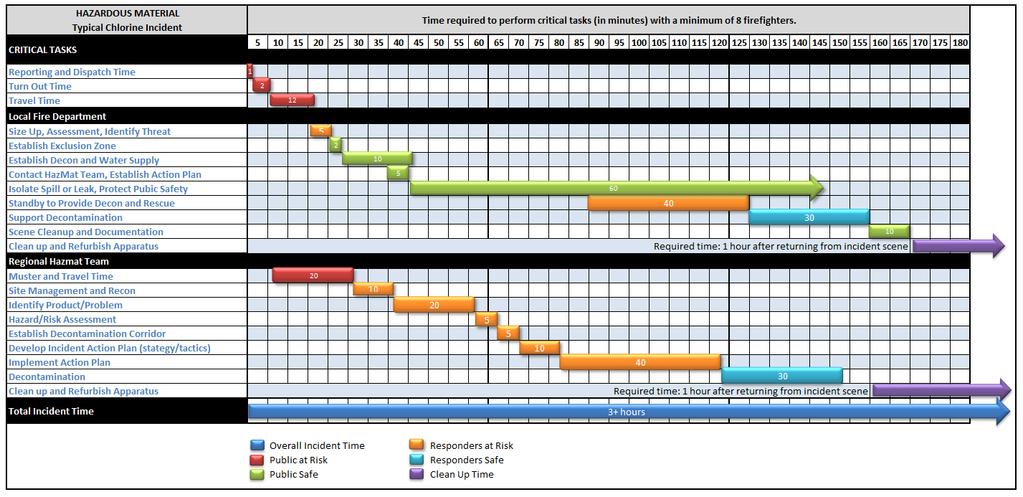
102 102 P a g e

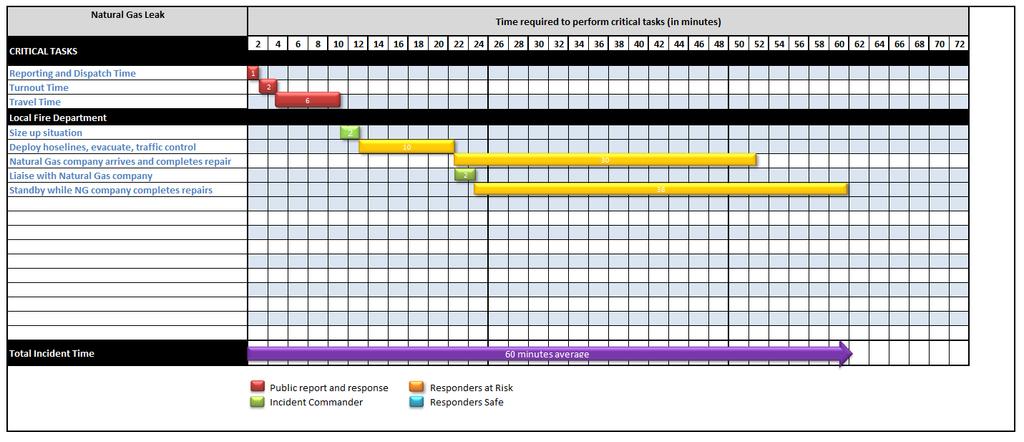
103 103 P a g e

104 7.3 APPENDIX C FUS TABLE OF EFFECTIVE RESPONSE Appendix C FUS Table of Effective Response 104 P a g e
105 7.4 APPENDIX D OPTION A COSTS & CAPITAL REQUIREMENTS KELOWNA FIRE DEPARTMENT Option A Costs Fiscal Years New Stn 5 Facilities Construction Open Stn 5 Station 8 Renovations $40,000 Britco Trailer Rental $6,750 $6,750 $6,750 $6,750 Station 5 - Debt Payments w/interest $180,000 $642,889 $642,889 $642,889 $642,889 $642,889 $642,889 $642,889 $642,889 $642,889 $642,889 $642,889 Station 5 - Maintenance & Utilities Costs $25,000 $25,500 $26,010 $26,530 $27,061 $27,602 $28,154 $28,717 $29,291 $29,877 $30,475 Station 5 - Misc. - Cleaning & Office Supplies $2,500 $2,550 $2,601 $2,653 $2,706 $2,760 $2,815 $2,872 $2,929 $2,988 $3,047 Apparatus Costs Fuel $1,000 $1,020 $1,040 $1,061 $1,082 $1,104 $1,126 $1,149 $1,172 $1,195 $1,219 Repair Parts $4,500 $9,000 $9,180 $9,364 $9,551 $9,742 $9,937 $10,135 $10,338 $10,545 $10,756 Insurance $1,750 $1,785 $1,821 $1,857 $1,894 $1,932 $1,971 $2,010 $2,050 $2,091 $2,133 Labour $2,500 $5,000 $5,100 $5,202 $5,306 $5,412 $5,520 $5,631 $5,743 $5,858 $5,975 Reduction of DLC Contract Area -$280,000 -$280,000 -$280,000 -$280,000 -$280,000 -$280,000 -$280,000 -$280,000 -$280,000 -$280,000 -$280,000 -$280,000 -$280,000 -$280,000 Reduction of Call Backs -$125,000 -$125,000 -$125,000 -$125,000 -$125,000 -$125,000 -$125,000 -$125,000 -$125,000 -$125,000 -$125,000 -$125,000 -$125,000 -$125,000 Reduction in POC Deployment -$15,000 -$15,000 -$15,000 -$15,000 -$15,000 -$15,000 -$15,000 -$15,000 -$15,000 -$15,000 -$15,000 -$15,000 -$15,000 -$15,000 Total $0 -$373,250 -$413,250 -$233,250 $266,889 $267,744 $268,641 $269,556 $270,489 $271,441 $272,413 $273,403 $274,413 $275,444 $276,495 Staffing 12 Career Fire Fighters 8 Career Fire Fighters Suppression - Salaries, $634,326 $1,230,948 $1,821,306 $2,424,016 $2,630,077 $2,800,055 $2,912,461 $2,985,272 $3,059,904 $3,136,401 $3,214,811 $3,295,182 $3,377,561 $3,462,000 Fire Inspector $69,779 $135,313 $138,512 $141,791 $145,151 $148,596 $152,127 $155,746 $159,455 $163,258 $167,155 $171,150 $175,244 Assistant Training Officer $85,794 $168,145 $172,164 $176,284 $180,507 $184,836 $189,273 $193,821 $198,482 $203,260 $208,157 $213,177 Materials, Supplies, etc. $81,790 $16,730 $63,378 $26,387 $26,436 $26,487 $26,539 $27,189 $27,733 $28,287 $28,853 $29,430 $30,019 $30,619 Total $0 $716,116 $1,317,457 $2,105,791 $2,757,059 $2,970,468 $3,147,978 $3,268,103 $3,349,424 $3,432,655 $3,517,965 $3,605,404 $3,695,027 $3,786,887 $3,881,041 Grand Total $0 $342,866 $904,207 $1,872,541 $3,023,948 $3,238,212 $3,416,619 $3,537,659 $3,619,913 $3,704,097 $3,790,377 $3,878,807 $3,969,440 $4,062,331 $4,157,536 $342, $561, $968, $1,151, $214, $178, $121, $82, $84, $86, $88, $90, $92, $95, Total Yearly Tax % Increase^ 0.00% 0.29% 0.45% 0.73% 0.86% 0.14% 0.12% 0.08% 0.05% 0.05% 0.05% 0.05% 0.05% 0.05% 0.05% * Based on estimation only ^Tax % Increase calculated based on each year s incremental change divided by the previous years increases plus the five year tax demand from the Financial Plan, using the 2019 Tax Demand with a 3% increase thereafter. KELOWNA FIRE DEPARTMENT Capital Requirements (excluding interst) Fiscal Years New Stn 5 Facilities Construction Open Stn 5 Building* $7,000,000 Land* $1,000,000 Total $0 $0 $0 $8,000,000 $0 $0 $0 $0 $0 $0 $0 $0 $0 $0 $0 Equipment Engine 5 $828,000 Bush 5 $150,000 Equipment - Engine 5 & Bush 5 $170,000 Total $0 $0 $0 $1,148,000 $0 $0 $0 $0 $0 $0 $0 $0 $0 $0 $0 Cumulative Total $0 $0 $0 $9,148,000 $0 $0 $0 $0 $0 $0 $0 $0 $0 $0 $0 105 P a g e
106 7.4 APPENDIX D OPTION B COSTS & CAPITAL REQUIREMENTS CONT. KELOWNA FIRE DEPARTMENT Option B Costs Fiscal Years New Stn 5 Facilities Construction Open Stn 5 Station 8 Renovations $40,000 Britco Trailer Rental $6,750 $6,750 $6,750 $6,750 Station 5 - Debt Payments w/interest $180,000 $642,889 $642,889 $642,889 $642,889 $642,889 $642,889 $642,889 $642,889 $642,889 $642,889 $642,889 Station 5 - Maintenance & Utilities Costs $25,000 $25,500 $26,010 $26,530 $27,061 $27,602 $28,154 $28,717 $29,291 $29,877 $30,475 Station 5 - Misc. - Cleaning & Office Supplies $2,500 $2,550 $2,601 $2,653 $2,706 $2,760 $2,815 $2,872 $2,929 $2,988 $3,047 Apparatus Costs Fuel $1,000 $1,020 $1,040 $1,061 $1,082 $1,104 $1,126 $1,149 $1,172 $1,195 $1,219 Repair Parts $4,500 $9,000 $9,180 $9,364 $9,551 $9,742 $9,937 $10,135 $10,338 $10,545 $10,756 Insurance $1,750 $1,785 $1,821 $1,857 $1,894 $1,932 $1,971 $2,010 $2,050 $2,091 $2,133 Labour $2,500 $5,000 $5,100 $5,202 $5,306 $5,412 $5,520 $5,631 $5,743 $5,858 $5,975 Reduction of DLC Contract Area -$280,000 -$280,000 -$280,000 -$280,000 -$280,000 -$280,000 -$280,000 -$280,000 -$280,000 -$280,000 -$280,000 -$280,000 -$280,000 -$280,000 Reduction of Call Backs -$125,000 -$125,000 -$125,000 -$125,000 -$125,000 -$125,000 -$125,000 -$125,000 -$125,000 -$125,000 -$125,000 -$125,000 -$125,000 -$125,000 Reduction in POC Deployment -$15,000 -$15,000 -$15,000 -$15,000 -$15,000 -$15,000 -$15,000 -$15,000 -$15,000 -$15,000 -$15,000 -$15,000 -$15,000 -$15,000 Total $0 -$373,250 -$413,250 -$233,250 $266,889 $267,744 $268,641 $269,556 $270,489 $271,441 $272,413 $273,403 $274,413 $275,444 $276,495 8 Career Fire 4 Career Fire 8 Career Fire Staffing Fighters Fighters Fighters Suppression - Salaries, $422,884 $1,034,955 $1,777,466 $2,372,661 $2,608,144 $2,800,055 $2,912,461 $2,985,272 $3,059,904 $3,136,401 $3,214,811 $3,295,182 $3,377,561 $3,462,000 Fire Inspector $69,779 $135,313 $138,512 $141,791 $145,151 $148,596 $152,127 $155,746 $159,455 $163,258 $167,155 $171,150 $175,244 Assistant Training Officer $85,794 $168,145 $172,164 $176,284 $180,507 $184,836 $189,273 $193,821 $198,482 $203,260 $208,157 $213,177 Materials, Supplies, etc. $58,490 $35,250 $63,378 $26,387 $26,436 $26,487 $26,539 $27,189 $27,733 $28,287 $28,853 $29,430 $30,019 $30,619 Total $0 $481,374 $1,139,984 $2,061,952 $2,705,705 $2,948,535 $3,147,978 $3,268,103 $3,349,424 $3,432,655 $3,517,965 $3,605,404 $3,695,027 $3,786,887 $3,881,041 Grand Total $0 $108,124 $726,734 $1,828,702 $2,972,594 $3,216,279 $3,416,619 $3,537,659 $3,619,913 $3,704,097 $3,790,377 $3,878,807 $3,969,440 $4,062,331 $4,157,536 $108, $618, $1,101, $1,143, $243, $200, $121, $82, $84, $86, $88, $90, $92, $95, Total Yearly Tax % Increase^ 0.00% 0.09% 0.49% 0.84% 0.85% 0.16% 0.13% 0.08% 0.05% 0.05% 0.05% 0.05% 0.05% 0.05% 0.05% * Based on estimation only ^Tax % Increase calculated based on each year s incremental change divided by the previous years increases plus the five year tax demand from the Financial Plan, using the 2019 Tax Demand with a 3% increase thereafter. KELOWNA FIRE DEPARTMENT Capital Requirements (excluding interst) Fiscal Years New Stn 5 Facilities Construction Open Stn 5 Building* $7,000,000 Land* $1,000,000 Total $0 $0 $0 $8,000,000 $0 $0 $0 $0 $0 $0 $0 $0 $0 $0 $0 Equipment Engine 5 $828,000 Bush 5 $150,000 Equipment - Engine 5 & Bush 5 $170,000 Total $0 $0 $0 $1,148,000 $0 $0 $0 $0 $0 $0 $0 $0 $0 $0 $0 Cumulative Total $0 $0 $0 $9,148,000 $0 $0 $0 $0 $0 $0 $0 $0 $0 $0 $0 106 P a g e
107 KELOWNA FIRE DEPARTMENT Fire Equipment Capital Reserve Plan As of October 27, 2015 Replacement Cost (w/ inflation factor) Appropriation from Reserve (Payment Year) Contribution to Reserve Interest Reserve Balance $1,507, Rescue 1 $706, Engine 2 $780,000 $400,000 $45,213 $1,952,329 ATV w/trailer Taxation Bush Truck 4 $140,454 -$1,766,908 $500,000 $58,570 $743,991 Bush Truck 7 $140,454 Engine 4 $810,000 Engine 7 $530, Tender 4 $324,730 -$1,340,604 $600,000 $22,320 $25, No Purchase $0 -$324,730 $700,000 $771 $401, Tender 1 $337,849 $0 $800,000 $12,052 $1,213, Engine 3 $804,080 -$337,849 $800,000 $36,414 $1,712, Engine 8 ~ $585,830 -$804,080 $800,000 $51,371 $1,759, Bush Truck 3 $158,174 -$744,004 $800,000 $52,790 $1,868,443 Engine 1 $896,319 Ladder 2 $1,075, No Purchase $0 -$1,971,903 $800,000 $56,053 $752, No Purchase $0 $0 $800,000 $22,578 $1,575, No Purchase $0 $0 $800,000 $47,255 $2,422, No Purchase $0 $0 $800,000 $72,673 $3,295, Rescue 1 $931,552 $0 $800,000 $98,853 $4,193,952 Engine 2 $923,635 Engine 4 $923, Bush Truck 1 $178,130 -$2,956,952 $800,000 $125,819 $2,162, Engine 5 $1,029,589 $800,000 $64,885 $3,027,703 Engine 9 $686, ATV $30,201 -$1,746,183 $800,000 $90,831 $2,172, Bush Truck 4 $189,033 -$378,065 $800,000 $65,171 $2,659,457 Bush Truck 7 $189, Bush Truck 5 $192,813 -$192,813 $800,000 $79,784 $3,346,427 Engine 3 $1,019, Engine 7 $742,974 -$1,019,768 $800,000 $100,393 $3,227, Engine 7 $1,136,750 -$742,974 $800,000 $96,812 $3,380,889 Ladder 1 $1,818, No Purchase $0 -$2,955,550 $800,000 $101,427 $1,326,766 * Actual purchase of apparatus (excluding bush truck) occurs 1 year after RFP. + Based on City of Kelowna policies any new equipment purchased comes from taxation. ~ May not be needed. Included in the value of the apparatus is a 2% Inflation rate compounded annually. Costs may flucuate based on US exchage rates. 107 P a g e
108 7.5 APPENDIX E COMPARATIVE COMMUNITY RESPONSE TIME ANALYSIS Municipality or City 90 th Percentile Travel Time Only 90 th Percentile Travel Time and Turnout (Response Time) Average Travel Time: Wheels Turning to Wheels Stopping on Scene Average Travel and Turnout Time (Response Time) Formally Approved/Supp orted by Council (Yes or No) Surrey (Medical) 6:25 mins 7:53 mins 4:05 mins 5.23 mins No Surrey (Fire) 6:08 mins 7:35 mins 3:50 mins 5:10 mins No Vancouver (Fire) 4:24 mins 6:22 mins 2:46 mins 4:34 mins No Vancouver 4:26 mins 6:16 mins 2:53 mins 4:28 mins No (Medical) Cranbrook 7 mins 9 mins Kitmat 6 mins 9 mins Nelson Not measuring at this time Port Alberni 5:15 mins 6:07 mins 3:01 mins 3.90 mins Support not approved Pitt Meadows 12 mins Rural 9 mins Urban Chilliwack 12 mins 108 P a g e
109 Municipality or City 90 th Percentile Travel Time Only 90 th Percentile Travel Time and Turnout (Response Time) Average Travel Time: Wheels Turning to Wheels Stopping on Scene Average Travel and Turnout Time (Response Time) Formally Approved/Supp orted by Council (Yes or No) Langley 8 mins Poco 5 mins 6 mins Saanich 8 mins 80% Nanaimo 4 mins 5 mins 83% Campbell River 5 mins/8mins New Westminster 4 mins 5 mins 90% 90% Abbotsford 4 mins 11mins 80% POC 5 mins Abbotsford (12 staff) 9 mins 10 mins Richmond 4 mins 5mins 7:28mins 90% 9:21 mins 90% Mission 7 mins 9 mins Kelowna 7:30mins 9:30 mins 5:22 mins 7:11 mins No Kamloops (Urban) 1st Engine in 7 minutes 90% 1st alarm (14 staff) in 12 minutes 90% 109 P a g e
110 Municipality or City 90 th Percentile Travel Time Only 90 th Percentile Travel Time and Turnout (Response Time) Average Travel Time: Wheels Turning to Wheels Stopping on Scene Average Travel and Turnout Time (Response Time) Formally Approved/Supp orted by Council (Yes or No) Kamloops (Rural) 1st Engine in 14 min. 1st alarm (10 staff) in 14 minutes 80% Coquitlam 1 st unit in 6 minutes 90% Prince Geo. Plan to have a standard at end of 2015 Delta Objective is to meet NFPA P a g e
111 7.6 APPENDIX F AGRICULTURAL LAND COMMISSION DECISION 111 P a g e
112 112 P a g e
113 113 P a g e
114 114 P a g e

115 115 P a g e

116 116 P a g e

117 117 P a g e

118 118 P a g e

119 119 P a g e

120 120 P a g e

121 121 P a g e

122 122 P a g e
Branch Fire Rescue Services
 Branch Fire Rescue Services Introduction Through the protection of life, property and the environment, Fire Rescue Services strives to improve the livability of all Edmontonians. The provision of internationally-recognized
SIOUX FALLS FIRE RESCUE STRATEGIC PLAN
 SIOUX FALLS FIRE RESCUE The mission of Sioux Falls Fire Rescue is to protect the citizens and visitors of Sioux Falls and their property from fires and other emergencies through education, prevention,
Branch Fire Rescue Services
 Introduction Fire Rescue Services serves to protect the lives, properties and environment of citizens within our community by providing excellence in services and public safety. Edmonton Fire Rescue Services
2013 Compliance Report RCW 52.33
 2013 Compliance Report RCW 52.33 Revised Code of Washington (RCW) 52.33 requires substantially career fire protection districts to declare their department as established and set performance standards
NFPA Self Assessment Manual
 NFPA 1720 Self Assessment Manual Standard for the Organization and Deployment of Fire Suppression, Emergency Medical Operations, and Special Operations to the Public by Volunteer Fire Departments 2014
PUBLIC SAFETY Nanaimo Fire Rescue 2019 Business Plan
 PUBLIC SAFETY OVERVIEW (NFR) provides emergency response to fires, medical and rescue incidents, natural disasters, and provides specialized services such as hazardous materials and technical rescue response.
A Strategic Plan By Steamboat Springs Fire Rescue September 2018
 A Strategic Plan By Steamboat Springs Fire Rescue September 2018 1 Table of Contents Contents Mission, Vision and Values... 3 Introduction... 4 Current Status of Steamboat Springs Fire Rescue... 5 Strategic
Service Business Plan
 Service Business Plan Service Name Emergency Response Service Type Public Service Owner Name Ross Monteith Year 2018 Service Owner Title Service Description Deputy Fire Chief A public service responsible
Pebble Beach Community Services District Fire Department 3101 Forest Lake Road, Pebble Beach, CA
 Pebble Beach Community Services District Fire Department 3101 Forest Lake Road, Pebble Beach, CA. 93953 Staff Report October 27, 2006 To: From: Board of Directors George Haines, Fire Chief Subject: PBCSD
SECTION ONE: INTRODUCTION. introduction
 introduction 1 INTRODUCTION Since it was first established in 1843 as a trading post for the Hudson s Bay Company, Victoria has evolved into a Provincial capital city that is recognized across Canada and
Community Development and Recreation Committee
 STAFF REPORT ACTION REQUIRED Results of the Fire Insurance Grades Study Date: November 20, 2013 To: From: Wards: Reference Number: Community Development and Recreation Committee Fire Chief and General
FIRE & RESCUE SERVICES
 Operating Budget: $1,472,400 Capital Budget: $334,000 Staffing Complement: 6.0 FTE (Full-time equivalent) Supports Strategic Focus Areas: OVERVIEW Corporate Excellence and Community Livability Fire and
FIRE DEPARTMENT FIRE CHIEF. Deputy Fire Chief Operations Section. Assistant Fire Chief Planning & Budget Section
 FIRE DEPARTMENT FIRE CHIEF Deputy Fire Chief Operations Section Battalion Chiefs A-1, A-2, B-1, B-2, C-1, C-2 Risk Management Supervisor Training Group Support Staff Supervisor Assistant Fire Chief Logistics
Fire Chief: Jeff L. Hogan
 Fire Chief: Jeff L. Hogan Deputy Fire Chief: Pat O Neill Assistant Fire Chief: Chris Coons Executive Summary The Johns Creek Fire Department has conducted research and various studies to determine the
FIRE AND RESCUE. Intent
 FIRE AND RESCUE Intent The Fire and Rescue Plan is designed to maintain Prince William County as a safe community, reducing loss of life, injury, and property from fire and/or accident. The mission of
CAMDEN COUNTY FIRE COORDINATOR
 SECTION OPERATIONS EFFECTIVE REVISED 02-20-19 SOG 3-1 CAMDEN COUNTY FIRE COORDINATOR Purpose To establish an appointment protocol for the Camden County Fire Coordinator, and Deputy Camden County Fire Coordinator
 KELOWNA FIRE DEPARTMENT 1. Executive Summary EXECUTIVE SUMMARY 1.1 Executive Summary The Fire Service is a critical component of the public safety system. Fire Departments do much more than fight fires.
SAN JOSE FIRE FIGHTERS
 International Association of Fire Fighters, Local 230 August, 2016 Introduction Sean Lovens Communications Director Willow Glen Community SJFD History 2008-2016 Current Staffing Levels Proposed Station
Thomasville fire rescue
 Thomasville Fire Rescue Firefighter Professional Qualifications 2014 Thomasville fire rescue As part of our overall mission, the fire department continually strives to improve structural fire protection
Executive Summary. Parks and Recreation Plan. Executive Summary
 Parks and Recreation Plan Executive Summary The Whitemarsh Township Parks and Recreation Plan sets forth a vision for how Whitemarsh Township can provide a premiere parks and recreation system reflective
Township of North Kawartha. Report to Council Emergency Services Department
 Township of North Kawartha Report to Council Emergency Services Department To: Mayor and Council Members Date: November 11, 2016 Author: Jesse Lambe, Fire Chief and Martin McRae Deputy Fire Chief Subject:
Canadian Association of Fire Chiefs Steve Thurlow Dillon Consulting Limited. September 21, 2015
 Canadian Association of Fire Chiefs Steve Thurlow Dillon Consulting Limited September 21, 2015 2 About Dillon Today s Objectives Industry Trends Three Lines of Defence Fire Behaviour Fire Risk Assessment
Town of Oakville Streetscape Strategy
 Town of Oakville Streetscape Strategy Endorsed by PDC on February 10, 2014 (PD-011-14) Town of Oakville Streetscape Strategy [endorsed by PDC February 10, 2014] 0 Town of Oakville Streetscape Strategy
Official Plan Review
 Official Plan Review Summary Report - The Built Environment August 2014 Part 1: Introduction Planning for a healthy, prosperous and sustainable community is an important goal for our municipality. From
3. VISION AND GOALS. Vision Statement. Goals, Objectives and Policies
 Vision Statement Queen Creek s interconnected network of parks, trails, open spaces and recreation opportunities provide safe and diverse activities and programs that sustain its unique, small town, equestrian
SAGINAW FIRE DEPARTMENT SAFER
 SAGINAW FIRE DEPARTMENT SAFER Staffing for Adequate Fire and Emergency Services A FEMA, Department of Homeland Security Program Current SAFER Funding Grant award of $2,317,587 15 fire fighter positions
COMMUNITY WILDFIRE PROTECTION PLAN POWELL RIVER REGIONAL DISTRICT
 COMMUNITY WILDFIRE PROTECTION PLAN POWELL RIVER REGIONAL DISTRICT OUTLINE Introduction/Background Information CWPP Planning Structure Brief Overview of the WRMS Results Recommendations/Action Plan INTRODUCTION
Vancouver. Title of the Initiative. Initiative Duration. Submitted by. Comments by the Jury
 134 Vancouver Title of the Initiative Initiative Duration Submitted by Comments by the Jury Visionary Vancouver: Creating a Welcoming and Sustainable Place for All 2009-2020 Wendy Au, Deputy City Manager,
Concord Community Reuse Project Goals and Guiding Principles. Overarching Goals (OG)
") Concord Community Reuse Project Goals and Guiding Principles Overarching Goals (OG) No priority is implied by the order of presentation of the goals and guiding principles. Overarching goals for the Concord
Concord Community Reuse Project Goals and Guiding Principles Overarching Goals (OG) No priority is implied by the order of presentation of the goals and guiding principles. Overarching goals for the Concord
A BLUEPRINT FOR BROCKTON A CITY-WIDE COMPREHENSIVE PLAN
 A BLUEPRINT FOR BROCKTON A CITY-WIDE COMPREHENSIVE PLAN Public Meeting October 2016 1 Plan Summary and Discussion Public Meeting May 4 2017 City of Brockton Bill Carpenter, Mayor Department of Planning
2017 Annual Report. King County Fire District No. 27 Fall City, WA
 2017 Annual Report King County Fire District No. 27 Fall City, WA Foreword Beginning in 2006, the District began collecting the detailed data elements necessary to develop and publish an annual report
13 Extending the Esri Enterprise Licence Agreement
 Clause 13 in Report No. 10 of Committee of the Whole was adopted, without amendment, by the Council of The Regional Municipality of York at its meeting held on May 21, 2015. 13 Extending the Esri Enterprise
BUSINESS PLAN: Fire Prevention & Education
 BUSINESS PLAN: Fire Prevention & Education How does this service contribute to the results identified in the City of London Strategic Plan? A strong economy A vibrant and diverse community A green and
CHAPTER 1 Introduction
 CHAPTER 1 Introduction From sea to summit, Lane County covers almost 4,800 square miles of diverse Oregon landscape. Stretching from the Pacific Ocean through the Coastal Range, the Willamette Valley to
NATIONAL FIRE PROTECTION ASSOCIATION Fourth Survey of the Needs of the U. S. Fire Service
 NATIONAL FIRE PROTECTION ASSOCIATION Fourth Survey of the Needs of the U. S. Fire Service MAKE IT EASY Complete the Survey Online www.nfpa.org/2015needsassessment **NFPA FDID top left corner** **PASSWORD
CENTRAL YORK FIRE SERVICES 2009 Annual Report PROUDLY PROTECTING THE COMMUNITIES OF AURORA AND NEWMARKET
 CENTRAL YORK FIRE SERVICES 2009 Annual Report PROUDLY PROTECTING THE COMMUNITIES OF AURORA AND NEWMARKET Report 2010-07 Established January 1, 2002 1 2010 SENIOR OFFICERS Robert Comeau Ian Laing Paul Leslie
MAYFIELD WEST SECONDARY PLAN PHASE 2
 MAYFIELD WEST SECONDARY PLAN PHASE 2 Public Open House #3 February 25, 2010 Draft Preferred Land Use Scenario TOWN OF CALEDON PLANNING & DEVELOPMENT DEPARTMENT Open House Agenda TOWN OF CALEDON 1. Welcome
TORONTO DISTRICT SCHOOL BOARD SCHOOLS WITHIN MIXED USE BUILDINGS: COMMERCIAL AND CONDOMINIUM BUILDINGS. Planning and Priorities Committee
 23 Report No. 15-05-2615 TORONTO DISTRICT SCHOOL BOARD SCHOOLS WITHIN MIXED USE BUILDINGS: COMMERCIAL AND CONDOMINIUM BUILDINGS TO Planning and Priorities Committee 10 June 2015 RECOMMENDATION IT IS RECOMMENDED
MATRIX TO DETERMINE YOUR PRESENT POSITION IN MEETING N.F.P.A. 1720
 MATRIX TO DETERMINE YOUR PRESENT POSITION IN MEETING N.F.P.A. 1720 Standard for the Organization and Deployment of Fire Suppression Operations, Emergency Medical Operations, and Special Operations to the
CITY CLERK. Parkland Acquisition Strategic Directions Report (All Wards)
") CITY CLERK Clause embodied in Report No. 10 of the, as adopted by the Council of the City of Toronto at its meeting held on November 6, 7 and 8, 2001. 10 Parkland Acquisition Strategic Directions Report
CITY CLERK Clause embodied in Report No. 10 of the, as adopted by the Council of the City of Toronto at its meeting held on November 6, 7 and 8, 2001. 10 Parkland Acquisition Strategic Directions Report
6 Growth Management Challenges and Opportunities
 6 Growth Management Challenges and Opportunities The Town has established a goal of attaining a 50% participation rate with respect to employment opportunities versus residential population. The Town s
Living in Albemarle County s Urban Places
 Living in Albemarle County s Urban Places ALBEMARLE COUNTY, VIRGINIA A Closer Look at Albemarle s Approach to Managing Growth and Creating Quality Urban Environments www.albemarle.org Page 2 Living in
Annual Report Components
 Published on MTAS (http://www.mtas.tennessee.edu) April 14, 2019 Dear Reader: The following document was created from the MTAS website (mtas.tennessee.edu). This website is maintained daily by MTAS staff
implementation r expression in landscape
 6 ubc okanagan implementation campus plan r expression in landscape 68 6 implementation campus plan sections The Campus Plan supports the academic mission, values and commitments of the University by providing
DEPARTMENT SUMMARY. Personnel Services $ 7,780,971 $ 7,989,600 $ 7,707,680 $ 8,231,680. Operating Expenses 835, , , ,870
 Expenditures DEPARTMENT SUMMARY FIRE Personnel Services $ 7,780,971 $ 7,989,600 $ 7,707,680 $ 8,231,680 Operating Expenses 835,509 844,902 837,460 857,870 Recovered Costs (389,049) (399,480) (385,380)
REQUIREMENTS. For FIRE DEPARTMENTS. State of West Virginia. Bob Wise Governor THE DEPARTMENT OF MILITARY AFFAIRS AND PUBLIC SAFETY
 REQUIREMENTS For FIRE DEPARTMENTS State of West Virginia Bob Wise Governor THE DEPARTMENT OF MILITARY AFFAIRS AND PUBLIC SAFETY Joe Martin Secretary West Virginia State Fire Commission 1207 Quarrier St.,
Official Plan Review: Draft Built Form Policies
 PG.30.1 REPORT FOR ACTION Official Plan Review: Draft Built Form Policies Date: May 15, 2018 To: Planning and Growth Management Committee From: Chief Planner and Executive Director, City Planning Division
Town of Whitby By-law #
 Town of Whitby By-law # 7263-17 Fire Department Establishing and Regulating By-law Being a By-law to Establish and Regulate the Fire Department, and to Repeal By-law # s. 4202-98, 6078-08 and 6834-14.
Published in March 2005 by the. Ministry for the Environment. PO Box , Wellington, New Zealand ISBN: X.
 Action Pack Published in March 2005 by the Ministry for the Environment Manatū Mō Te Taiao PO Box 10-362, Wellington, New Zealand ISBN: 0-478-18994-X ME number: 580 This document is available on the Ministry
Parks Master Plan Implementation: Phase I Waterfront Use and Design REPORT #: September 7, 2016 File #
 0 'O DI Lan-171-14 1 - THE CORPORATION OF THE TOWN OF COBOURG..,. STAFF REPORT TO: FROM: Mayor and Members of Council Dean A. Hustwick, Director of Recreation and Culture DATE OF MEETING: Committee of
SUBJECT: Waterfront Hotel Planning Study Update TO: Planning and Development Committee FROM: Department of City Building. Recommendation: Purpose:
 Page 1 of Report PB-23-18 SUBJECT: Waterfront Hotel Planning Study Update TO: Planning and Development Committee FROM: Department of City Building Report Number: PB-23-18 Wards Affected: 2 File Numbers:
SAN RAFAEL GENERAL PLAN 2040 INTRODUCTION AND OVERVIEW
 SAN RAFAEL GENERAL PLAN 2040 INTRODUCTION AND OVERVIEW Steering Committee Presentation February 14, 2018 Purpose of General Plan Guide land use and development decisions Coordinate transportation, infrastructure,
1.0 Purpose of a Secondary Plan for the Masonville Transit Village
 Report to Planning and Environment Committee To: Chair and Members Planning & Environment Committee From: John M. Fleming Managing Director, Planning and City Planner Subject: Masonville Transit Village
A Growing Community Rural Settlement Areas
 Town of Huntsville Official Plan Review - POLICY BACKGROUND PAPER A Growing Community Rural Settlement Areas BACKGROUND: In addition to the fully municipally-serviced Urban Settlement Area and the Hidden
CITY OF COLWICH COMPREHENSIVE PLAN LAND USE LAND USE 1
 LAND USE LAND USE 1 WHAT YOU WILL FIND IN THIS CHAPTER: Discussion of today s conditions and tomorrow s projections Discussion of challenges and opportunities Discussion of the environmental quality goals,
PSRC REVIEW REPORT & CERTIFICATION RECOMMENDATION
 PSRC REVIEW REPORT & CERTIFICATION RECOMMENDATION KITSAP COUNTY COUNTYWIDE PLANNING POLICIES July 2, 2012 BACKGROUND A major emphasis of the Washington State Growth Management Act (GMA) is the need to
BERKELEY FIRE DEPARTMENT (141 FTE)
") BERKELEY FIRE DEPARTMENT (141 FTE) The men and women of the Berkeley Fire Department are committed to providing comprehensive fire protection, emergency medical, disaster preparedness, rescue and other
BERKELEY FIRE DEPARTMENT (141 FTE) The men and women of the Berkeley Fire Department are committed to providing comprehensive fire protection, emergency medical, disaster preparedness, rescue and other
Fire FY Performance Plan
 I. Mission Statement In partnership with our community, we will; Be prepared Respond quickly Solve problems Be nice Get home safely Fire II. Department Overview The Marin County Fire Department was established
Implementation Guide Comprehensive Plan City of Allen
 Implementation Guide 2030 Comprehensive Plan City of Allen DRAFT 2015 Implementation Guide Allen 2030 Comprehensive Plan INTRODUCTION The Comprehensive Plan serves as a guide for the growth and development
Comprehensive Plan ADOPTED APRIL 2014
 Comprehensive Plan ADOPTED APRIL 2014 8 8. Outstanding Recreational & Cultural Opportunities We are proud of our community s parks and recreation system. Our community will ensure that the legacy of our
Richard H. Bradley Board of Directors Meeting April 25, A 21st Century Sustainability Framework
 Richard H. Bradley Board of Directors Meeting April 25, 2011 A 21st Century Sustainability Framework October 18, 2011 What is the DowntownDC BID? BID History Established in 1998 as Washington DC came out
Public Open House. Overview of the Downtown Plan Official Plan Amendment April 23, 2018
 Public Open House Overview of the Downtown Plan Official Plan Amendment April 23, 2018 1 A 25-Year Plan for Downtown To ensure growth contributes positively to Toronto s Downtown as a great place to live,
The Corporation of the Town of Milton
 Report To: From: Council Barbara Koopmans, Commissioner, Planning and Development Date: May 7, 2018 Report No: Subject: Making it Possible Positioning the Town s Strategy for Growth and Economic Development
City of Mississauga. Fire and Emergency Services. Business Plan Update
 Fire and Emergency Services Business Plan City of Mississauga 2012-2014 Update Last year the City of Mississauga undertook an extensive process to create a four year, 20111 through 2014, detailed Business
SUMMARY. An Attractive, Competitive and Sustainable GREATER MONTREAL. Draft Metropolitan Land Use and Development Plan. April 2011
 April 2011 Draft Metropolitan Land Use and Development Plan GREATER MONTREAL An Attractive, Competitive and Sustainable SUMMARY Message from the Chair I am pleased to introduce this draft of the Metropolitan
South Stormont Fire & Rescue (SSFR) Road to a Fire Master Plan
 Road to a Fire Master Plan") South Stormont Fire & Rescue () Road to a Fire Master Plan Where We Are Fire Station 1 Long Sault Fire Station 2 Ingleside Four Stations One Department Fire Station 3 Newington Fire Station 4 St. Andrews
South Stormont Fire & Rescue () Road to a Fire Master Plan Where We Are Fire Station 1 Long Sault Fire Station 2 Ingleside Four Stations One Department Fire Station 3 Newington Fire Station 4 St. Andrews
4.13 Security and System Safety
 4.13 4.13.1 Introduction This section describes the affected environment and environmental consequences related to security and system safety from operations of the NEPA Alternatives. Information regarding
EXECUTIVE SUMMARY. Lyle Sumek Associates, Inc. Phone (407) St, Edmunds Place Fax (407)
 St, Edmunds Place Fax (407)") EXECUTIVE SUMMARY Lyle Sumek Associates, Inc. Phone (407) 771-4195 1514 St, Edmunds Place Fax (407) 771-4197 Heathrow, FL 32746 E-mail: sumekassoc@cfl.rr.com Table of Contents EXECUTIVE SUMMARY Strategic
EXECUTIVE SUMMARY Lyle Sumek Associates, Inc. Phone (407) 771-4195 1514 St, Edmunds Place Fax (407) 771-4197 Heathrow, FL 32746 E-mail: sumekassoc@cfl.rr.com Table of Contents EXECUTIVE SUMMARY Strategic
The City of Edmonton. Fire Rescue Service. Fire Rescue Service Review & Recommendations 2005
 2006CSF001 Attachment 2 Business solutions through information technology TM The City of Edmonton Fire Rescue Service Fire Rescue Service Review & Recommendations 2005 FIREUNDERWRITERS SURVEY A SERVICE
1 Introduction. Chapter. In this chapter:
 Chapter 1 Introduction In this chapter: 1.1 A Snapshot of the Region 1.2 Towards a Sustainable Region 1.3 The Provincial Context 1.4 Purpose and Organization The Regional Municipality of York Official
THE TOWN OF WASAGA BEACH
 THE TOWN OF WASAGA BEACH Downtown Development Master Plan Committee of the Whole Presentation January 26 th 2017 Uses within this designation should reflect a dependence on tourism as opposed to the permanent
Beatties Ford Road & Mt. Holly-Huntersville Road Small Area Plan
 Beatties Ford Road & Mt. Holly-Huntersville Road Small Area Plan Town of Huntersville October 2005 Town of Huntersville Planning Department 101 Huntersville Concord Road Post Office Box 664 Huntersville,
Executive Summary and Introduction
 Section I Executive Summary and Introduction Introduction Purpose and Implementation Vision Themes and Strategies Description of Plan Methodology and Approach History of Comprehensive Planning Page 1 of
CITY COUNCIL AGENDA REPORT
 CITY COUNCIL AGENDA REPORT Subject: COUNCIL MOTION LRT ALIGNMENT REMOVAL FROM THE TRANSPORTATION MASTER PLAN On February 10, 2016 Councillor Hughes provided notice in accordance with Section 23 of Procedure
Municipality of Clarington Fire Master Plan Final Report
 Municipality of Clarington Final Report February 2014 Prepared By: Dillon Consulting Limited Final Report February 2014 EXECUTIVE SUMMARY This Municipality of Clarington (FMP) has been developed to provide
CITY OF OWENSBORO OWENSBORO FIRE DEPARTMENT DEPLOYMENT ANALYSIS
 CITY OF OWENSBORO OWENSBORO FIRE DEPARTMENT DEPLOYMENT ANALYSIS 1 #3 #1 #2 TC #4 #5 2 DEPLOYMENT Apparatus and Companies 3 Response Time Definitions Total Response Time (Research Definition) The time from
Performance and Cost Data. fire services
 Performance and Cost Data fire services 195 PERFORMANCE MEASURES FOR FIRE SERVICES SERVICE DEFINITION Fire Services refers to the activities and programs relating to the prevention and suppression of fires,
Plano Tomorrow Vision and Policies
 Plano Tomorrow Vision and Policies PLANO TOMORROW PILLARS The Built Environment The Social Environment The Natural Environment The Economic Environment Land Use and Urban Design Transportation Housing
CITY OF VAUGHAN EXTRACT FROM COUNCIL MEETING MINUTES OF NOVEMBER 15, 2016
 Item 11, Report No. 38, of the Committee of the Whole, which was adopted without amendment by the Council of the City of Vaughan on November 15, 2016. Regional Councillor Di Biase declared an interest
THE GARDEN CITY PLAN. City of St. Catharines Official Plan. City of St. Catharines
 THE GARDEN CITY PLAN City of St. Catharines Official Plan City of St. Catharines August 2010 APPROVAL INFORMATION This Official Plan of the City of St. Catharines Planning Area, known as the Garden City
STAFF REPORT SAUSALITO CITY COUNCIL
 STAFF REPORT SAUSALITO CITY COUNCIL MEETING DATE: January 8, 2019 AGENDA TITLE: LEAD DEPARTMENT: Southern Marin Fire District Lessons Learned Update Report Southern Marin Fire District, Fire Chief Chris
4 ESF 4 Firefighting
 4 ESF 4 Firefighting THIS PAGE LEFT BLANK INTENTIONALLY ESF 4 Firefighting Table of Contents 1 Purpose and Scope... ESF 4-1 2 Policies and Agreements... ESF 4-1 3 Situation and Assumptions... ESF 4-2 3.1
Addressing Myths Often Generated By Private EMS Providers
 Addressing Myths Often Generated By Private EMS Providers Private EMS, and specifically ambulance service providers, continue to make proposals to Metro and medium size cities to replace the local fire
Alberta Municipal Benchmarking Initiative - Fire Services
 Alberta Municipal Benchmarking Initiative - Fire Services (December 2016) Fire Services Report - Alberta Municipal Benchmarking Initiative, page 1 Table of Contents 1 Introduction and Background... 6 1.1
NEW REGIONAL OFFICIAL PLAN HIGH LEVEL PROCESS & FRAMEWORK
 NEW REGIONAL OFFICIAL PLAN HIGH LEVEL PROCESS & FRAMEWORK Why A New Official Plan Originally the role of Regionally Planning and content of Regional Official Plan (1970s) primarily focused on protecting
4.1.3 LAND USE CATEGORIES
 4.1.3 LAND USE CATEGORIES a. City Center District The City Center District incorporates the existing character and mix of uses in downtown Belmont to encourage redevelopment and new development in keeping
Message from York Regional Council
 Tom Taylor Town of Newmarket Tim Jones Town of Aurora James Young Town of East Gwillimbury Robert Grossi Town of Georgina Danny Wheeler Town of Georgina Margaret Black Township of King A.J. (Tony) Van
Services the Agency is Required to Provide Services
 1 Eastside Fire & Rescue (EF&R or Agency) is a combination fire agency consisting of career and volunteer staff. Formed in 1999, the Agency functions under an Interlocal Agreement between King County Fire
Mission. Vision. To set the standard for excellence and innovation in public safety. Department Description
 Fire FIRE Mission The mission of the Fire Department is to ensure the health, safety, and well-being of our community by providing a wide range of innovative services. Vision To set the standard for excellence
MCSCS Proposed Changes to Fire Service Regulations
 MCSCS Proposed Changes to Fire Service Regulations Managers Report Presented to: Emergency Services Committee on May 16, 2018 Background The Ministry of Community Safety and Correctional Services (MCSCS)
BCGEU JOB DESCRIPTION MINISTRY OF FORESTS
 POSITION TITLE: Forest Protection Assistant BRANCH / REGION / DISTRICT: Protection Program, Fire Zones NOC CODE: 2223 SUPERVISOR S POSITION TITLE: Forest Protection Officer CURRENT CLASSIFICATION / GRID:
3. Endorse the LRT vision in transforming Surrey into Connected-Complete-Livable communities, and more specifically, the official vision statement:
 CORPORATE REPORT NO: R038 COUNCIL DATE: February 20, 2017 REGULAR COUNCIL TO: Mayor & Council DATE: February 16, 2017 FROM: General Manager, Engineering FILE: 8740-01 SUBJECT: Surrey Light Rail Transit
Park Board Strategic Framework. (Mission, Vision, Directions, Goals and Objectives) June 27, 2012
 June 27, 2012") Park Board Strategic Framework (Mission, Vision, Directions, Goals and Objectives) June 27, 2012 Planning Process Overview Phase 1: Renewed Strategic Framework Phase 2: Objectives Phase 3: Prioritization
Park Board Strategic Framework (Mission, Vision, Directions, Goals and Objectives) June 27, 2012 Planning Process Overview Phase 1: Renewed Strategic Framework Phase 2: Objectives Phase 3: Prioritization
THE CORPORATION OF THE TOWN OF ATIKOKAN BY-LAW NO
 THE CORPORATION OF THE TOWN OF ATIKOKAN BY-LAW NO. 34-12 BEING a by-law to establish and regulate a fire department; WHEREAS the Fire Protection and Prevention Act, 1997, S.O. 1997, c.4 as amended, permits
Fire Sprinklers Working Group Final Report
 Introduction The Building Act received Royal Assent on March 25, 2015. The Act aims to establish more consistent building requirements across British Columbia and create a more robust and modern building
Chapter Master Planned Communities (MPC) District
 District") Sections 14.53.010 Purpose and Intent 14.53.020 Applicability 14.53.030 Procedure 14.53.040 MPC Standards 14.53.050 Required Findings 14.53.010 Purpose and Intent Chapter 14.53 Master Planned Communities
Sections 14.53.010 Purpose and Intent 14.53.020 Applicability 14.53.030 Procedure 14.53.040 MPC Standards 14.53.050 Required Findings 14.53.010 Purpose and Intent Chapter 14.53 Master Planned Communities
Humboldt No. 1 Fire Protection District
 Humboldt No. 1 Fire Protection District Municipal Service Review September 2008 Prepared for Development of the District Sphere of Influence Report TABLE OF CONTENTS Page Local Agency Formation Commission
5.8 PUBLIC SERVICES FIRE PROTECTION AND EMERGENCY SERVICES
 5.8 PUBLIC SERVICES FIRE PROTECTION AND EMERGENCY SERVICES 5.8.1 INTRODUCTION This section assesses the proposed projects potential impacts on fire protection services. Information for the following analysis
The Contra Costa EMS System and Fire Station Closures: Impact and Mitigation
 This is an EMS System response report for the communities of Clayton, Lafayette, Martinez and Walnut Creek. Each community experienced a fire station closure on January 15, 2013. The Contra Costa EMS System
FIRE AND EMERGENCY SERVICES IN UPPER PROVIDENCE TOWNSHIP: A Recommended Roadmap For The Future. Presented by Upper Providence Township Administration
 FIRE AND EMERGENCY SERVICES IN UPPER PROVIDENCE TOWNSHIP: A Recommended Roadmap For The Future Presented by Upper Providence Township Administration Wednesday, April 4, 2018 PRESENTATION OUTLINE Responsibility