Landfill Gas Utilization Economic Evaluation for Anchorage Regional Landfill Anchorage, Alaska
|
|
|
- Carmel Nash
- 6 years ago
- Views:
Transcription
 382-5800 May 2004 Project No. 10148003000000")
1 Landfill Gas Utilization Economic Evaluation for Anchorage Regional Landfill Anchorage, Alaska Prepared for Municipality of Anchorage Supported by US Department of Energy Regional Biomass Energy Program Grant #DE-FG51-02R Prepared by 2360 Bering Drive San Jose, CA (408) May 2004 Project No
2 CONTENTS LIST OF TABLES AND ILLUSTRATIONS ii 1 INTRODUCTION Option 1 Electricity Generation Option 2 Transmission of LFG to Enstar Natural Gas Pipeline Option 3 Transmission of LFG to Eagle River School Option 4 Transmission of LFG to National Guard Facilities Option 5 Transmission of LFG to Fort Richardson Facilities Option 6 Transmission of LFG to Existing Municipal Light & Power (ML&P) Plant (George M. Sullivan No. 2) Option 7 Transmission of LFG to Proposed Municipal Light & Power (ML&P) at Fossil Creek Option 8 Treatment of Liquid Generated or Collected at the Anchorage Landfill ESTIMATED LANDFILL GAS GENERATION Model Input Model Output LANDFILL GAS CHARACTERIZATION AND UTILIZATION Landfill Gas Characterization and Utilization for Electrical Generation Equipment Landfill Gas Utilization for Boilers POTENTIAL LFGTE PROJECT SUBSIDIES Federal Renewable Energy Tax Credits Renewable Energy Production Incentive (REPI) Discussion of Potential Valuable Landfill Gas Attributes Greenhouse Gas Credit Values Trading Brokers ECONOMIC ANALYSIS Project Assumptions and Analysis Option 1 Electricity Generation Option 2 Transmission of LFG to Enstar Natural Gas Pipeline Option 3 - Transmission of LFG to Eagle River School Option 4 Transmission of LFG to National Guard Option 5 Transmission of LFG to Fort Richardson Option 6 Transmission of LFG to Existing ML&P Facility (George M. Sullivan Power Plant No. 2) 5-8 i
3 CONTENTS (Continued) 5.8 Option 7 Transmission of LFG to Proposed ML&P Facility (Fossil Creek Power Plant) Option 8- Treatment of Liquid Generated or Collected at the Anchorage Regional Landfill SUMMARY OF FINDINGS LIMITATIONS 7-1 ii
4 CONTENTS (Continued) APPENDICES Appendix 1 Appendix 2 Appendix 3 Appendix 4 Appendix 5 Appendix 6 Appendix 7 Appendix 8 Appendix 9 Appendix 10 Appendix 11 Appendix 12 Appendix 13 Appendix 14 Appendix 15 Appendix 16 Appendix 17 Appendix 18 LFG Generation Model Laboratory Analysis and Possible Clean-up Process Financial Pro Forma for Option 1 (Electrical Generation) Topographic Map for Option 2 (Enstar) Financial Pro Forma for Option 2 (Enstar) Proposed Boiler Specifications for Eagle River School Topographic Map for Option 3 (Eagle River School) Financial Pro Forma for Option 3 (Eagle River School) Topographic Map for Option 4 (National Guard) Financial Pro Forma for Option 4 (National Guard) Topographic Map for Option 5 (Ft. Richardson) List of Natural Gas Burning Equipment at Ft. Richardson Financial Pro Forma for Option 5 (Ft. Richardson) Topographic Map for Option 6 (ML&P George M. Sullivan Power Plant) Financial Pro Forma for Option 6 (ML&P George M. Sullivan Power Plant) Topographic Map for Option 7 (ML&P Fossil Creek) Financial Pro Forma for Option 7 (ML&P Fossil Creek) Financial Pro Forma for Option 8 (Treatment of Liquid Collected at the ARL) iii
5 1 INTRODUCTION The Municipality of Anchorage (MOA) has retained EMCON/OWT, Inc. to perform an economic evaluation of its landfill gas (LFG) beneficial use options. The evaluation is based on the anticipated LFG recovery rates and considers the cost of design, equipment procurement, equipment installation, revenue streams, potential government subsidies, and operations and maintenance (O&M) for the proposed facilities. This LFG beneficial use study was supported in part by funding from the US Department of Energy Regional Program Grant No. DE-FG51-02R This funding does not constitute any endorsement by the US Department of Energy of the results of the study. The LFG beneficial use options evaluated for this study are described below. Due to the poor financial performance of the electrical generation option, two scenarios were generated. The first electrical generation scenario included costs to construct and maintain the LFG collection system; the second scenario did not. All of the subsequent beneficial use options included costs to construct and maintain the LFG collection system. The Anchorage Regional Landfill is required by Federal New Source Performance Standards to install and operate such a system. Due to the difficulty in assessing the value of intangible items such as positive public relations for the Municipality as a result of using LFG as a beneficial use, these items are not included in this economic evaluation. The Municipality may want to consider the value of such intangible items in its final decision to proceed or not proceed with a project. 1.1 Option 1 Electricity Generation Option 1 involves electrical generation with a series of internal combustion engines that are designed to ignite LFG. Electricity generated by the engines may be sold to a local utility at its avoided cost rates. 1.2 Option 2 Transmission of LFG to Enstar Natural Gas Pipeline Option 2 includes compression and transmission of LFG into a high-pressure natural gas pipeline, which runs adjacent to the landfill (990 feet way). Enstar Natural Gas Company owns the natural gas pipeline. For this option we have reviewed the clean-up requirements and required operating pressure of the pipeline. 1-1
6 Section 1 Introduction 1.3 Option 3 Transmission of LFG to Eagle River School Option 3 includes compression of LFG in a low-pressure pipeline and then transmitted approximately 0.6 miles to the Eagle River School campus for use in its boilers. The Eagle River School boilers would be modified to allow burning of dual fuels (LFG and natural gas). 1.4 Option 4 Transmission of LFG to National Guard Facilities Option 4 includes compression of LFG in a low-pressure pipeline and then transmitted approximately 2.7 miles to the National Guard facilities for use in its boilers. National Guard boilers would be modified to allow burning of dual fuels (LFG and natural gas). 1.5 Option 5 Transmission of LFG to Fort Richardson Facilities Option 5 includes compression of LFG in a low-pressure pipeline and then transmitted approximately 5.1 miles to Ft. Richardson for use in its boilers. Ft. Richardson boilers would be modified to allow burning of dual fuels (LFG and natural gas). 1.6 Option 6 Transmission of LFG to Existing Municipal Light & Power (ML&P) Plant (George M. Sullivan No. 2). Option 6 includes compression of LFG in a low-pressure pipeline and then transmitted approximately 6.75 miles for use in ML&P s closest operating electrical plant equipment. ML&P equipment would be modified to allow burning of dual fuels (LFG and natural gas). 1.7 Option 7 Transmission of LFG to Proposed Municipal Light & Power (ML&P) at Fossil Creek. Option 7 includes compression of LFG in a low-pressure pipeline and then transmitted approximately 2.1 miles to the proposed Fossil Creek facility for use in its electrical generation equipment. ML&P equipment would be modified to allow burning of dual fuels (LFG and natural gas). 1-2
7 Section 1 Introduction 1.8 Option 8 Treatment of Liquid Generated or Collected at the Anchorage Landfill Option 8 includes the utilization of LFG to treat liquids generated or collected at the Anchorage Regional Landfill. These liquids include leachate generated at the landfill and glycol collected and disposed of by the Municipality. Due to unfavorable preliminary financial estimates, less detailed discussions of these options are contained in subsequent sections of this report.. 1-3
8 2 ESTIMATED LANDFILL GAS GENERATION EMCON/OWT used its proprietary LFG generation model to estimate the quantity of LFG that will be generated at the Anchorage Regional Landfill. 2.1 Model Input The LFG model is based on waste inflow, waste composition, waste moisture, and the potential for air intrusion. The input for the LFG model was determined based on sitespecific data provided by Anchorage Regional Landfill. Assumptions were made based on EMCON/OWT s knowledge of the landfill and nationwide studies of municipal solid waste. The input for the LFG generation model is provided in Appendix Model Output The LFG generation model output is also provided in Appendix 1. The annual utilizable quantity of LFG (as shown in the LFG generation model output) was used over the 10- year project life in the economic evaluation. The model output indicates that the average quantity of LFG generated over the 10-year project life is approximately 1,383 scfm (Year 1: 1,101 scfm and Year 10: 1,632 scfm). This utilizable quantity of LFG represents the quantity of LFG expected to be delivered to the blower/flare facility by the LFG collection and control system over the 10-year project life. All LFG flow rates quoted above are the expected generation rate. The actual quantity of LFG that may be available for beneficial use may be slightly less than the reported generation rates. This reduction of LFG collected versus generated is known as the collection efficiency. Collection efficiency is determined based on LFG well spacing, cover type, cover maintenance, percent of sideslopes allowing air intrusion, and maintenance of the LFG collection system. Typical collection efficiencies reported for geomembrane lined and capped sites are 90 to 95%. Typical collection efficiencies reported for capped soil and poorly operated LFG collection systems is 60 to 65%. Based on our review of the plans for LFG collection system design and MOA staff members extensive knowledge of LFG design, construction, operations, and their high standards for each of these disciplines, EMCON/OWT feels a collection efficiency of 75% is very achievable. Therefore, the model output indicates that the average quantity of collectable LFG over the 10-year project life is approximately 1,037 scfm (Year No.1: 826 scfm and Year No. 10: 1,224 scfm). 2-1
9 3 LANDFILL GAS CHARACTERIZATION AND UTILIZATION 3.1 Landfill Gas Characterization and Utilization for Electrical Generation Equipment LFG contains many contaminants that have detrimental effects on LFGTE collection, processing, and distribution equipment. The control of these contaminants can create secondary air compliance issues related LFGTE plant emissions. Beside the corrosive properties of LFG caused by contaminants (e.g., hydrogen sulfide, formation of carbonic acid, etc.,), siloxanes are probably the most troublesome contaminate for electrical generation equipment. Siloxane testing is now becoming well known as a primary maintenance and engine performance problem. Siloxane levels can range from low part per billion by volume (ppbv) levels to several hundred part per million by volume (ppmv). The reduction of siloxanes to silica dioxide is inevitable as the gas is burned to produce power and heat. Siloxanes can cause significant operational problems on LFG utilization projects (e.g., microturbines, internal combustion engines, fuel cells, large-scale turbines, catalyst systems, etc.). The impact of the silica deposition and abrasion is different at every landfill, but can have a significant maintenance cost impact on equipment. Most LFGTE projects use internal combustion (IC) engines to generate electricity. The silica dioxide can reduce head life; plate out and cause bypass of valves, score cylinders and liners; shorten life of spark plugs; cause increased oil changes; reduce the online power production time and profit; poison catalyst; produce incomplete combustion products; and lower engine and/or turbine efficiency. Having knowledge of all these, EMCON/OWT had the LFG tested for its basic fuel, volatile organic compounds (VOCs), siloxane, and sulfur components. The results of this testing are briefly discussed below. The complete laboratory analysis and a possible clean-up process are contained in Appendix 2. Upon review of data from the samples, it appears this site may be a suitable candidate for power generation using standard internal combustion (IC) engine technology. Currently, only the removal of siloxanes should be considered to extend the operational life, reduce the operational costs, and improve the uptime of the anticipated power generation. Further testing is recommended after collection wells are installed to check the blend of fuel components along with VOC and siloxanes. 3-1
10 Section 3 Landfill Gas Characterization and Utilization 3.2 Landfill Gas Utilization for Boilers The effects of burning the methane gas recovered from a landfill can be divided into the following four main categories: Effects on boiler efficiency, Effect on maximum boiler output capacity or production, Effects due to individual compounds in LFG stream, and Design changes needed to accommodate using LFG Effects on Boiler Efficiency Typically LFG is introduced into burners that were designed for natural gas having an energy content of 980 to 1,020 Btu/dscf (dry standard cubic foot). LFG has an energy content typically of 400 to 600 Btu/dscf. It can be shown by calculation that converting a boiler from natural gas to LFG will reduce the boiler efficiency by approximately 1%. This theoretical drop in efficiency is partially offset by a decreased exhaust gas temperature due to the increased radiative heat transfer coefficient of the combustion gases due to the increased levels of CO2 in the fuel gas. It should be noted that this decrease in efficiency is less than the change to other fuels (i.e. changing from #2 fuel oil to natural gas is a reduction of over 3% in efficiency) Effect on Maximum Boiler Output Capacity or Production Because of the lower heating value per cubic foot of LFG, a higher volume of fuel introduction to the burner is required for equal heat input. Typically twice as many cubic feet of LFG must be fed as natural gas to get the same Btu input to the burner. The net effect of this is to increase the total volume of exhaust gas in the stack. This is an increase of roughly 10% volume flow of gas in the stack. On a boiler where the combustion air fan is exactly sized for the burner rated input this would have the net effect of reducing the maximum energy input by 10% when firing LFG. However, properly sized burners typically have combustion air fans, which are oversized by 20% or more to account for variations in stack design and installation. In addition, boilers normally operate at 75% or less of capacity and 100% capacity are only used during warm-up from light off and this decrease in capacity is usually not detectable in operation. It should be noted that during the typical boiler tuning the boiler maximum firing rate is reduced to 85% to 90% of name plate capacity in order to achieve optimal firing at the lower firing rates. Because the fuel component of both LFG and natural gas is methane the amount of combustion air required to burn 1 MMBtu of methane gas is equal to the amount required to burn 1 MCF of natural gas (natural gas is measured in 3-2
11 Section 3 Landfill Gas Characterization and Utilization MCF or thousand cubic feet which at 1,000 Btu/cf by specification gives 1 MCF = 1 MMBtu) so that there is no net increase in combustion air required when changing fuels for equal heat input Effects Due to Individual Compounds in LFG Stream The major components of LFG are methane (CH4), carbon dioxide (CO2), nitrogen (N2), oxygen (O2) and other trace components primarily water vapor (H2O), non-methane organic compounds (NMOCs), hydrogen sulfide (H2S), and siloxane (SiOx). Methane is the primary energy component of LFG and is consumed during the combustion process. The combustion process is carefully regulated and is required to be controlled in such a manner that combustion products such as carbon monoxide (CO), nitrous oxides (NO x ), and unburned hydrocarbons (CH 4 and NMOC) are minimized. A major environmental benefit of burning LFG is that methane when released into the atmosphere is 21 times more effective at heat retention that carbon dioxide or in other words burning the methane contained in LFG has a net effect of reducing the total amount of greenhouse gases released from a landfill by a factor of 20. It is recognized by the US EPA that for each 1 MMBtu of LFG that is burned and not released from the landfill there is a net reduction of 1 ton of equivalent CO2 released into the atmosphere. In a typical large project this reduction will be in the hundreds of thousands of tons of CO2 reductions per year. The carbon dioxide and nitrogen in the gas stream are inert and have no effect on the combustion process other than to: (i) cool the theoretical flame temperature thereby decreasing efficiency as described above, and; (ii) increase the total volume of exhaust gases, which must be removed by the combustion air fan thereby decreasing maximum input as described above. (2) It is important to note that the nitrogen in the fuel gas stream is not the same as what is commonly referred to as fuel born nitrogen, which is typically found in both liquid and solid fuels in the form of nitrates. In those cases the fuel bound nitrogen will add to the total NOx production of the boiler. Because the nitrogen in the fuel stream is non-reactive as well as the carbon dioxide they both act to reduce the flame temperature, which has the net effect of reducing the amount of prompt NOx formed in the combustion process. Burner manufacturers such as COEN document a total NOx reduction of up to 30% when burning LFG versus natural gas. This reduction is due to the cooler flame temperatures in the combustion zone, which has the same effect as flue gas recirculation (FGR) without the performance and maintenance penalties associated with FGR. 3-3
12 Section 3 Landfill Gas Characterization and Utilization (3) Because of the nature of gas recovery at a landfill there is always trace amounts of water vapor present (from 0.3% to 3% by volume) in the fuel gas stream. While the water has no effect on combustion and is negligible when compared to the approximately 15% water vapor present in the exhaust gas due to the combustion of the hydrogen component of the methane contained in the LFG there is no net effect on the boiler proper. However, care must be taken to prevent water accumulation in the gas delivery piping and gas train especially when this piping is located out of doors in cold environments. (4) In the gas stream from a typical landfill there are varying amounts of NMOCs, which can vary from as little as 100 ppmv to over 2,000 ppmv. Since all the species that may be found in LFG are hydrocarbons they are nearly completely destroyed in the combustion process. There are no significant detrimental effects due to the presence of NMOCs in the LFG stream. (5) Hydrogen sulfide (H 2 S) is another trace compound, which is typically found in LFG and is a poisonous gas at elevated concentrations. Typical levels of H 2 S in methane gas streams are close to 10 ppmv, which is high enough to be detectable by its distinct sour (rotten egg) odor. Typical natural gas has up to 3 ppmv of H 2 S, which puts both fuels on roughly equal footing as to the potential for harm. H 2 S is converted to SO 2 during the combustion process. (6) Siloxane often is found in LFG and can vary from a few parts per billion to many parts per million. Siloxane is a gas that contains bound silicon. Upon reaching typical combustion temperatures it is converted into silicon dioxide, which forms a very light non-toxic dust that typically passes through the boiler. In most applications small accumulations of this dust are removed annually and disposed of. The only problems noted with this dust are on boilers with serrated fin or tight spaced fin economizers, which act as particulate filters and can become plugged with the silica dust. The silica dust does not adhere to most surfaces and is removed by light brushing or air pressure. Economizers with wide fin spacing (i.e. less than 3 fins per inch) typically do not plug with the silica dust Design changes needed to accommodate using LFG In most situations LFG will be introduced to a boiler that already exists. The following are design changes or modifications that should be examined. Not all of these will be required on any given installation and it is possible that very minimal modifications will be required. When new equipment is purchased to burn LFG, the manufacturer will be responsible for the required design to adequately burn LFG. It should be noted that the following assume that the LFG is being used in a existing gaseous fuel (typically natural gas) fired boiler or process burner, in cases where the burner is used with liquid or solid 3-4
13 Section 3 Landfill Gas Characterization and Utilization fuels then the manufacturer of the burner should be contacted for specific recommendations. (1) Because of the increased volume of fuel required to match energy input, LFG is normally introduced into an existing burner through a separate gas train with separate modulating gas control valve. Typically, if the same burner ring is to be used then the feed pressure of the gas to the ring is increased a factor of 1.5 to 4 times that of natural gas. (2) Since the energy content of LFG can vary by as much as 20%, an oxygen trim system should be considered for larger (over 10 MMBtu/hr input) burners and boilers. In these larger installations the increase in efficiency due to oxygen trim will normally pay for itself in less than a year due to increased boiler efficiency. (3) Installations where there is less LFG available than the maximum required input of the boiler, a co-fire system can be employed. Co-fire systems have oxygen trim and will allow for maximum consumption of LFG while allowing for the boiler to reach full fire when needed. (4) In installation where continuity of service is desired, minimal control modifications can be made so that loss of LFG availability will cause an automatic transfer to natural gas or other back up fuel. (5) In some burners (particularly larger or liquid fueled burners), a new gasfiring ring will need to be added specifically for LFG. (6) On newer installations, many manufacturers have experience with burning LFG due to its similarity to sewage treatment plant digester gas. Most boiler manufacturers have an existing design for digester gas. Digester gas differs from LFG only in its much higher concentration of H2S. (7) Typically the pilot will continue to be fired with natural gas. In installations where LFG is the only fuel a propane pilot is normally used. The preceding is intended as guides to use in evaluating the potential use of LFG as a fuel and not as specific design recommendations. At this time, no clean up for the boiler fuel application is being considered. A qualified engineer should be employed on any project to insure the safe and successful use of LFG as an alternative fuel. 3-5
14 4 POTENTIAL LFGTE PROJECT SUBSIDIES As part of this study EMCON/OWT researched the availability of governmental subsidies that exist to help offset the cost of LFGTE system development. A list of the potential subsidies that were researched is provided below. 4.1 Federal Renewable Energy Tax Credits Federal Renewable Energy Tax Credits, also known as Section 29 tax credits, are not available at this time. In the past, tax credits were available for projects that used landfill gas as a fuel. Credits that were beneficial to tax payers were valued at $1.00. Landfill gas equivalent to 1 million Btus was one credit. For comparison purposes, the past program (expiring) values the credit at $1.059 per million Btu. Federal legislation will be necessary for this program to become available again. Whether or not such legislation passes in 2004 is speculative at best given the political situation and the upcoming presidential election. The 108th Congress debated energy bill legislation without success. Whether or not an energy bill passes in 2004 is debatable and what the bill will contain is, again, speculative. The bill that was progressing in 2003 valued landfill gas as a tax credit; the suggested value was $3 per barrel of oil equivalent. This made the tax credit associated with landfill gas used in an energy project at $0.50 per million Btu. The bill also limited the amount of LFG that can be used to create a tax credit to only 200,000 ft cubed per day. 4.2 Renewable Energy Production Incentive (REPI) REPI funds are available to help subsidize LFGTE development costs for entities that are not typically eligible for tax credits (e.g., public agencies such as the Municipality of Anchorage). Since its inception, REPI funds have designated LFG as a second tier renewable energy. Renewable energy sources, such as wind power, are given a higher priority when distributing funds. Second tier energy sources receive funds only after the available funds are distributed to higher tier renewable energy sources. While LFG projects have received REPI funds in the past, EMCON/OWT has not included this subsidy in the financial pro forma contained in subsequent sections. If the MOA does develop the LFGTE project using internal funds, annual REPI applications should be submitted. 4-1
15 Section 3 Potential LFGTE Project Subsidies 4.3 Discussion of Potential Valuable Landfill Gas Attributes This brief discussion is included to demonstrate that the attributes associated with landfill gas can be a valuable asset to the owner. Any activity associated with a landfill and its landfill gas should be undertaken with this knowledge. Any decisions should take into account the current situation as it relates to the attributes discussed below. The situation may change in the near future due to local, regional, national, and international politics Valuable Attributes of Landfill Gas Landfill gas is a valuable commodity due to its source, municipal solid waste, and its main constituent, methane. LFG is recognized as a renewable energy by the US DOE, USEPA, most state energy programs, and the international bodies working to control global warming. Electricity produced from LFG or beneficial use of the LFG can be a source of credit that can have many values. While the areas for credit or value are still developing across the United States and around the world, the following discussion will assist the Municipality of Anchorage in understanding the value of these attributes and will suggest approaches for how to proceed Renewable Energy Credits A Renewable Energy Credit (REC) is an attribute that is given to landfill gas by those states that have legislated renewable portfolio standards (RPS). Generally, electricity produced by LFG is considered to have an ancillary REC attribute due to the avoided use of fossil fuel. For each megawatt of electricity produced from LFG, one REC unit is produced. States that have legislated a RPS generally allow RECs from LFG projects to be used to attain compliance with the mandated portfolio standard. A portfolio standard generally requires a pre-established percentage of energy produced from renewable sources be sold by the power suppliers. Electricity suppliers attain compliance with the mandated RPS through free-market purchase of RECs from generators, who are sometimes referred to as Qualified Facilities. RECs have been purchased for $4.50 to $40.00 per REC in Massachusetts, New Jersey, and most recently Connecticut. Recent discussions (January 2004) with environmental REC brokers reveal a weak market for RECs in areas not required to utilize them, such as Alaska. The price suggested was $1.00 per REC for these weak areas. RECs may be sold and wheeled to other states from non-rps states These deals are not lucrative at this time, with potential prices in the range of $1 to $2 per REC. This 1 Personal communication: Ana Giovinetto, Evolution Markets, and B. K. Maillet Shaw EMCON January
16 Section 3 Potential LFGTE Project Subsidies is due to the voluntary market in states with no requirement to supply RECs in their electricity portfolios. Buyers may be difficult to identify. According to one broker, the market is probably oversold. It does show, however, that a national market is emerging. 4.4 Greenhouse Gas Credit Values While there are few regulatory drivers in the United States for a greenhouse gas (GHG) credit market, there is a great deal of activity at the state level to develop mandatory carbon dioxide reduction programs. There are few regulatory requirements for utilities, industries, and businesses to reduce their GHG emissions; therefore, there is currently little incentive to purchase GHG offsets. Some trades of CO 2 E (calculated on a CO 2 equivalent basis) have taken place despite the negative situation relative to required CO 2 reductions. Companies will occasionally need CO 2 E offsets. Oregon and Massachusetts have requirements for new energy producers to offset some or all of their CO 2 emissions. LFG has played a role in at least one of these situations in the Commonwealth of Massachusetts. The Energy Facility Siting Council (of Massachusetts) required Mirant Energy to pay $300,000 for CO 2 E credits for reconstruction of a power plant. Greenhouse gas credits are the attributes assigned by climate change programs to the reductions in GHG emissions that are above the required levels, if any. Projects undertaken to reduce GHG gasses qualify as GHG credits. They are generally referred to as carbon dioxide equivalents or CO 2 E. The issue of whether or not the landfill is required to control the landfill gas is very important to the creation of credits. Landfills that are required to reduce the LFG may not have any credits available due to the additionally 3 requirement. Discussions regarding GHG or climate change are occurring across this country. Most state programs, such as those found in Oregon, Massachusetts, California, Connecticut, and New Hampshire, see the need for a federal program with widespread inter-sector trading of CO 2 E. This bodes well for existing and future LFG-to-energy projects. The project owner should have the mechanisms in place to properly track and document the LFG used and credits generated. The US Department of Energy (DOE) 1605B program is an excellent way to start this process. The program is currently being improved to ensure better information and that CO 2 E credits are registered. The revisions will be in place within the year. DOE s program requires gas measurement, gas generation documentation, and equipment calibration. Regular data collection from the project 2 Personal communication between Natsource, Matt Williamson and B.K. Maillet, Shaw EMCON, January Additionally: Kyoto protocol and other protocols such as the World Resource Institute and World Business Council for Sustainable Development will not allow credits from projects. 4-3
17 Section 3 Potential LFGTE Project Subsidies should be collected and maintained. As the data is filed with DOE, the credits will be available for others to view and perhaps acquire. At a recent SWANA LFG conference in San Antonio, Texas, Carl Bartone, a World Bank Environmental Consultant, described his work in developing LFG to Energy projects in Central and South America. He also described the value of the CO 2 E that will be the commodity traded in the GHG arena. Bartone reports that the cost of producing a CO 2 E is in the range of $3 to $4 per TCO 2 E from the Prototype Carbon Fund (PCF) data. He also reports that in a 2002 report, the PCF has suggested that the marginal cost of compliance with CO 2 reductions is on the order of $15 per TCO 2 E. The consensus of experts around the world is that LFG is a valuable commodity to be tracked and documented in order to obtain the value of the credits as programs develop. 4.5 Trading Brokers There are many traders that can handle the sale or transfer of LFG energy project attributes. Evolution Markets, Cantor-Fitzgerald, and Natsource are among them. As the project develops, the brokers should be made aware of the project details and schedule. They may be able to place sales or commitments in advance with additional revenue for the project. EMCON/OWT can prepare the introductions and information necessary for the brokers to understand the project. Additional information on their services may be found at the following web sites: Natsource: Evolution Markets: Cantor Fitzgerald: Ecosecurities: None of the above subsidies have been included in the financials contained in the subsequent section. 4-4
18 5 ECONOMIC ANALYSIS 5.1 Project Assumptions and Analysis The following assumptions have been made for the purpose of comparing each of the beneficial use options: The project pro forma period of 10 years ( ) is commonly used for landfill gas to energy financial feasibility analysis. As analysis periods go to 15 years or longer, there is greater uncertainty inherent in making financial predictions that far into the future. Also, Internal Revenue Service depreciation tables allowed owners to use 10-year depreciation for tax purposes and this further supported 10 years as an industry practice. It must be noted that the equipment, with proper maintenances, may be fully operable for longer periods. The pro formas include the depreciation methods and lives as outlined in GASB 34 (government accounting standards). The Summary page of each pro forma includes the basic MUSA and depreciation assumptions and the 10-year total MUSA contribution. An annual inflation rate of 2 percent Financial pro formas were developed at a breakeven or slight positive cash flow, as MOA wishes to encourage the beneficial use of LFG generated at its landfill. Since the Municipal Utility Service Assessment that applies to Enterprise Fund entities (such as the landfill), the pro formas incorporate the asset net book value based millage rate (16 mils) and the revenue based 1.25% contribution. Two scenarios were analyzed for electrical generation. One of the scenarios excludes costs to design, permit, construct, operate, and maintain the LFG collection system, and the other includes these costs. All subsequent options include the costs to design, permit, construct, operate, and maintain the LFG collection system. Project financing, permitting, and construction will occur during Actual beneficial use revenues will begin on January 1, Production, capital, revenue, and O&M cost assumptions are provided for each of these options in the following sections. 5-1
19 Section 4 Economic Analysis 5.2 Option 1 Electricity Generation To determine the economic feasibility of an electrical generation plant at the Anchorage Regional Landfill, the number of engines that could be brought on-line at the site is first determined. For this facility we recommend using Caterpillar engine/generator sets, primarily because the landfill operations already use a significant amount of CAT equipment and also because CAT engines have a good history of performance with LFG. Based on the requirements of CAT G3516LE engines, a total of three engines could initially be brought into service for electrical generation. Three engines require approximately 918 scfm of LFG at a 50% methane concentration and will generate a gross 804 kw each. An additional generator can be brought on-line for every 306 scfm of LFG extracted. The decision to bring more generators on-line can be made at a later date. Capital and O&M costs for the engines are based on the utilization of three engines to produce electricity. As shown in the financial pro-forma statement for this option (see Appendix 3), the electricity sold by three CAT G3516LE engines is 195,070-megawatt hours from 2006 to 2015 assuming 95% on-line and 3% plant loads are used by the plant. It is assumed that the electricity generated will be sold to a local utility. Utility deregulation is not currently available in Alaska; therefore, power must be sold to local utilities. If enacted, deregulation will allow retail wheeling of your power on local utility distribution lines. This allows you to sign up customers (through a licensed power broker) and sell power to them instead of the customers purchasing the power from local utilities. The idea of wheeling is to provide power to a customer at a lower cost than the utilities, but at a higher rate than they would receive if you had an avoided cost contract. The power lines directly adjacent to the Anchorage Regional Landfill are owned by Matanuska Electric Association (MEA). However, MEA is contractually obligated to buy all of its power from Chugach Electric until Currently, MEA purchases power at a rate of 5.9 cents per kwh (average avoided cost of electrical generation and transmission). Based on recent discussions with Chugach Power (Peter Poray), they have verbally quoted an average electrical generation avoided cost of 4.2-cents per kwh. However, Chugach is only willing to sign new power purchase agreements (PPA) in the 3-cent per kwh range. The avoided cost provided above may vary over the next several years, thereby affecting the economic analysis. Since power cannot be sold directly to MEA, power must be wheeled to Chugach using MEA power lines. Wheeling charges for the pro formas contained in Appendix 3 assume a wheeling rate of $0.005/kWh and an interconnection cost of $250,000. With three CAT generators operating at 95% availability and 3% plant loads, approximately million kwh will be available for sale each year. During the years 2006 through 2008 it is expected that gas availability will result in slightly lower production rates of 17.1 to 19.2 million kwh until the landfill s gas recovery rate is 5-2
20 Section 4 Economic Analysis sufficient for full loading of the engine. As directed by MOA staff, we have developed our pro formas on a breakeven basis. The breakeven point for the scenario that includes GCCS construction and operations is 5.47 cents per kwh. The breakeven point for the scenario excluding GCCS construction and operations is 4.81 cents per kwh. In order for the MOA to sell wholesale or retail power it will need licensing as a qualified facility (QF) by the Federal Energy Regulatory Commission (FERC). QF applications are typically prepared for all LFG-to-Energy projects. Having QF status forces the local utility to purchase excessive power generated but not sold to a retail customer at avoided rates Option 1A Electrical Generation Using Engine Generator Sets Including Costs of Gas Collection System Installation and Annual O&M Expenses 1. LFG VOLUMES The project consists of three CAT Triton Powerpacks with CAT 3516LE engines. Fuel requirements are 306 scfm (50% methane content) per engine. Initial recoverable gas is estimated at 826 scfm, which will result in slightly reduced kwh output; however, by 2009 the engines will have sufficient fuel for full load operation. Future gas recovery estimates indicate that additional engine generator sets could be added, however, our pro forma is based on three units throughout the project life. 2. REVENUES Based on the projected power generation, million kwhs could be sold over the next 10 years. To break even or produce a slight positive cash flow (including wellfield construction and O&M costs) will require a power sales rate of 5.47 cent per kwh, escalated 1% per year. At this rate, the anticipated revenue for the ten-year period will be $11,176, CAPITAL COSTS The capital cost to construct the wellfield, generation equipment, gas processing equipment and, interconnect with utility transmission grid will be approximately $4,109, O&M COSTS The O&M costs inclusive of the wellfield, generation equipment, gas processing, and interconnect, as well as general and administrative costs, are projected to be $6,327,000 over the 10-year project life. 5. SUMMARY Over the 10-year project life, the expected revenues at a sale price of 5.47 cents per kwh will be $11,176,000. Over the same time period, the projected expenses, including cost of ownership, will be $10,860,
21 Section 4 Economic Analysis Option 1A Electrical Generation Using Engine Generator Sets Excluding Costs of Gas Collection System Installation and Annual O&M Expenses 1. LFG VOLUMES No change. 2. REVENUES Based on the projected power generation, million kwhs could be sold over the next 10 years. To break even or produce a slight positive cash flow (including wellfield construction and O&M costs) will require a power sales rate of 4.81 cent per kwh, escalated 1% per year. At this rate, the anticipated revenue for the ten-year period will be $9,827, CAPITAL COSTS The capital cost to construct the wellfield, generation equipment, gas processing equipment, and interconnect with utility transmission grid will be approximately $3,207, O&M COSTS The O&M costs inclusive of the wellfield, generation equipment, gas processing, and interconnect, as well as general and administrative costs, are projected to be $6,048,000 over the 10-year project life. 5. SUMMARY Over the 10-year project life, the expected revenues at a sale price of 4.81 cents per kwh will be $9,827,000. Over the same time period, the projected expenses, including cost of ownership, will be $9,584, Option 2 Transmission of LFG to Enstar Natural Gas Pipeline An Enstar Natural Gas Company pipeline exists approximately 990 feet east of the proposed blower and flare station location. A topographic map is provided in Appendix 4 that displays the pipe routing and tie-in location for this option. A cross-section of this pipe routing is also contained in the same appendix. Based on discussions with Mr. Andrew D. White of Enstar, this natural gas pipeline operates at a maximum of 900-psig pressure. Mr. White also indicated that it is Enstar s policy to only accept gas into its system that has a heating value of approximately 1,000 Btu s per cubic foot. Since raw LFG typically has a heating value of 400 to 550 Btu/cf, cleaning up the MOA LFG to remove carbon dioxide and air will be required. A financial pro forma was calculated using industry-accepted figures (see Appendix 5). For this scenario, it was assumed that this end user could utilize all generated LFG. Results of this estimate indicate the following: 5-4
22 Section 4 Economic Analysis 1. LFG VOLUMES For the year 2006, the projected flow of LFG recovered is 826 scfm or 209,000 mmbtus. After clean up of the gas, only 160,000 mmbtus (77% conversion to saleable Btu s) will be available for injection into the pipeline. 2. REVENUES Based on the projected flows per year, assuming a 95% utilization factor and 77% conversion to saleable Btu s, 2,009,000 mmbtus could be recovered and processed for sale over the next 10 years. To break even or produce a slight positive cash flow (including wellfield construction and O&M costs) will require a sales price of $4.32 per mmbtu, escalated 2% per year. At this price, the anticipated revenue for the ten-year period will be $9,571, CAPITAL COSTS The capital cost to construct the wellfield, pipeline (990 feet), purchase compressors, and cleanup equipment will be approximately $2,995, O&M COSTS The O&M costs inclusive of the wellfield, pipeline, compressor, cleanup equipment, and electrical, as well as general and administrative costs, are projected to be $5,605,654 over the 10-year project life. 5. SUMMARY Over the 10-year project life, the expected revenues at a sale price of $4.32 will be $9,571,094. Over the same time period, the projected expenses, including cost of ownership, will be $8,935,635. Further evaluation of this beneficial use option appears to be unnecessary. The primary reasons this option is not economically feasible are as follows: 1 Enstar requires clean up of the LFG. This adds significant capital and O&M costs. 2. The existing Enstar line is operated at a maximum of 900-psig pressure. Compression of gas to 900 psig adds significant capital and takes a significant amount of electric power. 5.4 Option 3 - Transmission of LFG to Eagle River School An economic analysis was performed to determine the feasibility of constructing a pipeline to the Eagle River School and transporting LFG to the site for use in its boilers. The proposed boiler specifications for Eagle River School are provided in Appendix 6. A topographic map is provided in Appendix 7 that displays the pipe routing and tie-in location for this option. A cross-section of this pipe routing is also contained in the same appendix. Initial discussions with the School District were very encouraging, and they are open to the idea of utilizing LFG. However, after further analysis, the school would only utilize a small portion of the available LFG. 5-5
23 Section 4 Economic Analysis A detailed economic analysis for this scenario was calculated using industry-accepted figures (see Appendix 8). Results of this financial pro forma indicate the following: 1. LFG VOLUMES Based on the past consumption of LFG at a similar existing school in the area, Eagle River School is anticipated to require an estimated flow of 105 scfm at 50% methane. 2. REVENUES Based on the projected demand per year, 265,420 mmbtus could be sold over the next 10 years. To break even or produce a slight positive cash flow (including wellfield construction and O&M costs) will require a sales price of $18.87 per mmbtu, escalated 2% per year. At this price, the anticipated revenue for the ten-year period will be $5,484, CAPITAL COSTS The capital cost to construct the wellfield, pipeline ( miles), purchase compressors, and end user upgrades will be approximately $2,186, O&M COSTS The O&M costs inclusive of the wellfield, pipeline, and compressor, and electrical as well as general and administrative costs, are projected to be $2,653,798 over the 10-year project life. 5. SUMMARY Over the 10-year project life, the expected revenues at a sales price of $18.87 will be $5,484,108. Over the same time period, the projected expenses, including cost of ownership, will be $5,085,151. Further evaluation of this beneficial use option appears to be unnecessary. The primary reasons this option is not economically feasible are as follows: 1. Eagle Valley School gas demand is too low and is not consistent throughout the year. Most of the demand is during the winter months. This condition does not generate enough cash to offset capital and O&M costs. 2. The length of the pipeline is too long to justify the small amount of gas demanded. This adds significant capital costs 5.5 Option 4 Transmission of LFG to National Guard An economic analysis was performed to determine the feasibility of constructing a pipeline to the National Guard facilities and transporting LFG to the site for use in its boilers. A topographic map is provided in Appendix 9 that displays the pipe routing and tie-in location for this option. A cross-section of this pipe routing is also contained in the same appendix. Initial discussions with the National Guard were very encouraging, and they are open to the idea of utilizing LFG. Natural gas consumption, equipment make and model numbers, etc., provided by the National 5-6
24 Section 4 Economic Analysis Guard revealed that only a few pieces of equipment are suitable for conversion to utilize LFG (i.e., four Weil-McLain Boilers that use Gordon Piatt Burners). Because of this, the demand for LFG during warmer months of the year is substantially below the LFG production rate. A detailed economic analysis for this scenario was calculated using industry-accepted figures (see Appendix 10). For this scenario, it was assumed only a portion of the generated LFG could be utilized by the National Guard. Results of this financial pro forma indicate the following: 1. LFG VOLUMES For the year 2006, the projected flow of LFG recovered is 826 scfm. However, the National Guard Armory's seasonal gas demand is such that the Armory annual usage of LFG would be approximately 650 scfm. 2. REVENUES Based on the projected flows per year assuming a 95% utilization factor, 1,643,000 mmbtus could be recovered for sale over the next 10 years. To break even or produce a slight positive cash flow (including wellfield construction and O&M costs) will required a sales price of $3.45 per mmbtu, escalated 2% per year. At this price, the anticipated revenue for the ten-year period will be $6,198, CAPITAL COSTS The capital cost to construct the wellfield, pipeline (2.734 miles), purchase compressors, and end user upgrades will be approximately $2,492, O&M COSTS The O&M costs inclusive of the wellfield, pipeline, and compressor, and electrical as well as general and administrative costs, are projected to be $2,969,000 over the 10-year project life. 5. SUMMARY Over the 10-year project life, the expected revenues at a sales price of $3.45 will be $6,198,000. Over the same time period, the projected expenses, including cost of ownership, will be $5,742, Option 5 Transmission of LFG to Fort Richardson An economic analysis was performed to determine the feasibility of constructing a pipeline to Fort Richardson and transporting LFG to the site for use in its boilers. A topographic map is provided in Appendix 11 that displays the pipe routing and tie-in location for this option. A cross-section of this pipe routing is also contained in the same appendix. Initial discussions with Ft. Richardson were very encouraging, and they are open to the idea of utilizing LFG. The natural gas demand for Ft. Richardson vastly exceeds the generation rate of LFG from the Anchorage Regional Landfill. A listing of the over 500 natural gas burning pieces of equipment (shown in Appendix 11) was provided by Ft. 5-7
25 Section 4 Economic Analysis Richardson staff (Debra S. Breindel). Of these nearly 500 pieces of equipment, 4 large Cleave-Brooks boilers appear to be best suited for conversion to operate on LFG. Cleaver-Brooks boilers have a good history of being converted to LFG use, and the ones at Ft. Richardson are located in one single location (Building No. 726). This single high gas demand location is ideal for LFG utilization and eliminates the need for elaborate and costly gas delivery infrastructure. A detailed economic analysis for this scenario was calculated using industry-accepted figures (see Appendix 13). For this scenario, it was assumed that this end user could utilize all the generated LFG. Results of this financial pro forma indicate the following: 1. LFG VOLUMES For the year 2006, the projected flow of LFG recovered is 826 scfm. It is assumed that Fort Richardson Building #726 would use all available gas. 2. REVENUES Based on the projected flows per year, assuming a 95% utilization factor, 2,620,000 mmbtus could be recovered for sale over the next 10 years. To break even or produce a slight positive cash flow (including wellfield construction and O&M costs) will require a sales price of $2.72 per mmbtu, escalated 2% per year. At this price, the anticipated revenue for the ten-year period will be $7,861, CAPITAL COSTS The capital cost to construct the wellfield, pipeline ( miles), purchase compressors, and end user upgrades will be approximately $3,256, O&M COSTS The O&M costs inclusive of the wellfield, pipeline, and compressor, and electrical as well as general and administrative costs, are projected to be $3,564,149 over the 10-year project life. 5. SUMMARY Over the 10-year project life, the expected revenues at a sales price of $2.72 will be $7,861,211. Over the same time period, the projected expenses, including cost of ownership, will be $7,189, Option 6 Transmission of LFG to Existing ML&P Facility (George M. Sullivan Power Plant No. 2) An economic analysis was performed to determine the feasibility of constructing a pipeline to the nearest existing ML&P facility and transporting LFG to the site for use in its natural gas burning equipment (boilers, gas turbines, etc.). A topographic map is provided in Appendix 14 that displays the pipe routing and tie-in location for this option. A cross-section of this pipe routing is also contained in the same appendix. Initial discussions with ML&P were encouraging, and they are open to the idea of utilizing LFG. 5-8
26 Section 4 Economic Analysis However, after further analysis, the nearest plant was determined to be over six miles away. It is preferred that a low-pressure piece of equipment be utilized for the LFG delivered to this power plant. Preliminary discussions with ML&P staff indicated that a low-pressure end use could most likely be identified. If a low-pressure piece of equipment is not available and a high-pressure application is required to be utilized, the cost of pressurization will substantially increase capital expenditures. For this option, it was assumed a low pressure could be identified. A detailed economic analysis for this scenario was calculated using industry-accepted figures (see Appendix 15). For this scenario, it was assumed that this end user could utilize all the generated LFG. Results of this financial pro forma indicate the following: 1. LFG VOLUMES For the year 2006, the projected flow of LFG recovered is 826 scfm. It is assumed that the George M. Sullivan Power Plant would use all available gas. 2. REVENUES Based on the projected flows per year, assuming a 95% utilization factor, 2,620,000 mmbtus could be recovered for sale over the next 10 years. To break even or produce a slight positive cash flow (including wellfield construction and O&M costs) will require a sales price of $2.86 per mmbtu, escalated 2% per year. At this price, the anticipated revenue for the ten-year period will be $8,256, CAPITAL COSTS The capital cost to construct the wellfield, pipeline (6 miles), purchase compressors, and end user upgrades will be approximately $3,527, O&M COSTS The O&M costs inclusive of the wellfield, pipeline, and compressor, and electrical as well as general and administrative costs, are projected to be $3,598,169 over the 10-year project life. 5. SUMMARY Over the 10-year project life, the expected revenues at a sales price of $2.86 will be $8,256,531. Over the same time period, the projected expenses, including cost of ownership, will be $7,522, Option 7 Transmission of LFG to Proposed ML&P Facility (Fossil Creek Power Plant) An economic analysis was performed to determine the feasibility of constructing a pipeline to a ML&P proposed facility at Fossil Creek and transporting LFG to the site for use in its electrical generating equipment. A topographic map is provided in Appendix 5-9
27 Section 4 Economic Analysis 16 that displays the pipe routing and tie-in location for this option. A cross-section of this pipe routing is also contained in this same appendix. Initial discussions were held with ML&P, and they are very open to the idea of utilizing LFG because they could incorporate LFG use into their design. Again, it was assumed a low-pressure application could be identified for the proposed power plant. If a low-pressure piece of equipment is not available and a high-pressure application is required to be utilized, the cost of pressurization will substantially increase capital expenditures. A detailed economic analysis for this scenario was calculated using industry-accepted figures (see Appendix 17). For this scenario, it was assumed that this end user could utilize all the generated LFG. Results of this financial pro forma indicate the following: 1. LFG VOLUMES For the year 2006, the projected flow of LFG recovered is 826 scfm. It is assumed that the proposed Fossil Creek Power Plant would use all available gas. 2. REVENUES Based on the projected flows per year, assuming a 95% utilization factor, 2,620,000 mmbtus could be recovered for sale over the next 10 years. To break even or produce a slight positive cash flow (including wellfield construction and O&M costs) will require a sales price of $2.14 per mmbtu, escalated 2% per year. At this price, the anticipated revenue for the ten-year period would be $6,194, CAPITAL COSTS The capital cost to construct the wellfield, pipeline ( miles), purchase compressors, and end user upgrades will be approximately $2,285, O&M COSTS The O&M costs inclusive of the wellfield, pipeline, and compressor, and electrical as well as general and administrative costs, are projected to be $3,165,628 over the 10-year project life. 5. SUMMARY Over the 10-year project life, the expected revenues at a sales price of $2.14 will be $. Over the same time period, the projected expenses, including cost of ownership, will be $5,713, Option 8- Treatment of Liquid Generated or Collected at the Anchorage Regional Landfill Leachate Evaporation Using LFG Leachate generated by the landfill is currently accumulated by a collection system and transported to an off-site wastewater treatment plant owned and operated by the 5-10
28 Section 4 Economic Analysis Municipality of Anchorage. Leachate evaporation utilizing LFG has been conducted as part of this study to enable the Municipality to compare the evaporation costs to its current disposal costs. Option 8 involves disposing of leachate by the proposed flare facility to incorporate EMCON/OWT s patented Leachate Evaporator (E-Vap). The E-Vap evaporates leachate and the off vapors are destroyed in an enclosed flare, thus eliminating the need for complex treatment of leachate. Prior to performing a detailed economic analysis of this option, a rough estimate was calculated using industry-accepted figures. The results of this rough estimate determined the following: 1. On average, the leachate collection system at the Anchorage Regional Landfill has collected approximately 7,000,000 gallons per year since 1990.Pending implementation of design changes currently under consideration (including complete recirculation) may significantly reduce this volume. 2. Collection, transport, and disposal costs are limited to transportation and are in the range of 2 to 3 cents per gallon. 3. Typical costs for treatment of collected leachate by our patented E-Vap technology are higher than 3 cents per gallon. Based on current leachate collection rates, a 20,000-gpd-leachate evaporator would be needed. Recent pro forma for this size unit (with a flare) indicated a disposal cost of approximately 6.8 cents per gallon. Again, the landfill is currently hauling leachate to the city sewage treatment plant for a cost of less than 3 cents for trucking and no cost from the treatment plant. Therefore, further evaluation of this beneficial use option appears to be unnecessary Glycol Recycling Using LFG At the request of the MOA, EMCON/OWT has briefly reviewed the feasibility of utilizing LFG to recycle glycol collected at the landfill. The option of recycling glycol utilizing LFG has been included as a part of this study so the Municipality can compare the recycling costs to its current disposal costs. Prior to performing a detailed economic analysis of this option, a rough estimate was calculated using industry-accepted figures. The results of this rough estimate determined the following: 1. On an annual basis, the Municipality receives $8,400 for the collection and disposal of 12,000 gallons of glycol ($0.70 per gallon) from its customers. 5-11
29 Section 4 Economic Analysis 2. The Municipality s annual disposal costs for the 12,000 gallons are $35, Engineering design, permitting, equipment procurement, construction, startup and commissioning a fully developed project cost for a glycol distillation system and heating device will be greater than $300, O&M costs of 5% of capital investment will be approximately $15,000 per year gpy of glycol could be recovered and sold at a price of $2.50 per gallon, generating an annul income of only $15, The payback period for the $300,000 investment exceeds generally accepted accounting practices. An initial pro forma was developed for the potential glycol scenario and is contained in Appendix 18. This pro forma indicated that at a $4.50 per gallon resale price, the required breakeven quantity is 14,700 gallons per year. Because of processing constraints, this equates to collecting nearly 30,000 gallons of waste glycol per year. Again, the MOA currently collects approximately 12,000 gallons per year. Additionally, MOA is concerned about competing with other private entities for other sources of waste glycol. Therefore, further evaluation of this beneficial use option appears to be unnecessary. 5-12
30 6 SUMMARY OF FINDINGS A summary of the findings for each of the options presented in Section 5 is provided below: LFG modeling indicates that sufficient recoverable quantities of LFG are present to support 2.4 MW electricity generation (Option No. 1). The electricity produced can be sold to several different local utilities, including Municipal Light & Power. Negotiation of an electric sales agreement with the a local utility is necessary under this option. These negotiations are quite often a long and difficult process and are typically more difficult with the absence of a local or state renewable energy portfolio standard. The most lucrative electric sale potential appears to be with MEA (currently buying power at from Chugach at 5.9 cent per kw) At this rate, a LFGTE project would breakeven (LFG collection/flaring costs included in pro forma: 5.84 cents per kw) or be profitable (LFG collection/flaring costs included in pro forma: 4.81 cents per kw). Because MEA is obligated to purchase all their power from Chugach Electric until 2014, a special exemption will be required. It is anticipated that renewable energy requirement will soon be requested by the federal government at local military bases. If this requirement is requested the probability of obtaining this exemption or a direct sale to another utility or the federal government is drastically increase. The capital and O&M to operate a high Btu LFG plant and inject the LFG into Enstar s nearby pipeline (Option No. 2) is not economically feasible. The capital and O&M to operate a LFG pipeline to the Municipality of Anchorage Eagle Valley School (Option No. 3) is not economically feasible. The sale of medium Btu LFG to the National Guard (Option No. 4) may be economically feasible, but there appears to be more lucrative options available (see Option Nos. 5, 6 and 7). Sale of a medium Btu LFG to ML&P, Ft. Richardson (Option No. 5), appears to economically feasible and provides just slightly better financial results than the sale of LFG to George M. Sullivan Power Plant No. 2 (Option No. 6) The boiler identified for conversion are new pieces of equipment and are planned for long term use on the base. However, Fort Richardson has been included on previous 6-1
31 base realignment and closure (BRAC) lists and therefore could present considerable financial risk if closed. In addition, negotiating a gas sales agreement with the Federal government and the equipment operator (i.e., Honeywell) may be more troublesome than other options. Sale of medium Btu LFG to ML& P s George M. Sullivan Power Plant No. 2 (Option No. 6) appears to be economically feasible. Only the sale of LFG to the proposed Fossil Creek Facility (Option No.7) substantially outperforms this option. Since this plant already exists and is owned by the MOA, this option may present the least amount of risk. Sale of medium Btu LFG to ML& P s proposed Fossil Creek Facility (Option No. 7) appears to be economically feasible. This option appears to be the most economically feasible, but does present the risk of delayed construction or even never being built. Option 8, utilizing LFG to treat on-site liquid (leachate and glycol) is not economically feasible. 6-2
32 7 LIMITATIONS The services described in this report were performed consistent with generally accepted professional consulting principles and practices. No other warranty, expressed or implied, is made. These services were performed consistent with our agreement with the Municipality of Anchorage. This report is solely for the use and information of Anchorage Regional Landfill unless otherwise noted. Any reliance on this report by a third party is at such party's sole risk. Opinions and recommendations contained in this report apply to conditions existing when services were performed and are intended only for the client, purposes, locations, time frames, and project parameters indicated. We are not responsible for the impacts of any changes in environmental standards, practices, or regulations subsequent to performance of services. We do not warrant the accuracy of information supplied by others, nor the use of segregated portions of this report. The LFG generation modeling techniques used by EMCON/OWT and the LFG industry are, by definition, hypothetical, and can only be used as a very general tool for producing a range of estimates to aid in determining the direction of further investigations. Actual LFG generation and collection rates are dependent on many variables, including: refuse composition, moisture, ph, cover soil permeability, well spacing, continuing fill rates, etc.. Typically these parameters are not well defined at the time of modeling and/or differ somewhat from those actually experienced during future site operation. The LFG generation modeling provided herein was performed with today s current standards of practice and no warranty or representation, expressed or implied, is made, as to the actual LFG production that will occur in the future. Opinions and recommendations contained in this report are based on the information available and certain assumptions that were deemed reasonable when our services were performed. We are not responsible for the impacts of any changes in information, site operations or methods that may change in the future. 7-1
33 APPENDIX 1 LANDFILL GAS GENERATION MODEL
34 LANDFILL GAS GENERATION MODEL INPUT SUMMARY Municipality Of Alaska (Moderately Dry/Moderately Wet) General Information Waste Stream Composition Analysis performed by: Erik C. Korsmo Project number: Component Composition 1 Composition 2 Date of analysis: 01/19/04 Organics Analysis Timeframe Food waste 9.0% N/A Garden waste 19.0% N/A Opening year of the landfill: 1987 Paper waste 33.0% N/A Closing year of the landfill: 2043 Other organics 7.0% N/A Analysis performed through the year: 2100 Organic Subtotal 68.0% N/A Inorganics 32.0% N/A Site Operating Conditions Total 100.0% N/A Refuse moisture condition: Moderately Dry Refuse temperature: 90 F Average compacted refuse density: 1,200 lb/cy Generation Rate Properties LFG System Recovery Efficiency Rapid subgroup conversion time: 4 yrs Intermediate subgroup conversion time: 33 yrs Slow subgroup conversion time: 120 yrs ID Number Recovery Efficiency Effective Period EPA Modeling Parameters 1 70% Methane generation potential (L o ): 6,000 ft 3 /Mg Methane generation rate (k): 0.02 yr -1 NMOC concentration (C NMOC ): 4,000 ppmv N:\PROJECTS\LANDFILL GAS DESIGN CENTER DATABASE\MODELS\EMCON LFG MODELING\MOA LFG Generations:M.Dry-M.Wet Inputs Page 1 of 5
35 Summary of Results Municipality Of Alaska (Moderately Dry/Moderately Wet) Year Annual Refuse Acceptance Rate Cumulative Refuse Acceptance Rate Upper limit of LFG Generation Rate Lower limit of LFG Generation Rate Upper limit of LFG Recovery Rate Lower limit of LFG Recovery Rate Average LFG Generation Rate EPA LFG Recovery Rate (tons) (tons) (scfm) (scfm) (scfm) (scfm) (scfm) (scfm) ,053 25, , , , , , , , , ,296 1,023, ,047 1,246, ,982 1,480, ,884 1,721, ,815 1,949, ,990 2,201, ,657 2,452, ,866 2,733, ,760 3,012, ,666 3,292, ,592 3,597, ,400 3,881,446 1, ,000 4,181,446 1, ,000 4,481,446 1, ,031 1, ,000 4,781,446 1, ,101 1, ,000 5,081,446 1, ,170 1, ,000 5,381,446 1, ,237 1, ,000 5,681,446 1, , ,302 1, ,000 5,981,446 1,568 1,023 1, ,364 1, ,000 6,281,446 1,636 1,067 1, ,423 1, ,000 6,581,446 1,701 1,109 1, ,479 1, ,000 6,881,446 1,763 1,150 1, ,533 1, ,000 7,181,446 1,822 1,188 1, ,584 1, ,000 7,481,446 1,877 1,224 1, ,632 1, ,000 7,781,446 1,930 1,259 1, ,678 1, ,000 8,081,446 1,980 1,292 1, ,722 1, ,000 8,381,446 2,028 1,323 1, ,764 1, ,000 8,681,446 2,073 1,352 1, ,803 1, ,000 8,981,446 2,117 1,380 1, ,841 1, ,000 9,281,446 2,158 1,407 1, ,876 1, ,000 9,581,446 2,197 1,433 1,538 1,003 1,910 1, ,000 9,881,446 2,234 1,457 1,564 1,020 1,942 2, ,000 10,181,446 2,269 1,480 1,588 1,036 1,973 2, ,000 10,481,446 2,303 1,502 1,612 1,051 2,002 2, ,000 10,781,446 2,334 1,522 1,634 1,066 2,030 2,133 N:\PROJECTS\LANDFILL GAS DESIGN CENTER DATABASE\MODELS\EMCON LFG MODELING\MOA LFG Generations:M.Dry-M.Wet Outputs Page 2 of 5
36 Summary of Results Municipality Of Alaska (continued) Year Annual Refuse Acceptance Rate Cumulative Refuse Acceptance Rate Upper limit of LFG Generation Rate Lower limit of LFG Generation Rate Upper limit of LFG Recovery Rate Lower limit of LFG Recovery Rate Average LFG Generation Rate EPA LFG Recovery Rate (tons) (tons) (scfm) (scfm) (scfm) (scfm) (scfm) (scfm) ,000 11,081,446 2,365 1,542 1,655 1,080 2,056 2, ,000 11,381,446 2,394 1,561 1,676 1,093 2,082 2, ,000 11,681,446 2,421 1,579 1,695 1,105 2,106 2, ,000 11,981,446 2,448 1,596 1,713 1,117 2,128 2, ,000 12,281,446 2,473 1,613 1,731 1,129 2,150 2, ,000 12,581,446 2,496 1,628 1,748 1,140 2,171 2, ,000 12,881,446 2,519 1,643 1,763 1,150 2,191 2, ,000 13,181,446 2,541 1,657 1,779 1,160 2,209 2, ,000 13,481,446 2,561 1,671 1,793 1,169 2,227 2, ,000 13,781,446 2,581 1,683 1,807 1,178 2,244 2, ,000 14,081,446 2,600 1,696 1,820 1,187 2,261 2, ,000 14,381,446 2,618 1,707 1,832 1,195 2,276 2, ,000 14,681,446 2,635 1,718 1,844 1,203 2,291 2, ,000 14,981,446 2,651 1,729 1,856 1,210 2,305 2, ,000 15,281,446 2,667 1,739 1,867 1,217 2,319 2, ,000 15,581,446 2,681 1,749 1,877 1,224 2,332 2, ,000 15,881,446 2,696 1,758 1,887 1,231 2,344 2, ,709 1,767 1,896 1,237 2,356 2, ,689 1,754 1,882 1,227 2,338 2, ,670 1,741 1,869 1,219 2,322 2, ,626 1,713 1,838 1,199 2,284 2, ,570 1,676 1,799 1,173 2,235 2, ,499 1,630 1,749 1,141 2,173 2, ,412 1,573 1,688 1,101 2,097 2, ,311 1,507 1,618 1,055 2,009 2, ,200 1,434 1,540 1,004 1,913 2, ,084 1,359 1, ,812 2, ,973 1,287 1, ,715 2, ,874 1,222 1, ,630 2, ,781 1,162 1, ,549 2, ,693 1,104 1, ,473 2, ,610 1,050 1, ,400 2, , , ,332 2, , , ,268 2, , ,207 1, , ,149 1, , ,094 1, , ,042 1, , , , ,789 N:\PROJECTS\LANDFILL GAS DESIGN CENTER DATABASE\MODELS\EMCON LFG MODELING\MOA LFG Generations:M.Dry-M.Wet Outputs Page 3 of 5
37 Summary of Results Municipality Of Alaska (continued) Year Annual Refuse Acceptance Rate Cumulative Refuse Acceptance Rate Upper limit of LFG Generation Rate Lower limit of LFG Generation Rate Upper limit of LFG Recovery Rate Lower limit of LFG Recovery Rate Average LFG Generation Rate EPA LFG Recovery Rate (tons) (tons) (scfm) (scfm) (scfm) (scfm) (scfm) (scfm) , , , , , , , , , , , , , , , , , , , , , , , , , , , , , , N:\PROJECTS\LANDFILL GAS DESIGN CENTER DATABASE\MODELS\EMCON LFG MODELING\MOA LFG Generations:M.Dry-M.Wet Outputs Page 4 of 5
38 Municipality Of Alaska Landfill Gas Generation Rate (M.Dry/M.Wet) 3,000 Landfill Gas Generation Rate (scfm) 2,500 2,000 1,500 1, Year Upper limit of LFG Generation Rate Lower limit of LFG Generation Rate Average LFG Generation Rate N:\PROJECTS\LANDFILL GAS DESIGN CENTER DATABASE\MODELS\EMCON LFG MODELING\MOA LFG Generations:M.Dry-M.Wet Gen & Rec Page 5 of 5
39 Lag Time Conversion Time Peak Results (scfm) Present Results (scfm) Description Temp. Rapid Moderate Slow Rapid Moderate Slow Year Upper LFG Lower LFG Average Year Upper LFG Lower LFG Average Dry < , Dry/M.Dry < , , M.Dry/Dry < ,116 1,380 1, M.Dry < ,482 1,619 2, (R) M. Dry/M.Wet ,591 2,253 1, , (R) M. Dry/M.Wet ,709 1,767 2, , (R) M.Wet/M.Dry ,285 2,142 2, ,703 1,111 1,481 (R) M.Wet/M.Dry ,474 2,266 3, ,801 1,175 1,566 (R) M.Wet ,321 2,166 2, ,087 1,361 1,814 (R) M.Wet ,513 3,055 2, ,207 1,439 1,919 (R) = Assumes Recirculation Activities Bold = Output Attached Dry M.Dry M.Wet Wet Default Values Description Purpose: Lag Time Conversion Time Rapid Moderate Slow Rapid Moderate Slow Methodology: Determine the future LFG generation for the Municipality of Anchorage - Regional Landfill, based on the existing information provided by the owner. Utilizing EMCON's LFGM, vary the moisture and temperature parameters to determine the most accurate representation of the existing and future LFG generation Prepared By: Erik C. Korsmo Date: 1/20/2004 Checked By: Douglas M. Gatrell Date: 1/20/2004 Notes: 1. EMCON assumes refuse temperature to be approximately 65 degrees F. based on owner provided information. 2. EMCON assumes recirculation will raise temperature of refuse degrees F. 3. EMCON Modeling does not recognize any significant influence in Unit Gas Yield for temperatures below 80 degrees F. 4. EMCON-LFGM proprietary model was utilized for the generation rates. Complete output information is available upon request. 5. EMCON assumes the filling rates would continue at 300,000 tons/year until year 2043.
40 APPENDIX 2 LABORATORY ANALYSIS AND POSSIBLE CLEAN-UP PROCESS
41 @ AN AIR TOXICS LTD. ENVIRONMENTAL ANALYTICAL LABORATORY Air Toxics Ltd. Introduces the Electronic Report Thank you for choosing Air Toxics Ltd. To better serve our customers, we are providing your report by . This document is provided in Portable Document Format which can be viewed with Acrobat Reader by Adobe. This electronic report includes the following: Work order Summary; Laboratory Narrative; Results; and Chain of Custody (copy). 180 BLUE RAVINE ROAD, SUITE B FOLSOM, CA (916) FAX (916) Hours 8:00 A.M to 6:00 P.M. Pacific to:samplereceiving@airtoxics.com
42 @ AIR TOXICS LTD. AN ENVIRONMENTAL ANALYTICAL LABORATORY WORK ORDER #: A Work Order Summary CLIENT: Mr. Paul Tower Applied Filter Technology th Ave SE Snohomish, WA BILL TO: Mr. Paul Tower Applied Filter Technology th Ave SE Snohomish, WA PHONE: FAX: DATE RECEIVED: 11/11/03 DATE COMPLETED: 11/19/03 P.O. # PROJECT # SHAW/EMCON-Anchorage Regional CONTACT: Kelly Buettner RECEIPT FRACTION # NAME TEST VAC./PRES. 01A 301B Modified TO-14A Tedlar Bag 02A Lab Blank Modified TO-14A NA 03A CCV Modified TO-14A NA 04A LCS Modified TO-14A NA CERTIFIED BY: DATE: 11/24/03 Laboratory Director Certfication numbers: AR DEQ, CA NELAP CA, LA NELAP/LELAP- AI 30763, NJ NELAP - CA004 NY NELAP , UT NELAP Name of Accrediting Agency: NELAP/Florida Department of Health, Scope of Application: Clean Air Act, Accreditation number: E87680, Effective date: 07/01/03, Expiration date: 06/30/04 Air Toxics Ltd. certifies that the test results contained in this report meet all requirements of the NELAC standards This report shall not be reproduced, except in full, without the written approval of Air Toxics Ltd. 180 BLUE RAVINE ROAD, SUITE B FOLSOM, CA (916) (800) FAX (916) Page 1 of 11
43 LABORATORY NARRATIVE Modified TO-14A Applied Filter Technology Workorder# A One 1 Liter Tedlar Bag sample was received on November 11, The laboratory performed analysis via modified EPA Method TO-14A using GC/MS in the full scan mode. The method involves concentrating up to 0.5 liters of air. The concentrated aliquot is then flash vaporized and swept through a water management system to remove water vapor. Following dehumidification, the sample passes directly into the GC/MS for analysis. See the data sheets for the reporting limits for each compound. Method modifications taken to run these samples include: Requirement TO-14A ATL Modifications Continuing Calibration criteria </= 30% Difference </= 30% Difference with two allowed out to </= 40% Difference; flag and narrate outliers Initial Calibration criteria RSD<30% RSD</=30%, two compounds allowed up to 40%. Moisture control Nafion Dryer Multisorbent trap Blank acceptance criteria <0.20 ppbv <Reporting Limit Primary ions for Quantification Dilutions for Initial Calibration BFB absolute abundance criteria Freon 114: 85, Carbon Tetrachloride: 117, Trichloroethene: 130, Ethyl Benzene, m,pand o-xylene: 91 Dynamic dilutions or static using canisters Within 10% of that from previous day. Freon 114: 135, Carbon Tetrachloride: 119, Trichloroethene: 95, Ethyl Benzene, m,p- and o-xylene: 106 Syringe dilutions Sample Load Volume 400 ml Varied to 200 ml CCV internal standard area counts are compared to ICAL, corrective action for > 40% D Receiving Notes The chain of custody information for sample 301B did not match the entry on the sample tag. The discrepancy was noted in the Login and the information on the chain of custody was used to process and report the sample. Analytical Notes There were no analytical discrepancies. Definition of Data Qualifying Flags Eight qualifiers may have been used on the data analysis sheets and indicates as follows: B - Compound present in laboratory blank greater than reporting limit (background subtraction not performed). J - Estimated value. E - Exceeds instrument calibration range. S - Saturated peak. Q - Exceeds quality control limits. U - Compound analyzed for but not detected above the reporting limit. UJ- Non-detected compound associated with low bias in the CCV Page 2 of 11
44 N - The identification is based on presumptive evidence. File extensions may have been used on the data analysis sheets and indicates as follows: a-file was requantified b-file was quantified by a second column and detector r1-file was requantified for the purpose of reissue Page 3 of 11
45 AIR TOXICS LTD. SAMPLE NAME: 301B ID#: A-01A MODIFIED EPA METHOD TO-14A GC/MS FULL SCAN File Name: b Dil. Factor: 133 Date of Collection: 11/10/03 Date of Analysis: 11/12/03 01:12 AM Compound Freon 12 Freon 114 Vinyl Chloride Bromomethane Chloroethane Freon 11 1,1-Dichloroethene Freon 113 Methylene Chloride 1,1-Dichloroethane cis-1,2-dichloroethene Chloroform 1,1,1-Trichloroethane Carbon Tetrachloride Benzene 1,2-Dichloroethane Trichloroethene 1,2-Dichloropropane cis-1,3-dichloropropene Toluene trans-1,3-dichloropropene 1,1,2-Trichloroethane Tetrachloroethene 1,2-Dibromoethane (EDB) Chlorobenzene Ethyl Benzene m,p-xylene o-xylene Styrene 1,1,2,2-Tetrachloroethane 1,3,5-Trimethylbenzene 1,2,4-Trimethylbenzene 1,3-Dichlorobenzene 1,4-Dichlorobenzene alpha-chlorotoluene 1,2-Dichlorobenzene 1,3-Butadiene Hexane Cyclohexane Heptane Bromodichloromethane Dibromochloromethane Rpt. Limit Rpt. Limit Amount Amount (ppbv) (ug/m3) (ppbv) (ug/m3) Not Detected Not Detected Not Detected Not Detected Not Detected Not Detected Not Detected Not Detected Not Detected Not Detected Not Detected Not Detected Not Detected Not Detected Not Detected Not Detected Not Detected Not Detected Not Detected Not Detected Not Detected Not Detected Not Detected Not Detected Not Detected Not Detected Not Detected Not Detected Not Detected Not Detected Not Detected Not Detected Not Detected Not Detected Not Detected Not Detected Not Detected Not Detected Not Detected Not Detected Not Detected Not Detected Not Detected Not Detected Not Detected Not Detected Page 4 of 11
46 AIR TOXICS LTD. SAMPLE NAME: 301B ID#: A-01A MODIFIED EPA METHOD TO-14A GC/MS FULL SCAN File Name: b Dil. Factor: 133 Date of Collection: 11/10/03 Date of Analysis: 11/12/03 01:12 AM Compound Cumene Propylbenzene Chloromethane 1,2,4-Trichlorobenzene Hexachlorobutadiene Acetone Carbon Disulfide 2-Propanol trans-1,2-dichloroethene Vinyl Acetate 2-Butanone (Methyl Ethyl Ketone) Tetrahydrofuran 1,4-Dioxane 4-Methyl-2-pentanone 2-Hexanone Bromoform 4-Ethyltoluene Methyl tert-butyl ether Ethanol J = Estimated value. Container Type: 1 Liter Tedlar Bag Surrogates 1,2-Dichloroethane-d4 Toluene-d8 4-Bromofluorobenzene Rpt. Limit Rpt. Limit Amount Amount (ppbv) (ug/m3) (ppbv) (ug/m3) Not Detected Not Detected Not Detected Not Detected Not Detected Not Detected Not Detected Not Detected Not Detected Not Detected Not Detected Not Detected Not Detected Not Detected Not Detected Not Detected Not Detected Not Detected Not Detected Not Detected J 1100 J Not Detected Not Detected Not Detected Not Detected Not Detected Not Detected Not Detected Not Detected Not Detected Not Detected Method %Recovery Limits Page 5 of 11
47 AIR TOXICS LTD. SAMPLE NAME: Lab Blank ID#: A-02A MODIFIED EPA METHOD TO-14A GC/MS FULL SCAN File Name: b111108a Dil. Factor: 1.00 Date of Collection: NA Date of Analysis: 11/11/03 03:03 PM Compound Freon 12 Freon 114 Vinyl Chloride Bromomethane Chloroethane Freon 11 1,1-Dichloroethene Freon 113 Methylene Chloride 1,1-Dichloroethane cis-1,2-dichloroethene Chloroform 1,1,1-Trichloroethane Carbon Tetrachloride Benzene 1,2-Dichloroethane Trichloroethene 1,2-Dichloropropane cis-1,3-dichloropropene Toluene trans-1,3-dichloropropene 1,1,2-Trichloroethane Tetrachloroethene 1,2-Dibromoethane (EDB) Chlorobenzene Ethyl Benzene m,p-xylene o-xylene Styrene 1,1,2,2-Tetrachloroethane 1,3,5-Trimethylbenzene 1,2,4-Trimethylbenzene 1,3-Dichlorobenzene 1,4-Dichlorobenzene alpha-chlorotoluene 1,2-Dichlorobenzene 1,3-Butadiene Hexane Cyclohexane Heptane Bromodichloromethane Dibromochloromethane Rpt. Limit Rpt. Limit Amount Amount (ppbv) (ug/m3) (ppbv) (ug/m3) Not Detected Not Detected Not Detected Not Detected Not Detected Not Detected Not Detected Not Detected Not Detected Not Detected Not Detected Not Detected Not Detected Not Detected Not Detected Not Detected Not Detected Not Detected Not Detected Not Detected Not Detected Not Detected Not Detected Not Detected Not Detected Not Detected Not Detected Not Detected Not Detected Not Detected Not Detected Not Detected Not Detected Not Detected Not Detected Not Detected Not Detected Not Detected Not Detected Not Detected Not Detected Not Detected Not Detected Not Detected Not Detected Not Detected Not Detected Not Detected Not Detected Not Detected Not Detected Not Detected Not Detected Not Detected Not Detected Not Detected Not Detected Not Detected Not Detected Not Detected Not Detected Not Detected Not Detected Not Detected Not Detected Not Detected Not Detected Not Detected Not Detected Not Detected Not Detected Not Detected Not Detected Not Detected Not Detected Not Detected Not Detected Not Detected Not Detected Not Detected Not Detected Not Detected Not Detected Not Detected Page 6 of 11
48 AIR TOXICS LTD. SAMPLE NAME: Lab Blank ID#: A-02A MODIFIED EPA METHOD TO-14A GC/MS FULL SCAN File Name: b111108a Dil. Factor: 1.00 Date of Collection: NA Date of Analysis: 11/11/03 03:03 PM Compound Cumene Propylbenzene Chloromethane 1,2,4-Trichlorobenzene Hexachlorobutadiene Acetone Carbon Disulfide 2-Propanol trans-1,2-dichloroethene Vinyl Acetate 2-Butanone (Methyl Ethyl Ketone) Tetrahydrofuran 1,4-Dioxane 4-Methyl-2-pentanone 2-Hexanone Bromoform 4-Ethyltoluene Methyl tert-butyl ether Ethanol Container Type: NA - Not Applicable Surrogates 1,2-Dichloroethane-d4 Toluene-d8 4-Bromofluorobenzene Rpt. Limit Rpt. Limit Amount Amount (ppbv) (ug/m3) (ppbv) (ug/m3) Not Detected Not Detected Not Detected Not Detected Not Detected Not Detected Not Detected Not Detected Not Detected Not Detected Not Detected Not Detected Not Detected Not Detected Not Detected Not Detected Not Detected Not Detected Not Detected Not Detected Not Detected Not Detected Not Detected Not Detected Not Detected Not Detected Not Detected Not Detected Not Detected Not Detected Not Detected Not Detected Not Detected Not Detected Not Detected Not Detected Not Detected Not Detected Method %Recovery Limits Page 7 of 11
49 AIR TOXICS LTD. SAMPLE NAME: CCV ID#: A-03A MODIFIED EPA METHOD TO-14A GC/MS FULL SCAN File Name: b Dil. Factor: 1.00 Date of Collection: NA Date of Analysis: 11/11/03 11:39 AM Compound Freon 12 Freon 114 Vinyl Chloride Bromomethane Chloroethane Freon 11 1,1-Dichloroethene Freon 113 Methylene Chloride 1,1-Dichloroethane cis-1,2-dichloroethene Chloroform 1,1,1-Trichloroethane Carbon Tetrachloride Benzene 1,2-Dichloroethane Trichloroethene 1,2-Dichloropropane cis-1,3-dichloropropene Toluene trans-1,3-dichloropropene 1,1,2-Trichloroethane Tetrachloroethene 1,2-Dibromoethane (EDB) Chlorobenzene Ethyl Benzene m,p-xylene o-xylene Styrene 1,1,2,2-Tetrachloroethane 1,3,5-Trimethylbenzene 1,2,4-Trimethylbenzene 1,3-Dichlorobenzene 1,4-Dichlorobenzene alpha-chlorotoluene 1,2-Dichlorobenzene 1,3-Butadiene Hexane Cyclohexane Heptane Bromodichloromethane Dibromochloromethane %Recovery Page 8 of 11
50 AIR TOXICS LTD. SAMPLE NAME: CCV ID#: A-03A MODIFIED EPA METHOD TO-14A GC/MS FULL SCAN File Name: b Dil. Factor: 1.00 Date of Collection: NA Date of Analysis: 11/11/03 11:39 AM Compound Cumene Propylbenzene Chloromethane 1,2,4-Trichlorobenzene Hexachlorobutadiene Acetone Carbon Disulfide 2-Propanol trans-1,2-dichloroethene Vinyl Acetate 2-Butanone (Methyl Ethyl Ketone) Tetrahydrofuran 1,4-Dioxane 4-Methyl-2-pentanone 2-Hexanone Bromoform 4-Ethyltoluene Methyl tert-butyl ether Ethanol Container Type: NA - Not Applicable Surrogates 1,2-Dichloroethane-d4 Toluene-d8 4-Bromofluorobenzene %Recovery Method %Recovery Limits Page 9 of 11
51 AIR TOXICS LTD. SAMPLE NAME: LCS ID#: A-04A MODIFIED EPA METHOD TO-14A GC/MS FULL SCAN File Name: b Dil. Factor: 1.00 Date of Collection: NA Date of Analysis: 11/11/03 12:46 PM Compound Freon 12 Freon 114 Vinyl Chloride Bromomethane Chloroethane Freon 11 1,1-Dichloroethene Freon 113 Methylene Chloride 1,1-Dichloroethane cis-1,2-dichloroethene Chloroform 1,1,1-Trichloroethane Carbon Tetrachloride Benzene 1,2-Dichloroethane Trichloroethene 1,2-Dichloropropane cis-1,3-dichloropropene Toluene trans-1,3-dichloropropene 1,1,2-Trichloroethane Tetrachloroethene 1,2-Dibromoethane (EDB) Chlorobenzene Ethyl Benzene m,p-xylene o-xylene Styrene 1,1,2,2-Tetrachloroethane 1,3,5-Trimethylbenzene 1,2,4-Trimethylbenzene 1,3-Dichlorobenzene 1,4-Dichlorobenzene alpha-chlorotoluene 1,2-Dichlorobenzene 1,3-Butadiene Hexane Cyclohexane Heptane Bromodichloromethane Dibromochloromethane %Recovery Q Q Page 10 of 11
52 AIR TOXICS LTD. SAMPLE NAME: LCS ID#: A-04A MODIFIED EPA METHOD TO-14A GC/MS FULL SCAN File Name: b Dil. Factor: 1.00 Date of Collection: NA Date of Analysis: 11/11/03 12:46 PM Compound Cumene Propylbenzene Chloromethane 1,2,4-Trichlorobenzene Hexachlorobutadiene Acetone Carbon Disulfide 2-Propanol trans-1,2-dichloroethene Vinyl Acetate 2-Butanone (Methyl Ethyl Ketone) Tetrahydrofuran 1,4-Dioxane 4-Methyl-2-pentanone 2-Hexanone Bromoform 4-Ethyltoluene Methyl tert-butyl ether Ethanol Q = Exceeds Quality Control limits. Container Type: NA - Not Applicable Surrogates 1,2-Dichloroethane-d4 Toluene-d8 4-Bromofluorobenzene %Recovery Method %Recovery Limits Page 11 of 11
53 @ AN AIR TOXICS LTD. ENVIRONMENTAL ANALYTICAL LABORATORY Air Toxics Ltd. Introduces the Electronic Report Thank you for choosing Air Toxics Ltd. To better serve our customers, we are providing your report by . This document is provided in Portable Document Format which can be viewed with Acrobat Reader by Adobe. This electronic report includes the following: Work order Summary; Laboratory Narrative; Results; and Chain of Custody (copy). 180 BLUE RAVINE ROAD, SUITE B FOLSOM, CA (916) FAX (916) Hours 8:00 A.M to 6:00 P.M. Pacific to:samplereceiving@airtoxics.com
54 @ AIR TOXICS LTD. AN ENVIRONMENTAL ANALYTICAL LABORATORY WORK ORDER #: B Work Order Summary CLIENT: Mr. Paul Tower Applied Filter Technology th Ave SE Snohomish, WA BILL TO: Mr. Paul Tower Applied Filter Technology th Ave SE Snohomish, WA PHONE: FAX: DATE RECEIVED: 11/11/03 DATE COMPLETED: 11/20/03 P.O. # PROJECT # SHAW/EMCON-Anchorage Regional CONTACT: Kelly Buettner RECEIPT FRACTION # NAME TEST VAC./PRES. 01A 301B ASTM D-5504 Tedlar Bag 02A Lab Blank ASTM D-5504 NA 03A LCS ASTM D-5504 NA CERTIFIED BY: DATE: 11/21/03 Laboratory Director Certfication numbers: AR DEQ , CA NELAP CA, LA NELAP/LELAP- AI 30763, NJ NELAP - CA004 NY NELAP , UT NELAP Name of Accrediting Agency: NELAP/Florida Department of Health, Scope of Application: Clean Air Act, Accreditation number: E87680, Effective date: 07/01/03, Expiration date: 06/30/04 Air Toxics Ltd. certifies that the test results contained in this report meet all requirements of the NELAC standards This report shall not be reproduced, except in full, without the written approval of Air Toxics Ltd. 180 BLUE RAVINE ROAD, SUITE B FOLSOM, CA (916) (800) FAX (916) Page 1 of 5
55 LABORATORY NARRATIVE ASTM D-5504 Applied Filter Technology Workorder# B One 1 Liter Tedlar Bag sample was received on November 11, The laboratory performed the analysis of sulfur compounds via ASTM D-5504 using GC/SCD. The method involves direct injection of the air sample into the GC via a fixed 1.0 ml sampling loop. See the data sheets for the reporting limits for each compound. Receiving Notes The chain of custody information for sample 301B did not match the entry on the sample tag. The discrepancy was noted in the Login and the information on the chain of custody was used to process and report the sample. Sample 301B was received past the recommended hold time of 24 hours. The discrepancy was noted in the Login and the analysis proceeded. Analytical Notes Ethyl Methyl Sulfide and n-butyl Mercaptan coelute with 3-Methyl Thiophene. The corresponding peak is reported as 3-Methyl Thiophene. Definition of Data Qualifying Flags Seven qualifiers may have been used on the data analysis sheets and indicate as follows: B - Compound present in laboratory blank greater than reporting limit. J - Estimated value. E - Exceeds instrument calibration range. S - Saturated peak. Q - Exceeds quality control limits. U - Compound analyzed for but not detected above the detection limit. M - Reported value may be biased due to apparent matrix interferences. File extensions may have been used on the data analysis sheets and indicates as follows: a-file was requantified b-file was quantified by a second column and detector r1-file was requantified for the purpose of reissue Page 2 of 5
56 AIR TOXICS LTD. SAMPLE NAME: 301B ID#: B-01A SULFUR GASES BY ASTM D-5504 GC/SCD File Name: b Dil. Factor: 20.0 Compound Hydrogen Sulfide Carbonyl Sulfide Methyl Mercaptan Ethyl Mercaptan Dimethyl Sulfide Carbon Disulfide Isopropyl Mercaptan tert-butyl Mercaptan n-propyl Mercaptan Ethyl Methyl Sulfide Thiophene Isobutyl Mercaptan Diethyl Sulfide Butyl Mercaptan Dimethyl Disulfide 3-Methylthiophene Tetrahydrothiophene 2-Ethylthiophene 2,5-Dimethylthiophene Diethyl Disulfide Date of Collection: 11/10/03 Date of Analysis: 11/11/03 12:15 PM Rpt. Limit Amount (ppbv) (ppbv) Not Detected Not Detected 80 Not Detected Not Detected 80 Not Detected 80 Not Detected 80 Not Detected 80 Not Detected 80 Not Detected 80 Not Detected 80 Not Detected Not Detected 80 Not Detected 80 Not Detected 80 Not Detected Container Type: 1 Liter Tedlar Bag Page 3 of 5
57 AIR TOXICS LTD. SAMPLE NAME: Lab Blank ID#: B-02A SULFUR GASES BY ASTM D-5504 GC/SCD File Name: b Dil. Factor: 1.00 Compound Hydrogen Sulfide Carbonyl Sulfide Methyl Mercaptan Ethyl Mercaptan Dimethyl Sulfide Carbon Disulfide Isopropyl Mercaptan tert-butyl Mercaptan n-propyl Mercaptan Ethyl Methyl Sulfide Thiophene Isobutyl Mercaptan Diethyl Sulfide Butyl Mercaptan Dimethyl Disulfide 3-Methylthiophene Tetrahydrothiophene 2-Ethylthiophene 2,5-Dimethylthiophene Diethyl Disulfide Date of Collection: NA Date of Analysis: 11/11/03 09:29 AM Rpt. Limit Amount (ppbv) (ppbv) 4.0 Not Detected 4.0 Not Detected 4.0 Not Detected 4.0 Not Detected 4.0 Not Detected 4.0 Not Detected 4.0 Not Detected 4.0 Not Detected 4.0 Not Detected 4.0 Not Detected 4.0 Not Detected 4.0 Not Detected 4.0 Not Detected 4.0 Not Detected 4.0 Not Detected 4.0 Not Detected 4.0 Not Detected 4.0 Not Detected 4.0 Not Detected 4.0 Not Detected Container Type: NA - Not Applicable Page 4 of 5
58 AIR TOXICS LTD. SAMPLE NAME: LCS ID#: B-03A SULFUR GASES BY ASTM D-5504 GC/SCD File Name: b Dil. Factor: 1.00 Date of Collection: NA Date of Analysis: 11/11/03 08:34 AM Compound Hydrogen Sulfide Carbonyl Sulfide Methyl Mercaptan Ethyl Mercaptan Dimethyl Sulfide Carbon Disulfide Isopropyl Mercaptan tert-butyl Mercaptan n-propyl Mercaptan Ethyl Methyl Sulfide Thiophene Isobutyl Mercaptan Diethyl Sulfide Butyl Mercaptan Dimethyl Disulfide 3-Methylthiophene Tetrahydrothiophene 2-Ethylthiophene 2,5-Dimethylthiophene Diethyl Disulfide %Recovery Q Q = Exceeds Quality Control limits. Container Type: NA - Not Applicable Page 5 of 5
59 @ AN AIR TOXICS LTD. ENVIRONMENTAL ANALYTICAL LABORATORY Air Toxics Ltd. Introduces the Electronic Report Thank you for choosing Air Toxics Ltd. To better serve our customers, we are providing your report by . This document is provided in Portable Document Format which can be viewed with Acrobat Reader by Adobe. This electronic report includes the following: Work order Summary; Laboratory Narrative; Results; and Chain of Custody (copy). 180 BLUE RAVINE ROAD, SUITE B FOLSOM, CA (916) FAX (916) Hours 8:00 A.M to 6:00 P.M. Pacific to:samplereceiving@airtoxics.com
60 AIR TOXICS ENVIRONMENTAL ANALYTICAL LABORATORY WORK ORDER #: C Work Order Summary CLIENT: Mr. Paul Tower Applied Filter Technology th Ave SE Snohomish, WA BILL TO: Mr. Paul Tower Applied Filter Technology th Ave SE Snohomish, WA PHONE: FAX: DATE RECEIVED: 11/11/03 DATE COMPLETED: 11/21/03 P.O. # PROJECT # SHAW/EMCON-Anchorage Regional CONTACT: Kelly Buettner RECEIPT FRACTION # NAME TEST VAC./PRES. 01A 301B Modified ASTM D-1945 Tedlar Bag 02A Lab Blank Modified ASTM D-1945 NA 03A LCS Modified ASTM D-1945 NA CERTIFIED BY: DATE: 11/21/03 Laboratory Director Certfication numbers: AR DEQ , CA NELAP CA, LA NELAP/LELAP- AI 30763, NJ NELAP - CA004 NY NELAP , UT NELAP Name of Accrediting Agency: NELAP/Florida Department of Health, Scope of Application: Clean Air Act, Accreditation number: E87680, Effective date: 07/01/03, Expiration date: 06/30/04 Air Toxics Ltd. certifies that the test results contained in this report meet all requirements of the NELAC standards This report shall not be reproduced, except in full, without the written approval of Air Toxics Ltd. 180 BLUE RAVINE ROAD, SUITE B FOLSOM, CA (916) (800) FAX (916) Page 1 of 6
61 LABORATORY NARRATIVE Modified ASTM D-1945 Applied Filter Technology Workorder# C One 1 Liter Tedlar Bag sample was received on November 11, The laboratory performed analysis via modified ASTM Method D-1945 for Methane and fixed gases in natural gas using GC/FID or GC/TCD. The method involves direct injection of up to 1.0 ml of sample. See the data sheets for the reporting limits for each compound. Method modifications taken to run these samples include: Requirement Sum of total sample components Sample analysis Sample calculation Standard preparation Normalization ASTM D-1945 Sum of original values should not differ from 100.0% by more than 1.0%. Equilibrate samples to F. above source temperature at field sampling Response factor is calculated using peak height for C5 and lighter compounds. Prepared by blending pure standards Mathematically normalize results to equal 100%. ATL Modifications Sum of original values may range between %. No heating of samples is performed. Peak areas are used for all target analytes to quantitate concentrations. Purchased blend certified to ± 5% accuracy or better Unnormalized results are reported unless otherwise specified. Receiving Notes The chain of custody information for sample 301B did not match the entry on the sample tag. The discrepancy was noted in the Login and the information on the chain of custody was used to process and report the sample. Analytical Notes The presence of Carbon Monoxide may have been masked by the Methane peak in sample 301B. Propane and Propylene co-elute. Peak is quantitated as propane. Definition of Data Qualifying Flags Six qualifiers may have been used on the data analysis sheets and indicate as follows: J - Estimated value. E - Exceeds instrument calibration range. S - Saturated peak. Q - Exceeds quality control limits. U - Compound analyzed for but not detected above the detection limit. M - Reported value may be biased due to apparent matrix interferences. Page 2 of 6
62 File extensions may have been used on the data analysis sheets and indicates as follows: a-file was requantified b-file was quantified by a second column and detector r1-file was requantified for the purpose of reissue Page 3 of 6
63 AIR TOXICS LTD. SAMPLE NAME: 301B ID#: C-01A NATURAL GAS ANALYSIS BY MODIFIED ASTM D-1945 File Name: Dil. Factor: 1.00 Compound Oxygen Nitrogen Carbon Monoxide Methane Carbon Dioxide Ethane Propane Isobutane Butane Neopentane Isopentane Pentane C6+ Date of Collection: 11/10/03 Date of Analysis: 11/13/03 10:15 AM Rpt. Limit Amount (%) (%) Not Detected Not Detected Not Detected Not Detected Not Detected Not Detected Total BTU/Cu.F. = 460 Total Sp. Gravity = 0.88 Container Type: 1 Liter Tedlar Bag Page 4 of 6
64 AIR TOXICS LTD. SAMPLE NAME: Lab Blank ID#: C-02A NATURAL GAS ANALYSIS BY MODIFIED ASTM D-1945 File Name: Dil. Factor: 1.00 Compound Oxygen Nitrogen Carbon Monoxide Methane Carbon Dioxide Ethane Propane Isobutane Butane Neopentane Isopentane Pentane C6+ Date of Collection: NA Date of Analysis: 11/13/03 09:22 AM Rpt. Limit Amount (%) (%) 0.10 Not Detected 0.10 Not Detected Not Detected Not Detected Not Detected Not Detected Not Detected Not Detected Not Detected Not Detected Not Detected Not Detected Not Detected Container Type: NA - Not Applicable Page 5 of 6
65 AIR TOXICS LTD. SAMPLE NAME: LCS ID#: C-03A NATURAL GAS ANALYSIS BY MODIFIED ASTM D-1945 File Name: Dil. Factor: 1.00 Date of Collection: NA Date of Analysis: 11/13/03 08:23 AM Compound Oxygen Nitrogen Carbon Monoxide Methane Carbon Dioxide Ethane Propane Isobutane Butane Neopentane Isopentane Pentane C6+ %Recovery Container Type: NA - Not Applicable Page 6 of 6
66 @ AN AIR TOXICS LTD. ENVIRONMENTAL ANALYTICAL LABORATORY Air Toxics Ltd. Introduces the Electronic Report Thank you for choosing Air Toxics Ltd. To better serve our customers, we are providing your report by . This document is provided in Portable Document Format which can be viewed with Acrobat Reader by Adobe. This electronic report includes the following: Work order Summary; Laboratory Narrative; Results; and Chain of Custody (copy). 180 BLUE RAVINE ROAD, SUITE B FOLSOM, CA (916) FAX (916) Hours 8:00 A.M to 6:00 P.M. Pacific to:samplereceiving@airtoxics.com
67 @ AIR TOXICS LTD. AN ENVIRONMENTAL ANALYTICAL LABORATORY WORK ORDER #: D Work Order Summary CLIENT: Mr. Paul Tower Applied Filter Technology th Ave SE Snohomish, WA BILL TO: Mr. Paul Tower Applied Filter Technology th Ave SE Snohomish, WA PHONE: FAX: DATE RECEIVED: 11/11/03 DATE COMPLETED: 11/20/03 P.O. # PROJECT # SHAW/EMCON-Anchorage Regional CONTACT: Kelly Buettner FRACTION # NAME TEST 01AB 301B Siloxanes 02A Lab Blank Siloxanes 03A LCS Siloxanes CERTIFIED BY: Laboratory Director DATE: 11/21/03 Certfication numbers: AR DEQ , CA NELAP CA, LA NELAP/LELAP- AI 30763, NJ NELAP - CA004 NY NELAP , UT NELAP Name of Accrediting Agency: NELAP/Florida Department of Health, Scope of Application: Clean Air Act, Accreditation number: E87680, Effective date: 07/01/03, Expiration date: 06/30/04 Air Toxics Ltd. certifies that the test results contained in this report meet all requirements of the NELAC standards This report shall not be reproduced, except in full, without the written approval of Air Toxics Ltd. 180 BLUE RAVINE ROAD, SUITE B FOLSOM, CA (916) (800) FAX (916) Page 1 of 5
68 LABORATORY NARRATIVE Siloxanes Applied Filter Technology Workorder# D Two Vial samples were received on November 11, The laboratory performed analysis for siloxanes by GC/MS. A sample volume of 1.0 ul was injected directly onto the GC column. Initial results are in ug/ml. The units are converted to total micrograms (ug) by multiplying the result (ug/ml) by the total volume (ml) contained in the impinger. See the data sheets for the reporting limits for each compound. Receiving Notes A Temperature Blank was not included with the shipment. Temperature was measured on a representative sample and was not within 4 +/- 2 degrees C. Coolant in the form of blue ice was present. The client was notified via the login fax/ and the analysis proceeded. Analytical Notes A front and back impinger was received for each sample. Each impinger was analyzed separately. The results for each analyte were then additively combined and reported as a single concentration. The reported surrogate recovery is derived from the front impinger analysis only. Definition of Data Qualifying Flags Six qualifiers may have been used on the data analysis sheets and indicate as follows: B - Compound present in laboratory blank greater than reporting limit. J - Estimated Value. E - Exceeds instrument calibration range. S - Saturated peak. Q - Exceeds quality control limits. M - Reported value may be biased due to apparent matrix interferences. File extensions may have been used on the data analysis sheets and indicates as follows: a-file was requantified b-file was quantified by a second column and detector r1-file was requantified for the purpose of reissue Page 2 of 5
69 AIR TOXICS LTD. SAMPLE NAME: 301B ID#: D-01AB SILOXANES - GC/MS File Name: h Dil. Factor: 1.00 Compound Octamethylcyclotetrasiloxane (D4) Decamethylcylopentasiloxane (D5) Dodecamethylcyclohexasiloxane (D6) Hexamethyldisiloxane Octamethyltrisiloxane Impinger Total Volume(mL): 25.0 Container Type: Vial Surrogates Hexamethyl disiloxane -d18 Date of Collection: 11/10/03 Date of Analysis: 11/19/03 01:42 PM Rpt. Limit Amount (ug) (ug) Not Detected 50 Not Detected 25 Not Detected 25 Not Detected Method %Recovery Limits Page 3 of 5
70 AIR TOXICS LTD. SAMPLE NAME: Lab Blank ID#: D-02A SILOXANES - GC/MS File Name: h Dil. Factor: 1.00 Compound Octamethylcyclotetrasiloxane (D4) Decamethylcylopentasiloxane (D5) Dodecamethylcyclohexasiloxane (D6) Hexamethyldisiloxane Octamethyltrisiloxane Impinger Total Volume(mL): 1.00 Container Type: NA - Not Applicable Surrogates Hexamethyl disiloxane -d18 Date of Collection: NA Date of Analysis: 11/19/03 11:01 AM Rpt. Limit Amount (ug) (ug) 1.0 Not Detected 1.0 Not Detected 2.0 Not Detected 1.0 Not Detected 1.0 Not Detected Method %Recovery Limits Page 4 of 5
71 AIR TOXICS LTD. SAMPLE NAME: LCS ID#: D-03A SILOXANES - GC/MS File Name: h Dil. Factor: 1.00 Date of Collection: NA Date of Analysis: 11/19/03 10:36 AM Compound Octamethylcyclotetrasiloxane (D4) Decamethylcylopentasiloxane (D5) Dodecamethylcyclohexasiloxane (D6) Hexamethyldisiloxane Octamethyltrisiloxane Impinger Total Volume(mL): 1.00 Container Type: NA - Not Applicable Surrogates Hexamethyl disiloxane -d18 %Recovery Not Spiked Method %Recovery Limits Page 5 of 5
72 APPENDIX 3 FINANCIAL PRO FORMA FOR OPTION 1 (ELECTRICAL GENERATION)
73 SCENARIO - AA MW POWER PLANT MINIMUM 3% IRR ON 10 YR. CASH FLOW INTERCONNECT ALLOWANCE = $250,000 WHEELING CHARGE = $0.005 per KWH NO GCCS CONSTRUCTION & GCCS O&M MUSA CONTRIBUTIONS and GASB 34 DEPRECIATION SHAW GROUP EMCON/OWT, INC. - DEVELOPED PROJECTS Anchorage, Alaska ASSUMPTIONS 04-May-2004 Gas Flow at 75% of Average Generation Rate from 1/19/04 Gas Generation Model Gensets installed - Recip Engines - number of units = 3 Triton Power Pack 925 (CAT 3516) Low Emissions Gas Requirement per Genset - 50% Methane 306 SCFM Power sale price per kwh = $ per KWH Total project installed cost. $3,207,000 Wheeling cost per kwh $ per KWH PROJECT DESCRIPTION: PROJECT CAPACITY: CAPITAL COST FINANCING - loan to cost FINANCING - interest rate GASCO OWNERSHIP Triton Power Pack 925 (CAT 3516) Low 2,412 kw $1,329,602 per mw 0.00% 2.75% % UTILIZATION RATE 95.00% N:\PROJ\GASRECOV\Anchorage Alaska\Anchorage_2.4MW_Triton_15yr.qpw POWER SALE RATE POWER RATE INFLATOR WHEELING CHARGE GAS COST GAS COST INFLATOR O&M COST - Gen Plant O&M COST INFLATOR ENERGY GRANT per kwh $ per Kwh 1.00% per YR. $ per kwh $ per kwh 2.00% per YR. $ per Kwh gross 2.00% per YR. $ FINANCIAL PERFORMANCE SUMMARY OPERATING STATISTICS KILOWATT HOURS SOLD UTILIZATION FACTOR INCOME STATEMENT TOTAL REVENUES COSTS OF REVENUES GROSS PROFIT DEPRECIATION and AMORTIZATION ADMINISTRATIVE EXPENSE INCOME BEFORE DEBT SERVICE INTEREST COST INCOME BEFORE INCOME TAXES INCOME TAXES TAX CREDITS MUSA CONTRIBUTIONS NET INCOME YEAR 1 $ CENTS/KWH 17,125, % $823, , , , , (144,330) (0.84) (144,330) (0.84) , ($249,921) (0.84) 10 YEAR $ CENTS/KWH 195,070, % $9,827, ,753, ,073, ,207, , , , , $243, YEAR $ CENTS/KWH 295,433, % $15,267, ,967, ,300, ,207, , ,635, ,635, , $2,239, CASH FLOW OPERATIONS NET INCOME ADD BACK: DEPRECIATION and AMORTIZATION INTEREST COSTS ($249,921) 458,143 0 (1.46) $243,641 3,207, $2,239,325 3,207, CASH FLOW AVAILABLE FOR DEBT SERVICE 208, ,450, ,446, DEBT SERVICE PRINCIPAL PAYMENTS INTEREST COSTS TOTAL DEBT SERVICE CASH FLOW AFTER DEBT SERVICE 208, ,450, ,446, INVESTMENT CAPITAL EXPENDITURES EXISTING EQUITY IN GCCS (3,207,000) 0 (18.73) 0.00 (3,207,000) 0 (1.64) 0.00 (3,207,000) 0 (1.09) 0.00 NET NEW CAPITAL EXPENDITURES (3,207,000) (18.73) (3,207,000) (1.64) (3,207,000) (1.09) PROCEEDS OF FINANCING NET INVESTMENT REQUIREMENTS (3,207,000) (18.73) (3,207,000) (1.64) (3,207,000) (1.09) CASH AVAILABLE (REQUIRED) ($2,998,778) (17.51) $243, $2,239, FINANCIAL ANALYSIS INTERNAL RATE OF RETURN SIMPLE PAYBACK in YEARS DEBT COVERAGE RATIO % NA 8.3% NA NPV of AFTER TAX CASH FLOWS DISCOUNT RATE 5.00% DISCOUNT RATE 10.00% DISCOUNT RATE 12.00% ($2,769,649) ($2,656,105) ($2,613,224) ($301,772) ($844,481) ($1,000,037) $742,256 ($296,872) ($573,039) EARNINGS BEFORE INTEREST & TAXES (EBIT) EARNINGS BEFORE INTEREST, TAXES, DEPRECIATION & AMORTIZATION (EBITDA) ($144,330) $313,812 $571,732 $3,778,732 $2,635,419 $5,842,419 N:\PROJ\GASRECOV\Anchorage Alaska\Anchorage_2.4MW_Triton_15yr.qpw 05-May-04 05:24:24 PM
74 SCENARIO - AA MW POWER PLANT MINIMUM 3% IRR ON 10 YR. CASH FLOW INTERCONNECT ALLOWANCE = $250,000 WHEELING CHARGE = $0.005 per KWH GCCS CONSTRUCTION & GCCS O&M INCLUDED MUSA CONTRIBUTIONS and GASB 34 DEPRECIATION SHAW GROUP EMCON/OWT, INC. - DEVELOPED PROJECTS Anchorage, Alaska ASSUMPTIONS 04-May-2004 Gas Flow at 75% of Average Generation Rate from 1/19/04 Gas Generation Model Gensets installed - Recip Engines - number of units = 3 Triton Power Pack 925 (CAT 3516) Low Emissions Gas Requirement per Genset - 50% Methane 306 SCFM Power sale price per kwh = $ per KWH Total project installed cost. $4,109,000 Wheeling cost per kwh $ per KWH PROJECT DESCRIPTION: PROJECT CAPACITY: CAPITAL COST FINANCING - loan to cost FINANCING - interest rate GASCO OWNERSHIP Triton Power Pack 925 (CAT 3516) Low 2,412 kw $1,703,566 per mw 0.00% 2.75% % POWER SALE RATE POWER RATE INFLATOR WHEELING CHARGE GAS COST GAS COST INFLATOR O&M COST - Gen Plant O&M COST INFLATOR UTILIZATION RATE 95.00% ENERGY GRANT per kwh N:\PROJ\GASRECOV\Anchorage Alaska\Anchorage_2.4MW_Triton_GCCS_15yr.qpw $ per Kwh 1.00% per YR. $ per kwh $ per kwh 2.00% per YR. $ per Kwh gross 2.00% per YR. $ FINANCIAL PERFORMANCE SUMMARY OPERATING STATISTICS KILOWATT HOURS SOLD UTILIZATION FACTOR INCOME STATEMENT TOTAL REVENUES COSTS OF REVENUES GROSS PROFIT DEPRECIATION and AMORTIZATION ADMINISTRATIVE EXPENSE INCOME BEFORE DEBT SERVICE INTEREST COST INCOME BEFORE INCOME TAXES INCOME TAXES TAX CREDITS MUSA CONTRIBUTIONS NET INCOME YEAR 1 $ CENTS/KWH 17,125, % $936, , , , , (146,882) (0.86) (146,882) (0.86) , ($281,289) (0.86) 10 YEAR $ CENTS/KWH 195,070, % $11,175, ,991, ,184, ,109, , , , , $316, YEAR $ CENTS/KWH 295,433, % $17,362, ,342, ,020, ,109, , ,390, ,390, , $2,889, CASH FLOW OPERATIONS NET INCOME ADD BACK: DEPRECIATION and AMORTIZATION INTEREST COSTS ($281,289) 549,457 0 (1.64) $316,240 4,109, $2,889,313 4,109, CASH FLOW AVAILABLE FOR DEBT SERVICE 268, ,425, ,998, DEBT SERVICE PRINCIPAL PAYMENTS INTEREST COSTS TOTAL DEBT SERVICE CASH FLOW AFTER DEBT SERVICE 268, ,425, ,998, INVESTMENT CAPITAL EXPENDITURES EXISTING EQUITY IN GCCS (4,109,000) 0 (23.99) 0.00 (4,109,000) 0 (2.11) 0.00 (4,109,000) 0 (1.39) 0.00 NET NEW CAPITAL EXPENDITURES (4,109,000) (23.99) (4,109,000) (2.11) (4,109,000) (1.39) PROCEEDS OF FINANCING NET INVESTMENT REQUIREMENTS (4,109,000) (23.99) (4,109,000) (2.11) (4,109,000) (1.39) CASH AVAILABLE (REQUIRED) ($3,840,832) (22.43) $316, $2,889, FINANCIAL ANALYSIS INTERNAL RATE OF RETURN SIMPLE PAYBACK in YEARS DEBT COVERAGE RATIO % NA 8.3% NA NPV of AFTER TAX CASH FLOWS DISCOUNT RATE 5.00% DISCOUNT RATE 10.00% DISCOUNT RATE 12.00% ($3,548,186) ($3,402,748) ($3,347,820) ($381,380) ($1,078,119) ($1,277,845) $959,456 ($374,839) ($729,465) EARNINGS BEFORE INTEREST & TAXES (EBIT) EARNINGS BEFORE INTEREST, TAXES, DEPRECIATION & AMORTIZATION (EBITDA) ($146,882) $402,575 $739,939 $4,848,939 $3,390,346 $7,499,346 N:\PROJ\GASRECOV\Anchorage Alaska\Anchorage_2.4MW_Triton_GCCS_15yr.qpw 05-May-04 05:23:55 PM
75 APPENDIX 4 TOPOGRAPHIC MAP FOR OPTION 2 (ENSTAR)

 1997,")
76 LFG Pipeline Enstar Pipeline 3Anchorage Landfill Enstar Pipeline Copyright (C) 1997, Maptech, Inc.
77 Total distance: Ground distance: 990 feet 990 feet Miles Climbing: 0 feet Descending: -10 feet Elevation change: -9 feet Min/Max: 462/472 Latitude: ' 00.0'' N Longitude: ' 00.0'' E Elevation: Grade:
78 APPENDIX 5 FINANCIAL PRO FORMA FOR OPTION 2 (ENSTAR)
79 Assumptions Anchorage Medium BTU Gas Project Pipeline Injection of High BTU Gas Assumes ENSTAR will use all gas available Project Proforma April 5, 2004 N:\Document Control\project for jim bier\[anchorage ENSTAR Pipelineapdx5.xls]Dep Summary of Assumptions & Financials MG Price $4.321 per mmbtu MG Price Escalation 2.0% Capital Cost $ 2,994,800 Loan Amount $0 Gas Cost $ Gas Cost Escalation 2.0% Annual Btu Gas Quantity SCFM ,631 Ratio of Saleable BTUs to Input LFG BTUs 77% 159,970 Financing Principal Term Interest Rate No Debt n/a n/a Financial Returns 10 Years Total Cash Flow from Operations $ 3,630,259 Investment $ 2,994,800 Net Cash Flow $ 635,459 Project IRR 3.0% NPV at rate = 2.000% $ 191,961 NPV at rate = 2.500% $ 94,658 NPV at rate = 2.750% $ 47,845 NPV at rate = 3.000% $ 2,212 Pre Tax Profits $ 970,640 Average % 6.2% Minimum % -26.6% Net Income $ 635,459 Average % 2.3% Minimum % -34.8% MUSA Contributions (Municipal Utility Service Assessment) Rate 10 Year Totals Rate on Net Book Value of Assets - in mils 16 $ 215,542 Gross Revenue contribution % of Revenue 1.25% $ 119,639 $ 335,181 Depreciation per GASB 34 Method Life in Years Vehicles St. Line 5 Support Equipment St. Line 4 Machinery & Equipment St. Line 7 GCCS & Pipeline St. Line 10 5/18/2004 1:49 PM Anchorage ENSTAR Pipelineapdx5
80 Anchorage Medium BTU Gas Project Pipeline Injection of High BTU Gas ASSUMPTIONS to PRO FORMA April 5, 2004 N:\Document Control\project for jim bier\[anchorage ENSTAR Pipelineapdx5.xls]Dep Description Value Unit Financial Information Project Capital Costs $2,994,800 Equity Contribution % $2,994,800 Loan 0.00% Principal $0 Term 10 years Interest Rate 0.0% Interest Payments monthly during construction Loan Fees 0.0% MG Quantity 826 SCFM 208,631 mmbtu/yr 50.00% Methane % On-Stream Factors Utilization % 95.0% LFG to High BTU Conversion Ratio (Btu basis) 76.7% MG Price $4.321 MG Price escalator 2.0% Cost of Sales Cost of Methane Gas $ per mmbtu Cost Escalator 2.0% Electric Cost - Blower and cents / kwh $80,000 Annually Electric Escalator 2.0% Operating Costs Annually O&M Compressor/Pipeline per year $ 275,000 O&M Escalator 3.0% Gas Separation System O&M $ 0.35 per mmbtu Property Insurance 1.00% % of Value Allow of $100,000 for high pressure compressors & condensate handling General Liability Insurance 1.00% % of Revenue Administration $25,000 Income Taxes Is project subject to income taxes NO Federal Tax Rate 0% State Tax Rate 0.0% Incl. In Federal Questions 1 When do we anticipate project completion / start-up? Verity Gas curve to use and recovery rate Avg LFG at 75% 3 Does gas curve assume 50 or acres 73 acres 4 Does the $15,000 include flare, blower and electrical Includes all components of GCCS 5 Tony had an estimate of $75/ft for pipeline. What does this include? As per Jim use Kevin's $60 6 No Federal Tax 5/18/2004 1:50 PM Anchorage ENSTAR Pipelineapdx5
81 Anchorage Medium BTU Gas Project 0 Pipeline Injection of High BTU Gas Annual Proforma Methane Gas Price (MG) = $ 4.32 Escalation Year Year Assumptions CalendarYear Total Gas Curve LFG Generation - Avg 1,101 1,170 1,237 1,302 1,364 1,423 1,479 1,533 1,584 1,632 Lfg Recoverable Rate 75.0% 75% 75% 75% 75% 75% 75% 75% 75% 75% 75% Landfill Gas Available ,023 1,067 1,109 1,150 1,188 1,224 Average 50% Methane & 95% Utilization 208, , , , , , , , , ,251 High Btu Gas Sales LFG to High BTU Conversion Ratio 76.68% 76.7% 76.7% 76.7% 76.7% 76.7% 76.7% 76.7% 76.7% 76.7% 76.7% High Btu Sales mmbtus 159, , , , , , , , , ,121 2,008,701 Escalator Assumed Methane Gas Price 2% $ 4.32 $ 4.41 $ 4.50 $ 4.59 $ 4.68 $ 4.77 $ 4.87 $ 4.96 $ 5.06 $ 5.16 Income Escalator MG Sales - Landfill Gas Production 2.0% $691,229 $749,679 $808,785 $868,309 $927,492 $986,218 $1,046,520 $1,104,774 $1,164,542 $1,223,545 $9,571,094 Total Revenues 691, , , , , ,218 1,046,520 1,104,774 1,164,542 1,223,545 9,571,094 Costs of Sales Purchased Electricity - Blower/Compressor 2.0% 80,000 81,600 83,232 84,897 86,595 88,326 90,093 91,895 93,733 95, ,978 Purchased Methane Gas $ - 2.0% Costs of Sales 80,000 81,600 83,232 84,897 86,595 88,326 90,093 91,895 93,733 95, ,978 Gross Profit 611, , , , , , ,427 1,012,879 1,070,809 1,127,938 8,695,116 Expenses - Pipeline O&M - Wellfield/Comp/Pipeline - per year 2.0% 275, , , , , , , , , ,650 3,011,173 Gas Separation System O&M $ % 73,021 79,149 85,355 91,637 97, , , , , ,354 1,010,979 Property Insur. - (% of value) 1.00% 2.0% 29,948 30,547 31,158 31,781 32,417 33,065 33,726 34,401 35,089 35, ,922 General Liability Insur. (% of revenue) 1.00% 2.0% 6,912 7,647 8,415 9,215 10,039 10,889 11,786 12,690 13,644 14, ,859 Administration 2.0% 25,000 25,500 26,010 26,530 27,061 27,602 28,154 28,717 29,291 29, ,743 Personal Property Tax - n/a - assume Pollution Control Exemp Interest Total Expenses 409, , , , , , , , , ,295 4,729,677 Net Operating Profit 201, , , , , , , , , ,642 3,965,440 Less Depreciation/Amort Finance Fees (Pipeline Only) 385, , , , , , ,194 99,480 99,480 99,480 2,994,800 Net Profit Before Tax (183,846) (140,458) (96,689) (52,777) (9,403) 33,321 77, , , , , % -18.7% -12.0% -6.1% -1.0% 3.4% 7.4% 36.7% 38.5% 40.1% 10.1% MUSA Contributions Millage Rate on NBV of PPE x Prev EOY 47,917 41,754 35,591 29,427 23,264 17,101 10,938 4,775 3,183 1, ,542 Gross Revenue Rate 1.25% 8,640 9,371 10,110 10,854 11,594 12,328 13,082 13,810 14,557 15, ,639 Total Taxes 56,557 51,125 45,700 40,281 34,858 29,429 24,020 18,585 17,740 16, ,181 Net Income (240,403) (191,583) (142,390) (93,058) (44,261) 3,892 53, , , , , % -25.6% -17.6% -10.7% -4.8% 0.4% 5.1% 35.0% 36.9% 38.7% 6.6% 5/18/2004 1:50 PM Anchorage ENSTAR Pipelineapdx5
82 Anchorage Medium BTU Gas Project Pipeline Injection of High BTU Gas Annual Proforma Methane Gas Price (MG) = $ 4.32 Construction Cash Flow - Total Project 2005 Capital Expenditures (2,994,800) Loan - Add Depreciation/Amort (Pipeline & Related Costs) 385, , , , , , ,194 99,480 99,480 99,480 2,994,800 Less Principal Payment Net After Tax Cash Flow (2,994,800) 144, , , , , , , , , ,756 3,630,259 Cumulative After Tax (2,994,800) (2,850,009) (2,656,398) (2,413,593) (2,121,457) (1,780,524) (1,391,438) (952,857) (467,048) 62, ,459 Net Present Value (NPV) 2.000% $191,961 Bank Principal Balance (Yr End) , YEAR Investment Analysis - Total Project Const. Year TOTAL % Ownership % Capital Expenditures (2,994,800) (2,994,800) Construction Interest - Bond - - Cash Flow 144, , , , , , , , , ,756 3,630,259 - After Tax Cash Flow - Year (2,994,800) 144, , , , , , , , , , ,459 After Tax Cash Flow - Cum. (2,994,800) (2,850,009) (2,656,398) (2,413,593) (2,121,457) (1,780,524) (1,391,438) (952,857) (467,048) 62, ,459 Project IRR - on Cash Investment 3.01% NPV - After tax % $191, % $94, % $47,845 Discount = to IRR 3.00% $2,212 NPV and IRR reconcile Return on Revenues Average Minimum Pre Tax 6.16% % After Tax 2.27% % 5/18/2004 1:50 PM Anchorage ENSTAR Pipelineapdx5
83 Anchorage Medium BTU Gas Project Pipeline Injection of High BTU Gas Capital Estimate Detail April 5, 2004 N:\Document Control\project for jim bier\[anchorage ENSTAR Pipelineapdx5.xls]Dep Description Gas Collection System / Compressor Facility Wellfield based on $12,000 per acre asuming 73 acres $876,000 Gas Separation System 1,350,000 Compressor 650,000 2,000,000 Sub-Total Total Contingency $0 Included in above $2,876,000 Pipeline and Related Costs Blower Upgrade $0 Included in GCCS Pipeline 990 $120 per foot $118,800 Includes 2x factor for high pressure specifications D.O.T. Pipeline Safety Standards Design & Compliance $0 Included in Pipeline estimate Air Compressor Surveying Geotechnical Planning/Coordination/Legal Construction Interest Right of Way Payment Wetlands Investigation End User Upgrades Contingency - 10% $0 Included in Pipeline estimate $0 Included in Pipeline estimate $0 Included in Pipeline estimate $0 Included in Pipeline estimate $0 None assumed $0 None assumed $0 Included in Pipeline estimate $0 Allowance $0 Included in above $118,800 Project Total $2,994,800 5/18/2004 1:51 PM Anchorage ENSTAR Pipelineapdx5
84 Anchorage Medium BTU Gas Project Pipeline Injection of High BTU Gas Depreciation & Amortization Schedules April 5, 2004 N:\Document Control\project for jim bier\[anchorage ENSTAR Pipelineapdx5.xls]Dep Depreciation Amounts Amount Gas Treatment and Processing System 2,876,000 Pipeline and Related Costs 118,800 Construction Interest - Sub-Total 2,994,800 Year Depreciation $385, $385, $385, $385, $385, $385, $385, $99, $99, $99,480 $2,994,800
85 APPENDIX 6 PROPOSED BOILER SPECIFICATIONS FOR EAGLE RIVER SCHOOL
86 GAS FIRED WATER HEATER Division 15 - Section SECTION GAS FIRED WATER HEATER PART 1 - GENERAL 1.01 SUMMARY A. SECTION INCLUDES 1. Gas fired water heaters. B. RELATED SECTIONS Mechanical General Requirements Plumbing Plumbing Equipment Control System Sequences of Operation REFERENCES A. ASHRAE Standard 90.1 Energy Efficient Design of New Buildings Except New Low- Rise Residential Buildings. B. ANSI Z Gas Water Heaters. C. ASME Section 8D - Pressure Vessels. D. NFPA 54 - National Fuel Gas Code SUBMITTALS A. Submit under provisions of Section Mechanical General Requirements and Division 1. B. Product Data: 1. Provide dimension drawings of water heaters indicating components and connections to other equipment and piping. 2. Provide gas connection requirements. 3. Provide product data of components and dimension drawings of water heater stack layout. C. Calculations: 1. Provide water heater stack sizing calculations with product data to verify sizes shown on the drawings are appropriately sized for the necessary performance of the installed water heaters. Eagle River Area High School RFP
87 GAS FIRED WATER HEATER Division 15 - Section D. Closeout Submittals: 1. Project Record Documents: Record actual locations of components and piping configurations. 2. Operation and Maintenance Data: Include operation, maintenance, and inspection data, replacement part numbers and availability, and service depot location and telephone number. 3. Warranty: Submit manufacturer s warranty and ensure forms have been completed in Owner's name and registered with manufacturer QUALITY ASSURANCE A. Manufacturer Qualifications: Company specializing in manufacturing the Products specified in this section with minimum three years documented experience. B. Ensure products and installation of specified products are in conformance with recommendations and requirements of the following organizations: 1. American Gas Association (AGA). 2. American National Standards Institute (ANSI Z ). 3. American Society of Mechanical Engineers (ASME). 4. National Electrical Manufacturers'Association (NEMA). 5. National Sanitation Foundation (NSF). 6. Underwriters Laboratories (UL) COMMISSIONING A. Provide labor, materials, and equipment as required to facilitate the start up and commissioning of systems and equipment within this scope of work by factory trained service technician. B. Provide Owner with a copy of the Start-Up Certificate as part of the Operations & Maintenance Manual. PART 2 - PRODUCTS 2.01 POWER GAS WATER HEATER (WH-1, WH-2) A. Provide a non-condensing, submerged fire-tube, power gas type water heater of the size and capacity shown on the drawings. Certify that the heater complies with the requirements of ASHRAE Minimum fuel to water efficiency is 83 percent. B. Tank: 1. ASME construction and stamp for 188 psig test pressure and National Board registered 125 psig working pressure. Eagle River Area High School RFP
88 GAS FIRED WATER HEATER Division 15 - Section Lining: After tank is completely fabricated and welding is complete, abrasively clean vessel to white metal, chemically clean, and line tank with a continuous, non-porous thermosetting plastic liner. 3. Provide holiday-free tank lining construction to protect tank from corrosion due to electrolytic action in water. 4. Pure, solid copper flue tubes, with PTFE coated boiler grade steel combustion chamber. 5. Accessories; ASME and AGA rated temperature and pressure relief valve, cleanout hand hole/inspection opening, drain valve with hose end fitting. 6. Tank design to allow manway-size access to enter tank for inspection and maintenance. 7. Factory installed seismic restraint eyes mounted to tank prior to application of coating. Eyes serve as bracing points for seismic zone 4 restraint. C. Enameled sheet steel jacket over glass fiber or foam insulation. Heavy density insulation thickness and efficiency shall be as required to meet energy efficiency requirements of ASHRAE D. Burner: Sized and furnished by heater manufacturer for system capacity; continuous duty overload protected motor, complete gas train as indicated, manual gas shutoff valve, UL labeled. Provide: UL/IRI gas train designed for 8.0 inches to 14.0 inches range of natural gas pressure. Gas train assembled and shipped loose for field installation. E. Controls: Provide a complete and operating control system, including the following features: 1. Upper and lower operating thermostats. 2. High temperature limiting device. 3. Flame ignition control. 4. Flame failure control. 5. Chamber pre-purging sequence. 6. Automatic gas valve(s). 7. High temperature limiting device, manual reset (Listed over-temperature gas cutoff). 8. Low water cutoff. 9. Controls UL approved, factory wired. 10. Provide control wiring diagram. 11. Operating controls shall not also be used as safety devices. Reference ASME, CSD-1. F. Miscellaneous Features: Flame inspection port, draft regulator per manufacturer's instructions, dial thermometer, and pressure gauge mounting base, insulated subbase when required for installation on combustible floor. Eagle River Area High School RFP
89 GAS FIRED WATER HEATER Division 15 - Section G. Warranty: 15 year tank warranty; three year heat exchanger/burner module warranty; one year cost free (labor and parts) warranty. H. Manufacturer: PVI, or equal CHIMNEY (STACK) A. Provide a complete, engineered chimney system for fired equipment, including connections and adapters to smoke outlets. B. Provide prefabricated chimney system of the configuration shown on drawings, UL listed for the application, with the following features: 1. Listed for pressurized systems. 2. Stainless steel liner, and stainless steel outer jacket where exposed to outdoor weather. 3. Terminate stack with an exit cone. 4. Clearances from building elements in accordance with the chimney listing. C. Provide clean-out tees, insulating roof support, drains at bottom of risers, and other appropriate items required for proper installation and/or recommended by manufacturer. Stainless steel flashing and counter-flashing. D. Provide supports and seismic restraints in accordance with the manufacturer s UL listing. E. Submit product data, shop drawings, and calculations of proposed layout, as required in Part 1. F. Manufacturer: Metalbestos, American Metal Products, Van Packer. PART 3 - EXECUTION 3.01 INSTALLATION A. Install water heaters in accordance with manufacturer's instructions and to AGA requirements. B. Coordinate with plumbing piping and related fuel piping, flue gas venting and electrical work to achieve properly operating system. C. Coordinate water heater venting with clearances to combustibles SEISMIC RESTRAINT A. Provide seismic restraint of heater appropriate for Seismic Zone 4. See Section Mechanical Sound, Vibration and Seismic Control. Eagle River Area High School RFP
90 GAS FIRED WATER HEATER Division 15 - Section COMMISSIONING A. Perform tests and verification procedures required for the commissioning process as requested by the Owner and directed by the Owner's Commissioning Authority. END OF SECTION Eagle River Area High School RFP
91 HEAT GENERATION Division 15 - Section SECTION HEAT GENERATION PART 1 - GENERAL 1.01 SUMMARY A. Section Includes: 1. This section describes specific requirements, products and methods of execution for heat generation throughout the project. B. Related Sections: Mechanical General Requirements Basic Mechanical Materials and Methods Hydronic Piping and Specialties Control System Sequences of Operation DESCRIPTION A. This section describes specific requirements, products and methods of execution for interrelated systems necessary for the generation of heat which will be distributed to the locations shown. The method of distribution of this heat is specified elsewhere CODES A. International Mechanical Code (IMC). B. ASME Boilers and Pressure Vessel Code, Sections IV & VI. C. In addition to devices mentioned specifically herein, provide automatic boiler controls listed in Table 10-C of the International Mechanical Code, and in ASME CSD-1, latest edition, together with addenda and interpretations SUBMITTALS A. Product Data: 1. Submit product submittals for approval showing boiler physical and performance characteristics. Data shall include manufacturer's catalog cut sheets, and shall clearly indicate which model is being submitted on, and features and appurtenances being provided. 2. Submittals shall be in accordance with the requirements of Section Mechanical General Requirements and Division 1. Eagle River Area High School RFP
92 HEAT GENERATION Division 15 - Section B. Shop Drawings: 1.05 WARRANTY 1. Submitted boiler shall be dimensionally equal to scheduled product within six inches in each dimension. Maintain clearances shown on drawings. Submit fully dimensioned shop drawings of boiler room(s) at drawing scale of 1/4 inch equals one foot zero inches or larger, showing entire boiler room, equipment and clear callouts of deviations from layout shown. Provide boiler room modifications required due to dimensional and technical deviation at no additional cost to the Contract. Submit shop drawings of proposed equipment layout and base or pad for each piece of equipment. 2. If equipment to be provided exceeds the weight of the specified equipment by more than 20 percent, or if the location is to be altered, submit shop drawings of revised structural loading, noting location of pertinent loads, and obtain approval prior to providing equipment. A. Warranty workmanship, labor, and materials for a period of one year from the date of final acceptance, without limitation, except where longer warranty periods are specified in the General Conditions of the Contract. Warranty work shall be promptly coordinated and performed at the Contractor s sole expense. PART 2 - PRODUCTS 2.01 HOT WATER BOILER - CAST IRON (BLR-1, BLR-2) A. Provide factory assembled, sectional wet base, water walled cast iron boilers suitable for forced draft firing. The output of each boiler shall not be less than that noted on drawings. Required capacity shall be the gross I=B=R water rating unless otherwise indicated. Provide boilers having gross outputs greater than 4700 MBH with 5 square feet of heating surface per boiler horsepower. B. Provide the following features: Insulated metal jacket, burner mounting plate, gas tight seal between sections, flue damper assembly, ASME safety relief valve (piped down to six inches above floor), instrument panel as specified below, drain valve, flange mounted gas burner, and other items required to make boiler complete. C. Refractory based or walled boilers are not acceptable. D. Manufacturer: Weil-McLain, Burnham. 1. Submitted boiler shall be dimensionally equal to scheduled product within six inches in each dimension. Maintain clearances shown on drawings. Submit fully dimensioned shop drawings of boiler showing entire boiler room, equipment and clear callouts of deviations from layout shown. Provide boiler room modifications required due to dimensional and technical deviation at no additional cost to the Contract. Eagle River Area High School RFP
93 HEAT GENERATION Division 15 - Section GAS BURNER (FOR BOILERS BLR-1, BLR-2) A. Provide forced draft gas burner sized to match boiler rating and furnished by boiler manufacturer as part of the required complete boiler package. B. Burner shall be fully packaged and burner mounted and wired to boiler controls. C. Provide burner controls as follows: 1. Firing control shall be fully modulating type with a turn down capability of not less than two to one (2:1) as limited by a minimum exhaust gas temperature of 280 degrees F., with proven low-fire start. 2. Combustion and firing controls including Honeywell Model RM-7800 Flame Safeguard System with self-diagnostic capabilities and digital display readout. 3. Gas train shall be UL/IRI and designed for 13.2 inches to 27.7 inches range of natural gas pressure. Gas train assembled and shipped loose for field installation. 4. Peripheral controls including reset operating temperature controller, a high limit manually reset control, auxiliary Honeywell L4006E high limit control and a low water safety shut off control as specified later in this Section. 5. Indicators and alarms shall include: Power on, run, lock out, low gas pressure, high gas pressure and other indicating lights as applicable. Lock out indicator shall have provision for connection to a remote alarm or monitoring device. 6. Provide wiring between burner cabinet, controls and safety devices in accordance with applicable provisions of Division Provide panel mounted toggle switch to allow operator to manually switch between DDC and local control. The boiler controls specified in this section shall be fully coordinated with the DDC system sequences specified in Section Control System Sequences of Operation. Burner shall be capable of accepting a 4-20 ma remote signal from DDC system. D. Burner System shall be UL/IRI listed as a unit. E. Manufacturer: Weishaupt, no substitutions LOW WATER CUTOFF A. Provide for each boiler an automatic resetting McDonnell Miller #63 series, approved, low water cut-off wired in series with burner controls. Working pressure 50 psig. UL/FM approved. Provide for each boiler a McDonnell Miller TC-4 test and check assembly. B. Provide for each boiler a second, manual reset McDonnell Miller #63M series, approved, low water cut-off wired in series with burner controls. Working pressure 50 psig. UL/FM approved. C. Pipe LWCO drain down to six inches above floor. Eagle River Area High School RFP
94 HEAT GENERATION Division 15 - Section AUXILIARY HIGH LIMIT A. Provide a Honeywell Model L4006-E auxiliary high limit sensor for each boiler, wired to the boiler energy management system CHIMNEY (STACK) A. Provide a complete, engineered chimney system for fired equipment, including connections and adapters to smoke outlets. B. Provide prefabricated chimney system of the size and configuration shown on drawings, UL listed for the application, with the following features: 1. Listed for pressurized systems. 2. Stainless steel liner, and stainless steel outer jacket where exposed to outdoor weather. 3. Terminate stack with an exit cone. 4. Clearances from building elements in accordance with the chimney listing. C. Provide clean-out tees, insulating roof support, drains at bottom of risers, and other appropriate items required for proper installation and/or recommended by manufacturer. Stainless steel flashing and counterflashing. D. Provide supports and seismic restraints in accordance with the manufacturer s UL listing. E. Submit shop drawings of proposed layout. F. Manufacturer: Metalbestos, American Metal Products, Van Packer. PART 3 - EXECUTION 3.01 SETTING OF EQUIPMENT A. Set equipment on a proper base or pad as recommended by the equipment manufacturer, compatible with the building structural system. Level equipment to within recommended tolerances. Submit shop drawings of proposed equipment layout and base ANCHORING A. Anchor equipment to building structure using appropriately sized bolts. Provide seismic restraint per Section Mechanical Sound, Vibration and Seismic Control. Eagle River Area High School RFP
95 HEAT GENERATION Division 15 - Section RELIEF VENTING A. Pipe gas train and pressure regulator vent lines to the outside of the building. Multiple gas train vents from a single boiler may be manifolded together. Do not combine with any of the following venting: 1. Pipe safety valve vent lines to the outside of the building. Safety valve vents for a single boiler may be manifolded together. 2. Pipe pressure relief valve vent lines to the outside of the building. 3. Pipe ignition or main burner vent lines to the outside of the building. 4. Do not combine any vents with vents from other boilers STRUCTURAL LOAD A. Verify that building structure is adequately designed to support the entire operating weight of the equipment to be installed. If equipment to be provided exceeds the weight of the specified equipment by more than 20 percent, or if the location is to be altered, submit shop drawings of revised structural loading, noting location of pertinent loads, and obtain approval prior to providing equipment. Provide structural building modifications to accommodate proposed substitute equipment START-UP SERVICE A. After completion of the installation, start-up the heating plant by a qualified factory representative of the boiler manufacturer, furnished by the manufacturer's Alaska sales office, and provide a start-up report by this representative, including control settings, and a performance chart of the control system furnished. Submit a letter of certification with start-up report from this representative stating that the boilers are in perfect operating order and are properly adjusted. Test safety devices and record settings. Test and record oxygen, carbon dioxide, smoke stack temperature and calculate excess air and steady state efficiency. Coordinate with lead/lag control installer, and make final lead/lag setpoint adjustments. Note set points in report. Submit final data for review. Provide two hours operating instruction to authorized owner representative by this factory start-up man THERMAL EXPANSION A. Install piping to allow for normal thermal expansion and contraction. Provide anchors where necessary and as shown. Provide expansion loops, and alignment guides to suit conditions and as shown on drawings COMMISSIONING A. Perform tests and verification procedures required for the commissioning process as requested by the Owner and directed by the Owner's Commissioning Authority. END OF SECTION Eagle River Area High School RFP
96 APPENDIX 7 TOPOGRAPHIC MAP FOR OPTION 3 (EAGLE RIVER SCHOOL)


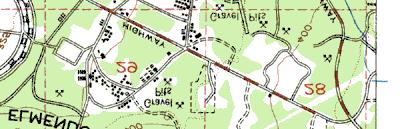


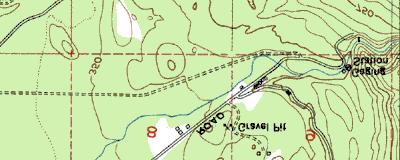


97 3Eagle River H.S. 3Anchorage Landfill Copyright (C) 1997, Maptech, Inc.
98 Total distance: Ground distance: 3236 feet 3237 feet Miles Climbing: 10 feet Descending: -43 feet Elevation change: -33 feet Min/Max: 428/471 Latitude: ' 00.0'' N Longitude: ' 00.0'' E Elevation: Grade:
99 APPENDIX 8 FINANCIAL PRO FORMA FOR OPTION 3 (EAGLE RIVER SCHOOL)
100 Anchorage Medium BTU Gas Project Gas Sales to Eagle River High School (under construction) Annual Gas Demand (flow of 105 scfm) Based on Existing School Building Project Proforma Assumptions April 5, 2004 N:\Document Control\project for jim bier\[anchorage EagleRiverSchool Pipeline apdx 8.xls]Dep Summary of Assumptions & Financials MG Price $ MG Price Escalation 2.0% Capital Cost $ 2,186,031 Loan Amount $0 Gas Cost $ Gas Cost Escalation 2.0% Gas Quantity 105 SCFM Financing Principal Term Interest Rate No Debt n/a n/a Financial Returns 10 Years Total Cash Flow from Operations $ 2,584,988 Investment $ 2,186,031 Net Cash Flow $ 398,957 Project IRR 3.0% NPV at rate = 2.000% $ 120,252 NPV at rate = 2.500% $ 58,746 NPV at rate = 2.750% $ 29,102 NPV at rate = 3.000% $ 173 Pre Tax Profits $ 644,279 Average % 11.3% Minimum % 2.5% Net Income $ 398,957 Average % 6.7% Minimum % -5.7% MUSA Contributions (Municipal Utility Service Assessment) Rate 10 Year Totals Rate on Net Book Value of Assets - in mils 16 $ 176,771 Gross Revenue contribution % of Revenue 1.25% $ 68,551 $ 245,322 Depreciation per GASB 34 Method Life in Years Vehicles St. Line 5 Support Equipment St. Line 4 Machinery & Equipment St. Line 7 GCCS & Pipeline St. Line 10 5/18/2004 1:45 PM Anchorage EagleRiverSchool Pipeline apdx 8
101 Anchorage Medium BTU Gas Project Gas Sales to Eagle River High School (under construction) ASSUMPTIONS to PRO FORMA April 5, 2004 N:\Document Control\project for jim bier\[anchorage EagleRiverSchool Pipeline apdx 8.xls]Dep Description Value Unit Financial Information Project Capital Costs 2.08 mile pipeline, 8" dia. $2,186,031 Equity Contribution % $2,186,031 Loan 0.00% Principal $0 Term 10 years Interest Rate 0.0% Interest Payments monthly during construction Loan Fees 0.0% MG Quantity 105 SCFM 26,542 mmbtu/yr 50.00% Methane % On-Stream Factors Utilization % 95.0% MG Price $ MG Price escalator 2.0% Cost of Sales Cost of Methane Gas $ per mmbtu Cost Escalator 2.0% Electric Cost - Blower and cents / kwh $40,000 Annually Electric Escalator 2.0% Operating Costs Annually O&M Wellfield/Compressor/Pipeline per year $ 150,000 O&M Escalator 3.0% Property Insurance General Liability Insurance 1.00% % of Value 1.00% % of Revenue Administration $25,000 Income Taxes Is project subject to income taxes NO Federal Tax Rate 0% State Tax Rate 0.0% Incl. In Federal 5/18/2004 1:46 PM Anchorage EagleRiverSchool Pipeline apdx 8
102 Anchorage Medium BTU Gas Project Gas Sales to Eagle River High School (under construannual Proforma Methane Gas Price (MG) = $ Escalation Year Year Assumptions CalendarYear Total Gas Curve LFG Generation - Avg 1,101 1,170 1,237 1,302 1,364 1,423 1,479 1,533 1,584 1,632 Lfg Recoverable Rate 75.0% 75% 75% 75% 75% 75% 75% 75% 75% 75% 75% Landfill Gas Available ,023 1,067 1,109 1,150 1,188 1,224 Average 50% Methane & 95% Utilization 208, , , , , , , , , ,251 School Gas Demand Average SCFM Average 50% Methane & 95% Utilization 26,542 26,542 26,542 26,542 26,542 26,542 26,542 26,542 26,542 26, ,420 Escalator Assumed Methane Gas Price 2% $ $ $ $ $ $ $ $ $ $ Income Escalator MG Sales - Landfill Gas Production 2.0% $500,848 $510,934 $521,019 $531,371 $542,253 $552,870 $564,018 $575,431 $586,844 $598,522 $5,484,108 Total Revenues 500, , , , , , , , , ,522 5,484,108 Costs of Sales Purchased Electricity - Blower/Compressor 2.0% 40,000 40,800 41,616 42,448 43,297 44,163 45,046 45,947 46,866 47, ,989 Purchased Methane Gas $ - 2.0% Costs of Sales 40,000 40,800 41,616 42,448 43,297 44,163 45,046 45,947 46,866 47, ,989 Gross Profit 460, , , , , , , , , ,718 5,046,119 Expenses - Pipeline O&M - Wellfield/Comp/Pipeline - per year 2.0% 150, , , , , , , , , ,264 1,642,458 Property Insur. - (% of value) 1.00% 2.0% 21,860 22,298 22,743 23,198 23,662 24,136 24,618 25,111 25,613 26, ,364 General Liability Insur. (% of revenue) 1.00% 2.0% 5,008 5,212 5,421 5,639 5,870 6,104 6,352 6,610 6,876 7,153 60,244 Administration 2.0% 25,000 25,500 26,010 26,530 27,061 27,602 28,154 28,717 29,291 29, ,743 Personal Property Tax - n/a - assume Pollution Control Exemp Interest Total Expenses 201, , , , , , , , , ,419 2,215,809 Net Operating Profit 258, , , , , , , , , ,299 2,830,310 Less Depreciation/Amort Finance Fees (Pipeline Only) 246, , , , , , , , , ,603 2,186,031 Net Profit Before Tax 12,519 17,664 22,709 27,914 33,538 38,793 44, , , , , % 3.5% 4.4% 5.3% 6.2% 7.0% 7.9% 24.9% 25.4% 25.8% 11.7% MUSA Contributions Millage Rate on NBV of PPE 1.60% 34,976 31,033 27,090 23,146 19,203 15,260 11,316 7,373 4,915 2, ,771 Gross Revenue Rate 1.25% 6,261 6,387 6,513 6,642 6,778 6,911 7,050 7,193 7,336 7,482 68,551 Total Taxes 41,237 37,420 33,603 29,789 25,981 22,171 18,367 14,566 12,251 9, ,322 Net Income (28,719) (19,756) (10,893) (1,875) 7,557 16,622 26, , , , , % -3.9% -2.1% -0.4% 1.4% 3.0% 4.6% 22.3% 23.3% 24.2% 7.3% 5/18/2004 1:47 PM Anchorage EagleRiverSchool Pipeline apdx 8
103 Anchorage Medium BTU Gas Project Gas Sales to Eagle River High School (under construannual Proforma Methane Gas Price (MG) = $ Construction Cash Flow - Total Project 2005 Capital Expenditures (2,186,031) Loan - Add Depreciation/Amort (Pipeline & Related Costs) 246, , , , , , , , , ,603 2,186,031 Less Principal Payment Net After Tax Cash Flow (2,186,031) 217, , , , , , , , , ,360 2,584,988 Cumulative After Tax (2,186,031) (1,968,289) (1,741,585) (1,506,018) (1,261,433) (1,007,415) (744,333) (471,777) (189,600) 100, ,957 Net Present Value (NPV) 2.000% $120,252 Bank Principal Balance (Yr End) , YEAR Investment Analysis - Total Project Const. Year TOTAL % Ownership % Capital Expenditures (2,186,031) (2,186,031) Construction Interest - Bond - - Cash Flow 217, , , , , , , , , ,360 2,584,988 - After Tax Cash Flow - Year (2,186,031) 217, , , , , , , , , , ,957 After Tax Cash Flow - Cum. (2,186,031) (1,968,289) (1,741,585) (1,506,018) (1,261,433) (1,007,415) (744,333) (471,777) (189,600) 100, ,957 Project IRR - on Cash Investment 3.00% NPV - After tax % $120, % $58, % $29,102 Discount = to IRR 3.00% $173 NPV and IRR reconcile Return on Revenues Average Minimum Pre Tax 11.27% 2.50% After Tax 6.68% -5.73% 5/18/2004 1:47 PM Anchorage EagleRiverSchool Pipeline apdx 8
104 Anchorage Medium BTU Gas Project Gas Sales to Eagle River High School (under construction) Capital Estimate Detail April 5, 2004 N:\Document Control\project for jim bier\[anchorage EagleRiverSchool Pipeline apdx 8.xls]Dep Description Gas Collection System / Compressor Facility Wellfield based on $12,000 per acre asuming 73 acres $876,000 Compressor $650,000 Sub-Total Total Contingency $0 Included in above $1,526,000 Pipeline and Related Costs Blower Upgrade $0 Included in GCCS Pipeline $51 per foot - 8'' pipeline $560,031 D.O.T. Pipeline Safety Standards Design & Compliance Air Compressor Surveying Geotechnical Planning/Coordination/Legal Construction Interest Right of Way Payment Wetlands Investigation End User Upgrades Contingency - 10% $0 Included in Pipeline estimate $0 Included in Pipeline estimate $0 Included in Pipeline estimate $0 Included in Pipeline estimate $0 Included in Pipeline estimate $0 None assumed $0 None assumed $0 Included in Pipeline estimate $100,000 Allowance $0 Included in above $660,031 Project Total $2,186,031 5/18/2004 1:48 PM Anchorage EagleRiverSchool Pipeline apdx 8
105 Anchorage Medium BTU Gas Project Gas Sales to Eagle River High School (under construction) Depreciation & Amortization Schedules April 5, 2004 N:\Document Control\project for jim bier\[anchorage EagleRiverSchool Pipeline apdx 8.xls]Dep Depreciation Amounts Amount Gas Treatment and Processing System 1,526,000 Pipeline and Related Costs 660,031 Construction Interest - Sub-Total 2,186,031 Year Depreciation $246, $246, $246, $246, $246, $246, $246, $153, $153, $153,603 $2,186,031
106 APPENDIX 9 TOPOGRAPHIC MAP FOR OPTION 4 (NATIONAL GUARD)


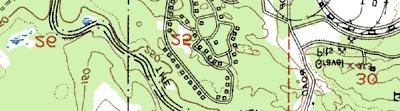

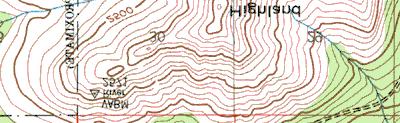


107 3Anchorage Landfill 3National Guard Armory Copyright (C) 1997, Maptech, Inc.
108 Miles 2 Total distance: 2 miles, 3875 feet Climbing: 118 feet Descending: -185 feet Ground distance: 2 miles, 3883 feet Elevation change: -66 feet Min/Max: 396/536 Latitude: ' 00.0'' N Longitude: ' 00.0'' E Elevation: Grade:
109 APPENDIX 10 FINANCIAL PRO FORMA FOR OPTION 4 (NATIONAL GUARD)
110 Assumptions Anchorage Medium BTU Gas Project Gas Sales to National Guard Armory Assumes National Guard Armory Usage is Based on Historical Demand Project Proforma April 12, 2004 N:\Document Control\project for jim bier\[anchorage NatGuard Pipeline_1 1 apdx 10.xls]Dep Summary of Assumptions & Financials MG Price $3.445 MG Price Escalation 2.0% Capital Cost $ 2,492,131 Loan Amount $0 Gas Cost $ Gas Cost Escalation 2.0% Gas Quantity 650 SCFM Financing Principal Term Interest Rate No Debt n/a n/a Financial Returns 10 Years Total Cash Flow from Operations $ 2,948,009 Investment $ 2,492,131 Net Cash Flow $ 455,878 Project IRR 3.0% NPV at rate = 2.000% $ 137,924 NPV at rate = 2.500% $ 67,757 NPV at rate = 2.750% $ 33,940 NPV at rate = 3.000% $ 937 Pre Tax Profits $ 737,061 Average % 11.5% Minimum % 3.2% Net Income $ 455,878 Average % 6.8% Minimum % -5.1% MUSA Contributions (Municipal Utility Service Assessment) Rate 10 Year Totals Rate on Net Book Value of Assets - in mils 16 $ 203,708 Gross Revenue contribution % of Revenue 1.25% $ 77,476 $ 281,184 Depreciation per GASB 34 Method Life in Years Vehicles St. Line 5 Support Equipment St. Line 4 Machinery & Equipment St. Line 7 GCCS & Pipeline St. Line 10 5/18/2004 2:08 PM Anchorage NatGuard Pipeline_1 1 apdx 10
111 Anchorage Medium BTU Gas Project Gas Sales to National Guard Armory ASSUMPTIONS to PRO FORMA April 12, 2004 N:\Document Control\project for jim bier\[anchorage NatGuard Pipeline_1 1 apdx 10.xls]Dep Description Value Unit Financial Information Project Capital Costs $2,492,131 Equity Contribution % $2,492,131 Loan 0.00% Principal $0 Term 10 years Interest Rate 0.0% Interest Payments monthly during construction Loan Fees 0.0% MG Quantity 650 SCFM 164,297 mmbtu/yr 50.00% Methane % On-Stream Factors Utilization % 95.0% MG Price $3.445 MG Price escalator 2.0% Cost of Sales Cost of Methane Gas $ per mmbtu Cost Escalator 2.0% Electric Cost - Blower and cents / kwh $40,000 Annually Electric Escalator 2.0% Operating Costs Annually O&M Compressor/Pipeline per year $ 175,000 O&M Escalator 3.0% Property Insurance General Liability Insurance 1.00% % of Value 1.00% % of Revenue Administration $25,000 Income Taxes Is project subject to income taxes NO Federal Tax Rate 0% State Tax Rate 0.0% Incl. In Federal Questions 1 When do we anticipate project completion / start-up? Verity Gas curve to use and recovery rate Avg LFG at 75% 3 Does gas curve assume 50 or acres 73 acres 4 Does the $15,000 include flare, blower and electrical Includes all components of GCCS 5 Tony had an estimate of $75/ft for pipeline. What does this include? As per Jim use Kevin's $60 6 No Federal Tax 5/18/2004 2:08 PM Anchorage NatGuard Pipeline_1 1 apdx 10
112 Anchorage Medium BTU Gas Project Gas Sales to National Guard Armory Annual Proforma Methane Gas Price (MG) = $ 3.45 Escalation Year Year Assumptions CalendarYear Total Gas Curve LFG Generation - Avg 1,101 1,170 1,237 1,302 1,364 1,423 1,479 1,533 1,584 1,632 Lfg Recoverable Rate 75.0% 75% 75% 75% 75% 75% 75% 75% 75% 75% 75% Landfill Gas Available ,023 1,067 1,109 1,150 1,188 1,224 Average 50% Methane & 95% Utilization 208, , , , , , , , , ,251 National Guard Gas Demand Average mmbtu 164, , , , , , , , , , ,297 1,642,968 Average SCFM Escalator Assumed Methane Gas Price 2% $ 3.45 $ 3.51 $ 3.58 $ 3.66 $ 3.73 $ 3.80 $ 3.88 $ 3.96 $ 4.04 $ 4.12 Income Escalator MG Sales - Landfill Gas Production 2.0% $566,002 $576,682 $588,182 $601,326 $612,827 $624,328 $637,471 $650,615 $663,759 $676,903 $6,198,095 Total Revenues 566, , , , , , , , , ,903 6,198,095 Costs of Sales Purchased Electricity - Blower/Compressor 2.0% 40,000 40,800 41,616 42,448 43,297 44,163 45,046 45,947 46,866 47, ,989 Purchased Methane Gas $ - 2.0% Costs of Sales 40,000 40,800 41,616 42,448 43,297 44,163 45,046 45,947 46,866 47, ,989 Gross Profit 526, , , , , , , , , ,099 5,760,107 Expenses - Pipeline O&M - Wellfield/Comp/Pipeline - per year 2.0% 175, , , , , , , , , ,141 1,916,201 Property Insur. - (% of value) 1.00% 2.0% 24,921 25,420 25,928 26,447 26,976 27,515 28,065 28,627 29,199 29, ,881 General Liability Insur. (% of revenue) 1.00% 2.0% 5,660 5,882 6,119 6,381 6,633 6,893 7,179 7,474 7,777 8,090 68,089 Administration 2.0% 25,000 25,500 26,010 26,530 27,061 27,602 28,154 28,717 29,291 29, ,743 Personal Property Tax - n/a - assume Pollution Control Exemp Interest Total Expenses 230, , , , , , , , , ,891 2,530,914 Net Operating Profit 295, , , , , , , , , ,208 3,229,192 Less Depreciation/Amort Finance Fees (Pipeline Only) 277, , , , , , , , , ,213 2,492,131 Net Profit Before Tax 18,351 23,509 29,369 36,738 42,364 47,870 54, , , , , % 4.1% 5.0% 6.1% 6.9% 7.7% 8.6% 23.8% 24.3% 24.8% 11.9% MUSA Contributions Millage Rate on NBV of PPE 1.60% 39,874 35,441 31,008 26,575 22,142 17,708 13,275 8,842 5,895 2, ,708 Gross Revenue Rate 1.25% 7,075 7,209 7,352 7,517 7,660 7,804 7,968 8,133 8,297 8,461 77,476 Total Taxes 46,949 42,649 38,360 34,091 29,802 25,513 21,244 16,975 14,192 11, ,184 Net Income (28,598) (19,140) (8,992) 2,647 12,562 22,357 33, , , , , % -3.3% -1.5% 0.4% 2.0% 3.6% 5.3% 21.2% 22.2% 23.1% 7.4% 5/18/2004 2:08 PM Anchorage NatGuard Pipeline_1 1 apdx 10
113 Anchorage Medium BTU Gas Project Gas Sales to National Guard Armory Annual Proforma Methane Gas Price (MG) = $ 3.45 Construction Cash Flow - Total Project 2005 Capital Expenditures (2,492,131) Loan - Add Depreciation/Amort (Pipeline & Related Costs) 277, , , , , , , , , ,213 2,492,131 Less Principal Payment Net After Tax Cash Flow (2,492,131) 248, , , , , , , , , ,799 2,948,009 Cumulative After Tax (2,492,131) (2,243,659) (1,985,729) (1,717,650) (1,437,933) (1,148,301) (848,874) (538,169) (216,314) 115, ,878 Net Present Value (NPV) 2.000% $137,924 Bank Principal Balance (Yr End) , YEAR Investment Analysis - Total Project Const. Year TOTAL % Ownership % Capital Expenditures (2,492,131) (2,492,131) Construction Interest - Bond - - Cash Flow 248, , , , , , , , , ,799 2,948,009 - After Tax Cash Flow - Year (2,492,131) 248, , , , , , , , , , ,878 After Tax Cash Flow - Cum. (2,492,131) (2,243,659) (1,985,729) (1,717,650) (1,437,933) (1,148,301) (848,874) (538,169) (216,314) 115, ,878 Project IRR - on Cash Investment 3.01% NPV - After tax % $137, % $67, % $33,940 Discount = to IRR 3.00% $937 NPV and IRR reconcile Return on Revenues Average Minimum Pre Tax 11.45% 3.24% After Tax 6.79% -5.05% 5/18/2004 2:08 PM Anchorage NatGuard Pipeline_1 1 apdx 10
114 Anchorage Medium BTU Gas Project Gas Sales to National Guard Armory Capital Estimate Detail April 12, 2004 N:\Document Control\project for jim bier\[anchorage NatGuard Pipeline_1 1 apdx 10.xls]Dep Description Gas Collection System / Compressor Facility Wellfield based on $12,000 per acre asuming 73 acres $876,000 Compressor $650,000 Sub-Total Total Contingency $0 Included in above $1,526,000 Pipeline and Related Costs Blower Upgrade $0 Included in GCCS Pipeline $60 per foot $866,131 D.O.T. Pipeline Safety Standards Design & Compliance Air Compressor Surveying Geotechnical Planning/Coordination/Legal Construction Interest Right of Way Payment Wetlands Investigation End User Upgrades Contingency - 10% $0 Included in Pipeline estimate $0 Included in Pipeline estimate $0 Included in Pipeline estimate $0 Included in Pipeline estimate $0 Included in Pipeline estimate $0 None assumed $0 None assumed $0 Included in Pipeline estimate $100,000 Allowance $0 Included in above $966,131 Project Total $2,492,131 5/18/2004 2:09 PM Anchorage NatGuard Pipeline_1 1 apdx 10
115 Anchorage Medium BTU Gas Project Gas Sales to National Guard Armory Depreciation & Amortization Schedules April 12, 2004 N:\Document Control\project for jim bier\[anchorage NatGuard Pipeline_1 1 apdx 10.xls]Dep Depreciation Amounts Amount Gas Treatment and Processing System 1,526,000 Pipeline and Related Costs 966,131 Construction Interest - Sub-Total 2,492,131 Year Depreciation $277, $277, $277, $277, $277, $277, $277, $184, $184, $184,213 $2,492,131
116 APPENDIX 11 TOPOGRAPHIC MAP FOR OPTION 5 (FT. RICHARDSON)


117 3Anchorage Landfill 3Ft. Richardson Building #726 Copyright (C) 1997, Maptech, Inc.
118 Miles Total distance: 5 miles, 1446 feet Climbing: 108 feet Latitude: ' 10.1'' N Descending: -208 feet Longitude: ' 20.4'' W Ground distance: 5 miles, 1454 feet Elevation change: -100 feet Elevation: 396 feet Min/Max: 371/534 Grade: 0%
119 APPENDIX 12 LIST OF NATURAL GAS BURNING EQUIPMENT AT FT. RICHARDSON
120 BLDG Boiler Startup Heat Burner MBH MFG Date Model Serial No Type MFG Model Serial No Max Input 726 Cleaver Brooks 5/15/2003 CBI LE L Steam Cleaver Brooks CBI LE L , Cleaver Brooks 5/15/2003 CBI LE L Steam Cleaver Brooks CBI LE L , Cleaver Brooks 5/15/2003 CBI LE L Steam Cleaver Brooks CBI LE L , Cleaver Brooks 5/15/2003 CBI LE L Steam Cleaver Brooks CBI LE L ,165 MBH 32,660 MMBtu/hr 33 LFG to Energy Cleaver Brooks 1
121 BLDG Boiler Start Date Boiler MFG Model Heat Type Burner Model Burner Make MBH Max Input MMBtu Max Input Unknown Not Avail Not Avail Gas Not Avail Not Avail Unknown Not Avail Not Avail Gas Not Avail Not Avail Unknown Not Avail Not Avail Gas Not Avail Not Avail Unknown Not Avail Not Avail Gas Not Avail Not Avail Not Avail Not Avail Gas Not Avail Not Avail Not Avail Not Avail Gas Not Avail Not Avail Unknown Not Avail Not Avail Gas Not Avail Not Avail Unknown Not Avail Not Avail Gas Not Avail Not Avail Unknown Not Avail Not Avail Gas Not Avail Not Avail Unknown Not Avail Not Avail Gas Not Avail Not Avail Unknown Not Avail Not Avail Gas Not Avail Not Avail Unknown Not Avail Not Avail Gas Not Avail Not Avail Unknown Not Avail Not Avail Gas Not Avail Not Avail Unknown Not Avail Not Avail Gas Not Avail Not Avail Unknown Not Avail Not Avail Gas Not Avail Not Avail Unknown Not Avail Not Avail Gas Not Avail Not Avail Unknown Not Avail Not Avail Gas Not Avail Not Avail Unknown Not Avail Not Avail Gas Not Avail Not Avail Not Avail Not Avail Gas Not Avail Not Avail Unknown Not Avail Not Avail Gas Not Avail Not Avail Unknown Not Avail Not Avail Gas Not Avail Not Avail /7/2003 Burnham IN6 Hydronic KIN6LNC-LE2 NA /3/2003 Burnham V904A Hydronic BCJR30A /3/2003 Burnham V904A Hydronic BCJR30A /16/2003 Burnham V904A Hydronic BCJR30A /23/2003 Burnham V904A Hydronic BCJR30A /23/2003 Burnham V904A Hydronic BCJR30A /7/2003 Burnham V904A Hydronic BCJR30A /7/2003 Burnham V904A Hydronic BCJR30A /1/2003 Burnham IN10 Hydronic KIN10LNI-LL2 NA /5/2003 Burnham IN10 Hydronic KIN10LNI-LL2 NA /5/2003 Burnham IN10 Hydronic KIN10LNI-LL2 NA /5/2003 Burnham IN11 Hydronic KIN11LNI-LL2 NA /6/2003 Burnham IN10 Hydronic KIN10LNI-LL2 NA /6/2003 Burnham IN10 Hydronic KIN10LNI-LL2 NA /5/2003 Burnham IN10 Hydronic KIN10LNI-LL2 NA /3/2003 Burnham IN10 Hydronic KIN10LNI-LL2 NA /12/2003 Burnham IN11 Hydronic KIN11LNI-LL2 NA /8/2003 Burnham IN10 Hydronic KIN10LNI-LL2 NA /12/2003 Burnham IN10 Hydronic KIN10LNI-LL2 NA /8/2003 Burnham IN10 Hydronic KIN10LNI-LL2 NA /8/2003 Burnham IN10 Hydronic KIN10LNI-LL2 NA /8/2003 Burnham IN10 Hydronic KIN10LNI-LL2 NA /6/2003 Burnham IN10 Hydronic KIN10LNI-LL2 NA /6/2003 Burnham IN10 Hydronic KIN10LNI-LL2 NA /12/2003 Burnham IN10 Hydronic KIN10LNI-LL2 NA /22/2003 Burnham IN10 Hydronic KIN10LNI-LL2 NA /13/2003 Burnham IN10 Hydronic KIN10LNI-LL2 NA /16/2003 Burnham IN10 Hydronic KIN10LNI-LL2 NA /14/2003 Burnham IN10 Hydronic KIN10LNI-LL2 NA /14/2003 Burnham IN10 Hydronic KIN10LNI-LL2 NA LFG to Energy Misc Boilers Burners 1
122 BLDG Boiler Start Date Boiler MFG Model Heat Type Burner Model Burner Make MBH Max Input MMBtu Max Input 250 5/16/2003 Burnham IN10 Hydronic KIN10LNI-LL2 NA /12/2003 Burnham IN10 Hydronic KIN10LNI-LL2 NA /19/2003 Burnham IN10 Hydronic KIN10LNI-LL2 NA /19/2003 Burnham IN10 Hydronic KIN10LNI-LL2 NA /15/2003 Burnham IN10 Hydronic KIN10LNI-LL2 NA /14/2003 Burnham IN10 Hydronic KIN10LNI-LL2 NA /15/2003 Burnham IN10 Hydronic KIN10LNI-LL2 NA /15/2003 Burnham IN10 Hydronic KIN10LNI-LL2 NA /15/2003 Burnham IN10 Hydronic KIN10LNI-LL2 NA /14/2003 Burnham IN10 Hydronic KIN10LNI-LL2 NA /19/2003 Burnham IN10 Hydronic KIN10LNI-LL2 NA /19/2003 Burnham IN10 Hydronic KIN10LNI-LL2 NA /20/2003 Burnham IN10 Hydronic KIN10LNI-LL2 NA /21/2003 Burnham IN10 Hydronic KIN10LNI-LL2 NA /21/2003 Burnham IN10 Hydronic KIN10LNI-LL2 NA /20/2003 Burnham IN10 Hydronic KIN10LNI-LL2 NA /31/2003 Burnham IN10 Hydronic KIN10LNI-LL2 NA /22/2003 Burnham IN10 Hydronic KIN10LNI-LL2 NA /31/2003 Burnham IN10 Hydronic KIN10LNI-LL2 NA /22/2003 Burnham IN11 Hydronic KIN11LNI-LL2 NA /31/2003 Burnham IN10 Hydronic KIN10LNI-LL2 NA /20/2003 Burnham IN10 Hydronic KIN10LNI-LL2 NA /9/2003 Burnham IN5 Hydronic KIN5LNS-LE2 NA /28/2003 Burnham IN10 Hydronic KIN10LNI-LL2 NA /29/2003 Burnham IN10 Hydronic KIN10LNI-LL2 NA /30/2003 Burnham IN10 Hydronic KIN10LNI-LL2 NA /21/2003 Burnham IN10 Hydronic KIN10LNI-LL2 NA /29/2003 Burnham IN10 Hydronic KIN10LNI-LL2 NA /20/2003 Burnham IN10 Hydronic KIN10LNI-LL2 NA /27/2003 Burnham IN10 Hydronic KIN10LNI-LL2 NA /27/2003 Burnham IN10 Hydronic KIN10LNI-LL2 NA /22/2003 Burnham IN10 Hydronic KIN10LNI-LL2 NA /22/2003 Burnham IN10 Hydronic KIN10LNI-LL2 NA /21/2003 Burnham IN10 Hydronic KIN10LNI-LL2 NA /30/2003 Burnham IN10 Hydronic KIN10LNI-LL2 NA /29/2003 Burnham IN10 Hydronic KIN10LNI-LL2 NA /4/2003 Burnham IN10 Hydronic KIN10LNI-LL2 NA /4/2003 Burnham IN10 Hydronic KIN10LNI-LL2 NA /9/2003 Burnham IN10 Hydronic KIN10LNI-LL2 NA /3/2003 Burnham IN10 Hydronic KIN10LNI-LL2 NA /5/2003 Burnham IN10 Hydronic KIN10LNI-LL2 NA /5/2003 Burnham IN10 Hydronic KIN10LNI-LL2 NA /6/2003 Burnham IN10 Hydronic KIN10LNI-LL2 NA /5/2003 Burnham IN6 Hydronic KIN6LNC-LE2 NA /3/2003 Burnham IN10 Hydronic KIN10LNI-LL2 NA /28/2003 Burnham IN10 Hydronic KIN10LNI-LL2 NA /6/2003 Burnham IN10 Hydronic KIN10LNI-LL2 NA /6/2003 Burnham IN10 Hydronic KIN10LNI-LL2 NA /4/2003 Burnham V904A Hydronic BCJR30A /5/2003 Burnham V904A Hydronic BCJR30A /9/2003 Burnham V904A Hydronic BCJR30A LFG to Energy Misc Boilers Burners 2
123 BLDG Boiler Start Date Boiler MFG Model Heat Type Burner Model Burner Make MBH Max Input MMBtu Max Input 343 6/9/2003 Burnham V904A Hydronic BCJR30A /10/2003 Burnham V904A Hydronic BCJR30A /10/2003 Burnham V904A Hydronic BCJR30A /4/2003 Burnham V904A Hydronic BCJR30A /10/2003 Burnham V904A Hydronic BCJR30A /11/2003 Burnham V904A Hydronic BCJR30A /5/2003 Burnham V904A Hydronic BCJR30A /4/2003 Burnham V904A Hydronic BCJR30A /17/2003 Burnham V904A Hydronic BCJR30A /11/2003 Burnham V904A Hydronic BCJR30A /11/2003 Burnham V904A Hydronic BCJR30A /12/2003 Burnham V904A Hydronic BCJR30A /4/2003 Burnham V904A Hydronic BCJR30A /13/2003 Burnham V904A Hydronic BCJR30A /13/2003 Burnham V904A Hydronic BCJR30A /16/2003 Burnham V904A Hydronic BCJR30A /16/2003 Burnham V904A Hydronic BCJR30A /18/2003 Burnham V904A Hydronic BCJR30A /18/2003 Burnham V904A Hydronic BCJR30A /20/2003 Burnham V904A Hydronic BCJR30A /26/2003 Burnham V904A Hydronic BCJR30A /17/2003 Burnham V904A Hydronic BCJR30A /20/2003 Burnham V904A Hydronic BCJR30A /20/2003 Burnham V904A Hydronic BCJR30A /19/2003 Burnham V904A Hydronic BCJR30A /31/2003 Burnham V905A Hydronic BCJR30A /29/2003 Burnham V905A Hydronic BCJR30A /23/2003 Burnham V904A Hydronic BCJR30A /28/2003 Burnham V905A Hydronic BCJR30A /18/2003 Burnham V905A Hydronic BCJR30A /17/2003 Burnham V904A Hydronic BCJR30A /16/2003 Burnham V905A Hydronic BCJR30A /14/2003 Burnham V905A Hydronic BCJR30A /7/2003 Burnham V904A Hydronic BCJR30A /8/2003 Burnham V905A Hydronic BCJR30A /4/2003 Burnham V905A Hydronic BCJR30A /2/2003 Burnham V905A Hydronic BCJR30A /3/2003 Burnham V905A Hydronic BCJR30A /21/2003 Burnham IN10 Hydronic KIN10LNI-LL2 NA /21/2003 Burnham IN10 Hydronic KIN10LNI-LL2 NA /21/2003 Burnham IN10 Hydronic KIN10LNI-LL2 NA /22/2003 Burnham IN10 Hydronic KIN10LNI-LL2 NA /22/2003 Burnham IN11 Hydronic KIN11LNI-LL2 NA /22/2003 Burnham IN10 Hydronic KIN10LNI-LL2 NA /24/2003 Burnham IN10 Hydronic KIN10LNI-LL2 NA /24/2003 Burnham IN10 Hydronic KIN10LNI-LL2 NA /23/2003 Burnham IN10 Hydronic KIN10LNI-LL2 NA /23/2003 Burnham IN10 Hydronic KIN10LNI-LL2 NA /24/2003 Burnham IN10 Hydronic KIN10LNI-LL2 NA /23/2003 Burnham IN10 Hydronic KIN10LNI-LL2 NA /23/2003 Burnham IN10 Hydronic KIN10LNI-LL2 NA LFG to Energy Misc Boilers Burners 3
124 BLDG Boiler Start Date Boiler MFG Model Heat Type Burner Model Burner Make MBH Max Input MMBtu Max Input 418 4/22/2003 Burnham IN10 Hydronic KIN10LNI-LL2 NA /28/2003 Burnham IN10 Hydronic KIN10LNI-LL2 NA /28/2003 Burnham IN10 Hydronic KIN10LNI-LL2 NA /29/2003 Burnham IN10 Hydronic KIN10LNI-LL2 NA /29/2003 Burnham IN10 Hydronic KIN10LNI-LL2 NA /29/2003 Burnham IN10 Hydronic KIN10LNI-LL2 NA /29/2003 Burnham IN10 Hydronic KIN10LNI-LL2 NA /28/2003 Burnham IN10 Hydronic KIN10LNI-LL2 NA /25/2003 Burnham IN10 Hydronic KIN10LNI-LL2 NA /25/2003 Burnham IN10 Hydronic KIN10LNI-LL2 NA /25/2003 Burnham IN10 Hydronic KIN10LNI-LL2 NA /28/2003 Burnham IN10 Hydronic KIN10LNI-LL2 NA /25/2003 Burnham IN10 Hydronic KIN10LNI-LL2 NA /29/2003 Burnham IN10 Hydronic KIN10LNI-LL2 NA /29/2003 Burnham IN10 Hydronic KIN10LNI-LL2 NA /29/2003 Burnham IN10 Hydronic KIN10LNI-LL2 NA /30/2003 Burnham IN10 Hydronic KIN10LNI-LL2 NA /29/2003 Burnham IN10 Hydronic KIN10LNI-LL2 NA /30/2003 Burnham IN10 Hydronic KIN10LNI-LL2 NA /30/2003 Burnham IN10 Hydronic KIN10LNI-LL2 NA /30/2003 Burnham IN10 Hydronic KIN10LNI-LL2 NA /30/2003 Burnham IN10 Hydronic KIN10LNI-LL2 NA /31/2003 Burnham IN10 Hydronic KIN10LNI-LL2 NA /31/2003 Burnham IN10 Hydronic KIN10LNI-LL2 NA /30/2003 Burnham IN10 Hydronic KIN10LNI-LL2 NA /30/2003 Burnham IN10 Hydronic KIN10LNI-LL2 NA /1/2003 Burnham IN10 Hydronic KIN10LNI-LL2 NA /1/2003 Burnham IN10 Hydronic KIN10LNI-LL2 NA /14/2003 Burnham IN10 Hydronic KIN10LNI-LL2 NA /14/2003 Burnham IN10 Hydronic KIN10LNI-LL2 NA /16/2003 Burnham IN10 Hydronic KIN10LNI-LL2 NA /15/2003 Burnham IN10 Hydronic KIN10LNI-LL2 NA /15/2003 Burnham IN10 Hydronic KIN10LNI-LL2 NA /16/2003 Burnham IN10 Hydronic KIN10LNI-LL2 NA /15/2003 Burnham IN10 Hydronic KIN10LNI-LL2 NA /17/2003 Burnham IN10 Hydronic KIN10LNI-LL2 NA /17/2003 Burnham IN10 Hydronic KIN10LNI-LL2 NA /18/2003 Burnham IN10 Hydronic KIN10LNI-LL2 NA /17/2003 Burnham IN10 Hydronic KIN10LNI-LL2 NA /16/2003 Burnham IN10 Hydronic KIN10LNI-LL2 NA /16/2003 Burnham IN10 Hydronic KIN10LNI-LL2 NA /21/2003 Burnham IN10 Hydronic KIN10LNI-LL2 NA /28/2003 Burnham IN10 Hydronic KIN10LNI-LL2 NA /28/2003 Burnham IN10 Hydronic KIN10LNI-LL2 NA /28/2003 Burnham IN10 Hydronic KIN10LNI-LL2 NA /23/2003 Burnham IN10 Hydronic KIN10LNI-LL2 NA /29/2003 Burnham IN10 Hydronic KIN10LNI-LL2 NA /29/2003 Burnham IN10 Hydronic KIN10LNI-LL2 NA /4/2003 Burnham IN10 Hydronic KIN10LNI-LL2 NA /4/2003 Burnham IN10 Hydronic KIN10LNI-LL2 NA /18/2003 Burnham IN10 Hydronic KIN10LNI-LL2 NA LFG to Energy Misc Boilers Burners 4
125 BLDG Boiler Start Date Boiler MFG Model Heat Type Burner Model Burner Make MBH Max Input MMBtu Max Input 538 4/18/2003 Burnham IN10 Hydronic KIN10LNI-LL2 NA /9/2003 Burnham V905A Hydronic BCJR30A /16/2003 Burnham IN11 Hydronic BCJR30A-10 N/A /24/2003 Burnham V903A Hydronic BCJR30A /29/2003 Burnham V904A Hydronic BCJR30A /30/2003 Burnham V905A Hydronic BCJR30A /1/2003 Burnham V905A Hydronic BCJR30A /28/2003 Burnham V1111 Hydronic BCCR3-G , /15/2003 Burnham V1109 Hydronic BCC2-G , /4/2003 Burnham V905A Hydronic BCJR30A /4/2003 Burnham V904A Hydronic BCJR30A M108 8/7/2003 Burnham V1112 Hydronic BCCR3-G , M108 8/7/2003 Burnham V1112 Hydronic BCCR3-G , M124 7/15/2003 Burnham V1115 Hydronic BCCR3-G , M124 7/15/2003 Burnham V1115 Hydronic BCCR3-G , M143 7/18/2003 Burnham V1113 Hydronic BCCR3-G , M143 7/18/2003 Burnham V1113 Hydronic BCCR3-G , ? NA NA Infared CRV B-10 NA ? NA NA Infared CRV B-10 NA ? NA NA Infared CRV B-10 NA ? NA NA Infared CRV B-10 NA /7/2003 Burnham V1112 Steam BCCR3-G-25B , /1/2003 Burnham V1112 Steam BCCR3-G , /14/2003 Burnham V1113 Steam BCCR3-G , /6/2003 Burnham V1106 Steam BCJR50A , /12/2003 Burnham V1107 Steam BCJR50A , /12/2003 Burnham V1107 Steam BCJR50A , /19/2003 Burnham V1104 Steam BCJR30A /12/2003 Burnham V1110 Steam BCCR2-G-20A , /12/2003 Burnham V1110 Steam BCCR2-G-20A , /12/2003 Burnham V1112 Steam BCCR3-G , /21/2003 Burnham V909A Steam BCJR50A , /5/2003 Burnham V911A Steam BCC2G-20B , /5/2003 Burnham V911A Steam BCC2G-20B , /14/2003 Burnham V1116 Steam BCCR3-G , /14/2003 Burnham V1116 Steam BCCR3-G , /14/2003 Burnham V1116 Steam BCCR3-G , /10/2003 Burnham V1118 Steam BCCR3-G-25B , /10/2003 Burnham V1118 Steam BCCR3-G-25B , /10/2003 Burnham V1118 Steam BCCR3-G-25B , /10/2003 Burnham V904A Steam BCJR30A /30/2003 Burnham V1115 Steam BCCR3-G , /30/2003 Burnham V1115 Steam BCCR3-G , /2/2003 Burnham V1115 Steam BCCR3-G , /7/2003 Burnham V1115 Steam BCCR3-G , /7/2003 Burnham V1115 Steam BCCR3-G , /7/2003 Burnham V1115 Steam BCCR3-G , /8/2003 Burnham V1115 Steam BCCR3-G , /8/2003 Burnham V1115 Steam BCCR3-G , /3/2003 Burnham V1115 Steam BCCR3-G , /3/2003 Burnham V1115 Steam BCCR3-G , LFG to Energy Misc Boilers Burners 5
126 BLDG Boiler Start Date Boiler MFG Model Heat Type Burner Model Burner Make MBH Max Input MMBtu Max Input 630 9/3/2003 Burnham V1115 Steam BCCR3-G , /3/2003 Burnham V1115 Steam BCCR3-G , /4/2003 Burnham V1115 Steam BCCR3-G , /4/2003 Burnham V1115 Steam BCCR3-G , /11/2003 Burnham V904A Steam BCJR30A /31/2003 Burnham V1104 Steam BCJR30A /17/2003 Burnham V1107 Steam BCJR50A , /16/2003 Burnham V1114 Steam BCCR3-G , /31/2003 Burnham V1115 Steam BCCR3-G , /31/2003 Burnham V1115 Steam BCCR3-G , /12/2003 Burnham V1115 Steam BCCR3-G , /12/2003 Burnham V1115 Steam BCCR3-G , /13/2003 Burnham V1115 Steam BCCR3-G , /13/2003 Burnham V1115 Steam BCCR3-G , /28/2003 Burnham V1115 Steam BCCR3-G , /28/2003 Burnham V1115 Steam BCCR3-G , /28/2003 Burnham V1115 Steam BCCR3-G , /28/2003 Burnham V1115 Steam BCCR3-G , /14/2003 Burnham V1115 Steam BCCR3-G , /14/2003 Burnham V1115 Steam BCCR3-G , /9/2003 Burnham V1121 Steam BCCR3-G-25B , /9/2003 Burnham V1121 Steam BCCR3-G-25B , /9/2003 Burnham V1118 Steam BCCR3-G-25B , /9/2003 Burnham V1106 Steam BCJR50A , /15/2003 Burnham IN10 Steam KIN10LNI-LL /11/2003 Burnham V1113 Steam BCCR3-G , /11/2003 Burnham V1113 Steam BCCR3-G , /27/2003 Burnham V1106 Steam BCJR50A , /30/2003 Burnham V1113 Steam BCCR3-G , /7/2003 Burnham V1113 Steam BCCR3-G , /30/2003 Burnham V1106 Steam BCJR50A , /3/2003 Burnham V1104 Steam BCJR30A /25/2003 Burnham V1113 Steam BCCR3-G , /19/2003 Burnham V1106 Steam BCJR50A , /29/2003 Burnham V1113 Steam BCCR3-G , /28/2003 Burnham V1113 Steam BCCR3-G , /1/2003 Burnham V1106 Steam BCJR50A , /31/2003 Burnham V1112 Steam BCCR3-G , /31/2003 Burnham V1112 Steam BCCR3-G , /7/2003 Burnham V1115 Steam BCCR3-G , /20/2003 Burnham V1116 Steam BCCR3-G , /20/2003 Burnham V1116 Steam BCCR3-G , /20/2003 Burnham V1118 Steam BCCR3-G-25B , /20/2003 Burnham V1118 Steam BCCR3-G-25B , /20/2003 Burnham V1118 Steam BCCR3-G-25B , /20/2003 Burnham V1118 Steam BCCR3-G-25B , /25/2003 Burnham V1118 Steam BCCR3-G-25B , /25/2003 Burnham V1118 Steam BCCR3-G-25B , /19/2003 Burnham V1106 Steam BCJR50A , /26/2003 Burnham V1118 Steam BCCR3-G-25B , /12/2003 Burnham V1113 Steam BCCR3-G , LFG to Energy Misc Boilers Burners 6
127 BLDG Boiler Start Date Boiler MFG Model Heat Type Burner Model Burner Make MBH Max Input MMBtu Max Input 984 5/7/2003 Burnham V1104 Steam BCJR30A , /8/2003 Burnham V905A Steam BCJR30A /16/2003 Burnham V904A Steam BCJR30A /11/2003 Burnham V904A Steam BCJR30A /9/2003 Burnham V904A Steam BCJR30A /11/2003 Burnham V904A Steam BCJR30A /12/2003 Burnham V904A Steam BCJR30A /20/2003 Burnham V1111 Steam BCCR3-G , /9/2003 Burnham V1107 Steam BCJR50A-15 N/A 1, /21/2003 Burnham V904A Steam BCJR30A , MBH MMBtu/hr BLDG Boiler Start Date Boiler MFG Model Heat Type Burner Model Burner Make MBH Max Input MMBtu Max Input Eric City Water Tube Boilers NA Gas NA NA 187 Eric City Water Tube Boilers NA Gas NA NA 187 Eric City Water Tube Boilers NA Gas NA NA 187 Eric City Water Tube Boilers NA Gas NA NA MMBtu/hr LFG to Energy Misc Boilers Burners 7
128 BLDG Hot Water Heater Start Date Hot Water Heater MFG Model Heat Type Burner Model Burner Make MBH Max Input MMBtu Max Input T2 7/9/2003 NA NA Air AKGH /3/2003 Bock 241PGES Gas NA NA /3/2003 Bock 241PGES Gas NA NA /3/2003 Lochinvar RWN199PM Gas RJS080 XJ /3/2003 Lochinvar RWN199PM Gas RJS080 XJ /16/2003 Lochinvar RWN199PM Gas RJS080 XJ /16/2003 Lochinvar RWN199PM Gas RJS080 XJ /23/2003 Bock 241PGES Gas NA NA /23/2003 Bock 241PGES Gas NA NA /23/2003 Lochinvar RWN199PM Gas RJS080 XJ /23/2003 Lochinvar RWN199PM Gas RJS080 XJ /7/2003 Lochinvar RWN199PM Gas RJS080 XJ /7/2003 Lochinvar RWN199PM Gas RJS080 XJ /1/2003 Lochinvar RWN199PM Gas RJS080 XJ /5/2003 Lochinvar RWN199PM Gas RJS080 XJ /5/2003 Lochinvar RWN199PM Gas RJS080 XJ /5/2003 Lochinvar RWN199PM Gas RJS080 XJ /6/2003 Lochinvar RWN199PM Gas RJS080 XJ /6/2003 Lochinvar RWN199PM Gas RJS080 XJ /5/2003 Lochinvar RWN199PM Gas RJS080 XJ /3/2003 Lochinvar RWN199PM Gas RJS080 XJ /12/2003 Lochinvar RWN199PM Gas RJS080 XJ /8/2003 Lochinvar RWN199PM Gas RJS080 XJ /12/2003 Lochinvar RWN199PM Gas RJS080 XJ /8/2003 Lochinvar RWN199PM Gas RJS080 XJ /8/2003 Lochinvar RWN199PM Gas RJS080 XJ /8/2003 Lochinvar RWN199PM Gas RJS080 XJ /6/2003 Lochinvar RWN199PM Gas RJS080 XJ /6/2003 Lochinvar RWN199PM Gas RJS080 XJ /12/2003 Lochinvar RWN199PM Gas RJS080 XJ /22/2003 Lochinvar RWN199PM Gas RJS080 XJ /13/2003 Lochinvar RWN199PM Gas RJS080 XJ /16/2003 Lochinvar RWN199PM Gas RJS080 XJ /14/2003 Lochinvar RWN199PM Gas RJS080 XJ /14/2003 Lochinvar RWN199PM Gas RJS080 XJ /16/2003 Lochinvar RWN199PM Gas RJS080 XJ /12/2003 Lochinvar RWN199PM Gas RJS080 XJ /19/2003 Lochinvar RWN199PM Gas RJS080 XJ /19/2003 Lochinvar RWN199PM Gas RJS080 XJ /15/2003 Lochinvar RWN199PM Gas RJS080 XJ /14/2003 Lochinvar RWN199PM Gas RJS080 XJ /15/2003 Lochinvar RWN199PM Gas RJS080 XJ /15/2003 Lochinvar RWN199PM Gas RJS080 XJ /15/2003 Lochinvar RWN199PM Gas RJS080 XJ /14/2003 Lochinvar RWN199PM Gas RJS080 XJ /19/2003 Lochinvar RWN199PM Gas RJS080 XJ /19/2003 Lochinvar RWN199PM Gas RJS080 XJ /20/2003 Lochinvar RWN199PM Gas RJS080 XJ /21/2003 Lochinvar RWN199PM Gas RJS080 XJ /21/2003 Lochinvar RWN199PM Gas RJS080 XJ LFG to Energy Hot H20 Heaters 1
129 BLDG Hot Water Heater Start Date Hot Water Heater MFG Model Heat Type Burner Model Burner Make MBH Max Input MMBtu Max Input 285 5/20/2003 Lochinvar RWN199PM Gas RJS080 XJ /31/2003 Lochinvar RWN199PM Gas RJS080 XJ /22/2003 Lochinvar RWN199PM Gas RJS080 XJ /31/2003 Lochinvar RWN199PM Gas RJS080 XJ /22/2003 Lochinvar RWN199PM Gas RJS080 XJ /31/2003 Lochinvar RWN199PM Gas RJS080 XJ /20/2003 Lochinvar RWN199PM Gas RJS080 XJ /28/2003 Lochinvar RWN199PM Gas RJS080 XJ /29/2003 Lochinvar RWN199PM Gas RJS080 XJ /30/2003 Lochinvar RWN199PM Gas RJS080 XJ /21/2003 Lochinvar RWN199PM Gas RJS080 XJ /29/2003 Lochinvar RWN199PM Gas RJS080 XJ /20/2003 Lochinvar RWN199PM Gas RJS080 XJ /27/2003 Lochinvar RWN199PM Gas RJS080 XJ /27/2003 Lochinvar RWN199PM Gas RJS080 XJ /22/2003 Lochinvar RWN199PM Gas RJS080 XJ /22/2003 Lochinvar RWN199PM Gas RJS080 XJ /21/2003 Lochinvar RWN199PM Gas RJS080 XJ /30/2003 Lochinvar RWN199PM Gas RJS080 XJ /29/2003 Lochinvar RWN199PM Gas RJS080 XJ /4/2003 Lochinvar RWN199PM Gas RJS080 XJ /4/2003 Lochinvar RWN199PM Gas RJS080 XJ /9/2003 Lochinvar RWN199PM Gas RJS080 XJ /3/2003 Lochinvar RWN199PM Gas RJS080 XJ /5/2003 Lochinvar RWN199PM Gas RJS080 XJ /5/2003 Lochinvar RWN199PM Gas RJS080 XJ /6/2003 Lochinvar RWN199PM Gas RJS080 XJ /5/2003 Lochinvar RWN199PM Gas RJS080 ZB /3/2003 Lochinvar RWN199PM Gas RJS080 XJ /28/2003 Lochinvar RWN199PM Gas RJS080 XJ /6/2003 Lochinvar RWN199PM Gas RJS080 XJ /6/2003 Lochinvar RWN199PM Gas RJS080 XJ /4/2003 Lochinvar RWN199PM Gas RJS080 XJ /5/2003 Lochinvar RWN199PM Gas RJS080 XJ /9/2003 Lochinvar RWN199PM Gas RJS080 XJ /9/2003 Lochinvar RWN199PM Gas RJS080 XJ /10/2003 Lochinvar RWN199PM Gas RJS080 XJ /10/2003 Lochinvar RWN199PM Gas RJS080 XJ /4/2003 Lochinvar RWN199PM Gas RJS080 XJ /10/2003 Lochinvar RWN199PM Gas RJS080 XJ /11/2003 Lochinvar RWN199PM Gas RJS080 XJ /5/2003 Lochinvar RWN199PM Gas RJS080 XJ /4/2003 Lochinvar RWN199PM Gas RJS080 XJ /17/2003 Lochinvar RWN199PM Gas RJS080 XJ /11/2003 Lochinvar RWN199PM Gas RJS080 XJ /11/2003 Lochinvar RWN199PM Gas RJS080 XJ /12/2003 Lochinvar RWN199PM Gas RJS080 XJ /4/2003 Lochinvar RWN199PM Gas RJS080 XJ /13/2003 Lochinvar RWN199PM Gas RJS080 XJ /13/2003 Lochinvar RWN199PM Gas RJS080 XJ LFG to Energy Hot H20 Heaters 2
130 BLDG Hot Water Heater Start Date Hot Water Heater MFG Model Heat Type Burner Model Burner Make MBH Max Input MMBtu Max Input 363 6/16/2003 Lochinvar RWN199PM Gas RJS080 XJ /16/2003 Lochinvar RWN199PM Gas RJS080 XJ /16/2003 Lochinvar RWN199PM Gas RJS080 XJ /18/2003 Lochinvar RWN199PM Gas RJS080 XJ /20/2003 Lochinvar RWN199PM Gas RJS080 XJ /26/2003 Lochinvar RWN199PM Gas RJS080 XJ /17/2003 Lochinvar RWN199PM Gas RJS080 XJ /20/2003 Lochinvar RWN199PM Gas RJS080 XJ /20/2003 Lochinvar RWN199PM Gas RJS080 XJ /19/2003 Lochinvar RWN199PM Gas RJS080 XJ /31/2003 Lochinvar RWN199PM Gas RJS080 XJ /29/2003 Lochinvar RWN199PM Gas RJS080 XJ /23/2003 Lochinvar RWN199PM Gas RJS080 XJ /28/2003 Lochinvar RWN199PM Gas RJS080 XJ /18/2003 Lochinvar RWN199PM Gas RJS080 ZB /17/2003 Lochinvar RWN199PM Gas RJS080 ZB /16/2003 Lochinvar RWN199PM Gas RJS080 ZB /14/2003 Lochinvar RWN199PM Gas RJS080 ZB /7/2003 Lochinvar RWN199PM Gas RJS080 ZA /8/2003 Lochinvar RWN199PM Gas RJS080 ZB /4/2003 Lochinvar RWN199PM Gas RJS080 XJ /2/2003 Lochinvar RWN199PM Gas RJS080 ZB /3/2003 Lochinvar RWN199PM Gas RJS080 ZB /21/2003 Lochinvar RWN199PM Gas RJS080 XJ /21/2003 Lochinvar RWN199PM Gas RJS080 XJ /21/2003 Lochinvar RWN199PM Gas RJS080 XJ /22/2003 Lochinvar RWN199PM Gas RJS080 XJ /22/2003 Lochinvar RWN199PM Gas RJS080 XJ /22/2003 Lochinvar RWN199PM Gas RJS080 XJ /24/2003 Lochinvar RWN199PM Gas RJS080 XJ /24/2003 Lochinvar RWN199PM Gas RJS080 XJ /23/2003 Lochinvar RWN199PM Gas RJS080 XJ /23/2003 Lochinvar RWN199PM Gas RJS080 XJ /24/2003 Lochinvar RWN199PM Gas RJS080 XJ /23/2003 Lochinvar RWN199PM Gas RJS080 XJ /23/2003 Lochinvar RWN199PM Gas RJS080 XJ /22/2003 Lochinvar RWN199PM Gas RJS080 XJ /28/2003 Lochinvar RWN199PM Gas RJS080 XJ /28/2003 Lochinvar RWN199PM Gas RJS080 XJ /29/2003 Lochinvar RWN199PM Gas RJS080 XJ /29/2003 Lochinvar RWN199PM Gas RJS080 XJ /29/2003 Lochinvar RWN199PM Gas RJS080 XJ /29/2003 Lochinvar RWN199PM Gas RJS080 XJ /28/2003 Lochinvar RWN199PM Gas RJS080 XJ /25/2003 Lochinvar RWN199PM Gas RJS080 XJ /25/2003 Lochinvar RWN199PM Gas RJS080 XJ /25/2003 Lochinvar RWN199PM Gas RJS080 XJ /28/2003 Lochinvar RWN199PM Gas RJS080 XJ /25/2003 Lochinvar RWN199PM Gas RJS080 XJ /29/2003 Lochinvar RWN199PM Gas RJS080 XJ LFG to Energy Hot H20 Heaters 3
131 BLDG Hot Water Heater Start Date Hot Water Heater MFG Model Heat Type Burner Model Burner Make MBH Max Input MMBtu Max Input 434 7/29/2003 Lochinvar RWN199PM Gas RJS080 XJ /29/2003 Lochinvar RWN199PM Gas RJS080 XJ /30/2003 Lochinvar RWN199PM Gas RJS080 XJ /29/2003 Lochinvar RWN199PM Gas RJS080 XJ /30/2003 Lochinvar RWN199PM Gas RJS080 XJ /30/2003 Lochinvar RWN199PM Gas RJS080 XJ /30/2003 Lochinvar RWN199PM Gas RJS080 XJ /30/2003 Lochinvar RWN199PM Gas RJS080 XJ /31/2003 Lochinvar RWN199PM Gas RJS080 XJ /31/2003 Lochinvar RWN199PM Gas RJS080 XJ /30/2003 Lochinvar RWN199PM Gas RJS080 XJ /30/2003 Lochinvar RWN199PM Gas RJS080 XJ /1/2003 Lochinvar RWN199PM Gas RJS080 XJ /1/2003 Lochinvar RWN199PM Gas RJS080 XJ /14/2003 Lochinvar RWN199PM Gas RJS080 XJ /14/2003 Lochinvar RWN199PM Gas RJS080 XJ /16/2003 Lochinvar RWN199PM Gas RJS080 XJ /15/2003 Lochinvar RWN199PM Gas RJS080 XJ /15/2003 Lochinvar RWN199PM Gas RJS080 XJ /16/2003 Lochinvar RWN199PM Gas RJS080 XJ /15/2003 Lochinvar RWN199PM Gas RJS080 XJ /17/2003 Lochinvar RWN199PM Gas RJS080 XJ /17/2003 Lochinvar RWN199PM Gas RJS080 XJ /18/2003 Lochinvar RWN199PM Gas RJS080 XJ /17/2003 Lochinvar RWN199PM Gas RJS080 XJ /16/2003 Lochinvar RWN199PM Gas RJS080 XJ /16/2003 Lochinvar RWN199PM Gas RJS080 XJ /21/2003 Lochinvar RWN199PM Gas RJS080 XJ /28/2003 Lochinvar RWN199PM Gas RJS080 XJ /28/2003 Lochinvar RWN199PM Gas RJS080 XJ /28/2003 Lochinvar RWN199PM Gas RJS080 XJ /23/2003 Lochinvar RWN199PM Gas RJS080 XJ /29/2003 Lochinvar RWN199PM Gas RJS080 XJ /29/2003 Lochinvar RWN199PM Gas RJS080 XJ /4/2003 Lochinvar RWN199PM Gas RJS080 ZB /4/2003 Lochinvar RWN199PM Gas RJS080 ZB /18/2003 Lochinvar RWN199PM Gas RJS080 XJ /18/2003 Lochinvar RWN199PM Gas RJS080 XJ Unknown Not Avail Not Avail Gas Not Avail Not Avail Unknown Not Avail Not Avail Gas Not Avail Not Avail Unknown Not Avail Not Avail Gas Not Avail Not Avail Unknown Not Avail Not Avail Gas Not Avail Not Avail Unknown Not Avail Not Avail Gas Not Avail Not Avail Unknown Not Avail Not Avail Gas Not Avail Not Avail Unknown Not Avail Not Avail Gas Not Avail Not Avail Unknown Not Avail Not Avail Gas Not Avail Not Avail Unknown Not Avail Not Avail Gas Not Avail Not Avail Unknown Not Avail Not Avail Gas Not Avail Not Avail Unknown Not Avail Not Avail Gas Not Avail Not Avail Unknown Not Avail Not Avail Gas Not Avail Not Avail LFG to Energy Hot H20 Heaters 4
132 BLDG Hot Water Heater Start Date Hot Water Heater MFG Model Heat Type Burner Model Burner Make MBH Max Input MMBtu Max Input 974 Unknown Not Avail Not Avail Gas Not Avail Not Avail Unknown Not Avail Not Avail Gas Not Avail Not Avail /16/2003 Lochinvar RWN199PM Gas RJS080 XJ /16/2003 Lochinvar RWN199PM Gas RJS081 XJ /11/2003 Lochinvar RWN199PM Gas RJS080 XJ /11/2003 Lochinvar RWN199PM Gas RJS080 XJ Unknown Not Avail Not Avail Gas Not Avail Not Avail /9/2003 Lochinvar RWN199PM Gas RJS080 XJ /9/2003 Lochinvar RWN199PM Gas RJS080 XJ /4/2003 Bock 241PGES Gas NA NA /4/2003 Bock 241PGES Gas NA NA /11/2003 Lochinvar RWN199PM Gas RJS080 XJ /11/2003 Lochinvar RWN199PM Gas RJS080 XJ /12/2003 Lochinvar RWN199PM Gas RJS080 XJ /12/2003 Lochinvar RWN199PM Gas RJS080 XJ /4/2003 Bock 241PGES Gas NA NA /4/2003 Bock 241PGES Gas NA NA , MBH MMBtu/hr LFG to Energy Hot H20 Heaters 5
133 APPENDIX 13 FINANCIAL PRO FORMA FOR OPTION 5 (FT. RICHARDSON)
134 Assumptions Anchorage Medium BTU Gas Project Gas Sales to Ft. Richardson Building #726 Assumes Ft. Richardson will use all gas available Project Proforma April 5, 2004 N:\Document Control\project for jim bier\[anchorage FtRichardson Pipeline apdx13.xls]dep Summary of Assumptions & Financials MG Price $2.721 MG Price Escalation 2.0% Capital Cost $ 3,256,063 Loan Amount $0 Gas Cost $ Gas Cost Escalation 2.0% Gas Quantity 826 SCFM Financing Principal Term Interest Rate No Debt n/a n/a Financial Returns 10 Years Total Cash Flow from Operations $ 3,927,864 Investment $ 3,256,063 Net Cash Flow $ 671,801 Project IRR 3.0% NPV at rate = 2.000% $ 200,794 NPV at rate = 2.500% $ 97,378 NPV at rate = 2.750% $ 47,612 NPV at rate = 3.000% $ (906) Pre Tax Profits $ 1,041,000 Average % 10.1% Minimum % -19.2% Net Income $ 671,801 Average % 4.9% Minimum % -29.6% MUSA Contributions (Municipal Utility Service Assessment) Rate 10 Year Totals Rate on Net Book Value of Assets - in mils 16 $ 270,934 Gross Revenue contribution % of Revenue 1.25% $ 98,265 $ 369,199 Depreciation per GASB 34 Method Life in Years Vehicles St. Line 5 Support Equipment St. Line 4 Machinery & Equipment St. Line 7 GCCS & Pipeline St. Line 10 5/18/2004 2:01 PM Anchorage FtRichardson Pipeline apdx13
135 Anchorage Medium BTU Gas Project Gas Sales to Ft. Richardson Building #726 ASSUMPTIONS to PRO FORMA April 5, 2004 N:\Document Control\project for jim bier\[anchorage FtRichardson Pipeline apdx13.xls]dep Description Value Unit Financial Information Project Capital Costs $3,256,063 Equity Contribution % $3,256,063 Loan 0.00% Principal $0 Term 10 years Interest Rate 0.0% Interest Payments monthly during construction Loan Fees 0.0% MG Quantity 826 SCFM 208,631 mmbtu/yr 50.00% Methane % On-Stream Factors Utilization % 95.0% MG Price $2.721 MG Price escalator 2.0% Cost of Sales Cost of Methane Gas $ per mmbtu Cost Escalator 2.0% Electric Cost - Blower and cents / kwh $60,000 Annually Electric Escalator 2.0% Operating Costs Annually O&M Compressor/Pipeline per year $ 200,000 O&M Escalator 3.0% Property Insurance General Liability Insurance 1.00% % of Value 1.00% % of Revenue Administration $25,000 Income Taxes Is project subject to income taxes NO Federal Tax Rate 0% State Tax Rate 0.0% Incl. In Federal Questions 1 When do we anticipate project completion / start-up? Verity Gas curve to use and recovery rate Avg LFG at 75% 3 Does gas curve assume 50 or acres 73 acres 4 Does the $15,000 include flare, blower and electrical Includes all components of GCCS 5 Tony had an estimate of $75/ft for pipeline. What does this include? As per Jim use Kevin's $60 6 No Federal Tax 5/18/2004 2:02 PM Anchorage FtRichardson Pipeline apdx13
136 Anchorage Medium BTU Gas Project Gas Sales to Ft. Richardson Building #726 Annual Proforma Methane Gas Price (MG) = $ 2.72 Escalation Year Year Assumptions CalendarYear Total Gas Curve LFG Generation - Avg 1,101 1,170 1,237 1,302 1,364 1,423 1,479 1,533 1,584 1,632 Lfg Recoverable Rate 75.0% 75% 75% 75% 75% 75% 75% 75% 75% 75% 75% Landfill Gas Available ,023 1,067 1,109 1,150 1,188 1,224 Average 50% Methane & 95% Utilization 208, , , , , , , , , ,251 School Gas Demand Average SCFM Average 50% Methane & 95% Utilization Escalator Assumed Methane Gas Price 2% $ 2.72 $ 2.78 $ 2.83 $ 2.89 $ 2.95 $ 3.00 $ 3.06 $ 3.13 $ 3.19 $ 3.25 Income Escalator MG Sales - Landfill Gas Production 2.0% $567,685 $616,343 $663,358 $713,018 $762,478 $808,941 $857,593 $909,237 $957,494 $1,005,066 $7,861,211 Total Revenues 567, , , , , , , , ,494 1,005,066 7,861,211 Costs of Sales Purchased Electricity - Blower/Compressor 2.0% 60,000 61,200 62,424 63,672 64,946 66,245 67,570 68,921 70,300 71, ,983 Purchased Methane Gas $ - 2.0% Costs of Sales 60,000 61,200 62,424 63,672 64,946 66,245 67,570 68,921 70,300 71, ,983 Gross Profit 507, , , , , , , , , ,360 7,204,228 Expenses - Pipeline O&M - Wellfield/Comp/Pipeline - per year 2.0% 200, , , , , , , , , ,019 2,189,944 Property Insur. - (% of value) 1.00% 2.0% 32,561 33,212 33,876 34,554 35,245 35,950 36,669 37,402 38,150 38, ,530 General Liability Insur. (% of revenue) 1.00% 2.0% 5,677 6,287 6,902 7,567 8,253 8,931 9,658 10,444 11,219 12,011 86,949 Administration 2.0% 25,000 25,500 26,010 26,530 27,061 27,602 28,154 28,717 29,291 29, ,743 Personal Property Tax - n/a - assume Pollution Control Exemp Interest Total Expenses 263, , , , , , , , , ,820 2,907,166 Net Operating Profit 244, , , , , , , , , ,540 4,297,063 Less Depreciation/Amort Finance Fees (Pipeline Only) 353, , , , , , , , , ,606 3,256,063 Net Profit Before Tax (109,016) (67,319) (27,397) 14,990 57,023 95, , , , ,934 1,041, % -10.9% -4.1% 2.1% 7.5% 11.9% 16.0% 30.1% 32.8% 35.1% 13.2% MUSA Contributions Millage Rate on NBV of PPE 1.60% 52,097 46,442 40,786 35,131 29,475 23,820 18,165 12,509 8,339 4, ,934 Gross Revenue Rate 1.25% 7,096 7,704 8,292 8,913 9,531 10,112 10,720 11,365 11,969 12,563 98,265 Total Taxes 59,193 54,146 49,078 44,043 39,006 33,932 28,884 23,875 20,308 16, ,199 Net Income (168,209) (121,465) (76,476) (29,053) 18,017 62, , , , , , % -19.7% -11.5% -4.1% 2.4% 7.7% 12.6% 27.4% 30.6% 33.5% 8.5% 5/18/2004 2:02 PM Anchorage FtRichardson Pipeline apdx13
137 Anchorage Medium BTU Gas Project Gas Sales to Ft. Richardson Building #726 Annual Proforma Methane Gas Price (MG) = $ 2.72 Construction Cash Flow - Total Project 2005 Capital Expenditures (3,256,063) Loan - Add Depreciation/Amort (Pipeline & Related Costs) 353, , , , , , , , , ,606 3,256,063 Less Principal Payment Net After Tax Cash Flow (3,256,063) 185, , , , , , , , , ,807 3,927,864 Cumulative After Tax (3,256,063) (3,070,808) (2,838,810) (2,561,822) (2,237,412) (1,865,932) (1,450,467) (989,041) (478,901) 74, ,801 Net Present Value (NPV) 2.000% $200,794 Bank Principal Balance (Yr End) , YEAR Investment Analysis - Total Project Const. Year TOTAL % Ownership % Capital Expenditures (3,256,063) (3,256,063) Construction Interest - Bond - - Cash Flow 185, , , , , , , , , ,807 3,927,864 - After Tax Cash Flow - Year (3,256,063) 185, , , , , , , , , , ,801 After Tax Cash Flow - Cum. (3,256,063) (3,070,808) (2,838,810) (2,561,822) (2,237,412) (1,865,932) (1,450,467) (989,041) (478,901) 74, ,801 Project IRR - on Cash Investment 3.00% NPV - After tax % $200, % $97, % $47,612 Discount = to IRR 3.00% ($906) NPV and IRR reconcile Return on Revenues Average Minimum Pre Tax 10.11% % After Tax 4.92% % 5/18/2004 2:02 PM Anchorage FtRichardson Pipeline apdx13
138 Anchorage Medium BTU Gas Project Gas Sales to Ft. Richardson Building #726 Capital Estimate Detail April 5, 2004 N:\Document Control\project for jim bier\[anchorage FtRichardson Pipeline apdx13.xls]dep Description Gas Collection System / Compressor Facility Wellfield based on $12,000 per acre asuming 73 acres $876,000 Compressor $650,000 Sub-Total Total Contingency $0 Included in above $1,526,000 Pipeline and Related Costs Blower Upgrade $0 Included in GCCS Pipeline miles (27,168 $60 per foot $1,630,063 D.O.T. Pipeline Safety Standards Design & Compliance Air Compressor Surveying Geotechnical Planning/Coordination/Legal Construction Interest Right of Way Payment Wetlands Investigation End User Upgrades Contingency - 10% $0 Included in Pipeline estimate $0 Included in Pipeline estimate $0 Included in Pipeline estimate $0 Included in Pipeline estimate $0 Included in Pipeline estimate $0 None assumed $0 None assumed $0 Included in Pipeline estimate $100,000 Allowance $0 Included in above $1,730,063 Project Total $3,256,063 N:\Document Control\project for jim bier\[anchorage FtRichardson Pipeline apdx13.xls]dep 5/18/2004 2:02 PM Anchorage FtRichardson Pipeline apdx13
139 Anchorage Medium BTU Gas Project Gas Sales to Ft. Richardson Building #726 Depreciation & Amortization Schedules April 5, 2004 N:\Document Control\project for jim bier\[anchorage FtRichardson Pipeline apdx13.xls]dep Depreciation Amounts Amount Gas Treatment and Processing System 1,526,000 Pipeline and Related Costs 1,730,063 Construction Interest - Sub-Total 3,256,063 Year Depreciation $353, $353, $353, $353, $353, $353, $353, $260, $260, $260,606 $3,256,063
140 APPENDIX 14 TOPOGRAPHIC MAP FOR OPTION 6 (ML&P GEORGE M. SULLIVAN POWER PLANT)


141 3Anchorage Landfill 3George M. Sullivan Power Plant Copyright (C) 1997, Maptech, Inc.
142 Miles Total distance: 6 miles, 3977 feet Climbing: 115 feet Latitude: ' 00.0'' N Descending: -247 feet Longitude: ' 00.0'' E Ground distance: 6 miles, 3984 feet Elevation change: -132 feet Elevation: Min/Max: 333/535 Grade:
143 APPENDIX 15 FINANCIAL PRO FORMA FOR OPTION 6 (ML&P GEORGE M. SULLIVAN POWER PLANT)
144 Assumptions Anchorage Medium BTU Gas Project Gas Sales to George M. Sullivan Power Plant Assumes Power Plant will use all gas available Project Proforma April 5, 2004 N:\Document Control\project for jim bier\[anchorage SullivanPlant Pipeline apdx15.xls]dep Summary of Assumptions & Financials MG Price $2.858 MG Price Escalation 2.0% Capital Cost $ 3,526,800 Loan Amount $0 Gas Cost $ Gas Cost Escalation 2.0% Gas Quantity 826 SCFM Financing Principal Term Interest Rate No Debt n/a n/a Financial Returns 10 Years Total Cash Flow from Operations $ 4,260,397 Investment $ 3,526,800 Net Cash Flow $ 733,597 Project IRR 3.0% NPV at rate = 2.000% $ 224,059 NPV at rate = 2.500% $ 112,166 NPV at rate = 2.750% $ 58,319 NPV at rate = 3.000% $ 5,820 Pre Tax Profits $ 1,131,562 Average % 10.6% Minimum % -18.5% Net Income $ 733,597 Average % 5.3% Minimum % -29.2% MUSA Contributions (Municipal Utility Service Assessment) Rate 10 Year Totals Rate on Net Book Value of Assets - in mils 16 $ 294,758 Gross Revenue contribution % of Revenue 1.25% $ 103,207 $ 397,965 Depreciation per GASB 34 Method Life in Years Vehicles St. Line 5 Support Equipment St. Line 4 Machinery & Equipment St. Line 7 GCCS & Pipeline St. Line 10 5/18/2004 2:10 PM Anchorage SullivanPlant Pipeline apdx15
145 Anchorage Medium BTU Gas Project Gas Sales to George M. Sullivan Power Plant ASSUMPTIONS to PRO FORMA April 5, 2004 N:\Document Control\project for jim bier\[anchorage SullivanPlant Pipeline apdx15.xls]dep Description Value Unit Financial Information Project Capital Costs $3,526,800 Equity Contribution % $3,526,800 Loan 0.00% Principal $0 Term 10 years Interest Rate 0.0% Interest Payments monthly during construction Loan Fees 0.0% MG Quantity 826 SCFM 208,631 mmbtu/yr 50.00% Methane % On-Stream Factors Utilization % 95.0% MG Price $2.858 MG Price escalator 2.0% Cost of Sales Cost of Methane Gas $ per mmbtu Cost Escalator 2.0% Electric Cost - Blower and cents / kwh $60,000 Annually Electric Escalator 2.0% Operating Costs Annually O&M Compressor/Pipeline per year $ 200,000 O&M Escalator 3.0% Property Insurance General Liability Insurance 1.00% % of Value 1.00% % of Revenue Administration $25,000 Income Taxes Is project subject to income taxes NO Federal Tax Rate 0% State Tax Rate 0.0% Incl. In Federal Questions 1 When do we anticipate project completion / start-up? Verity Gas curve to use and recovery rate Avg LFG at 75% 3 Does gas curve assume 50 or acres 73 acres 4 Does the $15,000 include flare, blower and electrical Includes all components of GCCS 5 Tony had an estimate of $75/ft for pipeline. What does this include? As per Jim use Kevin's $60 6 No Federal Tax 5/18/2004 2:10 PM Anchorage SullivanPlant Pipeline apdx15
146 Anchorage Medium BTU Gas Project Gas Sales to George M. Sullivan Power Plant Annual Proforma Methane Gas Price (MG) = $ 2.86 Escalation Year Year Assumptions CalendarYear Total Gas Curve LFG Generation - Avg 1,101 1,170 1,237 1,302 1,364 1,423 1,479 1,533 1,584 1,632 Lfg Recoverable Rate 75.0% 75% 75% 75% 75% 75% 75% 75% 75% 75% 75% Landfill Gas Available ,023 1,067 1,109 1,150 1,188 1,224 Average 50% Methane & 95% Utilization 208, , , , , , , , , ,251 School Gas Demand Average SCFM Average 50% Methane & 95% Utilization Escalator Assumed Methane Gas Price 2% $ 2.86 $ 2.92 $ 2.97 $ 3.03 $ 3.09 $ 3.16 $ 3.22 $ 3.28 $ 3.35 $ 3.42 Income Escalator MG Sales - Landfill Gas Production 2.0% $596,267 $647,382 $696,174 $747,559 $798,663 $852,085 $902,434 $952,810 $1,005,519 $1,057,638 $8,256,531 Total Revenues 596, , , , , , , ,810 1,005,519 1,057,638 8,256,531 Costs of Sales Purchased Electricity - Blower/Compressor 2.0% 60,000 61,200 62,424 63,672 64,946 66,245 67,570 68,921 70,300 71, ,983 Purchased Methane Gas $ - 2.0% Costs of Sales 60,000 61,200 62,424 63,672 64,946 66,245 67,570 68,921 70,300 71, ,983 Gross Profit 536, , , , , , , , , ,933 7,599,548 Expenses - Pipeline O&M - Wellfield/Comp/Pipeline - per year 2.0% 200, , , , , , , , , ,019 2,189,944 Property Insur. - (% of value) 1.00% 2.0% 35,268 35,973 36,693 37,427 38,175 38,939 39,717 40,512 41,322 42, ,175 General Liability Insur. (% of revenue) 1.00% 2.0% 5,963 6,603 7,243 7,933 8,645 9,408 10,163 10,945 11,781 12,640 91,323 Administration 2.0% 25,000 25,500 26,010 26,530 27,061 27,602 28,154 28,717 29,291 29, ,743 Personal Property Tax - n/a - assume Pollution Control Exemp Interest Total Expenses 266, , , , , , , , , ,684 2,941,185 Net Operating Profit 270, , , , , , , , , ,249 4,658,362 Less Depreciation/Amort Finance Fees (Pipeline Only) 380, , , , , , , , , ,680 3,526,800 Net Profit Before Tax (110,500) (66,432) (24,813) 19,217 62, , , , , ,569 1,131, % -10.3% -3.6% 2.6% 7.9% 12.7% 16.7% 30.0% 32.9% 35.4% 13.7% MUSA Contributions Millage Rate on NBV of PPE 1.60% 56,429 50,340 44,252 38,163 32,074 25,986 19,897 13,809 9,206 4, ,758 Gross Revenue Rate 1.25% 7,453 8,092 8,702 9,344 9,983 10,651 11,280 11,910 12,569 13, ,207 Total Taxes 63,882 58,432 52,954 47,507 42,058 36,637 31,178 25,719 21,775 17, ,965 Net Income (174,383) (124,865) (77,767) (28,290) 20,755 71, , , , , , % -19.3% -11.2% -3.8% 2.6% 8.4% 13.3% 27.3% 30.7% 33.7% 8.9% 5/18/2004 2:11 PM Anchorage SullivanPlant Pipeline apdx15
147 Anchorage Medium BTU Gas Project Gas Sales to George M. Sullivan Power Plant Annual Proforma Methane Gas Price (MG) = $ 2.86 Construction Cash Flow - Total Project 2005 Capital Expenditures (3,526,800) Loan - Add Depreciation/Amort (Pipeline & Related Costs) 380, , , , , , , , , ,680 3,526,800 Less Principal Payment Net After Tax Cash Flow (3,526,800) 206, , , , , , , , , ,425 4,260,397 Cumulative After Tax (3,526,800) (3,320,645) (3,064,973) (2,762,203) (2,409,956) (2,008,664) (1,556,226) (1,055,806) (507,546) 89, ,597 Net Present Value (NPV) 2.000% $224,059 Bank Principal Balance (Yr End) , YEAR Investment Analysis - Total Project Const. Year TOTAL % Ownership % Capital Expenditures (3,526,800) (3,526,800) Construction Interest - Bond - - Cash Flow 206, , , , , , , , , ,425 4,260,397 - After Tax Cash Flow - Year (3,526,800) 206, , , , , , , , , , ,597 After Tax Cash Flow - Cum. (3,526,800) (3,320,645) (3,064,973) (2,762,203) (2,409,956) (2,008,664) (1,556,226) (1,055,806) (507,546) 89, ,597 Project IRR - on Cash Investment 3.03% NPV - After tax % $224, % $112, % $58,319 Discount = to IRR 3.00% $5,820 NPV and IRR reconcile Return on Revenues Average Minimum Pre Tax 10.59% % After Tax 5.26% % 5/18/2004 2:11 PM Anchorage SullivanPlant Pipeline apdx15
148 Anchorage Medium BTU Gas Project Gas Sales to George M. Sullivan Power Plant Capital Estimate Detail April 5, 2004 N:\Document Control\project for jim bier\[anchorage SullivanPlant Pipeline apdx15.xls]dep Description Gas Collection System / Compressor Facility Wellfield based on $12,000 per acre asuming 73 acres $876,000 Compressor $650,000 Sub-Total Total Contingency $0 Included in above $1,526,000 Pipeline and Related Costs Blower Upgrade $0 Included in GCCS Pipeline 31,680 $60 per foot $1,900,800 D.O.T. Pipeline Safety Standards Design & Compliance Air Compressor Surveying Geotechnical Planning/Coordination/Legal Construction Interest Right of Way Payment Wetlands Investigation End User Upgrades Contingency - 10% $0 Included in Pipeline estimate $0 Included in Pipeline estimate $0 Included in Pipeline estimate $0 Included in Pipeline estimate $0 Included in Pipeline estimate $0 None assumed $0 None assumed $0 Included in Pipeline estimate $100,000 Allowance $0 Included in above $2,000,800 Project Total $3,526,800 N:\Document Control\project for jim bier\[anchorage SullivanPlant Pipeline apdx15.xls]dep 5/18/2004 2:11 PM Anchorage SullivanPlant Pipeline apdx15
149 Anchorage Medium BTU Gas Project Gas Sales to George M. Sullivan Power Plant Depreciation & Amortization Schedules April 5, 2004 N:\Document Control\project for jim bier\[anchorage SullivanPlant Pipeline apdx15.xls]dep Depreciation Amounts Amount Gas Treatment and Processing System 1,526,000 Pipeline and Related Costs 2,000,800 Construction Interest - Sub-Total 3,526,800 Year Depreciation $380, $380, $380, $380, $380, $380, $380, $287, $287, $287,680 $3,526,800
150 APPENDIX 16 TOPOGRAPHIC MAP FOR OPTION 7 (ML&P FOSSIL CREEK)


151 3Anchorage Landfill 3Fossil Creek Power Plant Copyright (C) 1997, Maptech, Inc.
Complex Solid Waste Air Permitting Issues
 Complex Solid Waste Air Permitting Issues A Threat to Landfill Gas as an Alternative Fuel Source Heather H. Little Sanborn, Head and Associates, Inc. John Gay, E.I. Casella Waste Systems, Inc. NEWSVT Landfill
PROPOSED October 15, 2013
 RULE 4308 BOILERS, STEAM GENERATORS, AND PROCESS HEATERS 0.075 MMBtu/hr to less than 2.0 MMBtu/hr (Adopted October 20, 2005, Amended December 17, 2009, Amended [rule adoption date]) 1.0 Purpose The purpose
Beneficial Use of Landfill Gas for Leachate Evaporation and Power Generation
 Beneficial Use of Landfill Gas for Leachate Evaporation and Power Generation Efficient use of Energy Turning waste to energy, liabilities to assets and visions into reality. Table of Contents BENEFICIAL
Under Section 608 of the CAA, EPA has established regulations (40 CFR Part 82, Subpart F) that:
 that:") Overview Under Section 608 of the CAA, EPA has established regulations (40 CFR Part 82, Subpart F) that: Require service practices that maximize recycling of ozone-depleting compounds (both chlorofluorocarbons
Overview Under Section 608 of the CAA, EPA has established regulations (40 CFR Part 82, Subpart F) that: Require service practices that maximize recycling of ozone-depleting compounds (both chlorofluorocarbons
RULE 3.23 NATURAL GAS-FIRED WATER HEATERS, SMALL BOILERS, AND PROCESS HEATERS (Adopted 10/03/2016)
") RULE 3.23 NATURAL GAS-FIRED WATER HEATERS, SMALL BOILERS, AND PROCESS HEATERS (Adopted 10/03/2016) A. PURPOSE The purpose of this rule is to limit the emissions of oxides of nitrogen (NOx) from the use
RULE 3.23 NATURAL GAS-FIRED WATER HEATERS, SMALL BOILERS, AND PROCESS HEATERS (Adopted 10/03/2016) A. PURPOSE The purpose of this rule is to limit the emissions of oxides of nitrogen (NOx) from the use
EVAP Project BACKGROUND EVAP UNIT
 EVAP PROJECT GARY MAYHEW, C.E.T. LEDCOR ALBERTA LIMITED PAPER PREPARED FOR PRESENTATION AT THE DISPOSAL OF SALT BRINE AT HIGHWAY MAINTENANCE YARDS SESSION OF THE 2005 ANNUAL CONFERENCE OF THE TRANSPORTATION
Estimating the Level of Free Riders in the Refrigerator Buy-Back Program
 Estimating the Level of Free Riders in the Refrigerator Buy-Back Program Diane M. Fielding, B.C. Hydro An impact evaluation, conducted in 1993 on B.C. Hydro s Refrigerator Buy-Back Program, employed an
Boiler MACT Webinar Q/A
 Boiler MACT Webinar Q/A Q: How much modification can be done to a boiler or process heater before it is considered to be New? A: An existing boiler can be considered to be a New boiler if modifications
Boiler Basics. Design and operation
 Boiler Basics Design and operation A boiler is an enclosed vessel that provides a means for combustion heat to be transferred into water until it becomes heated water or steam. The hot water or steam under
Lesson 2a: Landfill Wellfield and Project Components
 Lesson 2a: Landfill Wellfield and Project Components Outline Objectives of LFG Collection/Control Elements of a LFG collection System LFG Destruction/ Utilization Options 2 Objectives Recover and utilize
Demand Side Management (DSM) Natural Gas
 Natural Gas") Demand Side Management (DSM) Natural Gas Summary: This initiative analyzes the potential of a natural gas efficiency standard (NGES) to promote the costeffective replacement of older, less efficient household
Demand Side Management (DSM) Natural Gas Summary: This initiative analyzes the potential of a natural gas efficiency standard (NGES) to promote the costeffective replacement of older, less efficient household
05/14/2012 BOILER TUNE UPS & REPLACEMENTS PRESENTATION BOILER BASICS FOR LARGE INDUSTRIAL FACILITIES. Mark Bergum, P.E.
 BOILER TUNE UPS & REPLACEMENTS FOR LARGE INDUSTRIAL FACILITIES Mark Bergum, P.E. PRESENTATION BOILER BASICS 1 BASE ASSUMPTION BOILER Steam Heat Output Exhaust Heat Losses 70% 20% Other Heat Losses 3% Blowdown
REPLACING WET SEALS WITH DRY SEALS IN CENTRIFUGAL COMPRESSORS
 Lessons Learned From Natural Gas STAR Partners REPLACING WET SEALS WITH DRY SEALS IN CENTRIFUGAL COMPRESSORS Executive Summary Centrifugal compressors are widely used in production and transmission of
Responsible Care Product Stewardship for Refrigerants
 1 ABSTRACT Responsible Care Product Stewardship for Refrigerants Christoph Meurer; Ewald Preisegger Solvay Fluor und Derivate GmbH Hans-Böckler-Allee 20 30161 Hannover Germany Product stewardship summarizes
TOTAL SYSTEM EFFICIENCY: AN INTRODUCTION TO CONDENSING BOILERS. David Grassl PE Mechanical Engineer Principal
 TOTAL SYSTEM EFFICIENCY: AN INTRODUCTION TO CONDENSING BOILERS David Grassl PE Mechanical Engineer Principal Boilers are closed pressure vessels that are used to heat fluids -- either water or steam. They
d. Portable water heaters used exclusively for underwater diving operations.
 RULE 360. BOILERS, WATER HEATERS, AND PROCESS HEATERS (0.075 2 MMBtu/hr) EMISSIONS OF OXIDES OF NITROGEN FROM LARGE WATER HEATERS AND SMALL BOILERS. (Adopted 10/17/2002, revised xx/xx/xxxx) A. Applicability
Title: Standard Operating Procedure for Measurement of Total Hydrocarbon Using a Flame Ionization Detection
 Procedure No: SOP-020 Revision No: 1.0 (January 21, 2011) Page No.: 1 of 7 1. INTRODUCTION AND SCOPE To obtain timely data for the purpose of air quality assessment, air quality trend reporting, and to
Saying Mahalo to Solar Savings: A Billing Analysis of Solar Water Heaters in Hawaii
 Saying Mahalo to Solar Savings: A Billing Analysis of Solar Water Heaters in Hawaii Jenny Yaillen, Evergreen Economics Chris Ann Dickerson, CAD Consulting Wendy Takanish and John Cole, Hawaii Public Utilities
Increasing Energy Efficiency in the Web Coating Process
 Increasing Energy Efficiency in the Web Coating Process By Ed Cohen Edward Coating Consulting & Dan Bemi MEGTEC Systems, Inc. Fossil Fuel Dependency 2 How to Keep Your Competitive Edge Know what energy
FGR. Installation, Operation and Startup Instruction Manual FOR FLUE GAS RECIRCULATION SYSTEM. FGR-8 through FGR-22 (25 HP to 1000 HP)
") FGR Installation, Operation and Startup Instruction Manual FOR FLUE GAS RECIRCULATION SYSTEM FGR-8 through FGR-22 (25 HP to 1000 HP) Gas, Light Oil or Combination MANUFACTURED BY JOHN ZINK COMPANY, LLC
FGR Installation, Operation and Startup Instruction Manual FOR FLUE GAS RECIRCULATION SYSTEM FGR-8 through FGR-22 (25 HP to 1000 HP) Gas, Light Oil or Combination MANUFACTURED BY JOHN ZINK COMPANY, LLC
San Joaquin Valley Unified Air Pollution Control District. Best Performance Standard (BPS) x.x.xx
 x.x.xx") San Joaquin Valley Unified Air Pollution Control District Best Performance Standard (BPS) x.x.xx Class Category Dryers and Dehydrators Pistachio Dryer Best Performance Standard Natural Gas-Fired Column
San Joaquin Valley Unified Air Pollution Control District Best Performance Standard (BPS) x.x.xx Class Category Dryers and Dehydrators Pistachio Dryer Best Performance Standard Natural Gas-Fired Column
MEMORANDUM. DATE: June 14, TO: Sponsors of the Massachusetts ENERGY STAR Appliances Program
 MEMORANDUM DATE: June 14, 2007 TO: Sponsors of the Massachusetts ENERGY STAR Appliances Program FROM: Lynn Hoefgen and Tim Pettit, Nexus Market Research RE: Results of the Appliance Model Availability
Environmental Expenditures. by the U.S. Oil and Natural Gas Industry
 Environmental Expenditures by the U.S. Oil and Natural Gas Industry 990 206 The industry has spent $,045 on the environment for every man, woman and child in the United States. About This Report Expenditures
Peoria has a tremendous opportunity to get sewer overflows under control and fight stormwater runoff head-on
 Peoria has a tremendous opportunity to get sewer overflows under control and fight stormwater runoff head-on The time is right to find funding solutions that address our aging infrastructure. We can enable
ecodry Figure 1 - Process Diagram ecodry B General Process Description
 ecodry The process principal of the ecodry system is centered around the concept of drying in a closed steam loop, with a process-integrated thermal oxidation. The separation of flue gas from the drying
Natural refrigerants - naturally efficient
 Natural refrigerants - naturally efficient Operating systems with natural refrigerants for energy efficiency Frankfurt (Main), 10/11/2016. Whether energy transition in Germany or Energy Efficiency Act
THE BURNING ISSUE FOR BODYSHOPS
 ENERGY COSTS THE BURNING ISSUE FOR BODYSHOPS Current - February 2012 Junair Spraybooths ANZ Pty Ltd Phone: 1300 881 411 Post: Suite 302 Locked Bag 1, Robina Town Centre QLD 4230 Office: Suite 2D, 109 Upton
San Joaquin Valley Unified Air Pollution Control District. Best Performance Standard (BPS) x.x.xx
 x.x.xx") San Joaquin Valley Unified Air Pollution Control District Best Performance Standard (BPS) x.x.xx Class Category Dryers and Dehydrators Pistachio Dryer Best Performance Standard Natural Gas-Fired Column
San Joaquin Valley Unified Air Pollution Control District Best Performance Standard (BPS) x.x.xx Class Category Dryers and Dehydrators Pistachio Dryer Best Performance Standard Natural Gas-Fired Column
Uses Fleet fueling stations or CNG as vehicle fuel Local power generation for Turbines, Engines or Boilers Augmentation to the CNG gas lines
 November 24, 2014 Biogas Renewable and local source of energy Landfills, Digesters, Farm waste Uses Fleet fueling stations or CNG as vehicle fuel Local power generation for Turbines, Engines or Boilers
Sludge Dryer Wet Scrubber Used to Produce Renewable Energy
 Sludge Dryer Wet Scrubber Used to Produce Renewable Energy Paper # 18 Andrew C. Bartocci Envitech, Inc. 2924 Emerson Street- Suite 320 San Diego, CA 92106 ABSTRACT A new biosolids processing facility in
Principal Brands UK and Northern Ireland
 Profile UK and Ireland based Building Materials Group Principal activities Builders and Plumbers Merchanting DIY Retailing in Ireland Dry Mortar Manufacturing Annualised turnover over 2.8 billion Market
The U.S. Appliance Standards Program. Building Technologies Office Energy Efficiency and Renewable Energy United States Department of Energy
 The U.S. Appliance Standards Program Building Technologies Office Energy Efficiency and Renewable Energy United States Department of Energy AGENDA 1 2 3 IMPACT OF APPLIANCE STANDARDS PROGRAM HISTORY AND
A Technical Introduction to Cool Thermal Energy Storage Commercial Applications
 A Technical Introduction to Cool Thermal Energy Storage Commercial Applications Cool Thermal Energy Storage is a new application of an old idea that can cut air conditioning energy costs in half while
Combustion Safety. RESNET Conference San Antonio, TX February 27, Presented by Rich Moore Lightly Treading Energy & Design Denver, CO
 Combustion Safety RESNET Conference San Antonio, TX February 27, 2006 Presented by Rich Moore Lightly Treading Energy & Design Denver, CO Goals of this session Recognize the need for combustion safety
HOW TO SELECT AN INDIRECT THERMAL TECHNOLOGY FOR INDUSTRIAL MATERIALS PROCESSING
 white paper HOW TO SELECT AN INDIRECT THERMAL TECHNOLOGY FOR INDUSTRIAL MATERIALS PROCESSING Better Thermal Processing Results Begin with Selecting the Right Technology Authored by Rob Grady Director of
Treatment of Digester Gas
 Treatment of Digester Gas Tom Mossinger, PE SCAP Energy Management Committee Meeting February 28, 2013 Digester Gas Composition Approximately 60% CO 2 Approximately 40% CH 4 Water vapor saturated at 95-100
GEOTHERMAL DESIGN GUIDE
 GEOTHERMAL DESIGN GUIDE BENEFITS OF THE BULLDOG SYSTEM CGC Version CGC Group of Companies Incorporated 2018 CONTENTS INTRODUCTION... 2 CHALLENGES FACING CONVENTIONAL GSHP SYSTEMS... 3 FACTORS WHICH IMPACTS
PREVIEW COPY. Heating System Equipment. Table of Contents. Gas Heating Equipment...3. Oil Heating Equipment Electric Heating Systems...
 Heating System Equipment Table of Contents Lesson One Lesson Two Lesson Three Gas Heating Equipment...3 Oil Heating Equipment...19 Electric Heating Systems...35 Lesson Four Solid-Fuel Furnaces and Furnace...51
LP GAS LEKAGE ALARM. M. G.. D. D. Wickramasinghe 1*, N. Abhayasinghe 2
 - 32 - LP GAS LEKAGE ALARM M. G.. D. D. Wickramasinghe 1*, N. Abhayasinghe 2 1* Corresponding Author, Department of Electronic and Computer Engineering, Sri Lanka Institute of Information Technology (SLIIT),
Multi-Family Recycling Discussion Paper
 UE2011-06 ATTACHMENT 2 The City of Calgary Multi-Family Recycling Discussion Paper February 2011.docx ISC: UNRESTRICTED Table of Contents Residential Recycling in Calgary... 1 Notice of Motion NM2008-25...
INVESTOR PRESENTATION
 TOUCHCORP LIMITED ASX:TCH WWW.TOUCHCORP.COM INVESTOR PRESENTATION $25.6M CAPITAL RAISING SEPTEMBER 2016 TOUCHCORP LIMITED 1 TOUCH SERVICE OFFERING TOUCHCORP NOW OFFERS ITS CUSTOMERS A COMPLETE OMNI-CHANNEL
DEMONSTRATION OF ADVANCED INTEGRATED HVAC&R SYSTEMS IN A LOBLAWS SUPERMARKET IN CANADA
 DEMONSTRATION OF ADVANCED INTEGRATED HVAC&R SYSTEMS IN A LOBLAWS SUPERMARKET IN CANADA Daniel Giguère, Technology Expert Georgi Pajani, Engineer Sophie Hosatte, Section Head, Buildings CETC-Varennes, Natural
Boiler MACT Deadline Is Here, Are You In Compliance? Sponsored by
 Boiler MACT Deadline Is Here, Are You In Compliance? Sponsored by 2 Sponsored by: Boiler MACT Deadline Is Here, Are You In Compliance? Webinar Presentation January 21, 2016 PH Haroz President Conversion
Warm air heating equipment
 Technology information leaflet ECA767 Warm air heating equipment A guide to equipment eligible for Enhanced Capital Allowances Contents Introduction 01 Background 01 Setting the scene 01 Benefits of purchasing
PERFORMANCE GOALS 5 RESPONSIBILITIES 6 M=manufacturer. Y Recommended based on recycling rate
 PSI Model Legislation Developed through multistakeholder dialogue. http://productstewardship.us/di splaycommon.cfm?an=1&subart iclenbr=99 Y Y Y Options: 1. Specify amount but not cash v. rebate 2. Specify
Monitoring Flammable Vapors and Gases in Industrial Processes
 Monitoring Flammable Vapors and Gases in Industrial Processes Flammability Hazards Industrial fires and explosions happen more frequently than most people think. They cause downtime, property damage, injury
High Performance Electronic Modulation Automatic Cleaning Easy Installation 4 Power Levels: 9,15,25,42kW. Pellet Boilers. Future of Ecological Heating
 Pellet Boilers High Performance Electronic Modulation Automatic Cleaning Easy Installation 4 Power Levels: 9,15,25,42kW Future of Ecological Heating Why choose an Ekoheat boiler? Ekopower is an innovative
Considerations for INDUSTRIAL COMBUSTION
 August 2016 Volume 23, Number 8 Considerations for INDUSTRIAL COMBUSTION Systems Follow us on: COMBUSTION CONTROLS FOR BOILERS Understand the advantages and disadvantages of combustion control schemes
For personal use only TOUCHCORP 1H2015 RESULTS PRESENTATION DATED: THURSDAY, 27TH AUGUST 2015
 TOUCHCORP 1H2015 RESULTS PRESENTATION DATED: THURSDAY, 27TH AUGUST 2015 DISCLAIMER The material in this presentation has been prepared by Touchcorp Limited ARBN 603 731 184 (Touchcorp) and is general background
Combination to Create a Leading Commercial Real Estate Credit REIT with Approximately $5.5 Billion in Assets and $3.4 Billion in Equity Value
 Colony NorthStar, NorthStar Real Estate Income Trust and NorthStar Real Estate Income II Announce Creation of Colony NorthStar Credit Real Estate, Inc. Combination to Create a Leading Commercial Real Estate
LOW-NOX BURNER RETROFIT CHALLENGE
 LOW-NOX BURNER RETROFIT CHALLENGE By Craig Lieb Applications Engineer Zeeco, Inc. Rutland, UK Ryan Roberts Project Engineering Manager Zeeco, Inc. Broken Arrow, OK, U.S.A. Ryan Roberts has more than 20
Arun Nayar Senior Vice President, Finance and Treasurer
 Arun Nayar Senior Vice President, Finance and Treasurer November 18, 2010 Forward-Looking Statements / Safe Harbor Certain statements in this presentation are forward-looking statements within the meaning
Weatherization Assistance Program (WAP) Space Heater Policy
 Space Heater Policy") Department of Energy MEMORANDUM Date: March 18, 1992 Subject: To: Weatherization Assistance Program (WAP) Space Heater Policy Support Office Directors, WAP Program Managers BACKGROUND An estimated three
Department of Energy MEMORANDUM Date: March 18, 1992 Subject: To: Weatherization Assistance Program (WAP) Space Heater Policy Support Office Directors, WAP Program Managers BACKGROUND An estimated three
EVALUATION OF ALTERNATIVERS TO R404 THE MOST COMMON REFRIGERANT IN SWEDISH GROCERY STORES
 EVALUATION OF ALTERNATIVERS TO R404 THE MOST COMMON REFRIGERANT IN SWEDISH GROCERY STORES Ola, Gustafsson M.Sc. a *, Lennart Rolfsman M.Sc. a, Sara Jensen B.Sc. a, Markus Lindahl M.Sc. a, a SP Technical
STORMWATER UTILITY FREQUENTLY ASKED QUESTIONS
 STORMWATER UTILITY FREQUENTLY ASKED QUESTIONS What is Stormwater? Stormwater is water that falls to the ground during a precipitation event. When land is undeveloped or covered with vegetative surface,
Flameless Technology Demonstration Heater
 Environmental Conference Poster Session October 14-16, 2012 Denver Marriott City Center Denver, Colorado Flameless Technology Demonstration Heater Presented By: Taras Lewus Sage Environmental Consulting,
USE OF WASTE WOOD IN PL YWOOD MANUFACTURE A CASE HISTORY
 USE OF WASTE WOOD IN PL YWOOD MANUFACTURE A CASE HISTORY GREG G. CAMERON SWF Plywood Co., Subsidiary of Southwest Forest Industries Albany, Oregon GARY GRIMES SWF Plywood Co., Subsidiary of Southwest Forest
Securities Dealing Policy
 Securities Dealing Policy INTRODUCTION PURPOSE AND OBJECTIVES As a public company, CSL is bound by laws governing the conduct for buying, selling and otherwise dealing in securities. This document sets
US Energy Efficiency Policy. Steven Nadel American Council for an Energy- Efficient Economy (ACEEE) May 2017
 May 2017") US Energy Efficiency Policy Steven Nadel American Council for an Energy- Efficient Economy (ACEEE) May 2017 American Council for an Energy-Efficient Economy Non-profit research organization Founded in
US Energy Efficiency Policy Steven Nadel American Council for an Energy- Efficient Economy (ACEEE) May 2017 American Council for an Energy-Efficient Economy Non-profit research organization Founded in
Summary of 60-Day Notice: Heating Efficiency
 Notification Date: November 5, 2015 Summary of 60-Day Notice: Heating Efficiency Public Service Company of Colorado ( the Company ) posts this 60-Day Notice to add a new measure to the Heating Efficiency
Adv. 8.4 Guidelines for Biosafety Cabinets Rev
 UNIVERSITY OF CINCINNATI Environmental University Health Services 556-4968 Health and Safety ADVISORY NO. 8.4: GUIDELINES FOR THE SELECTION, INSTALLATION AND USE OF BIOSAFETY CABINETS (INCLUDING ISSUES
REFRIGERANT PROCEDURE
 REFRIGERANT PROCEDURE 1. PURPOSE Chlorofluorocarbons contained in some refrigerants are considered to be ozone depleting compounds and therefore damaging to the environment. The Environmental Protection
TANKLESS WATER HEATER HEATING SOLUTIONS
 TANKLESS WATER HEATER HEATING SOLUTIONS 2017 Rinnai America Corporation. The material contained in this course was researched, assembled, and produced by Rinnai America Corporation and remains their property.
Element D Services Heating, Ventilating, and Air Conditioning
 PART 1 - GENERAL 1.01 OVERVIEW A. This section includes criteria for the design of building heat generating systems including all isolation valves and steam piping and fittings, steam specialties, control
06-96 DEPARTMENT OF ENVIRONMENTAL PROTECTION CONTROL OF EMISSIONS FROM OUTDOOR WOOD BOILERS
 Chapter 150: CONTROL OF EMISSIONS FROM OUTDOOR WOOD BOILERS SUMMARY: This regulation establishes particulate emission standards, siting criteria and labeling requirements for outdoor wood boilers. 1. Applicability.
Introduction to Control Technology
 Chapter 13 Introduction to Control Technology Introduction to Control Technology Carbon adsorption Incineration Condensation Bioreaction Carbon Adsorption 13-1 Activated Carbon A class of materials Produced
CH 4 C 2 H 2 C 3 H 8 CO 2 H 2 H 2 S HFC NH 3 NO 2 O 2 O 3 SO 2
 PluraSens CH 4 C 2 H 2 C 3 H 8 CO CO 2 H 2 H 2 S HFC NH 3 NO 2 O 2 O 3 SO 2 VOC E2600 Family Gas Detectors E2610 Series Compact wall-mount housing providing optimal airflow Integrated sensor with long
High Performance Diesel Fueled Cabin Heater. Abstract
 High Performance Diesel Fueled Cabin Heater Tom Butcher and James Wegrzyn Energy Science and Technology Division Building 526 Upton, N.Y. 11973 Brookhaven National Laboratory Abstract Recent DOE-OHVT studies
Field Validation of an On-Line FTIR Analyzer for Measuring Total Siloxane Content in Landfill Gas
 Field Validation of an On-Line FTIR Analyzer for Measuring Total Siloxane Content in Landfill Gas Barbara Marshik MKS Instruments Barbara_Marshik@MKSinst.com Presented at the 2014 LMOP Conference Distribuido
For the quarter and six-month period ended June 30, 2010
 2 1 Almacenes Éxito S.A Second Quarter Consolidated 2 financial report 1 financial results The converted Éxito Libertador store in Santa Marta For the quarter and six-month period ended June 3, 21 Working
410AREFRIGERANTTRANSITIONGUIDE
 Contactyourlocal ValueFirstrepresenta ve byvisi ng www.valuefirstonline.com/local 410AREFRIGERANTTRANSITIONGUIDE Replace-Retrofit-Repair (seenextpagefordetails) REPLACE OR REPAIR? OUR HVAC EVALUATION HELPS
Trends for Radiant Tube Heated Strip Lines
 WS Thermal Process Technology Inc., Elyria, Ohio WS Thermal Process Technology Inc., Elyria, Ohio Abstract WS Thermal Process Technology Inc., Elyria, Ohio Introduction After a extended period of low and
PETRO-CANADA OIL AND GAS. FIRE-TUBE IMMERSION HEATER OPTIMIZATION PROGRAM & Field Heater Audit Program
 PETRO-CANADA OIL AND GAS FIRE-TUBE IMMERSION HEATER OPTIMIZATION PROGRAM & Field Heater Audit Program Energy Management Work Shop The Fuel Gas Challenge by Phil Croteau P. Eng. Energy Efficiency Engineer
APPENDIX A FEES SECTION FC A01 CERTIFICATES A01.1
 FEES SECTION FC A01 CERTIFICATES A01.1 Certificate fees. Applicants for certificates required pursuant to the provisions of this code or the rules shall pay the fees specified in this section. Fees for
...WHY WAIT? IT S TIME TO SWITCH TO A NORITZ TANKLESS
 ...WHY WAIT? IT S TIME TO SWITCH TO A NORITZ TANKLESS If you answered YES to one or more of these questions, maybe it s time to replace your old tank-type water heater with a new, high-efficiency, tankless
Your Landfill Cap is an Asset, Profit from It!
 Spectro PowerCap Your Landfill Cap is an Asset, Profit from It! 40th Annual SWANA 2011 Western Regional Symposium May 17th May 17, 2011 Western Regional Symposium 1 Carlisle Companies Fast Facts: Founded
VAPOUR RECOVERY DURING FUEL LOADING. Ben Adamson Principal Engineer Refrigeration Engineering Pty Ltd, NSW Australia
 VAPOUR RECOVERY DURING FUEL LOADING Ben Adamson Principal Engineer Refrigeration Engineering Pty Ltd, NSW Australia ben_adamson@refeng.com.au ABSTRACT Volatile fuels such as gasoline and naphtha, and to
NHS Sustainable Development: 14 th February Reduce Energy Consumption Through Steam System Modernisation. National Key Account Manager
 NHS Sustainable Development: 14 th February 2012 Reduce Energy Consumption Through Steam System Modernisation Presentation by: Andy Bennett National Key Account Manager 1 Overview 1. Thermal Energy International
Application Bulletin. LNG / LPG Facilities FLAME AND GAS DETECTION FOR LNG FACILITIES
 FLAME AND GAS DETECTION FOR LNG FACILITIES Liquefied natural gas (LNG) is a generic name for liquefied hydrocarbon gas composed primarily of methane. When natural gas is cooled to approximately -260 F,
In this issue: E-Waste Recycling and Reuse Services Market Overview
 Issue 30 April 4, 2012 In this issue: E-Waste Recycling and Reuse Services Market Overview By Nana Lapham SBI Energy E-Waste Recycling and Reuse Services Market Overview BY NANA LAPHAM SBI ENERGY E-Waste
Forced Draft Boiler Flue Gas Venting: Problems & Solutions. Presented by Steve Connor and Patrice Gouin January 27, 2016
 Forced Draft Boiler Flue Gas Venting: Problems & Solutions Presented by Steve Connor and Patrice Gouin January 27, 2016 What Will We Be Covering Today? Pressurized Non-condensing Vent Systems Venting s
GAS CONDENSING TECHNOLOGY
 GAS CONDENSING TECHNOLOGY Authors: Ing. Dipl.-Ing. (FH) Markus Telian, Dipl.-Ing. Stefan Müller Hovalwerk AG Marketing and Development Vaduz, Principality of Liechtenstein. Abstract Hoval has realized
ScS Group Plc Interim Results For The 26 Weeks Ended 24 January 2015 March 2015
 ScS Group Plc Interim Results For The 26 Weeks Ended 24 January 2015 March 2015 October 2014 H1 2015 Highlights Financial Highlights: Like for like sales order intake up 7.8% Flooring up 13.0% Total sales
S 2024 S T A T E O F R H O D E I S L A N D
 LC001 01 -- S 0 S T A T E O F R H O D E I S L A N D IN GENERAL ASSEMBLY JANUARY SESSION, A.D. 01 A N A C T RELATING TO HEALTH AND SAFETY - OUTDOOR WOOD-FIRED HYDRONIC HEATERS Introduced By: Senator William
Ashirwad Carbonics (India) Private Limited
 Private Limited") Ashirwad Carbonics (India) Private Limited Co2 Production Plant Technical Literature Our precision engineered range of CO2 Generation Plant is available in various capacities and models as per the clients
Ashirwad Carbonics (India) Private Limited Co2 Production Plant Technical Literature Our precision engineered range of CO2 Generation Plant is available in various capacities and models as per the clients
GASBLASTER LSX4 OPERATION MANUAL
 GASBLASTER LSX4 OPERATION MANUAL 2 The treatment and transfer of wastewater produces odor emissions what are sometimes disturbing for the population living nearby a waste treatment facility or pumping
A. Product data. Unless otherwise indicated, submit the following for each type of product provided under work of this Section:
 This is a guidance document with sample specification language intended to be inserted into project specifications on this subject as appropriate to the agency's environmental goals. Certain provisions,
Heating Efficiency Program COLORADO
 Heating Efficiency Program COLORADO Commercial Heating Efficiency Our Heating Efficiency program is designed to help Colorado businesses earn rebates and save costs through natural gas and electric efficiency
The Environmental Health & Safety Guardian
 East Tennessee State University Johnson City, TN 37614 Fall, 2018 INSIDE THIS ISSUE STORMWATER MANAGEMENT EMERGENCY PREPAREDNESS INFORMATION The Environmental Health & Safety Guardian GREETINGS HAZARDOUS
ANCHORAGE, ALASKA AO No (S)
") Submitted by: Chair of the Assembly at the Request of the Acting Mayor Prepared by: Department of Health and Human Services For reading: June, 00 ANCHORAGE, ALASKA AO No. 00 (S) 0 0 0 AN ORDINANCE AMENDING
Submitted by: Chair of the Assembly at the Request of the Acting Mayor Prepared by: Department of Health and Human Services For reading: June, 00 ANCHORAGE, ALASKA AO No. 00 (S) 0 0 0 AN ORDINANCE AMENDING
E-Waste Frequently Asked Questions August 1, 2017
 CHRIS CHRISTIE DEPARTMENT OF ENVIRONMENTAL PROTECTION BOB MARTIN Governor Commissioner Division of Solid & Hazardous Waste Bureau of Recycling & Hazardous Waste Management KIM GUADAGNO 401 East State Street
ENERGY STAR Update. Steve Ryan, U.S. EPA Program Manager, ENERGY STAR Labeled Roof Products. September 22, 2011
 ENERGY STAR Update Steve Ryan, U.S. EPA Program Manager, ENERGY STAR Labeled Roof Products September 22, 2011 ENERGY STAR Started in 1992;voluntary program GOAL: Reduce greenhouse gas (GHG) emissions through
2010/2011 GOOD ENERGY REBATE PROGRAM
 2010/2011 GOOD ENERGY REBATE PROGRAM YUKON GOVERNMENT S ENERGY SOLUTIONS CENTRE FINAL REPORT December 9, 2011 TABLE OF CONTENTS TABLE OF CONTENTS...2 1. PROGRAM OVERVIEW...3 2. PROJECT BUDGET...4 3. PROJECT
Sound Transit 3. Appendix A: Detailed Description of Facilities and Estimated Costs
 Sound Transit 3 Appendix A: Detailed Description of Facilities and Estimated Costs Table of Contents Sound Transit 3 Plan Map... 3 Total agency: Projects... 4 Total agency: Sources and uses of funds...
Comprehensibility of the Energy Label for space heaters and water heaters and of the new Efficiency Label for old space heaters in Germany
 Comprehensibility of the Energy Label for space heaters and water heaters and of the new Efficiency Label for old space heaters in Germany Results of two focus groups and a representative consumer survey
a. CFCs. b. HCFCs. c. Pressurized nitrogen. d. Compressed dry air. 17. The state of the refrigerant leaving the condenser of a refrigeration system
 Core 1. Ozone in the stratosphere above the earth consists of: a. Molecules containing 3 oxygen atoms. b. Molecules of 2 oxygen atoms. c. Radioactive particles. d. Pollutants that have risen from ground
TOTAL SYSTEM EFFICIENCY: SYSTEM APPLICATIONS & DESIGNS. David Grassl PE Mechanical Engineer Principal
 TOTAL SYSTEM EFFICIENCY: SYSTEM APPLICATIONS & DESIGNS David Grassl PE Mechanical Engineer Principal Similar to traditional boiler systems, condensing boiler systems have many designs they can operate
79th OREGON LEGISLATIVE ASSEMBLY Regular Session. House Bill 2386
 th OREGON LEGISLATIVE ASSEMBLY-- Regular Session House Bill Introduced and printed pursuant to House Rule.00. Presession filed (at the request of House Interim Committee on Health Care for Association
The products covered by the Regulation can be classified as follows:
 Table of Contents 1. Purpose of the guidelines and disclaimer... 3 1.1. The Regulation... 3 2. Scope... 3 3. Product environmental impacts... 4 4. State of play of legislation... 4 4.1. History of the
Post-Harvest Management: The Economics of Grain Drying
 Post-Harvest Management: The Economics of Grain Drying Alex Butler, Dr. Jordan Shockley, Dr. Sam McNeill, and Dr. Todd Davis Agricultural Economics & Biosystems & Agricultural Engineering INTRODUCTION