2017 Annual Report. Delivering value today and tomorrow
|
|
|
- Rosa Harper
- 6 years ago
- Views:
Transcription


1 2017 Annual Report Delivering value today and tomorrow
2 The primary objective of Wesfarmers is to provide a satisfactory return to its shareholders. About Wesfarmers From its origins in 1914 as a Western Australian farmers cooperative, Wesfarmers has grown into one of Australia s largest listed companies. With headquarters in Western Australia, its diverse business operations cover: supermarkets, liquor, hotels and convenience stores; home improvement; department stores; office supplies; and an Industrials division with businesses in chemicals, energy and fertilisers, industrial and safety products and coal. Wesfarmers is Australia s largest private sector employer with around 223,000 employees (including more than 4,200 Indigenous team members) and has a shareholder base of approximately 515,000. About this report This annual report is a summary of Wesfarmers and its subsidiary companies operations, activities and financial position as at 30 June In this report references to Wesfarmers, the company, the Group, we, us and our refer to Wesfarmers Limited (ABN ) unless otherwise stated. References in this report to a year are to the financial year ended 30 June 2017 unless otherwise stated. All dollar figures are expressed in Australian dollars (AUD) unless otherwise stated. All references to Indigenous people are intended to include Aboriginal and/or Torres Strait Islander people. Wesfarmers is committed to reducing the environmental footprint associated with the production of the annual report and printed copies are only posted to shareholders who have elected to receive a printed copy. This report is printed on environmentally responsible paper manufactured under ISO environmental standards.
3 Contents Overview Governance 2 The year in review 4 Chairman s message 6 Managing Director s report 62 Board of directors 64 Corporate Governance Overview 8 Performance overview 10 Executive Leadership Team Directors report Operating and financial review 12 Operating and financial review 22 Retail businesses 22 Coles 28 Home Improvement 34 Department Stores 36 Kmart 37 Target 40 Officeworks 44 Industrials 46 Chemicals, Energy and Fertilisers 48 Industrial and Safety 50 Resources 52 Other activities Sustainability 53 Sustainability 68 Directors report 73 Remuneration report Financial statements 93 Financial statements 99 Notes to the financial statements Signed reports 139 Directors declaration 140 Independent auditor s report Shareholder and ASX information 145 Annual statement of coal resources and reserves 148 Shareholder information 149 Five-year financial history 150 Investor information 151 Corporate directory 152 Wesfarmers brands


4 Overview The year in review Delivering value today and tomorrow Bunnings United Kingdom and Ireland opened four pilot stores during the year. p28 Richard Goyder reflects on his time as Managing Director. p6 Wesfarmers is a special company. I often describe it as financially focused with a heart. We are clear on our objectives of providing our shareholders with a satisfactory return, knowing we can only do that through creating value for all our stakeholders. In 2017 Rob Scott will become Wesfarmers' eighth Managing Director. p5 Our community contributions exceeded $130m. p60 $2.23 DIVIDENDS PER SHARE p8 Kmart growth Kmart delivered another year of strong earnings growth. p36 2


5 Coles continued to invest in value, quality and service. p22 Our suppliers received $46.4b. p8 Industrials had a strong recovery in earnings. p44 Terry Bowen leaves Wesfarmers in great financial shape, with a strong balance sheet and record cash flows. p12 $2.1b GOVERNMENT TAXES AND ROYALTIES p8 Officeworks continues to drive growth and productivity. p40 We employ around 223,000 people and paid $8.7b in salaries, wages and other benefits. p8 Sustainability matters Understanding and managing the ways we impact our community and the environment is important to us. p53 3


6 Overview Chairman s message I am pleased to report on another successful year for your company. CHAIRMAN MICHAEL CHANEY AO On a statutory reporting basis, Wesfarmers recorded a substantial increase in net profit for the 2017 financial year compared to that reported in the 2016 financial year when profit was reduced by impairment charges in Curragh and Target, as well as significant restructuring costs in Target. Excluding those significant items, underlying net profit after tax increased 22.1 per cent to $2,873 million. Earnings per share increased 21.6 per cent to a record $2.55 and return on equity rose from 9.6 per cent to 12.4 per cent. The directors declared a fully-franked final dividend of $1.20 per share, lifting the full-year dividend per share to $2.23 from $1.86 in The company s results for the year illustrated the advantages of its conglomerate structure. Increases in earnings from the Industrial businesses, Kmart and Bunnings in Australia and New Zealand as well as reduced losses in Target, more than offset the fall in profits in Coles supermarkets and losses in the United Kingdom and Ireland home improvement business. The focus of management and the Board continues to be on providing a superior return to shareholders over the long term. At times this can mean sacrificing short-term profits to support our longer term business growth; the Coles business today provides a good example of that. 4

7 Competition is strong across all of our markets, with new players entering the field and new products and processes challenging the status quo; but that has always been the case. The pace of change may be faster today but that simply highlights the need to keep innovating. This, I think, has been a strength of Wesfarmers since it listed in In that context it is instructive to consider the growth of the company over those 33 years, when its market value has increased 600-fold, from $80 million on listing to $48 billion today. During that period, $22.3 billion of net new equity has been raised and $23.3 billion of dividends have been paid to shareholders, meaning that the whole $48 billion of increased shareholder value has come from business growth. The task, of course, is to continue that record of success but I believe we have the management team, culture and systems to achieve that. Several of the challenges facing all companies doing business in Australia today occur at the government level. The increasing tendency of governments to adopt populist policies counts against productive economic outcomes. Examples of this include the recent changes to Section 46 of the Competition and Consumer Act and to the 457 visa regulations. Subsequent amendments to the original form of the latter are welcome but the tighter rules still have the potential to deprive Australia of the skills it badly needs to operate effectively. A second concerning issue is the difficulty the Federal Government has in passing legislation in the absence of a Senate majority. Resolution of this legislation gridlock requires the Labor Opposition and minor parties to put aside considerations of short term political interest in the interest of national prosperity. A third issue encumbering Australian business is the very restrictive workplace relations system under which we operate. The current system is instead serving as a deterrent to the enterprise bargaining process, working against the interests of employers, employees and unions in seeking to provide flexible and appropriate terms of employment. The uncertainty created by decisions of the Fair Work Commission in the retail sector operates as a disincentive to bargaining and a barrier to building the flexibility that would allow businesses to meet the needs of consumers. A fourth issue is the increasingly uncompetitive corporate tax rate prevailing in Australia. Attempts by the Federal Government to reduce the rate to 25 per cent for all companies - a reduction that would undoubtedly have resulted in increased employment and economic activity - were opposed by Labor and then watered down in negotiation with the minor parties to the point where the effect will be minimal. A final issue is the unnecessary complexity associated with doing business across Australia through lack of uniformity in State-based legislation. For instance, there are widespread inconsistencies in retail trading laws across and within States and Territories, including differences in extended weekday trading hours, Sunday trading, public holiday trading and restricted trading days, which may or may not relate to public holidays. This is further complicated by additional layers of legislated retail restrictions depending on the maximum number of employees at any one time, selling floor size and type of goods sold. These legislative differences add significant additional cost and loss of productivity for businesses, cause customer inconvenience and confusion, and impact jobs and investment. These impacts are becoming acute as consumers increasingly purchase products online at any time with this trading exempt from the restrictions applying to bricks and mortar stores. Succession The end of the 2017 calendar year sees major change in senior management at Wesfarmers. In November, Rob Scott will succeed Richard Goyder as Group Managing Director and Chief Executive Officer; and Anthony Gianotti will succeed Terry Bowen as Group Chief Financial Officer. The directors are pleased that, as has been the case historically, these critical appointments have been able to be made internally, with people who understand the company s values and culture. Richard Goyder has been an outstanding chief executive over his 12-year term in that role. The fact that the company has outperformed the general market over the past decade, in the face of the global financial crisis occurring soon after the major acquisition of the Coles Group, is due in no small part to Richard s personal values, his calm in the face of challenge, his focus on performance and his ability to inspire his people. He leaves with our sincere thanks and appreciation. Terry Bowen has been described elsewhere as one of Australia s best chief financial officers. His attention to detail, in-depth knowledge of our businesses and outstanding work ethic justify that accolade. Terry leaves Wesfarmers in great financial shape, with strong cash flows and the balance sheet potential for significant new investment. The directors are confident that Rob Scott, Anthony Gianotti and the new senior divisional appointees following Rob and Anthony's promotions are well qualified to lead the company forward. Outlook With a strong balance sheet, shareholder-focused culture and very capable people, the Board is confident that Wesfarmers can continue to provide superior shareholder returns. We acknowledge the efforts of our 223,000 employees and thank them for their dedication to the company. MICHAEL CHANEY AO Chairman 5


8 Overview Managing Director s report We were pleased to report a significant increase in our earnings in the 2016/17 financial year through improvements in our retail and industrial businesses. Cash generation was very strong reflecting our culture of focusing on return on capital in each of our businesses. MANAGING DIRECTOR RICHARD GOYDER AO A lot of work goes into ensuring that our balance sheet is strong and has capacity to deal with external shocks and take advantage of opportunities as they arise. It can be an underrated asset, but we are very focused on it. Operationally, we are generally happy with each business in the Group. Coles is trading through a challenging period in a competitive market where we have had to invest in value and service. We are pleased that we have been able to grow customer numbers, transactions and sales, and excited about a number of initiatives at Coles which will lead to even better products and services in the years ahead. Pleasingly, our liquor business grew through the year in both revenue and earnings. While fuel volumes fell, our convenience stores were able to grow sales. Bunnings Australia and New Zealand continued its stellar run of growth. This is a wonderful business for Wesfarmers to own and we are excited with the opportunities to grow into the future. Bunnings' investment in the United Kingdom and Ireland is in the early days of an ambitious plan to rollout a strong network of stores through the conversion of Homebase stores. We have made good progress on the operational aspects of our plans, with our new Bunnings-branded stores performing well. 6
9 John Gillam stepped down from his role as Managing Director of the division late last year after around 11 years, marked by strong growth and the building of Bunnings as one of the most respected brands in Australia. Officeworks had another strong year, notwithstanding some distractions as we looked to see if there was an opportunity to realise value for shareholders. Kmart and Target combined increased earnings and we continue to optimise property, procurement, ethical sourcing and other activities between both businesses. Kmart is in a very strong position to continue growing as customers increasingly discover the great value in its stores. Target improved performance as the cost base was appropriately restructured. We are very pleased with the performance of our industrial businesses. Our Chemicals, Energy and Fertilisers business continues to expand and deliver strong returns. The Industrial and Safety business also delivered a good improvement in earnings through a strong focus on our customers, and on new markets. Our Resources business recorded a significant increase in earnings on the back of higher export coal prices, and improvements in our operating performance and productivity. As this is my last chance through the medium of the annual report to communicate with shareholders, I wanted to reflect on my 12 years as CEO, and 15 years on the Wesfarmers Board. Wesfarmers is a special company. I often describe it as financially focused with a heart. We are clear on our objective of providing our shareholders with a satisfactory return, knowing we can only do that through creating value for all our stakeholders. Financial performance is the foundation which then enables us to grow, provide opportunities, and invest in the people and communities with whom we deal. We have a great set of assets which collectively welcome more than 20 million Australians each week through our doors. You will see elsewhere in this report just how much value we create in terms of payments to our 223,000 employees, suppliers, government, community contributions and, of course, our shareholders. Built on the foundation of financial performance, we care about our reputation and look to make decisions through the lens of what the right thing to do for Wesfarmers is. The challenge every day in Wesfarmers is to innovate, create new opportunities, and look to take appropriate risk in order to meet competitive threats, as we always have. As the Chairman points out in his report, the economy will be better if government and policymakers encourage business to do that and employ more people one of my biggest frustrations is that we still deal with regulations which are designed to stop us growing, and protect others from competition, at a significant cost to our customers and productivity. There is a need and a place for good regulation but our economy and community are harmed when regulation is introduced or retained simply because of political pressures. I have been very fortunate to work at Wesfarmers where the Board consistently takes a long-term view, looks through cycles, and accepts that mistakes happen. Each of the Chairs during my time as CEO, Trevor Eastwood, Bob Every and Michael Chaney, have been excellent to work with and supportive, as have all the directors I have served with. At the end of the day, it is the people at Wesfarmers who drive competitive advantage and I have been fortunate to work with wonderful people. My sincere thanks to all those on the leadership team for their support and commitment. I would particularly like to acknowledge Terry Bowen s outstanding contribution as Finance Director since Terry has played a very significant role at Wesfarmers and we wish him well as he moves onto other challenges. Looking forward, Rob Scott and Anthony Gianotti have each had exceptional careers at Wesfarmers, and will, in my view, be outstanding leaders. Finally, thanks! Thank you to: our shareholders for your support our wonderful employees the Board, my senior management colleagues, and brilliant executive assistants my loving family, and my best mate and partner Janine who took on the role as chief supporter, critic, carer and also wife with unbelievable energy and passion. RICHARD GOYDER AO Managing Director 7
10 Overview Performance overview Creating wealth and adding value Wealth creation $68.4b $46.4b Payments to suppliers Value distribution $15.2b $8.7b Employees (salaries, wages and other benefits) $2.1b Government (taxes and royalties) $0.3b Lenders (borrowed funds) $2.5b Shareholders (dividends) $1.6b Reinvested in the business $6.8b Payments for rent, services and other external costs Group performance KEY FINANCIAL DATA Revenue from ordinary activities $m 68,444 65,981 Earnings before interest, tax, depreciation and amortisation $m 5,668 2,642 Earnings before interest, tax, depreciation and amortisation (excluding significant items) 1 $m 5,668 4,903 Depreciation and amortisation $m 1,266 1,296 Earnings before interest and tax $m 4,402 1,346 Earnings before interest and tax (excluding significant items) 1 $m 4,402 3,607 Finance costs and income tax expense $m 1, Net profit after tax $m 2, Net profit after tax (excluding significant items) 1 $m 2,873 2,353 Operating cash flows $m 4,226 3,365 Net capital expenditure on property, plant and equipment, and intangibles $m 1,028 1,336 Free cash flows $m 4,173 1,233 Equity dividends paid $m 1,998 2,270 Total assets $m 40,115 40,783 Net debt $m 4,809 7,103 Shareholders' equity $m 23,941 22,949 KEY SHARE DATA Basic earnings per share cents Basic earnings per share (excluding significant items) 1 cents Operating cash flow per share cents Free cash flow per share cents Dividends per share (declared) cents KEY RATIOS Return on average shareholders' equity (R12) (excluding significant items) 1 % Fixed charges cover (R12) 2 times Interest cover (R12) (cash basis) 2 times Gearing (net debt to equity) % excludes the following pre-tax (post-tax) amounts: $1,266 million ($1,249 million) non-cash impairment of Target; $850 million ($595 million) non-cash impairment of Curragh; and $145 million ($102 million) of restructuring costs and provisions to reset Target excludes pre-tax non-cash impairments of $2,116 million relating to Target ($1,266 million) and Curragh ($850 million). 8
11 Overview It was pleasing to report a record level of earnings and operating cash flows and a strong increase in return on equity, demonstrating the strength of the Group's conglomerate structure and focus on cash generation and capital efficiency. Operating and financial review Divisional performance COLES Revenue $m 39,217 39,242 Earnings before interest and tax $m 1,609 1,860 Segment assets $m 21,140 22,122 Segment liabilities $m 4,245 4,273 Capital employed (R12) $m 16,586 16,541 Return on capital employed (R12) % HOME IMPROVEMENT Revenue $m 13,586 11,571 Earnings before interest and tax $m 1,245 1,214 Segment assets $m 6,612 6,620 Segment liabilities $m 2,227 2,186 Capital employed (R12) $m 4,110 3,599 Return on capital employed (R12) % DEPARTMENT STORES Revenue $m 8,528 8,646 Earnings before interest and tax $m Segment assets $m 3,928 3,970 Segment liabilities $m 1,423 1,336 Capital employed (R12) $m 2,253 3,629 Return on capital employed (R12) % OFFICEWORKS Revenue $m 1,964 1,851 Earnings before interest and tax $m Segment assets $m 1,401 1,379 Segment liabilities $m Capital employed (R12) $m Return on capital employed (R12) % INDUSTRIALS Revenue $m 5,161 4,672 Earnings before interest and tax $m Segment assets $m 4,229 4,220 Segment liabilities $m 1,125 1,221 Capital employed (R12) $m 3,393 4,244 Return on capital employed (R12) % Sustainability Governance Directors report Financial statements Signed reports 1 The 2016 earnings before interest and tax for Department Stores includes $145 million of restructuring costs and provisions to reset the Target business, but excludes the non-cash impairment of $1,266 million. 2 The 2016 earnings before interest and tax for Industrials excludes the $850 million non-cash impairment of Curragh. 9 Shareholder and ASX information


12 Overview Executive Leadership Team RICHARD GOYDER AO Managing Director, Wesfarmers Limited Richard was appointed Chief Executive Officer and Managing Director of Wesfarmers in He has held a number of executive positions in Wesfarmers, including Managing Director of Wesfarmers Landmark and Finance Director of Wesfarmers. Before joining Wesfarmers in 1993, Richard held a number of senior positions with Tubemakers of Australia. As announced in February 2017, Richard will step down as Managing Director in November 2017 after more than 12 years in the role. ROB SCOTT Deputy Chief Executive Officer, Wesfarmers Limited Rob was appointed Deputy Chief Executive Officer of Wesfarmers in February 2017 and will become its Managing Director in November Rob joined Wesfarmers in 1993, before moving into investment banking, where he held various roles in Australia and Asia. He rejoined Wesfarmers in Business Development in 2004, was appointed Managing Director of Wesfarmers Insurance in 2007 and then Finance Director of Coles in Rob was appointed Managing Director, Financial Services in 2014 and then Managing Director of the Wesfarmers Industrials division from August 2015 until August TERRY BOWEN Finance Director, Wesfarmers Limited (to 4 September 2017) Terry joined Wesfarmers in 1996 and undertook various roles with Wesfarmers Landmark, including Chief Financial Officer from In 2003, he was appointed as Jetstar Airways inaugural Chief Financial Officer before rejoining Wesfarmers in 2005 as Managing Director, Wesfarmers Industrial and Safety. Terry became Finance Director, Coles in 2007 before being appointed Finance Director, Wesfarmers in Terry stepped down as Finance Director in September 2017 after eight years in the role and 12 years on the Wesfarmers Leadership Team. He will remain in the role of Chief Financial Officer and as a member of the Executive Leadership Team until 10 November ANTHONY GIANOTTI Deputy Chief Financial Officer, Wesfarmers Limited Anthony was appointed Deputy Chief Financial Officer of Wesfarmers in July 2017 and will become its Chief Financial Officer on 10 November Anthony joined Wesfarmers in 2004 in Business Development and in 2005 became Manager, Investor Relations and Business Projects. In 2006, he was appointed Head of Business Development and Strategy of Wesfarmers Insurance, then Finance Director in 2009 and Managing Director in In August 2015, he was appointed Finance Director of the Wesfarmers Industrials division and its Deputy Managing Director in February MAYA VANDEN DRIESEN Group General Counsel, Wesfarmers Limited Maya was appointed Group General Counsel of Wesfarmers in January Prior to this, Maya held a number of senior roles in the company including Legal Counsel Litigation, Senior Legal Counsel and General Manager Legal Litigation. Maya holds Bachelor of Jurisprudence and Bachelor of Laws degrees from The University of Western Australia and was admitted to practise as a barrister and solicitor in Prior to joining Wesfarmers, Maya practised law at Parker & Parker and Downings Legal. JOHN DURKAN Managing Director, Coles John was appointed Managing Director of Coles in July John joined Coles in July 2008 as Merchandise Director and was subsequently appointed Chief Operating Officer in June He brings a wealth of customer, product and buying knowledge having worked for 17 years with Safeway Stores PLC and as the Chief Operating Officer for Carphone Warehouse in the United Kingdom. 10


13 Overview Operating and financial review MICHAEL SCHNEIDER Managing Director, Bunnings Group Managing Director, Bunnings Australia and New Zealand Michael was appointed Managing Director, Bunnings Australia and New Zealand in March 2016, following the acquisition of the Homebase business in the United Kingdom and Ireland. He became Managing Director, Bunnings Group in May 2017, and retains responsibility for the Australian and New Zealand businesses. Michael joined Bunnings in 2005, and prior to that he held a range of senior operational, commercial and human resource roles across regional and national markets, both in retail and financial services. GUY RUSSO Chief Executive Officer, Department Stores Managing Director, Target Guy joined Wesfarmers in 2008 as Managing Director of Kmart, and was appointed Chief Executive Officer of the Department Stores division in February Prior to this, Guy worked for McDonald s, beginning his career in He was appointed Managing Director and Chief Executive Officer at McDonald s Australia from 1999 before becoming President, McDonald s Greater China from 2005 to He is currently on the Board of Guzman y Gomez and is President of global non-profit, OneSky, for orphaned and at-risk children. DAVID BAXBY Managing Director, Wesfarmers Industrials David commenced as Managing Director, Wesfarmers Industrials in August Prior to this, he was President and Chief Executive Officer of international shopping transaction processing business, Global Blue. From 2004, David held a number of commercial and leadership roles within the Virgin Group, and was Co-Chief Executive Officer from 2011 to Earlier in his career, David was a Partner and Executive Director of Goldman Sachs in both London and Sydney. Until recently, David was Chairman of Frontier Digital Ventures, and a director of Virgin Australia, Velocity Frequent Flyer, Unlockd and Workpac Limited. Sustainability Governance Directors report LINDA KENYON Company Secretary, Wesfarmers Limited Linda was appointed Company Secretary of Wesfarmers in April 2002 and is also company secretary of a number of Wesfarmers Group subsidiaries. Linda joined Wesfarmers in 1987 as legal counsel and held that position until 2000 when she was appointed Manager of the responsible entity for the listed BWP Trust (formerly Bunnings Warehouse Property Trust). She is a Fellow of the Governance Institute of Australia. ALAN CARPENTER Executive General Manager, Corporate Affairs, Wesfarmers Limited Alan joined Wesfarmers as Executive General Manager, Corporate Affairs in December Prior to that he was Premier of Western Australia from January 2006 to September 2008 and served 13 years in the Western Australian Parliament. Alan has also worked as a journalist with the Seven Network and the ABC and lectured in Australian politics at the University of Notre Dame, Fremantle. JENNY BRYANT Chief Human Resources Officer, Wesfarmers Limited Jenny was appointed as Chief Human Resources Officer in September She joined Coles as Human Resources Director in 2011, and became its Business Development Director in Her previous work experience encompasses Mars, Vodafone and EMI Music in a number of global roles where she worked in various areas, including manufacturing, sales and marketing and human resources. Financial statements Signed reports 11 Shareholder and ASX information


14 Operating and financial review Operating and financial review On behalf of the Board, I m very pleased to present the operating and financial review of Wesfarmers for shareholders. FINANCE DIRECTOR TERRY BOWEN In presenting my last operating and financial review as Wesfarmers Finance Director, I would like to take the opportunity to thank the Board, Richard and all of the wonderful colleagues who bring the Wesfarmers Way to life for the benefit of all of our stakeholders. Wesfarmers primary objective is to deliver satisfactory returns to shareholders through financial discipline and exceptional management of a diversified portfolio of businesses. A key focus of the Group is ensuring that each of its divisions has a strong management capability that is accountable for strategy development and execution, as well as day-to-day operational performance. Each division is overseen by a divisional board of directors or a steering committee that includes the Wesfarmers Managing Director and Finance Director, and is guided by a Group-wide operating cycle and governance framework. This operating and financial review sets out the Group s objective, values, growth enablers and strategies. It also outlines a review of operational performance for the 2017 financial year, as well as summarising its risks and prospects. The 2017 financial performance is also outlined for each division, together with its competitive environment, strategies, risks and prospects. The review should be read in conjunction with the financial statements, which are presented on pages 93 to 138 of this annual report. 12
15 Overview The Wesfarmers Way BOLDNESS ROBUST FINANCIAL CAPACITY RESPONSIBILITY SOCIAL Ensure sustainability through responsible long term management CORE VALUES GROWTH ENABLERS OUTSTANDING PEOPLE VALUE-CREATING STRATEGIES Strengthen existing businesses through operating excellence and satisfying customer needs Our objective To provide a satisfactory return to shareholders Renew the portfolio through value-adding transactions Secure growth opportunities through entrepreneurial initiatives INTEGRITY COMMERCIAL EXCELLENCE CULTURE EMPOWERING Operating and financial review Sustainability Governance ACCOUNTABILITY INNOVATION OPENNESS Directors report The Wesfarmers Way Financial statements From our origins in 1914 as a Western Australian farmers cooperative, Wesfarmers has grown into one of Australia s largest listed companies and private sector employers, with more than 223,000 employees and approximately 515,000 shareholders. Wesfarmers diverse business operations in this year s review cover: supermarkets; home improvement; department stores; office supplies; chemicals, energy and fertilisers; industrial and safety products; and coal. Wesfarmers businesses operate in Australia, New Zealand, the United Kingdom and Ireland, with the portfolio including some of these countries leading brands. The Wesfarmers Way is the framework for the company s business model and comprises core values, growth enablers and value-creating strategies directed at achieving the Group s primary objective of providing a satisfactory return to shareholders. TERRY BOWEN Finance Director (to 4 September 2017) 13 Signed reports Shareholder and ASX information
16 Operating and financial review Our objective The primary objective of Wesfarmers is to provide a satisfactory return to shareholders. The measure used by the Group to assess satisfactory returns is total shareholder return (TSR) over time. We measure our performance by comparing Wesfarmers TSR against that achieved by the broader Australian market Index. Performance measures Growth in TSR relies on improving returns from invested capital relative to the cost of that capital and growing the capital base at a satisfactory rate of return on capital (ROC) 1. Given a key factor in determining TSR performance is the movement in Wesfarmers share price, which can be affected by factors outside the control of the company (including market sentiment, business cycles, interest rates and exchange rates), the Group focuses on return on equity (ROE) as a key internal performance indicator. While ROE is recognised as a fundamental measure of financial performance at a Group level, ROC has been adopted as the principal measure of business unit performance. ROC focuses divisional businesses on increasing earnings and/or increasing capital productivity by managing existing assets efficiently, as well as making an adequate return on any new capital deployed. Minimum ROC targets for each division are set based on their pre-tax cost of capital, while satisfactory ROC targets are established based on the Group s ROE targets, which are reviewed annually with reference to the performance of the broader market. 1 ROC = EBIT/(working capital, fixed assets and investments less provisions and other liabilities). Approach to delivering satisfactory returns to shareholders The Group seeks to: continue to invest in Group businesses where capital investment opportunities exceed return requirements; acquire or divest businesses where doing so is estimated to increase long-term shareholder wealth; and manage the Group s balance sheet to achieve an appropriate risk profile, an optimised cost of capital and flexibility to take advantage of opportunities as they arise. Cash flow generation Drive long-term earnings growth Manage working capital effectively Strong capital expenditure processes Invest above the cost of capital Financial discipline Balance sheet strength Diversity of funding sources Optimise funding costs Maintain strong credit metrics Risk management of maturities Delivery of long-term shareholder returns Improve returns on invested capital Grow dividends over time Effective capital management Cash flow generation In generating cash flow and earnings, the Group seeks to employ excellent management teams who are empowered to drive long-term earnings growth. This is achieved through deploying best practice principles in operational execution and maintaining a long-term focus in regards to strategy and results. The Group continuously looks to improve the working capital efficiency of all of its businesses. In addition, the Group ensures strong discipline in relation to capital expenditure or any other investment decisions that are made. Balance sheet strength The Group endeavours to achieve a cost of capital advantage while maintaining balance sheet strength and flexibility in order to be able to act when opportunities arise. This includes maintaining access to diverse sources of funding, including bank facilities and global bond markets, and optimising funding costs. The Group maintains strong credit metrics, in line with a strong investment grade credit rating, supported by good cash flow generation and disciplined capital management. Risk is managed by smoothing debt maturities over time, limiting the total repayments in any given year. Long-term shareholder returns With a focus on generating strong cash flows and maintaining balance sheet strength, the Group aims to deliver satisfactory returns to shareholders through improving returns on invested capital. As well as share price appreciation, Wesfarmers seeks to grow dividends over time commensurate with performance in earnings and cash flow. Dependent upon circumstances, capital management decisions may also be taken from time to time where this activity is in shareholders interests. 14
17 Overview Acquisition approach When reviewing the acquisition of businesses the Group considers various factors, as illustrated in the adjacent diagram. Acquisition filters Operating and financial review Importantly, in applying these filters the Group applies a long-term horizon to investment decisions and remains very disciplined in its approach to evaluation, with the most important filter being whether the investment is going to create value for shareholders over time. Investment approach Capacity to act through a strong balance sheet and focus on cash flow Flexibility through different ownership models (e.g., minority interest, full control, partnerships) Remain opportunistic to sector, structure and geography Financially disciplined including investment comparison to capital management alternatives Industry considerations Business considerations Financial evaluations Megatrend exposure Industry structure Industry scale Competitive position Wesfarmers fit Long-term investment horizon Discipline in financial projections Risk-adjusted hurdle rates Sustainability Governance Core values Growth enablers Integrity Acting ethically in all dealings Openness Openness and honesty in reporting, feedback and ideas Accepting that mistakes will happen from time to time and seeking to learn from them Accountability Significant delegation of authority and decision-making to divisions Accountability for performance Protecting and enhancing our reputation Boldness Strong and ready to make bold decisions and challenge the status quo in pursuit of growth and sustainability Supporting and encouraging an environment free of fear and blame A core attribute of the Wesfarmers operating model is that each of our businesses operates with a high degree of autonomy. Rather than mandating detailed strategies or implementation plans, the Group focuses on ensuring that the following six key enablers are in place in our businesses, with a goal of driving operating performance to best practice. Outstanding people Wesfarmers seeks to be an employer of choice. Attracting outstanding people and utilising their individual talents is the most critical element in striving for sustainable success. Wesfarmers recognises that while great assets and strategies are critical, it is people who ultimately drive outcomes. Commercial excellence Wesfarmers seeks to ensure that it employs strong financial discipline in all of its decisions across the Group. Wesfarmers has a clear bias towards promoting strong commercial capability across its leadership base. Empowering culture Wesfarmers recognises that an empowering culture is critical to engendering accountability for delivering the results agreed upon through the Group s corporate planning framework. Wesfarmers uses stretch targets in objective setting and encourages team members to be proactive in driving the creation of value in their businesses. Innovation Wesfarmers seeks to develop a culture that encourages innovation, and rewards boldness and creativity. Social responsibility Respect for employees, customers and suppliers and a relentless focus on providing safe workplaces are fundamental to the way that Wesfarmers operates. Wesfarmers social responsibility extends to maintaining high standards of ethical conduct, environmental responsibility and community contribution. Robust financial capacity By maintaining a strong balance sheet, the Group aims to provide a competitive cost and access to capital in order to allow the Group to act when value-creating opportunities present themselves. 15 Directors report Financial statements Signed reports Shareholder and ASX information
18 Operating and financial review Our value-creating strategies Consistent with the Wesfarmers Way, the Group s primary objective to provide a satisfactory return to shareholders is driven by four overarching strategies. These are: strengthening existing businesses through operating excellence and satisfying customer needs; securing growth opportunities through entrepreneurial initiative; renewing the portfolio through value-adding transactions; and ensuring sustainability through responsible long-term management. As outlined in the following table, each strategy is underpinned by the Group s well-established strategic planning framework. A key attribute of this approach is the maintenance of a long-term focus and acting sustainably in the creation of value and the building of businesses. At a divisional level, detailed strategies are developed specific to the opportunities to improve each of our individual businesses. Divisional strategies are discussed within their respective summaries, starting on page 22. Operating excellence Our strategies Our achievements Our focus for the coming years Strengthen existing businesses through operating excellence and satisfying customer needs Continued to make improvements in our customer offers, including reinvesting in value to drive business growth and improving merchandise ranges. Further optimised and invested in our retail store networks and digital channels. Focused on production plant efficiency and maintaining and growing customer relationships in our industrial businesses. Made further operational productivity improvements and reduced costs across our businesses. Coles remains committed to implementing customer-led strategies and delivering trusted value, quality and service. Continued investment in value will be supported by simplifying the business end-to-end. The division has plans to drive further improvement in fresh category sales. Coles will also maintain a disciplined and returns-focused approach to network expansion and capital investment, develop new channels and services, and progress its Liquor transformation. Bunnings will maintain its focus on driving long-term value creation by creating better experiences for customers and the wider community, investing in new and existing stores, delivering greater digital reach and strengthening the core of the business. Bunnings United Kingdom and Ireland will focus on building strong business foundations and establishing pilot Bunnings Warehouse stores. Kmart aims to grow through continued price leadership, better ranges, store network growth and a high performance culture. The business will continue to focus on delivering increased operational efficiency. Target will continue to focus on completing the conversion to everyday low prices, improving the quality of ranges and working capital efficiency. These initiatives will be supported by higher levels of direct sourcing, improved merchandise disciplines and planning systems, and operational simplification. Officeworks will continue to deliver a unique one-stop shop via its every channel strategy while extending reach through new categories and services, and drive further productivity improvements. Chemicals, Energy and Fertilisers (WesCEF) will continue to focus on maintaining strong operational performance. The business is well positioned to take advantage of value-generating opportunities as they arise. Industrial and Safety will continue to improve systems and processes to enhance supply chain efficiency and customer service, and optimise category management, pricing and sourcing. Resources will maintain a focus on cost control, productivity improvement and capital discipline. Low-cost plant expansions and counter-cyclical investments will be implemented where satisfactory returns can be achieved. 16
19 Overview Entrepreneurial initiative Our strategies Our achievements Our focus for the coming years Secure growth opportunities through entrepreneurial initiative Provided even greater value for customers through price reinvestment of innovation-led productivity gains. Continued to innovate product ranges and categories across all businesses, providing value and quality to customers. Further improved and extended channel and brand reach in the retail portfolio, focusing on store format innovation and the expansion of online offers. Expanded customer programs, particularly the flybuys loyalty program and the PowerPass offer at Bunnings. Continued to better leverage data, particularly in the retail businesses. Continue to reinforce innovation and boldness as growth enablers. Continue to rigorously apply financial disciplines and financial evaluation methodologies. Increase and encourage collaboration across divisions, where appropriate. Operating and financial review Sustainability Renewing the portfolio Our strategies Our achievements Our focus for the coming years Renew the portfolio through value-adding transactions Divested Coles credit card receivables and completed a new 10-year credit card distribution agreement with Citi, providing a solid platform for the ongoing strong growth of Coles credit cards. Progressed the Resources strategic review. There is no guarantee that this review will result in a transaction. Reviewed a potential initial public offering for Officeworks. Retaining the business was determined to be in the best interests of shareholders at the time. Maintain a strong focus and capability to evaluate growth opportunities where long-term shareholder value can be created. Consider innovative investment approaches to complement traditional growth models and provide future optionality. Ensure a patient, disciplined and broad scanning approach to investment opportunities is maintained. Apply rigorous due diligence and post-acquisition integration processes. Maintain a strong balance sheet to enable the Group to act opportunistically. Consider opportunities to divest assets either in full or in part, where long-term shareholder value can be created. Governance Directors report Operating sustainably Our strategies Our achievements Our focus for the coming years Financial statements Ensure sustainability through responsible long-term management Significantly strengthened the Group s balance sheet. Further improved our safety performance. Maintained a very strong focus on the development and management of our teams. Continued to focus on diversity in our workplaces, with 27 per cent more self-identified Indigenous employees this year, including 1,393 new Indigenous employees at Coles. Advanced our executive development, retention and succession programs. Continued to actively contribute to the communities in which we operate. In the 2017 financial year, we made community contributions, both direct and indirect, of more than $130 million. Continue to foster a more inclusive work environment, with particular focus on diversity (gender, age and ethnicity). Increase the number of women in leadership positions across the Group. Continue to look after the health, safety and development of our people. Contribute positively to the communities in which we operate. Provide appropriate governance structures to safeguard future value creation. Improve the greenhouse gas efficiency of our operations, which reduces our own business costs and risk, as well as contributing to climate change mitigation. Reduce our waste to landfill intensity rate and divert as much as possible to recycling, both in our operations and for our customers. 17 Signed reports Shareholder and ASX information
20 Operating and financial review Year in review Net profit after tax $2,873m (excluding significant items) Earnings per share cents (excluding significant items) Return on equity 12.4% (excluding significant items) 3,000 2,500 2,000 1,500 1, , , , , , Excluding significant items Reported excludes the following post-tax significant items: $1,249 million non-cash impairment of Target; $595 million non-cash impairment of Curragh; and $102 million of restructuring costs and provisions to reset Target includes the following post-tax significant items: $145 million Insurance division contribution to earnings; $939 million gain on disposal of the Insurance division; $95 million gain on disposal of WesCEF's interest in Air Liquide WA (ALWA); $677 million impairment of Target's goodwill; and $66 million Coles Liquor restructuring provision. Overview The Group reported a record net profit after tax (NPAT) of $2,873 million for the 2017 financial year, an increase of $2,466 million on the prior year which included $1,946 million of significant items. Excluding the significant items recorded in the prior year, NPAT increased 22.1 per cent, while earnings per share increased 21.6 per cent to a record $2.55 per share. Return on equity (R12) increased to 12.4 per cent from 9.6 per cent (excluding significant items) in the prior year. The results achieved during the year demonstrated the strength of the Group s conglomerate structure. In a competitive environment, the Group s retail businesses continued to invest in customer value, service, stores and online, as well as improved merchandise ranges to deliver longterm growth and improved returns. A strong recovery in Resources' earnings, driven by higher coal prices and increased metallurgical coal production, resulted in a significant increase in earnings from the Industrials division during the year. Retail earnings were also above the prior year, supported by continued strong momentum in Bunnings Australia and New Zealand (BANZ), Kmart and Officeworks. Divisional financial performances are outlined in pages 22 to 51. Operating cash flow The Group s cash flow management was a highlight for the year, with operating cash flows increasing $861 million to $4,226 million. Higher operating cash flows mainly reflected earnings growth, and improved inventory management across the retail divisions which was partially offset by higher working capital requirements in the Industrials division. Cash realisation for the year was per cent, an improvement from 94.9 per cent (excluding non-trading items (NTIs)) in the prior year, which further strengthened the Group's balance sheet. Capital expenditure The Group maintained strict disciplines in respect to capital expenditure during the year, with generally conservative business cases and appropriate hurdle rates commensurate with project risks. Gross capital expenditure of $1,681 million was $218 million or 11.5 per cent lower than last year, mainly due to fewer store openings in Bunnings Australia and New Zealand, reduced refurbishment activity in Target and lower capital expenditure across the Industrials division. Growth and refurbishment of retail store networks which deliver strong incremental returns on capital were key drivers of capital expenditure. Proceeds from disposals of $653 million were $90 million above last year, due to the divestment of Coles interest in a number of joint venture properties to ISPT, and the sale of land by WesCEF. The resulting net capital expenditure of $1,028 million was $308 million or 23.1 per cent lower than the prior year. Free cash flow Free cash flows of $4,173 million were $2,940 million above last year, reflecting higher operating cash flows, lower net capital expenditure and proceeds of $947 million from the divestment of Coles credit card receivables. Excluding the Coles credit card transaction, and the acquisition of Homebase in the prior year, free cash flows increased $1,328 million. Balance sheet The Group further strengthened its balance sheet during the year. Net financial debt, including interest rate swap assets, was $4,321 million at 30 June 2017, $2,216 million below last year. 18
21 Overview Capital employed at year-end was $27,582 million. This was $81 million lower than last year mainly due to sales of property in Coles and WesCEF and lower intangibles. Intangibles declined due to the impact of a higher Australian dollar on the translation of Homebase s intangibles and a reduction in goodwill following the sale of Coles credit card receivables. Provisions and other liabilities finished lower, mainly due to the utilisation of provisions recognised at the time of the Homebase acquisition and the settlement of the Stanwell litigation. Lower working capital outflows during the year were primarily driven by improved inventory management across the retail businesses. These were partially offset by an increase in fertiliser inventory levels in WesCEF and higher receivables in Resources due to higher coal prices and production volumes. Debt management and financing The Group s strategy is to diversify its funding sources, pre-fund upcoming maturities and maintain a presence in key markets. In November 2016, $500 million of domestic medium term notes were repaid using existing cash balances and bank facilities. In addition, over $900 million of debt was repaid following the completion of the divestment of Coles credit card receivables in February Finance costs decreased 14.3 per cent to $264 million as a result of a lower average net debt balance, and a 46 basis point reduction in the Group s all-in effective borrowing cost to 4.04 per cent driven by active management of debt sources. Lower finance costs contributed to strong liquidity metrics, with cash interest cover (R12) increasing to 25.0 times and fixed charges cover (R12) increasing to 3.1 times. The Group maintained strong and stable credit ratings during the year. Moody s Investors Services rating remained unchanged at A3 (stable) and Standard and Poor s remained unchanged at A- (negative). In September 2017, Standard and Poor's revised the Group's outlook from negative to stable. Cash capital expenditure Year ended 30 June 2017 $m 2016 $m Coles Home Improvement Kmart Target Officeworks WesCEF Industrial and Safety Resources Other 1 4 Total capital expenditure 1,681 1,899 Sale of property, plant and equipment (653) (563) Net capital expenditure 1,028 1,336 Free cash flow $4,173m 5,000 4,000 3,000 2,000 1, Group capital employed Year ended 30 June $m , , , , , $m Inventories 6,530 6,260 Receivables and prepayments 1,936 1,950 Payables (6,616) (6,492) Other Net working capital 2,260 2,129 Property, plant and equipment 9,440 9,612 Goodwill and intangibles 18,936 19,073 Other assets Provisions and other liabilities (3,676) (3,770) Total capital employed 27,582 27,663 Net financial debt excluding financial services debt 2 (4,321) (5,727) Net tax balances 680 1,013 Total net assets 23,941 22,949 1 Balances reflect the management balance sheet, which is based on different classification and groupings than the balance sheet in the financial statements. 2 Net financial debt excluding the financing of the Coles credit card book and net of cross currency interest rate swaps and interest rate swap contracts. 19 Operating and financial review Sustainability Governance Directors report Financial statements Signed reports Shareholder and ASX information
22 Operating and financial review Net financial debt reduced $2,216 million to $4,321 million. Debt sources 1 BANK BILATERALS 25% US BONDS 15% EURO BONDS 33% DOMESTIC BONDS 27% 1 As at 30 June Dividends per share 223 cents includes a 10 cents per share special 'Centenary' dividend. Finance costs ($m) and weighted average cost of debt (%) Debt maturity profile 1 ($m) TSR: Wesfarmers and ASX 200 FINANCE COSTS (LHS) WEIGHTED AVERAGE COST OF DEBT (RHS) BANK FACILITIES CAPITAL MARKETS CASH AT BANK AND ON DEPOSIT WESFARMERS LIMITED TSR INDEX 1 ASX 200 ACCUMULATION INDEX (500) (1000) As at 30 June Assumes 100 per cent dividend reinvestment on the ex-dividend date, and full participation in capital management initiatives (e.g., rights issues and share buybacks). Source: Bloomberg. Dividends A key component of total shareholder return is the dividends paid to shareholders. The Group s dividend policy considers current earnings and cash flows, available franking credits and targeted credit metrics. In line with this year s record earnings and strong cash flow performance, the Board declared a fully-franked final ordinary dividend of 120 cents per share, taking the full-year ordinary dividend to 223 cents per share. The final dividend will be paid on 28 September 2017, to shareholders on the company s register on the record date for the final dividend. Given the preference of many shareholders to receive dividends in the form of equity, the directors have decided to continue the operation of the Dividend Investment Plan (the Plan ). The allocation price for shares issued under the Plan will be calculated as the average of the daily volume weighted average price of Wesfarmers shares on each of the 15 consecutive trading days from and including the third trading day after the record date, being 28 August 2017 to 15 September The last date for receipt of applications to participate in, or to cease or vary participation in the Plan, was 24 August No discount will apply to the allocation price and the Plan will not be underwritten. Shares to be allocated under the Plan will be transferred to participants on 28 September Given the Group s strong cash flow performance for the year, and strong credit metrics, any shares to be issued under the Plan will be acquired on-market and transferred to participants. Our approach to sustainability Wesfarmers will only be sustainable as a corporation if, in addition to its continued financial success, it adequately addresses a range of other issues which are significant in their own right and ultimately influence financial outcomes. Each business has identified the key issues most relevant to its operations within their summaries as detailed later in this operating and financial review. Wesfarmers supports the recommendations of the Task Force on Climate-related Financial Disclosures. Our annual risk review process has identified climate change as an emerging risk and our businesses are taking steps to actively consider and monitor its potential impact. Further information on our sustainability performance can also be found on pages 53 to 61 of this annual report. 20
23 Overview Risks Wesfarmers recognises the importance of, and is committed to, the identification, monitoring and management of material risks associated with its activities across the Group. The following information sets out the major Group-wide risks. These are not in any particular order and do not include generic risks such as changes to macroeconomic conditions affecting business and households in Australia, which would affect all companies with a large domestic presence and which could have a material affect on the future performance of the Group. Further information on risk management, including policies, responsibility and certification, can be found on page 67 of this annual report and in the corporate governance section of the company s website at Strategic Increased competition Ineffective execution of strategy Loss of key management personnel Damage or dilution to Wesfarmers brands Digital disruption to industry structures Operational Loss of critical supply inputs or infrastructure, including IT systems Loss of data security and integrity Business interruption arising from industrial disputes, work stoppages and accidents Risks inherent in distribution and sale of products Climate change Ethical sourcing and human rights Regulatory Non-compliance with applicable laws, regulations and standards Adverse regulatory or legislative change Financial Currency volatility Adverse commodity price movements Reduced access to funding Operating and financial review Sustainability Governance Prospects Given Wesfarmers diverse business operations and strong balance sheet, the Group remains generally optimistic in its outlook. Across the Group s retail portfolio, continued growth in earnings is expected to be driven by ongoing improvements in merchandising and service, further enhancements to the customer experience both in stores and online, and investments in value supported by operational efficiencies. The Group s Industrials businesses will continue to focus on operational efficiencies and diversification of revenues. In a very competitive environment, sales and margin pressures in Coles are expected to persist. Within this environment, Coles will focus on plans to further enhance the quality of its fresh offer, and improve merchandising and availability, while continuing to drive operational efficiencies to support investments in value and service. Coles will also seek to grow new channels and services, while continuing to improve its store network. Within Home Improvement, the outlook for Bunnings Australia and New Zealand is particularly positive given current trading momentum across all regions and categories, and the business established market position. Bunnings Australia and New Zealand has a broad strategic agenda to drive further growth by creating better experiences for customers, strengthening the core of the business and achieving greater brand reach, both physically and digitally. In Bunnings United Kingdom and Ireland, while store execution in Homebase is expected to improve, trading is anticipated to remain challenging, particularly in the short term, as customers continue to adjust to the new offer. Disruption will also continue as the business progressively transitions to Bunnings and the store network is optimised over time. Within Department Stores, Kmart will continue to drive growth by delivering better products at lower prices, and investing in its store network, while Target will progress its transformation plan to deliver further improvements in its performance. Officeworks will continue to implement its every channel strategy to drive growth both in stores and online. WesCEF s earnings remain subject to international commodity prices, exchange rates and seasonal outcomes. Earnings for the Chemicals business will be affected by an anticipated oversupply in the Western Australian explosive grade ammonium nitrate market, although good work has been undertaken to secure new contracts for ammonium nitrate and emulsion. Following its recent strategic reset, Industrial and Safety is well positioned to grow across different market sectors and drive additional operating efficiencies. The Resources business will remain focused on strong operational productivity and cost control in an environment where coal prices are expected to remain volatile and higher obligations to Stanwell are expected to negatively affect the results for the 2018 financial year. The Group s cash generative portfolio, capital disciplines and strong balance sheet position it well to take advantage of growth opportunities, if and when they arise. Wesfarmers will also continue to evaluate opportunities to create shareholder value through the proactive management of its portfolio, including through the current strategic review of the Resources business. There is no certainty that this review will result in a transaction and an update will be provided to the market if and when appropriate. 21 Directors report Financial statements Signed reports Shareholder and ASX information


24 Operating and financial review Retail businesses Coles Coles opened its first store in Collingwood, Melbourne in 1914, and has grown into an iconic Australian retailer. Today, it operates Coles Supermarkets, Coles Express, Liquorland, Vintage Cellars, First Choice Liquor, Liquor Market, Spirit Hotels, Coles Financial Services and Coles Online. Clockwise from top: Coles team members Lovell Penalba, Terry Patterson and Karen Collyer. 22
 35,780 37,391 38,201 39,242 39,217 Earnings before interest and tax ($m) 1,533")
25 Overview Year in review Revenue EBIT Prospects Operating and financial review $39,217m $1,609m , , , , , , , , , ,533 Sustainability Key financial indicators For the year ended 30 June Revenue ($m) 35,780 37,391 38,201 39,242 39,217 Earnings before interest and tax ($m) 1,533 1,672 1,783 1,860 1,609 Capital employed (R12) ($m) 16,114 16,272 16,276 16,541 16,586 Return on capital employed (%) Capital expenditure ($m) 1,181 1, ¹ 2014 excludes a $94 million provision relating to future Liquor restructuring activities (reported as an NTI). Performance drivers Coles revenue of $39,217 million for the year was in line with last year, with earnings before interest and tax declining 13.5 per cent to $1,609 million. Food and Liquor recorded sales growth of 2.0 per cent driven by continued investment in value, quality and service. The key metrics of transaction volumes and basket size improved as a result of continued investment in the customer offer. Fresh food categories continued to perform strongly, although there remains a significant opportunity to improve and capture further share. A focus on sourcing quality fresh products and high standards of availability has driven increased transactions and units year on year. In a lower growth and very competitive market, Coles remained focused on its customer-led strategy, and during the year accelerated its investment in enhancing the customer offer. This proactive investment resulted in lower prices for customers, including through the absorption of inflationary cost pressures in fresh produce and meat, increased fresh food quality and improved customer service. Trusted value remains paramount for Coles, and as at 30 June 2017, there were approximately 4,400 products on Every Day prices. This year marks the eighth consecutive year that Coles has lowered prices for customers, with cumulative deflation of 8.2 per cent recorded since the 2009 financial year. The Liquor transformation progressed in line with expectations. Positive comparable sales growth was achieved for the 2017 financial year, and has now been achieved for seven consecutive quarters, reflecting investments made in price, range and the store network. The transformation program is now past the halfway point of a five-year plan. Coles Express recorded revenue (including fuel) of $6,133 million for the year, 8.2 per cent lower than the previous year due to lower fuel volumes. Despite a decline in fuel transactions, convenience store sales increased by 4.6 per cent for the year. Coles investment in new channels and services continued this year, with Coles Online recording double digit sales growth. Coles Financial Services grew General Insurance policies and also completed a 10 year credit card distribution agreement with Citi. Flybuys continued to achieve growth in active members. Coles remains committed to being a customer-led business and continually providing better value, quality and service to its customers across Australia. At a time when Australian household budgets remain under pressure, Coles will continue to lower the cost of the weekly shop for customers to build on its trusted value position. In addition to lowering prices for customers, Coles will continue to invest in improvements to fresh food quality, in-store availability, customer service and the store network. Over time, these investments in the customer offer are expected to be funded by simplicity benefits. Coles has commenced the rollout of a simplicity program which will make stores easier to shop, increase availability and allow team members to focus more of their time on customer service. Coles will continue to extend into new channels and services by increasing the offering to customers through Coles Online, Financial Services and Australia s number one loyalty program, flybuys. Coles Liquor will continue to progress its five-year transformation program through a focus on simplifying ranges, supply chain and store operations, in addition to building on positive sales momentum through an improved customer offer. Coles Express is focused on providing a leading shop offer, and a competitive fuel offer while it deals with the changes in the commercial terms with its alliance partner. The business remains focused on network growth. MANAGING DIRECTOR, COLES JOHN DURKAN 23 Governance Directors report Financial statements Signed reports Shareholder and ASX information


26 Operating and financial review Retail businesses Coles Our business Coles provides fresh food, groceries, general merchandise, liquor, fuel and financial services, with more than 21 million customer transactions on average each week, via its store network and online platform. Coles has more than 106,000 team members and operates 2,475 retail outlets nationally. Our market Coles meat manager Stuart Horne at the new Lakelands supermarket in Western Australia. Highlights Supermarkets lowered the cost of the weekly basket for the eighth consecutive year with price deflation, excluding fresh and tobacco, of 2.2 per cent. Coles operates in Australia s highly dynamic and evolving food, grocery, liquor and convenience sector. It has a store network of 801 supermarkets, 883 liquor stores, 89 hotels and 702 convenience outlets across the nation, from as far west as Geraldton in Western Australia to as far east as Ocean Shores in the Northern Rivers region of New South Wales. Coles also operates in the financial services market, offering home, car, landlord insurance and credit cards. Coles Financial Services has more than one million customer accounts. Sustainability Coles' sustainability focus covers a range of areas, including Australian sourcing and supplier engagement, community partnerships, product quality and safety, ethical sourcing, environmental impact, diversity, and health and safety. Information regarding all of these topics can be found in the Wesfarmers sustainability report at sustainability.wesfarmers.com.au Continued investment in better quality, availability, service and value for customers Coles Customer Service Manager Navdeep Kaur at the Aurora Village supermarket, in Victoria. 24
27 Overview Australian sourcing Coles has an Australia first sourcing policy to source Australian-grown food whenever and wherever it can. Today, around 96 per cent of fruit and vegetables and 100 per cent of Coles fresh lamb, pork, chicken, beef, milk and eggs are produced in Australia. Supplier relationships Coles continues to develop strong partnerships with suppliers through the implementation of long-term agreements which provide certainty around future demand. During the year, Coles signed a 10-year agreement with TOP Pork Pty Ltd. The agreement paves the way for 12 Victorian and South Australian farming families to supply sow stall free pork directly to Coles each week. Coles continues to assist small to medium sized businesses through the $50 million Coles Nurture Fund, which was established in April Since its launch, Coles has provided close to $9 million in grants and interest-free loans to 19 producers. Through the Coles Nurture Fund, the company also extended $150,000 in direct financial assistance to five suppliers severely affected by Cyclone Debbie. Community support Coles supports national and local charities with financial contributions, fundraising, food donations and disaster relief. For the 2017 financial year, Coles direct support totalled close to $55 million with an additional $8.9 million contributed by customers, team members and suppliers. Coles' support for national cancer charity Redkite marked a significant milestone during the year, with team members and customers helping to raise more than $24 million since the partnership began in More than 670 Coles stores now support SecondBite through the donation of surplus fresh produce and bakery items. Since the partnership commenced in 2011, Coles has donated the equivalent of more than 40 million meals to SecondBite to distribute to people in need across Australia. Coles continued to support Guide Dogs Australia with a record $1.2 million raised by Coles customers and team members last financial year, taking Coles total contribution to more than $8.2 million since In the lead up to ANZAC Day, Coles ran a national fundraising campaign, raising more than $950,000 for Bravery Trust. Since 2014, Coles has raised more than $5.2 million for the national charity, which provides financial support to current and former members of the Australian Defence Force and their families. Coles Express also continued to support the Cancer Council, raising more than $660,000 during the year. Product quality During the year, Coles Brand products won 51 industry awards. More than 100 supply partners have now been trained in the Coles food manufacturing supplier requirements, with 45 supplier sites achieving the highest rates of compliance. All Coles Brand suppliers now use a webbased product and supplier database which allows for product traceability and strict adherence to quality compliance standards such as declarable allergens, certifications and nutritional information. Ethical sourcing Coles Responsibly Sourced Seafood Program details the company s commitment to independently assess all wild fisheries and aquaculture farms that supply Coles Brand. Coles Brand seafood products are certified to Marine Stewardship Council certification, Aquaculture Stewardship Council certification or Coles Responsibly Sourced Seafood criteria. Coles Brand's animal welfare policy focuses on reducing products sourced from close confinement systems such as battery cages and sow stalls. This policy includes dairy, beef, lamb, poultry, eggs, pigs and aquaculture species. Coles Farm Program assessments allow for consistent monitoring and maintenance of animal welfare standards. Environmental impact In July 2017, Coles announced it would phase-out single use plastic bags from all stores over the next year. The move will bring Coles stores in Queensland, New South Wales, Victoria and Western Australia in line with Tasmania, South Australia, the Northern Territory and ACT, where Coles already complies with bans on single-use bags. Soft plastics recycling bins, currently located at 670 of our stores, will remain in place as part of Coles REDcycle plastic packaging recycling program which is the largest retailer-operated recycling program of its type in Australia. Diversity Coles has developed a 2020 inclusion strategy aimed at building an inclusive workplace where all team members feel supported. This year, Coles had 2,872 Indigenous team members, representing 2.7 per cent of its workforce. The company s target, to have 3,000 Indigenous team members by 2020, is likely to be met during the next year. For the first time, Coles participated in the Australian Workplace Equality Index and was awarded a Bronze Employer status, recognising its actions to improve LGBTI workplace inclusion. Health and safety Creating a safe workplace for team members, suppliers and visitors, and a safe shopping environment for customers is a priority for Coles. The total recordable injury frequency rate (TRIFR) was 38.1 for the year, a 13.6 per cent improvement on last year due to a continued focus on safety leadership, risk reduction, and health and wellbeing programs. Operating and financial review Sustainability Governance Directors report Financial statements Signed reports 25 Shareholder and ASX information
28 Operating and financial review Retail businesses Coles Strategy Coles continues to focus on delivering Australia s best food offering to customers through greater investment in prices, continuous improvement in quality, and further investment in customer service. Coles will seek to achieve the goal of being Australia s best food retailer and cater for all customer needs by implementing new and improved formats, accelerating the capability of the online offer, and continuing the expansion of the convenience and liquor outlets. Coles remains committed to building long-term strategic supplier partnerships and investing in the growth of developing suppliers through the Coles Nurture Fund. Opportunities exist to increase the efficiency of the supply chain and a simplicity program commencing in the 2018 financial year will aim to reduce costs and increase productivity. Liquor is now over the halfway mark of the five-year turnaround plan. The next phase of the Liquor turnaround will focus on simplifying ranges, investment in prices, and continued growth of exclusive label brands. Convenience remains a key focus for Coles and negotiations continue to achieve the best commercial outcomes for the Coles Express brand. Coles Express will continue with network expansion to ensure all customers have access to a convenient offering. A strong online offering will form an integral part of the Coles customer proposition and further investment will be made to optimise the online platform. Coles will continue to unlock efficiencies in the picking and delivery of online orders and seek to build on its strong double-digit transaction growth. Investing in the capability of team members and ensuring Coles is the best and safest workplace will continue to be part of the Coles culture. Key programs, such as the 400-strong Coles Graduate Program, Women in Leadership Initiative and increased Indigenous recruitment, will continue to deliver a world-class diverse workforce. Food and Liquor Growth strategies Achievements Focus for the coming years Deliver a better store network 22 supermarkets opened, eight closed and 46 renewals completed, focusing on bigger, better stores 2.6 per cent growth in supermarkets net selling area during the year 29 new liquor stores were opened, 11 closed Build a better store network and continue to target supermarket net space growth of between two and three per cent per annum Focus on freshness High single-digit growth in produce sales Continued investment with suppliers to improve quality Extend value leadership Approximately 4,400 items on Every Day pricing at the end of the year Deflation excluding Fresh and Tobacco 2.2 per cent for the year Simplicity More than 1,400 SKUs moved to stockless supply channels OneShop now live in all stores OneTeam now live in 220 stores Deliver better value, quality, availability and the right offer in every store Seek longer-term agreements and deeper collaboration opportunities with key suppliers Continue to invest in team member capabilities to improve service Accelerate price investment in order to drive down the cost of the weekly basket Drive targeted marketing through flybuys and customer insights Rollout a new store simplicity program Improve direct sourcing capabilities, customer-led range simplification and trading terms Boldly extend into new channels and services Coles Online achieved more than 14.5 per cent transaction growth 2.3 per cent more active flybuys customers Partnership with Virgin Velocity program Deliver profitable growth in Coles Online Grow flybuys by providing more personalised offers that are meaningful for customers and provide choice in how customers earn and convert their points Transform liquor business Strong transaction growth delivered with Liquorland the key driver 200 Liquorland renewals during FY17 Five-year transformation on track Build great careers A graduate program with approximately 400 participants 31.4 per cent of women in leadership roles 1,393 Indigenous team members hired Continue the five-year turnaround strategy with the rollout of Liquor Market format and further Liquorland renewals Offer more exclusive brands and a liquor-direct offer to allow customers to shop in a more flexible way Build the right culture and capabilities in-store to further engage customers Continue to nurture talent through the Retail Leaders Program and the Graduate Program Increase the percentage of Indigenous team members to three per cent (representative of the Indigenous population in Australia) by
29 Overview Convenience Growth strategies Achievements Focus for the coming years Operating and financial review Deliver a better store network Inspire customers through greater value Opened 17 new Coles Express sites Renewed 132 stores to date with big, bold rebranding Provided greater value to customers by extending Coles Every Day value to more products throughout the store, resulting in stronger sales Grow the store network with the alliance partner and aim to open 100 new stores over the next five years Renew between 75 and 100 sites each year with big, bold rebranding Extend the Every Day value offer across a greater range of products Provide a competitive fuel offer to customers Sustainability Focus on freshness, quality and additional range Extended the range of everyday essentials and convenience products Improve product quality and freshness Expand product range, including the rollout of Big Yum format Risk Coles risks relate to issues that might affect business operations or the competitive dynamics within the market place moving forward. These include product availability, retention of personnel, regulatory changes, competitive intensity and entry of new competitors. Governance Food and Liquor Risks Mitigation Increased competitive intensity limiting Coles ability to achieve profitable growth Attraction, retention and succession of key roles Coles will continue to simplify its business and reduce costs to fund further investments in price. It continues to focus on improving its fresh offer, supported by securing long-term contracts with key suppliers. It has appropriate lease structures and management practices in place to protect tenure of existing stores. A new store pipeline focused on priority network gaps is governed by a disciplined approach to capital investment. Effective succession planning and career development has ensured a smooth leadership transition following the initial phase of the turnaround. The expansion of the leadership program has promoted talent within the business and enabled better alignment of succession. Directors report Regulatory change which limits growth and value offer Coles has worked constructively with government, regulatory and industry bodies in the past in order to promote good faith commercial conduct and will continue to do so in the future. Convenience Risks Changing consumer preferences leading to lower fuel consumption Mitigation Coles Express will focus on maintaining a convenience store network with high quality sites and will continue to invest in the store offering to drive continued growth. Coles will continue to review underperforming stores and assess new opportunities for growth. Financial statements Disruption to fuel supply Coles has an exclusive fuel supply agreement with its alliance partner, Viva Energy, until Either party has the option to extend for a term up to five years. Signed reports 27 Shareholder and ASX information


30 Operating and financial review Retail businesses Home Improvement Bunnings customer-focused approach underpinned continued performance gains in Australia and New Zealand. During the first full financial year of trading in the United Kingdom and Ireland, significant progress was made to build strong foundations through transformation of the Homebase business and development of the Bunnings brand. Clockwise from top: Bunnings team members Rodney Boonsinlapa, Mark Jones and Kim Croker. 28
 7,661 8,546 9,534 11,571 13,586 Earnings before interest and tax ($m) 904 979 1,088 1,214")
31 Overview Year in review Revenue EBIT Prospects Operating and financial review $13,586m $1,245m , , , , , , , , Sustainability Key financial indicators For the year ended 30 June Revenue ($m) 7,661 8,546 9,534 11,571 13,586 Earnings before interest and tax ($m) ,088 1,214 1,245 Capital employed (R12) ($m) 3,492 3,343 3,244 3,599 4,110 Return on capital employed (%) Capital expenditure ($m) Performance drivers Revenue for the Home Improvement division increased 17.4 per cent to $13,586 million, driven by the full-year contribution from Bunnings United Kingdom and Ireland, which was acquired on 28 February 2016, and strong growth in Bunnings Australia and New Zealand. Earnings for the division of $1,245 million were 2.6 per cent higher than the prior corresponding period. Operating revenue from Bunnings Australia and New Zealand increased 8.9 per cent to $11,514 million. Total store sales growth of 8.9 per cent was achieved during the year, underpinned by an increase of 7.3 per cent in store-on-store sales. Bunnings Australia and New Zealand recorded EBIT of $1,334 million, an increase of 10.0 per cent on last year. Bunnings United Kingdom and Ireland reported operating revenue of 1,229 million ($2,072 million) and a loss before interest and tax of 54 million ($89 million) in the first full financial year of trading since acquisition. The result included 19 million ($33 million) of transition and restructuring costs, including costs associated with the establishment of the Bunnings brand in the United Kingdom and Ireland and the pilot store program. During the year, purchase price adjustments were applied to the costs of clearing discontinued ranges, the depreciation associated with IT-related assets which were written down to fair value at the time of the acquisition, and onerous Transitional Service Agreement contracts with Home Retail Group. In Australia and New Zealand, Bunnings is focused on driving growth, creating better experiences for customers and the wider community, and strengthening the core of the business. Achieving greater brand reach, both digitally and physically, is a core work area which includes further expansion of Bunnings digital ecosystem, opening new stores and reinvesting in the existing network. Positive trading momentum is expected to continue in the 2018 financial year, supported by ongoing investments in lower prices to deliver more customer value, ongoing range innovation and increased customer service. The team in the United Kingdom and Ireland will continue to build strong business foundations as work to reposition Homebase continues. Key areas of focus include pilot store development, proof of concept and rollout, and a relaunch of the kitchen and bathroom offers. Recent changes to strengthen the senior leadership team and realign organisational structures will support improved Homebase store execution. This will also provide additional capacity for the development of Bunnings in the United Kingdom and Ireland, with 15 to 20 pilot stores expected to be trading or nearing completion by 31 December 2017, subject to relevant approvals. MANAGING DIRECTOR, BUNNINGS GROUP MICHAEL SCHNEIDER Governance Directors report Financial statements Signed reports 29 Shareholder and ASX information


32 Operating and financial review Retail businesses Home Improvement Bunnings Australia and New Zealand and Bunnings United Kingdom and Ireland Our business Bunnings team member Ben Cuthbertson at the Bunnings Warehouse in Mentone, Victoria. Highlights First Bunnings Warehouse opened in the United Kingdom. Bunnings is the leading retailer of home improvement and outdoor living products in Australia and New Zealand, and the second largest retailer of home improvement and garden products in the United Kingdom and Ireland. Bunnings is a major supplier to project builders, commercial tradespeople and the housing industry. Bunnings is focused on creating value for its customers over the long term. The approach to long-term value creation is based on four interlinked principles: a winning offer to customers; an engaged, focused and committed workforce; business behaviour that builds trust; and sustainable satisfactory shareholder returns. Bunnings employs more than 40,000 team members across Australia and New Zealand. Bunnings Australia and New Zealand stores stock around 45,000 products and an expanded range is available through a special order service. In the United Kingdom and Ireland, Bunnings employs approximately 12,000 team members across its Homebase and Bunnings Warehouse stores. Work continues to reposition Homebase to deliver a core home improvement and garden offer and the first steps of cultural change are progressing. Return on capital employed of 30.3% Revenue exceeded $13.5b EBIT grew to $1,245m Bunnings team member Berlinde Hausmann in the flooring department at the Mentone warehouse, Victoria. 30

33 Overview Our market In Australia and New Zealand, Bunnings caters for consumers and both light and heavy commercial customers across the home improvement and outdoor living market, operating from a network of large warehouse stores, smaller format stores, trade centres, and frame and truss sites. Bunnings Australia and New Zealand is expanding its brand reach across its market through the opening of new stores and flexible formats, along with more digital engagement. The focus is on delivering the best offer everywhere, whether that be digital, in-home, in-store or on-site. The home improvement and garden market in the United Kingdom and Ireland is large and highly fragmented, with both specialists and participants in multiple categories competing through a variety of formats. Bunnings is building the foundations to enable the delivery of a winning offer in this market. Sustainability Bunnings defines sustainability within its operations as actions that are socially responsible, environmentally aware and economically viable. The immediate focus is to use less energy and to accelerate ways to reduce reliance on grid-sourced energy. Bunnings is also committed to reducing water usage and creating less waste along with increasing recycling levels. Bunnings strives to ensure that product sourcing meets or exceeds the requirements of local and global standards and remains committed to growing community support in a sincere, localised and meaningful manner. Bunnings' highest priority is to maintain a positive safety performance trend as the business grows, the store network increases and more team members are employed. Safety performance is a particular focus in the United Kingdom and Ireland as the Homebase operating model transitions to heavier and larger home improvement and garden items. Performance drivers Bunnings Australia and New Zealand Sales growth was achieved in both consumer and commercial markets, across all major trading regions and product categories. Despite periods of mixed trading conditions throughout the year, resulting from adverse weather and competitor liquidation activity, the underlying business momentum delivered strong growth. Strong business momentum reflected a continued focus on delivering a strategic agenda aimed at creating long-term customer value. Earnings growth was supported by disciplined cost control and continued favourable market conditions providing further positive outcomes on property divestments. These benefits were partially offset by higher store closure provisions within Bunnings trading Bunnings United Kingdom and Ireland Trading has been affected by significant disruption as Homebase commenced its repositioning to a core home improvement and garden offer. This repositioning is supported by investments in wider product ranges, price, and greater stock depth. Significant transition, separation, and integration activity has been undertaken. All services have now been separated from the previous owner with the exception of the IT Data Centre, which will be completed in the first quarter of the 2018 financial year. Four Bunnings Warehouse pilot stores were opened during the period. Early performance has been encouraging, with the stores generating strong engagement with customers, team members, suppliers and local communities. In addition to these four Bunnings Warehouse stores, there were 251 Homebase stores in the Bunnings United Kingdom and Ireland network at the end of the year. results, arising from the agreement with Home Consortium for new Bunnings sites, together with additional writedowns in the second half, related to future network changes and in-store display assets. Further investment in store upgrades and category refresh works was supported by a disciplined capital expenditure program. The strong earnings growth and capital management resulted in a significant increase in return on capital. During the period, 18 trading locations were opened, including nine new Bunnings Warehouse stores, eight smaller format stores and one trade centre. At the end of the year, there were 249 warehouses, 77 smaller format stores and 33 trade centres in the Bunnings Australia and New Zealand network. Homebase team member Helen Jupp at the Luton store in the United Kingdom. 31 Operating and financial review Sustainability Governance Directors report Financial statements Signed reports Shareholder and ASX information
34 Operating and financial review Retail businesses Home Improvement Bunnings Australia and New Zealand Strategy Bunnings Australia and New Zealand provides its customers with the widest range of home improvement and outdoor living products and is committed to delivering the best service supported by our policy of lowest prices every day. It sets out to attract high quality team members and to provide them with a safe and rewarding working environment. Growth strategies Achievements Focus for the coming years More customer value Continued reinvestment into lower prices Ongoing focus on delivering even more value Better customer experiences Consistency in service basics lifted Improved stock availability Greater product and project knowledge Better customer experiences and deeper engagement: in-store, online and in-home Greater brand reach Opened 18 trading locations Significantly expanded digital ecosystem Existing store reinvestment More stores, with increased format innovation Expect to further expand the digital ecosystem including online transaction capability Targeted investment into refreshing the existing store network Deeper commercial engagement More merchandise innovation Created more value and deeper relationships Leveraged the network for customer convenience stores and trade centres Improved service with more localised engagement, easier to deal with Expanded ranges and products and made DIY easier Further product and project innovation with wider ranges and new products Continue to leverage core strengths of a total market capability: stores, trade centres, in-field and digital Wider market focus to expand selling opportunities Progress near neighbour export opportunities Creating, leveraging and responding to lifestyle trends, technology trends and environmental and economic changes Development and implementation of services that complement the core DIY offer Bunnings United Kingdom and Ireland Strategy Bunnings is building the foundations of a market-leading home improvement and garden offer in the United Kingdom and Ireland, delivering a wide range of trusted brands, best service, and real customer value as we establish our policy of lowest prices every day. It is taking a sensibly staged approach through the acquisition and repositioning of Homebase, building trust and generating strong engagement with customers, team members, suppliers, and the communities in which it operates. Growth strategies Achievements Focus for the coming years Build strong business foundations Develop Bunnings Warehouse Extensive digital engagement Build trust, generate engagement Repositioning of Homebase in progress Retail basics, core home improvement and garden offer Four pilot stores trading Positive customer feedback, pleasing community engagement First steps towards Bunnings digital ecosystem Product and project knowledge Investment in team development, engagement and retention Reduce disruption from repositioning to drive better execution and improved trading performance Improve operational disciplines Continue Bunnings Warehouse pilot program Proof of concept, rollout of Bunnings Grow Bunnings digital ecosystem in the United Kingdom and Ireland Continue to invest in team Strategies to drive stronger engagement with customers and suppliers 32
35 Overview Risks Bunnings recognises that taking appropriate business risks is a critical aspect of generating acceptable business returns. In doing so, it seeks to appropriately manage risks to minimise losses and maximise opportunities. Risks deemed unacceptable in terms of the business's risk appetite are subject to appropriate control and mitigation measures to reduce the negative impact on the business. The level of controls implemented is commensurate with the impact (likelihood and consequence) on the business from the risk occurring. Bunnings Australia and New Zealand Risks Mitigation Operating and financial review Sustainability Safety Continued focus and targeted in-store awareness campaigns Talent recruitment and retention Strategies directed at creating and maintaining status as employer of choice Succession planning, retention and development plans New and existing competitors Relentless focus on strategic pillars of lowest price, widest range and best service Ongoing strategies to increase customer centricity and deepen customer engagement Reputation Strong culture of doing the right thing Focus on ethical sourcing and product standards Ongoing regulatory compliance training Governance Bunnings United Kingdom and Ireland Risks Mitigation Safety Enhanced training of store team as Homebase operating model transitions to heavier and larger home improvement and garden items Directors report Talent recruitment, retention and succession Changed and changing competitive landscape Strategies directed at creating status as employer of choice Succession planning, retention and development plans Better execution of repositioned core home improvement and garden offer in Homebase Relentless focus on strategic pillars of 'lowest price, widest range, and best service' while establishing Bunnings in the United Kingdom and Ireland Political and economic uncertainty Develop market-leading offer and flexible business model Build trust, generate strong engagement with customers, team members, suppliers and local communities Financial statements Signed reports 33 Shareholder and ASX information


36 Operating and financial review Retail businesses Department Stores The Department Stores division was formed in February 2016 through a combination of Kmart and Target. The division operates 774 stores across Australia and New Zealand and employs 44,000 team members. Kmart team member Scott Murray and Target team member Erica Calleja. 34
 7,825 7,710 7,991 8,646 8,528 Earnings before interest and tax ($m) 480 452 522 275 543")
37 Overview Year in review Revenue EBIT $8,528m $543m Prospects Operating and financial review , , , , , Sustainability Key financial indicators For the year ended 30 June Revenue ($m) 7,825 7,710 7,991 8,646 8,528 Earnings before interest and tax ($m) Capital employed (R12) ($m) 4,259 4,340 3,778 3,629 2,253 Return on capital employed (%) Capital expenditure ($m) ¹ 2014 excludes a $677 million impairment of Target's goodwill (reported as an NTI). 2 The 2016 earnings before interest and tax for Target includes $145 million of restructuring costs and provisions to reset the business but excludes the non-cash impairment of $1,266 million. Performance drivers Revenue for the Department Stores division was $8,528 million for the year, a decrease of 1.4 per cent due to lower revenue in Target which was partially offset by continued strong growth in Kmart. Target s sales were driven by the reset of the Target business, with sales affected by the transition to everyday low prices, and a reduction in unprofitable events as well as an exit from loss-making categories. Kmart s sales growth was driven by increased customer transactions and higher units sold per customer. Earnings for the division of $543 million increased 97.5 per cent compared to the prior year, reflecting an improvement in Target s performance, as well as continued growth in Kmart. Excluding restructuring costs in Target incurred in the current and prior year, earnings for the division increased 32.4 per cent. Kmart Kmart will seek to drive sustainable growth through a focus on making it a great place to shop that is simple to run and to deliver better products at lower prices. Further investments in price will be made to drive volume and maintain Kmart s price leadership position in the market. The business is well positioned for the 2018 financial year, with inventory in good shape and core everyday ranges performing well. Continued investment in the store network is expected to deliver 10 new stores and the completion of 35 store refurbishments in the 2018 financial year. Target Target will continue to focus on providing quality fashion and basics to everyone at low prices and the 2018 financial year will reflect the significant transition underway in the business. Further improvements in merchandise disciplines are expected to result in improved fashion and quality of sales. The focus on end-to-end costs will continue, with increased levels of direct sourcing and continued improvements in operational efficiency. Renewal, as well as space and range trials, will progress and five new stores will be opened. Working capital efficiency and cash flow generation will continue to be focus areas. CHIEF EXECUTIVE OFFICER, DEPARTMENT STORES GUY RUSSO Governance Directors report Financial statements Signed reports 35 Shareholder and ASX information

38 Operating and financial review Retail businesses Department Stores Kmart Kmart team member Heather Rae Higgins at the Chadstone store in Victoria. Year in review Revenue $5,578m $553m , , , , ,167 Key financial indicators For the year ended 30 June Revenue ($m) 4,167 4,209 4,553 5,190 5,578 Earnings before interest and tax ($m) Capital employed (R12) ($m) 1,329 1,361 1,312 1,246 1,266 Return on capital employed (%) Capital expenditure ($m) Performance drivers Kmart delivered revenue of $5,578 million for the year, an increase of 7.5 per cent on the prior year, with earnings growing 17.7 per cent to $553 million. Sales growth was driven by increased customer transactions and higher units sold per customer. Product ranges and everyday low prices continued to resonate well with customers, with growth delivered across all categories. EBIT Kmart delivered another year of strong earnings growth through improved inventory management, enhanced product ranges, productivity improvements across stores and the supply chain and sourcing benefits. Growth in earnings, combined with a continued focus on working capital management, resulted in an improvement of 596 basis points in return on capital to 43.7 per cent. Our business Kmart was established in 1969, with the opening of its first store in Burwood, Victoria. Kmart operates 220 stores throughout Australia and New Zealand, offering customers a wide range of apparel and general merchandise products at low prices, every day. Kmart employs approximately 30,000 team members, who are focused on delivering the Kmart vision where families come first for the lowest prices on everyday items. Kmart Tyre and Auto Service has 251 centres in Australia, providing customers with retail automotive services, repairs and tyres. Our market Kmart operates in the clothing, homewares and general merchandise retail sector both locally and internationally. This sector is competitive and comprises department stores, specialty retailers and a growing online channel. The sector is characterised by an expanding presence of international retailers, an increasing level of direct sourcing and online growth. Kmart sources from both local and overseas suppliers with product sourcing offices in Hong Kong, China, Bangladesh, India and Indonesia. Sustainability Kmart continues to drive its Better Together sustainability program focused on people, partners and planet, and has developed a sustainable materials strategy and reviewed the environmental risks and opportunities across the factories where primary suppliers operate. Kmart is focused on enhancing working conditions and empowering workers throughout the supply chain, shown through its commitment to the Accord on Fire and Building Safety in Bangladesh and the ILO/IFC Better Work program in Indonesia, Cambodia and Bangladesh. It was also the first non-european retailer to join ACT (Action, Collaboration, Transformation), a collaboration between international retailers and IndustriALL, the global union, to address living wage. Kmart continues to support organisations such as Salaam Baalak in Delhi and Gurgaon, Room to Read in Bangladesh, and OneSky in China, and the Kmart Wishing Tree Appeal in Australia. Kmart remains committed to the safety of its team members, customers and suppliers, recording a TRIFR of 24.6 for the year. The lost time injury frequency rate (LTIFR) also decreased from 6.7 last year to 6.0 this year. 36
 2016 (195) 2015 90 2014 86 2013 136 For the year ended 30 June 2013 2014 1")
39 Overview Department Stores Target Target team member David Duong at the Chadstone store in Victoria. Year in review Revenue $2,950m , , , , ,658 Key financial indicators 2017 (10) 2016 (195) For the year ended 30 June Revenue ($m) 3,658 3,501 3,438 3,456 2,950 Earnings before interest and tax ($m) (195) (10) Capital employed (R12) ($m) 2,930 2,979 2,466 2, Return on capital employed (%) (8.2) (1.0) Capital expenditure ($m) ¹ 2014 excludes a $677 million non-cash impairment of Target's goodwill (reported as an NTI). 2 The 2016 earnings before interest and tax for Target includes $145 million of restructuring costs and provisions to reset the business but excludes the non-cash impairment of $1,266 million. Performance drivers Decisive actions were taken to transform Target this year, including a reset of the sales base and a reduction of the cost base. Target s revenue for the year was $2,950 million, a decrease of 14.6 per cent on the prior year. Reported EBIT increased by $185 million to an operating loss of $10 million. Excluding the restructuring costs in the 2017 and 2016 financial years of $13 million and $145 million respectively, underlying EBIT increased $53 million to $3 million. EBIT $(10)m During the year, further progress was made to transition the business to everyday low prices, with prices lowered, lossmaking products and unprofitable events exited, and promotional activity reduced. Improved merchandise disciplines delivered SKU reductions, lower inventory levels and increased direct sourcing and factory consolidation. Good progress was made to reduce costs across supply chain, the store support office and stores. Our business Target operates a national network of 303 stores as well as online. Its objective is to provide quality, fashion and basics for everyone at low prices. Target employs more than 14,000 team members across its stores, support offices and direct sourcing operations. Our market Like Kmart, Target participates in the Australian clothing, homewares and general merchandise retail sector. The addressable market exceeds $80 billion and within this market Target has a sound competitive position supported by a strong brand heritage characterised by quality and value. Sustainability Target is committed to proactively managing team member safety, embracing diversity and supporting the communities in which it operates in, as well as maintaining a strong focus on environmental practices and ethical supply chain transparency. Ethical sourcing Target continues to focus on improving conditions for workers in supplier factories through a transparent supply chain. Target is committed to ensuring the safety and wellbeing of workers in supplier factories, and is a signatory to both the Accord on Fire and Building Safety in Bangladesh and the Responsible Sourcing Network s Cotton Pledge. Target is in its third year of partnership with CARE to deliver The Safe Motherhood Program which supports women and their families in Gazipur by delivering vital pre- and post-natal education programs and by connecting them to lifesaving healthcare services. Team member safety Target recorded the safest year in its history, with the lowest ever LTIFR and number of injury claims. Target s LTIFR declined 35.2 per cent on last year to 2.9 and its TRIFR declined 2.6 per cent to Operating and financial review Sustainability Governance Directors report Financial statements Signed reports Shareholder and ASX information
40 Operating and financial review Retail businesses Department Stores Kmart Strategy Kmart s vision is to provide families with everyday products at the lowest prices. Kmart delivers its strategy through two strategic pillars: a great place to shop that is simple to run; and better products at even lower prices. Kmart is focused on delivering growth and improving productivity and efficiencies to support further investment in lower prices. It will continue to invest in the store network by opening new stores to extend customer reach and refurbishing existing stores to optimise category mix and enhance the customer shopping experience. Kmart s high calibre team and strong culture supports the success of the business. Growth strategies Achievements Focus for the coming years A great place to shop that is simple to run Better products at even lower prices Delivered strong sales growth, supported by increased customer transactions and units sold Continued to improve Kmart s customer reach via the online platform Opened 11 new stores and completed 33 store refurbishments during the year Continued price investment Increased focus on customer experience Ongoing focus on productivity Growth of the online channel A rewarding self-serve experience One simple way of working Better availability with less stock Kmart products available everywhere Desirable, on-trend everyday products Quality that matters most to our customers Long-term relationships with the right factories A relentless pursuit of lowest price Risks Kmart s risks include foreign exchange rate fluctuations, maintaining price leadership, new market entrants and the expansion of existing competitors. Price is a key differentiator between Kmart and its competitors, given high levels of product substitution exist within the market. Competitors pricing strategies may pose a threat to Kmart s price leadership position. New market entrants will increase market competitiveness and will continue to create a challenging environment to maintain and grow market share. Risks Exchange rate volatility Maintaining price leadership New market entrants and expansion of existing competitors Mitigation Hedging, and product and pricing frameworks will be used to effectively manage foreign exchange movements Remain focused on maintaining its lowest price position and ensure the product pricing architecture continues to deliver value Continue to lead on price and value despite increased competition from new entrants, online and existing competitors 38
41 Overview Target Strategy Target s vision is to deliver quality fashion and basics to everyone at low prices. Target s strategic framework includes: Product: volume, quality, fashion and basics; Price: low prices every day; Promotion: brand love with mass reach; Customer: easiest and most enjoyable customer experience; Place: great stores and locations; and People: inspired team living Target s values. Growth strategies Achievements Focus for the coming years Product: volume, quality, fashion and basics Improved central planning, sourcing and merchandise teams Improved direct sourcing Further progressed range reduction Removed loss-making products and ceased unprofitable events Continue to seek to lower end-to-end costs Increase direct sourcing Increase contribution of better and best ranges through reset of quality and fashion Operating and financial review Sustainability Price: low prices every day Promotion: brand love with mass reach Lowered prices Continued to transition business to everyday low prices Reviewed and reset marketing spend Focused on developing a consumer insights-led culture Embed clear as you go markdowns policy Implement consistent price and range architecture across Good, Better, Best Complete everyday low prices conversion Continue to evolve marketing mix Improve customer engagement at all touch points Governance Easiest customer experience Place: great stores and locations Improved store presentation and simplified store environment Started trial of assisted check-outs Reset renewal stores Improved store productivity by 10 per cent through better rostering and process simplification Improved supply chain efficiency Completed review of Target s store network Started trialling formats across different fleet sizes Reset online business Further simplify store processes Improve store layout and grading principles Drive an inspiring customer experience involving all elements of the customer journey Improve focus on space profitability Rollout renewal format when economic model developed Increase online s role in driving traffic to store and improve online efficiency Directors report People: inspired team, living our values Embedded vision and values Further developed safety culture Developed clear accountabilities Advanced relocation of store support office Create talent pipeline, leveraging learning and development programs Further develop diversity strategy Financial statements Risks Target s strategy has been reset and the business is now focused on progressing changes to the operating model to better position the business to grow earnings into the future. This journey will be undertaken in an increasingly competitive apparel and general merchandise environment. Risks Business reset and transformation Mitigation New leadership team with previous turnaround experience Revised and focused strategy with operational plans that underpin key strategic initiatives Clear accountabilities, objectives and performance indicators Merchandising and operating discipline, including management of critical path Business simplification and cost base reset to reduce activity Signed reports Competitor activity Monitoring of competitor activity and consumer trends Clear pricing strategy and reset fashion and style to access and capture large addressable market Online proposition advancement to support in-store traffic and leverage store network Team member attraction and retention Improved culture, ways of working and values embedded across the business Short-term incentive plan launched and implementation of learning and development strategies Exchange rate volatility Hedging, and product and pricing frameworks will be used to effectively manage foreign exchange movements 39 Shareholder and ASX information


42 Operating and financial review Retail businesses Officeworks Officeworks opened its first store in Richmond in 1994 and has grown into Australia s leading retailer and supplier of office products and solutions. Officeworks seeks to be a one-stop shop for micro, small and medium-sized businesses, students and households. Officeworks team members Caitlin Fraser (left) and Tammy Churchill. 40
 1,506 1,575 1,714 1,851 1,964 Earnings before interest and tax ($m) 93 103 118 134 144 Capital")
43 Overview Year in review Revenue EBIT $1,964m $144m Prospects Operating and financial review , , , , , Sustainability Key financial indicators For the year ended 30 June Revenue ($m) 1,506 1,575 1,714 1,851 1,964 Earnings before interest and tax ($m) Capital employed (R12) ($m) 1,147 1,097 1, Return on capital employed (%) Capital expenditure ($m) Performance drivers Officeworks revenue increased 6.1 per cent to $1,964 million. Earnings of $144 million were 7.5 per cent higher than the prior corresponding period. Officeworks every channel strategy continued to resonate with customers, with sales growth achieved across stores and online. Growth in sales and earnings was driven by store layout and design changes, new and expanded product ranges, and ongoing enhancements to the online offer. A relentless focus on providing great customer service, both in stores and online, and ongoing price investment to strengthen the value proposition, also contributed to the result. Strong momentum in the business-tobusiness segment was maintained as an increasing number of micro, small and medium-sized business customers responded favourably to Officeworks 'every channel' offer. Strong sales growth, effective cost control and disciplined capital management delivered an increase in return on capital of 121 basis points to 14.7 per cent. Ongoing investment in stores and online to support the future growth of the business was further reflected in a strong capital expenditure program during the year. During the year, six new stores were opened and at the end of June 2017 there were 164 stores operating across Australia. Officeworks will continue to drive growth and productivity by executing its strategic agenda. Competitive intensity is expected to remain high as the landscape evolves, but Officeworks is well placed to continue to drive growth in this environment. Key focus areas in the 2018 financial year will include strengthening and expanding the customer offer by adding new products and ranges. This will strengthen Officeworks position as a one-stop shop for micro, small and medium-sized businesses, students and households. Investment in the store network will continue through more store openings and ongoing enhancements to merchandise layouts and store design. Likewise, enhancements to the online offer will continue. Enhancing productivity and efficiency across all elements of the business will remain a priority with the focus on working capital improvements, better space utilisation and effective cost control. Officeworks remains committed to investing in the talent, diversity and safety of the team, and making a positive difference in the community. MANAGING DIRECTOR, OFFICEWORKS MARK WARD Governance Directors report Financial statements Signed reports 41 Shareholder and ASX information

44 Operating and financial review Retail businesses Officeworks Sustainability Officeworks Positive Difference Plan encompasses three pillars environment, responsible sourcing and people. Officeworks team member Noyna Busch at the North Lakes store in Queensland. Highlights Sales growth was achieved both in stores and online 7.5% increase in earnings to $144m Return on capital increase of 121 basis points to 14.7% Our business Officeworks is Australia s leading retailer and supplier of office products and solutions for micro, small and medium-sized businesses, students and households. Operating through a nationwide network of stores, an online platform, a call centre and a team of business specialists, Officeworks is focused on delivering a one-stop shop for customers. Our market Officeworks current addressable market in Australia is around $20 billion. The market remains highly competitive, with a wide variety of participants, some of whom participate across multiple categories whilst others seek to specialise in certain areas. Officeworks has continued to expand its addressable market through range and category expansion, and to drive innovation in core office products. Environment Officeworks has continued to improve energy efficiency through the rollout of LED lighting to an additional 35 stores and installation of energy monitoring systems to another nine stores. As part of its Positive Difference Plan, Officeworks has continued to reduce the impact of its products. During the year, Officeworks collected more than one million printer cartridges for recycling through the Cartridges 4 Planet Ark program, over 400 tonnes of computer equipment through the BringITBack program and the equivalent of more than 45,000 mobile phones and batteries through MobileMuster. Responsible sourcing Officeworks has increased the sourcing of 100 per cent recycled or Forest Stewardship Council (FSC) certified private label paper product to more than 90 per cent. Officeworks has improved ethical sourcing and gained greater transparency of its supply chain by mapping 90 per cent of its purchases back to the manufacturing location. People and community Over the last 12 months, the number of women in leadership positions (which includes retail team leaders) increased from 35.0 per cent to 37.4 per cent. The number of Indigenous team members increased to 2.3 per cent of Officeworks team members. Safety performance continues to improve, with a reduction in the rolling 12 all injury frequency rate of 24.5 per cent. Officeworks continued to partner with The Smith Family and the Australian Literacy & Numeracy Foundation throughout the year. During The Smith Family Back to School Appeal, $235,000 was raised ensuring that more than 400 students receive ongoing educational support. 42
45 Overview Strategy Officeworks aims to provide customers with the widest range of products and great service at the lowest prices, while providing a safe, rewarding and engaging place to work for team members. Officeworks will continue to drive growth by: enhancing productivity and efficiency; investing in talent, diversity and safety; and strengthening and expanding the customer offer; making a positive difference in the community. extending its every channel reach; Growth strategies Achievements Focus for the coming years Operating and financial review Strengthen and expand the customer offer Extend our every channel reach Introduced new and expanded ranges Implemented merchandise layout and store design changes across selected stores Six new stores opened Ongoing enhancements to the online offer new responsive website and mobile app, better product information and imaging More business specialists driving business-to-business customer growth Continue to add inspiration, innovation and differentiation to products Invest in services to help more businesses start, run and grow Relentless focus on providing great customer service Ongoing investment in lowest prices Make customer engagement easier new stores, new formats Continue to improve the online experience Ongoing investment in a seamless multi-channel offer: clicks and bricks working together Accelerate business-to-business customer growth Sustainability Enhance productivity and efficiency Improvement in working capital metrics Improved space utilisation in stores Effective cost control Invested in supply chain enhancements to support future growth Continue to invest in an efficient, cost-effective and agile supply chain which supports the business strategy Improve space utilisation Improve cost of doing business and productivity Governance Invest in talent, diversity and safety Make a positive difference in the community Delivered a range of development programs to the team Remained committed to diversity, with a specific focus on women in leadership and Indigenous engagement Reduced the rolling 12 AIFR by 24.5 per cent More than 90 per cent of private label paper products from FSC-certified or 100 per cent recycled sources Launched Restoring Australia with Officeworks initiative: two trees are planted for every one used Collected more than one million printer cartridges Installed LED lighting in an additional 35 stores and energy monitoring systems to an additional nine stores Continued to partner with The Smith Family and the Australian Literacy & Numeracy Foundation Ongoing investment in leadership development programs Continued focus on lifting team member diversity, including women in leadership positions Rigorous approach to safety behaviours and outcomes Lift recycling levels, reduce energy consumption further Continue to find ways to do things that are better for the environment Continue to foster community partnerships Directors report Risk Officeworks accepts that risk is an important part of exploring opportunities to operate successfully, but there is also a need to understand and manage risk with a view to minimising unintended consequences. Risks deemed unacceptable to the business are subject to appropriate control and mitigation measures, including risk transference through contractual arrangements, insurance or avoidance. Financial statements Risks Mitigation Changing consumer behaviours New and existing competitors Regular reviews of product range to ensure it meets the evolving demands and preferences of Officeworks target customers Innovation within existing product categories and expansion into new categories Continued focus on providing great customer service Relentless focus on key strategic pillars lowest prices, widest range, great service Continue to build customer loyalty and strengthen the customer offer Effective cost control and disciplined inventory management Signed reports Unfavourable economic conditions Continued focus on providing a compelling offer to customers Effective cost control while continuing to invest for the future Relentless focus on driving continuous improvement across all elements of the business to remain competitive Data and IT security Dedicated internal capability focused on IT systems and security A vast array of IT related controls are in place which include appropriate firewalls, disaster recovery plans, periodic testing to ensure an appropriate level of security is maintained, and a security awareness program to keep all team members informed of their responsibilities 43 Shareholder and ASX information


46 Operating and financial review Industrials Industrials The Industrials division includes Wesfarmers three industrial businesses: Chemicals, Energy and Fertilisers; Industrial and Safety; and Resources. The aggregation of these businesses under focused leadership has streamlined reporting and decision-making, enhanced sharing of knowledge and ideas, and better positioned the division for future growth. Clockwise from top: Workwear Group team members Maria Italiano and Arthur Thomasse inspecting sample uniforms for the 2018 Commonwealth Games. CSBP process operators Ken Twaddle (left) and Bradd Ripp on site in Kwinana, Western Australia. Curragh team member Kerry Lawson at the coal mine in Blackwater, Queensland. 44
 4,991 4,977 4,985 4,672 5,161 Earnings before interest and tax ($m) 562 482 353 47 915")
 392 386 258 220 169 1 Refer to individual businesses key financial indicators for footnotes.")
47 Overview Year in review Revenue EBIT $5,161m $915m Prospects Operating and financial review , , , , , Sustainability Key financial indicators 1 For the year ended 30 June Revenue ($m) 4,991 4,977 4,985 4,672 5,161 Earnings before interest and tax ($m) Capital employed (R12) ($m) 3,999 4,125 4,245 4,244 3,393 Return on capital employed (%) Capital expenditure ($m) Refer to individual businesses key financial indicators for footnotes. Performance drivers Earnings in each of the three Industrials businesses grew during the period, producing a record result of $915 million compared to $47 million in the prior year. The result was primarily driven by earnings of $405 million in Resources, which was $715 million above last year due to significantly higher export sales revenue. Earnings growth in Chemicals, Energy and Fertilisers was driven by strong performance in the ammonium nitrate and Kleenheat businesses, as well as the turnaround in Australian Vinyls following the cessation of polyvinyl chloride (PVC) manufacturing in the prior year. Reported EBIT included $33 million relating to WesCEF's share of revaluation gains in Quadrant Energy and a $22 million profit on sale of land. Industrial and Safety is now benefiting from a streamlined operating model following the business simplification initiatives implemented under the Fit for Growth program. Blackwoods drove improvements across merchandising, customer service and supply chain which delivered margin improvement; Workwear Group benefited from lower operating costs following the implementation of a number of initiatives to reduce the cost of doing business; and Coregas continued to grow its business through expansion into New Zealand and adjacent markets such as health care. The Resources business reported significant increases in revenue and earnings primarily due to increases in metallurgical and steaming coal prices and higher export sales volumes. This year saw the Industrials businesses take advantage of growth opportunities afforded by market and customer dynamics, streamlined operating models and improved financial disciplines. Chemicals, Energy and Fertilisers continues to focus on maintaining strong operational performance, developing new business opportunities and deploying new technologies. A key activity in the 2018 financial year is the commissioning of the ammonium nitrate emulsion plant. In Industrial and Safety the reset of the Blackwoods and Workwear Group businesses, together with investments in upgraded systems and management capability, are expected to provide a platform to support future growth. The businesses will continue to improve systems and processes to enhance supply chain efficiency and customer service, and optimise category management and sourcing to improve sales and margins. In Resources, both mines continue to focus on operational productivity, cost control and capital discipline. Metallurgical and thermal coal prices are expected to remain volatile in the near-term. MANAGING DIRECTOR, WESFARMERS INDUSTRIALS (for the reporting period) ROB SCOTT Governance Directors report Financial statements Signed reports David Baxby, Managing Director, Wesfarmers Industrials, effective August Shareholder and ASX information

48 Operating and financial review Industrials Industrials Chemicals, Energy and Fertilisers Year in review Revenue EBIT $1,639m $395m , , , , , From left, Jeff Embleton and Greg Luyt in the ammonium nitrate control room in CSBP s Kwinana works, in Western Australia. Key financial indicators For the year ended 30 June Revenue ($m) 1,805 1,812 1,839 1,820 1,639 Earnings before interest and tax ($m) Capital employed (R12) ($m) 1,400 1,539 1,535 1,554 1,443 Return on capital employed (%) Capital expenditure ($m) ¹ 2014 excludes a $95 million gain on sale of the 40 per cent interest in ALWA (reported as an NTI) includes a net $10 million gain comprising insurance proceeds and the gain on sale of Kleenheat's east coast LPG operations, partially offset by asset writedowns includes $32 million of one-off restructuring costs associated with the decision to cease PVC manufacturing includes $33 million relating to WesCEF's share of revaluation gains in Quadrant Energy and profit on sale of land of $22 million. 5 Excludes capitalised interest. Performance drivers Revenue of $1,639 million was 9.9 per cent below last year due to declines in Chemicals and Fertilisers revenue. Chemicals revenue declined due to lower PVC volumes, following the change to an import model, and lower ammonia prices which affected ammonium nitrate sales prices as well as ammonia revenue. Fertiliser sales volumes were lower due to a dry start to the 2017 season. Growth in natural gas and electricity revenue contributed to growth in Energy revenue. Reported EBIT of $395 million was 34.4 per cent higher than last year including $33 million relating to WesCEF's share of revaluation gains in Quadrant Energy and a $22 million profit on sale of land in the current year, and $32 million of costs associated with the cessation of PVC manufacturing in the prior year. Excluding these one-off items, underlying EBIT increased 4.3 per cent to $340 million. Pleasingly, safety performance improved significantly during the year. Our business WesCEF operates eight businesses in Australia and employs approximately 1,200 team members. WesCEF s business units are Chemicals, Energy (Kleenheat), and CSBP Fertilisers. Our market Chemicals includes: the manufacture and supply of ammonia, ammonium nitrate (AN) and industrial chemicals primarily to the Western Australian resources and industrial sectors through CSBP Queensland Nitrates (QNP), CSBP s 50 per cent joint venture with Dyno Nobel Asia Pacific which manufactures and supplies AN to the resources sector in the Bowen Basin coal fields Australian Gold Reagents (AGR), CSBP s 75 per cent joint venture with Coogee Chemicals which manufactures and supplies sodium cyanide to the Western Australian and international gold mining sectors Australian Vinyls, which supplies PVC resin to the Australian industrial sector ModWood, which manufactures woodplastic composite decking and screening products Kleenheat extracts LPG from natural gas and distributes bulk and bottled LPG to the residential and commercial markets in Western Australia and the Northern Territory. It distributes bulk LNG through its subsidiary, EVOL LNG, primarily to the remote power generation market in Western Australia. Kleenheat is also a retailer of natural gas to residential and commercial markets, and electricity to businesses in Western Australia. CSBP Fertilisers manufactures, imports and distributes phosphate, nitrogen and potassium-based fertilisers for the Western Australian agricultural sector. CSBP Fertilisers also provides technical support services for growers through a network of employees and accredited partners in regional Western Australia. Wesfarmers owns a 13.7 per cent interest in Quadrant Energy, which supplies domestic gas in Western Australia and oil across Australia. Earnings from this interest are included in WesCEF s results. Sustainability WesCEF continues to improve its safety performance through its Safe Person, Safe Process, Safe Place program, investing in leadership capability, operating responsibly, contributing positively to the communities in which it operates, and maintaining a commitment to environmental stewardship. WesCEF supported community organisations including the Clontarf Gilmore College, Moorditj Koort, WACA Regional Junior Cricket Program, and a number of emerging partnerships (Murdoch University, Edith Cowan University, Kwinana Industries Council and local schools) associated with the development of WesCEF s STEM (science, technology, engineering, mathematics) project. 46
49 Overview Strategy WesCEF s objective is to develop a portfolio of successful and innovative industrial businesses that deliver satisfactory shareholder returns and continually strengthen its reputation for the management of health, safety and the environment. Growth strategies Achievements Focus for the coming years Invest in business capacity to meet the needs of customers Execute opportunities for growth in existing and new markets Ammonium nitrate and sodium cyanide plants operated at full expanded production capacity Negotiated a new explosive-grade AN contract, partially offsetting the expiry of a key contract in July 2017 Kleenheat won the Canstar Blue Most Satisfied Customer Award Entered into an agency agreement with Elders to distribute CSBP fertilisers Started construction of AN emulsion plant, underpinned by a long-term offtake agreement Continued market-share growth of natural gas retailing business in WA EVOL LNG successfully entered the LNG bunkering market Launched website for Decipher, CSBP s new agriculture technology brand Secure AN contract extensions and pursue new volumes Continue to focus on plant reliability, process efficiency and productivity improvements Continue to invest to grow and expand fertiliser services and natural gas retailing offer Commissioning of AN emulsion plant Further development and deployment of Decipher Ongoing evaluation of opportunities to grow in existing and new markets Prepare for Full Retail Contestability in the WA electricity market Operating and financial review Sustainability Foster a culture that recognises that people are central to the success of the business Focus on sustainable operations for the benefit of employees, customers and communities in which we operate Significant investment in the Aboriginal Engagement and Employment Plan with an emphasis on job creation, skill building and creating an inclusive culture Delivery of structured leadership programs and the introduction of a management essentials program for employees Programs for engineering graduates and cadets Trialling new ways to attract and retain female employees, especially in leadership and non-traditional roles Development of Wellness@WesCEF, a program to support employee wellness including mental health Community acceptance and regulatory compliance 90 per cent greenhouse gas abatement equating to 1.2 million tonnes of carbon dioxide equivalent Direct community contributions of $310,000 supporting the Clontarf Gilmore College, Moorditj Koort, and the WACA Regional Junior Cricket Program, as well as STEM-based initiatives delivered with the Kwinana Industries Council and various universities Implement further targeted programs to attract, develop and retain an engaged, diverse workforce Continue a strong focus on leadership training and a more inclusive culture Ongoing development of technical competence training and skills enhancement across our complex operations Expand graduate program to include commercial graduates with a focus on women Ongoing commitment to improve safety performance and capability Continue focus on regulatory compliance and assessment of operational excellence Continue to deliver on community investment strategies Manage contaminated land issues and sell surplus land at Laverton, Victoria (previous Australian Vinyls site) Governance Directors report Risk WesCEF manages risk as an intrinsic part of its business and is committed to conducting its activities in a way that ensures the continued and sustainable growth of shareholder value. Risks deemed unacceptable are transferred (through contractual arrangements or insurance), mitigated or avoided. Financial statements Risks Mitigation Serious injury, safety or environmental incident Raw material input price and exchange rate volatility Continue to invest in improving safety culture and performance for the safe operation of facilities and distributing products in a way that minimises any adverse effect on employees, contractors or local communities Maintain a strong focus on operating facilities and distribution systems in a manner which minimises the effect on the environment Earnings volatility from raw material price movements is mitigated through a range of price pass-through arrangements with customers, and detailed demand planning and forecasting processes including regular markto-market of inventory Exchange rate effects on raw material costs are closely monitored and included as a criterion for product pricing decisions. Where appropriate and aligned with Wesfarmers guidelines, foreign exchange hedges are used to remove earnings volatility Signed reports Reducing market demand for products Establishing a balance of long-term contracts with minimum volume requirements and established pricing mechanisms (predominantly with domestic customers) with short-term spot agreements, including placing products into export markets from time to time Continue to improve brand awareness and focus on satisfying customer needs 47 Shareholder and ASX information
, Josh Hansen, James Waghorne and Cedric Cuttabutt at Blackwoods")
50 Operating and financial review Industrials Industrials Industrial and Safety The number of Indigenous employees in the Industrials business increased from one per cent in 2016 to three per cent in Clockwise from left, Jermaine Bropho, Raymond Winmar, Trudi Chesterton (Blackwoods Western Australian State Supply Chain Manager), Josh Hansen, James Waghorne and Cedric Cuttabutt at Blackwoods in Canning Vale, Western Australia. Year in review Revenue , , , , ,647 Key financial indicators Performance drivers Revenue of $1,776 million was 3.7 per cent below last year, with challenging market conditions affecting sales in Blackwoods and Workwear Group s industrial wear business. Blackwoods revenue has shown recent signs of stabilising following a prolonged period of decline. Coregas experienced revenue growth as it continued to increase market share and develop new market opportunities. EBIT $1,776m $115m For the year ended 30 June Revenue ($m) 1,647 1,621 1,772 1,844 1,776 Earnings before interest and tax ($m) Capital employed (R12) ($m) 1,119 1,127 1,257 1,339 1,363 Return on capital employed (%) Capital expenditure ($m) ¹ 2015 includes restructuring costs of $20 million related to branch closures, business consolidation and organisational redesign includes $35 million of restructuring costs associated with the 'Fit for Growth' transformation. Reported EBIT of $115 million represented an 82.5 per cent increase on last year. Excluding restructuring costs of $35 million in the prior year, underlying EBIT increased 17.3 per cent with higher earnings across all businesses. Blackwoods delivered increased earnings supported by higher gross margins from improved category management and supplier relationships, and stronger pricing disciplines. Workwear Group earnings increased as a result of cost savings achieved through the Fit for Growth program. Our business Industrial and Safety operates three main businesses: Blackwoods (comprising Blackwoods Australia and NZ Safety Blackwoods); Workwear Group; and Coregas. Blackwoods is a leading supplier of tools, safety, workwear and other industrial supplies to businesses of all sizes across Australia and New Zealand. It distributes its products through an extensive national supply chain and branch network and online platforms. Its broad product range is supported by expert technical advice and solutions. Workwear Group is Australia s largest provider of industrial and corporate workwear, featuring iconic Australian brands such as Hard Yakka, King Gee and Stubbies. Workwear Group also supplies bespoke and catalogue uniforms to leading airlines, financial services providers, retailers and other large corporates through NNT and Incorporatewear (UK), as well as specialised garments to defence and emergency services customers in Australia and New Zealand. Coregas is a national industrial gas distributor in Australia and New Zealand, serving customers of all sizes through multiple sales channels and distribution networks including Blackwoods and Bunnings. Our market In Australia, Blackwoods, Workwear Group and Coregas service customers across diverse industries such as construction, mining, manufacturing, retail, food and beverage, transport, facilities maintenance and government. In New Zealand, NZ Safety Blackwoods market is primarily small-to-medium sized businesses in a wide range of industries, supplemented by selected large enterprise customers. Sustainability Industrial and Safety established a targetbased sustainability plan during the year, and progressed key areas of focus such as gender balance, Indigenous engagement, ethical sourcing and the health and wellbeing of team members through a range of new programs. Employee safety continued to be a high priority area with new safety initiatives such as Five Lifesaving Rules implemented across the distribution centres. 48
51 Overview Strategy Industrial and Safety continues to drive growth in earnings by leveraging its new, simplified platform to improve business performance through lowering the cost of doing business, improving the offer to customers and growing the revenue base. Across Blackwoods, initiatives focused on the four core areas of sales and service, merchandising, supply chain and digital are delivering a more customer-centric and competitive business. Other strategic priorities include continuing the turnaround of Workwear Group and further growing Coregas through new distribution channels. Operating and financial review Growth strategies Achievements Focus for the coming years Implementation of a more customer-centric and competitive Blackwoods platform Reduced complexity in structure, operations and brand Lowered operating costs allowing greater investment in capabilities Channels to market realigned to focus on growth opportunities Improved supply chain processes and performance Enhanced digital platforms New preferred supplier agreements and range rationalisation commenced Continue to reinvest in improving capabilities across sales and service, merchandising, supply chain and digital Leverage the Blackwoods platform to grow into light industrial sectors Grow medium-size customer segment in core heavy industrial markets Grow customer base and penetration of adjacent markets Sustainability Turnaround performance in Workwear Group Grow Coregas through new distribution channels Supply chain optimisation initiated Sourcing rationalisation program commenced Channels to market realigned Increased market share Leveraged Blackwoods and Bunnings distribution channels in Australia and New Zealand Acquired Supagas NZ Renewed medical gases proposition launched Reduce complexity and improve speed to market Improve range and pricing architecture Drive a results-focused culture Further develop new distribution channels and market opportunities Governance Risk As a supplier of industrial, safety and workwear products, the business is exposed to the performance of customers industry sectors as well as macro-economic factors such as capital investment, employment, exchange rates and interest rates. Directors report Risks Subdued investment activity in traditional customer segments of mining and resources Mitigation Implement the new Blackwoods platform in Australia and New Zealand to support growth into different market sectors Continue to execute performance improvement plans in Blackwoods and Workwear Group Further develop new distribution channels for Coregas Growth of new and existing competitors, including supplier sales direct to customer Safety or environmental incident Develop a more customer-centric and relevant platform Develop and launch new digital capabilities Continue to optimise range and price Continue to focus on quality systems and ensuring compliance with standards Fully operational safety program including regular monitoring and the continuation of the safety culture Active safety engagement by senior management Financial statements Signed reports 49 Shareholder and ASX information

52 Operating and financial review Industrials Industrials Resources Our business Resources has investments in two coal mines. Both mines are world-scale, low-cost, opencut producers. The majority of production is exported to Asia. Coal mining operations at the Curragh mine at Blackwater, Queensland. Year in review Revenue , , , , ,539 Key financial indicators Performance drivers Revenue of $1,746 million was 73.2 per cent above last year, primarily due to significantly higher export coal prices and higher sales volumes. Reported EBIT was $405 million, $715 million above last year, primarily due to significantly higher export sales revenue. EBIT $1,746m $405m (310) For the year ended 30 June Revenue ($m) 1,539 1,544 1,374 1,008 1,746 Earnings before interest and tax ($m) (310) 405 Capital employed (R12) ($m) 1,480 1,459 1,453 1, Return on capital employed (%) (22.9) 69.0 Capital expenditure ($m) ¹ 2016 earnings before interest and tax excludes the $850 million non-cash impairment of Curragh. At Curragh, a continued focus on productivity and a revised mine plan drove an increase in production, supplemented by the opportunistic use of contractor fleet to take advantage of higher export metallurgical coal prices. Curragh (100 per cent) Situated in Queensland s Bowen Basin, Curragh is one of the world s largest metallurgical coal mines with an operating track record of more than 30 years. It produces metallurgical coal for export markets and also supplies steaming coal to the Queensland Government s Stanwell Corporation under a long-term contract until approximately Curragh s baseline production capacity is 8.5 million tonnes per annum (mtpa) for export metallurgical coal and 3.5 mtpa for steaming coal. Bengalla (40 per cent) The business has a 40 per cent interest in the Bengalla mine, located south-west of Muswellbrook, in the Hunter Valley region of New South Wales. Bengalla produces steaming coal for export markets and has a 10.7 mtpa run-of-mine capacity (100 per cent basis). Our market Curragh Curragh is reliable, flexible and one of a small number of independent Australian producers of metallurgical coal. It has a well-established and geographically diverse customer portfolio with a number of long-standing relationships with world-leading steel-makers. In the 2017 financial year, Curragh s metallurgical exports by volume went to Japan (36 per cent), South Asia (30 per cent), North Asia (22 per cent), Europe (8 per cent) and other (4 per cent). Bengalla Bengalla s steaming coal is used for power generation and is exported primarily to customers based in Japan and North Asia. Sustainability Resources strives to be a highly ethical business that puts the safety and wellbeing of its people first. This is achieved by focusing on workplace health and safety to prevent accidents and injuries. During the 2017 financial year, Curragh s TRIFR decreased from 4.8 to 3.7. The business is committed to operating in a sustainable manner and takes its environmental and social responsibilities seriously. It seeks to make a positive and lasting contribution to the communities in which it operates and to the nation through its economic activity. Resources continues to support local communities, particularly in times of hardship as a result of natural disasters and by providing improved employment opportunities for local Indigenous communities. 50
53 Overview Strategy The business s investment time horizon is long-term and each mine seeks to maximise shareholder value through commodity cycles. In the current environment of volatile export coal prices, both mines continue to respond with a strong focus on improving operational productivity, cost control and capital discipline. Opportunities to increase production and extend mine life continue to be assessed, subject to market conditions including export prices. Growth strategies Achievements Focus for the coming years Business excellence Mine expansions Curragh: Development of a revised mine plan to target opportunities identified by the 2016 Expert Panel Review Increased production to take advantage of higher export coal prices Continued focus on safety performance with reduction in TRIFR Bengalla: Lowest quartile producer Curragh: Conditional Commonwealth approval granted for mining leases within the MDL 162 area adjacent to Curragh and Curragh North Feasibility study completed for a second stage expansion to 10mtpa export capacity Continuous improvement of safety performance Continue strong focus on operational productivity, cost control and capital discipline Implementation of revised mine plan Progress MDL 162 Commonwealth approvals Investment decision to expand Curragh subject to market conditions Evaluate production expansion options for Bengalla Risk Resources has direct financial exposure to the global commodity cycle. Curragh is exposed to global steel production and the flow-on demand for export metallurgical coal. Bengalla is exposed to export demand for steaming coal in North Asia. Operating and financial review Sustainability Governance Risks Mitigation Revenue export coal price movements (upside and downside risk) Mine operations (e.g., weather, safety management, equipment and performance) Both mines maintain established, long-term, close relationships with export customers Export sales are diversified by customer and geography Currency hedges now fully closed out, in line with major Australian metallurgical coal competitors Resources has detailed operating practices and procedures in place to ensure that both mines are operating sustainably and efficiently for the long term. Both Curragh and Bengalla have established track records of operating performance, safety and reliability Directors report Financial statements Signed reports 51 Shareholder and ASX information
 contributed earnings of $55 million, compared to $77 million last year.")
54 Operating and financial review Other activities Wesfarmers is also a major investor in the BWP Trust, Gresham Partners and Wespine Industries. BWP Trust Wesfarmers investment in the BWP Trust (the Trust) contributed earnings of $55 million, compared to $77 million last year. The Trust was established in 1998 with a focus on warehouse retailing properties and, in particular, Bunnings warehouses leased to Bunnings Group Limited. BWP Management Limited, the responsible entity for the Trust, is a wholly owned subsidiary of Wesfarmers Limited. Units in the Trust are listed on the Australian Securities Exchange and Wesfarmers holds, through a wholly owned subsidiary, 24.8 per cent of the total units issued by the Trust as at 30 June The Trust performed in line with its business objectives during the year, providing a 4.3 per cent increase in full year distributions and a 5.1 per cent net increase in the assessed valuation of the Trust s property investment portfolio. The Trust s portfolio as at 30 June 2017 consisted of a total of 80 properties: 79 established Bunnings warehouses, eight of which have adjacent retail showrooms that the Trust owns and are leased to other retailers; and one fully-leased stand-alone large format showroom property. Gresham Partners Wesfarmers has a 50 per cent shareholding in Gresham Partners Group Limited, the holding company for the Gresham Partners investment house operations. Gresham is a leading independent financial services business focused on the provision of corporate and property advisory services, funds management, property financing and debt solutions. During the year, Gresham participated in a number of significant advisory transactions, including mergers and acquisitions, corporate restructurings and debt refinancing on behalf of a range of domestic and international clients. Its property funds management business, which is the manager of established institutional funds and syndicates, continued to finance a range of Australian development projects. Wesfarmers is a participant in the Gresham Private Equity funds with the remaining holding being an underground mining services business operating both in Australian and overseas markets. Wespine Industries The 50 per cent-owned Wespine Industries operates a plantation softwood sawmill in Dardanup, Western Australia. Timber sales for the 2017 financial year decreased by 11 per cent largely due to further softening in Western Australian house building activity. Operating margins also deteriorated during the year due to increased competition from imported timbers and an overall surplus in supply volumes. Safety performance improved with a 32 per cent reduction in the TRIFR for the year. The management team is continuing its focus on the identification and mitigation of occupational risks, notably manual handling. A BWP Trust development in Harrisdale, Western Australia. 52


55 Overview Sustainability Wesfarmers has been committed to creating value for its shareholders, customers, employees and communities for more than a century. Operating and financial review Sustainability Governance Directors report Long-term value creation is only possible if we play a positive role in the communities we serve. At Wesfarmers, sustainability is about understanding and managing the ways we impact our community and the environment, to ensure that we will still be creating value in the future. We are committed to working with our suppliers to adhere to ethical business conduct and proactively address potential human rights issues through a range of actions. Our statement pursuant to the UK Modern Slavery Act appears in the Wesfarmers sustainability report. We acknowledge that the world is changing and climate change will have serious implications for our customers, the economy and the communities in which we operate. We recognise that we have a role in investing in Australia s response to climate change as this will deliver significant economic, social and environmental benefits for us all. For Wesfarmers, this is about good governance, prudent risk management and positioning our businesses competitively for the future. The Dow Jones Sustainability Index tracks sustainability performance of leading companies around the world. In September 2017 Wesfarmers was advised it had scored 78 out of 100, two points behind the global leader in the food and staples sector. Our full sustainability report will Our full sustainability report will be available in October 2017 at be available in October 2017 at sustainability.wesfarmers.com.au sustainability.wesfarmers.com.au Financial statements Signed reports 53 Shareholder and ASX information
56 Sustainability Our performance This year we are proud of our progress in the following areas. SAFETY Injury rate 16% ETHICAL SOURCING AND HUMAN RIGHTS Factories 1 in our audit program DIVERSITY Indigenous employees COMMUNITY CONTRIBUTIONS Direct funding 5,455 4,231 $73m Reduced our Total Recordable Injury Frequency Rate by 16 per cent to Improved the transparency of our supply chain with 5,455 factories in our audit program. Worked to promote diversity in our workplaces, with 4,231 employees identifying as Indigenous 2. Contributed more than $73 million in direct funding to community organisations. We acknowledge that we can always do better. PEOPLE DEVELOPMENT WASTE AND WATER USE ETHICAL SOURCING AND HUMAN RIGHTS CLIMATE CHANGE RESILIENCE While Wesfarmers workforce is made up of 54 per cent women and 46 per cent men, a key opportunity for the Group is to increase the percentage of leadership positions held by women. Despite our efforts, ongoing reduction in waste disposed and water use is hard to maintain as our businesses continue to grow. We will continue to seek opportunities to do this. We will continue to focus on ethical sourcing, especially supply chain transparency. Strengthening our relationships with suppliers ensures that we can contribute positively in this area. We will continue to focus on climate change resilience, especially energy efficiency. Wesfarmers is committed to minimising its footprint and to deliver solutions that help its customers and the community do the same. 1 Factories include supplier sites. 2 As at 30 June

57 Overview Safety We maintain a relentless focus on providing safe workplaces. Keeping our employees, customers, suppliers and visitors across all our sites safe is our highest priority. Improvements to safety are core to all our operations, whether it is in a department store or at an industrial site. We are focused on continual improvements in safety leadership, strategies targeting risk reduction and improving physical and mental health. We are seeing the benefits of this relentless focus on making our workplaces safer but we acknowledge that if team members are injured at work, our safety performance still requires improvement and remains our highest priority. To monitor our historical safety performance, we use total recordable injury frequency rate (TRIFR) and lost time injury frequency rate (LTIFR), which show injuries per million hours worked by employees and long-term contractors. This year, our TRIFR decreased Total recordable injury frequency rate TRIFR is the number of lost time injuries and medical treatment injuries per million hours worked. 2 Restated due to maturation of data. by 16 per cent from 33.6 to 28.3, with improvements across most divisions. Our LTIFR increased 1.4 per cent this year compared to the same period last year. We were pleased that our workers compensation claims decreased by more than 1,000 to 6,294. Lost time injury frequency rate LTIFR is the number of lost time injuries per million hours worked. 2 Restated due to maturation of data. Operating and financial review Sustainability Governance People development We provide opportunities for our people to enhance their job performance and develop their careers. Directors report We employ approximately 223,000 people globally, including more than 203,000 in Australia, making Wesfarmers Australia's largest private-sector employer. Of our people, approximately 68 per cent are employed on a permanent basis and 32 per cent are employed on a casual basis. Wesfarmers businesses provide employment to approximately one in 60 working Australians or one in 14 working Australians under 20 years of age. In 2017, we distributed $8.7 billion to our employees in salaries, wages and benefits. The quality of our people is our greatest competitive advantage and providing them with opportunities to improve their performance and their careers is key to our success. Training and development Wesfarmers is committed to providing strong skills-based training and leadership development to all employees. In addition to on-the-job training, Wesfarmers divisions provide job-specific training opportunities as well as more general Wesfarmers corporate office team members, from left, John Evans, Alison Bodill and Justin Laird. training opportunities covering areas like technical skills, customer service, team work and leadership. These programs are available to full-time, part-time and casual employees. Workplace relations More than 83 per cent of our workforce is covered by collective agreements. We recognise the right of those we employ to negotiate either individually or collectively, with or without the involvement of third parties. We also believe in maximising the flexibility of workplace arrangements available to our employees. This year, workplace relations at Coles received some attention. The Fair Work Commission declined to approve a new enterprise bargaining agreement covering all Coles store team members. Following that decision, the majority of Coles team members are now covered by the 2011 Store Team Enterprise Agreement. Most meat team members are covered by statebased agreements and a small number of team members (Coles Online customer service agents) are covered by the General Retail Industry Award. In July 2016, an individual Coles team member filed an application to terminate the 2011 agreement. This matter is currently before the Commission. 55 Financial statements Signed reports Shareholder and ASX information


58 Sustainability Diversity We strive to create an inclusive work environment, with particular attention to gender balance and the inclusion of Indigenous people. Wesfarmers considers building a diverse and inclusive workforce an opportunity to drive strong and sustainable shareholder returns. Creating an environment that attracts, retains, and promotes talent with a wide range of strengths and experiences ensures Wesfarmers is best equipped for future growth. Our commitment to diversity across Wesfarmers extends to all individuals and all perspectives. Particular focus is paid to achieving a balance of men and women in senior management positions across our divisions and continuing to boost employment of Indigenous people. Gender balance While Wesfarmers workforce is made up of 54 per cent women and 46 per cent men, a key opportunity for the Group is to increase the percentage of leadership positions held by women. Women hold 47 per cent of salaried roles and 56 per cent of award or enterprise bargaining agreement (EBA) roles. The Wesfarmers Diversity Policy outlines four core objectives which are used to measure performance in this area. The objectives are reviewed annually by the Board, as well as Wesfarmers progress in achieving these objectives. Specific progress targets are linked to senior executive key performance objectives under the incentive plan. Given the diversity of the Wesfarmers portfolio, each division has developed its own gender balance plan in line with the Group objectives. Indigenous representation in our workforce Our vision for reconciliation is an Australia that affords equal opportunities to all. Wesfarmers aims to ensure that Indigenous people feel welcome in our businesses as employees, customers, suppliers and visitors. We will know that we have succeeded when we have a workplace that reflects the diversity of the communities we serve. Wesfarmers produced its first public Reconciliation Action Plan (RAP) in Our RAP outlines specific measurable actions undertaken across the Group, targeting Indigenous employment, business engagement, community partnerships and team member volunteering with Indigenous organisations. Kmart team member Louise Crook at the Kmart store in Toowong, Queensland. Kmart creates an inclusive environment The employment of people with (dis)abilities remained a key focus for Kmart this year. Kmart worked with Mylestones and the Australian Network on Disability, to ensure people with (dis)abilities could participate equitably in the employment process and feel safe in Kmart stores. Indigenous team members , , , , ,302 Female representation across the Group (percentage of employees) 2017 Wesfarmers Limited Non-Executive Directors 38 % 38 % Senior executive positions (General manager or above) 24 % 23 % All management and professional roles 32 % 30 % Total workforce % 55 % During the year we increased the employment of Indigenous team members by 27 per cent Indigenous employment As Australia s largest private sector employer, we believe we are able to provide Indigenous people with greater opportunities to participate in sustainable employment, and this remains the primary focus of our RAP. At 30 June 2017, Wesfarmers had 4,231 Indigenous team members, representing two per cent of our current Australian workforce. This is a 27 per cent increase on the previous year. Wesfarmers has committed to increasing its procurement from Indigenous suppliers. We are a founding member of Supply Nation, Australia s leading supplier diversity accreditation organisation. Our RAP is available at wesfarmers.com.au Coles team member Dion Patten at the Coles Aurora Village supermarket in Victoria. 56


59 Overview Suppliers We commit to strong and respectful relationships with our suppliers. Our relationships with more than 18,000 suppliers across the Group are very important to us. This year we incurred costs to suppliers of $46.4 billion. We want to provide value to our customers and sustainable growth for our suppliers and their employees. Striving for better efficiency in our consumer supply chains ensures their continued competitiveness. Australia first at Coles Coles has an Australia first sourcing policy to source Australian-grown food whenever and wherever it can. Coles sources more than 96 per cent of fresh fruit and vegetables from Australian growers, 100 per cent of fresh milk and eggs, and 100 per cent of fresh meat for the meat department from Australian producers. Coles is supporting Australian producers and growers with new and extended long-term contracts. During the year, Coles signed a 10-year agreement with TOP Pork Pty Ltd which paves the way for 12 Victorian and South Australian farming families to supply sow stall free pork directly to Coles each week. In 2015, Coles entered into a 10-year agreement with Sundrop Farms to supply tomatoes and in 2016, secured an eight-year agreement with Manbulloo Mangoes. Coles provides more than $9 million to support innovation Cattle producer Bill Crowther will become the first cattle producer in Queensland to supply to Coles grass-fed GRAZE beef range, using a $500,000 grant from the Coles Nurture Fund. During the year Coles extended its milk contract with Norco. The original five-year contract, signed in 2014, has been extended until 2023 with Coles having an option to extend until Under the arrangement, around 220 New South Wales and Queensland dairy farmers will supply 60 million litres of Coles Brand milk annually. Under a supply contract with Simplot, which has been extended until 2024, Coles has committed to sourcing an additional six million kilograms a year of Australiangrown vegetables which were previously sourced from overseas. Operating and financial review Sustainability Governance Ethical sourcing and human rights We strive to source products in a responsible manner while working with suppliers to improve their social and environmental practices. Wesfarmers' businesses source products from a range of locations. Some of the major locations we source from outside Australia include China, Bangladesh, Europe, Indonesia, India, Thailand, New Zealand, Vietnam, South Korea and Malaysia. Buying products from these regions creates economic benefits for them as well as allowing our businesses to provide affordable products to consumers. We are committed to working with our suppliers to adhere to ethical business conduct and proactively address human rights through a range of actions. Ethical sourcing audit programs To mitigate the risk of unethical practices occurring in our supply chains, the relevant Wesfarmers businesses (Coles, Bunnings, Target, Kmart, Officeworks, and Industrial and Safety) apply an ethical sourcing audit program to certain suppliers. Suppliers are considered lower risk if they are supplying recognised international brands. While high-risk jurisdictions mainly correlate to our suppliers from emerging markets, we know human rights issues can happen anywhere and we accept that we cannot consider suppliers low risk if they operate in more regulated countries, like Australia. This year, our audit program covered 5,455 factories (this includes supplier sites) in Australia and overseas used to produce products for sale across our retail businesses. Factories in the audit program are required to have undertaken an assessment as mandated by our business. Factories may then be required to undertake further assessments including having a current audit certificate, which means they have been audited by us or another party whose audits we accept. Those audits identify a range of non-compliances, from minor non-compliances such as minor gaps in record keeping to critical breaches, such as incidences of forced labour or bribery. Ethical sourcing audit program findings 5,455 Total number of factories 1 Approved 2,686 Conditionally Approved 2,416 Expired Audits 287 Critical Breaches 66 1 Factories include supplier sites. Kmart joins partnership to improve working conditions in factories Kmart is committed to enhancing the voice, capabilities and quality of life of workers in its supply chain. As part of this commitment, in 2017 Kmart joined the Better Work program in Indonesia, Cambodia and Bangladesh. 57 Directors report Financial statements Signed reports Shareholder and ASX information

60 Sustainability Climate change resilience We strive to improve the emissions intensity of our businesses and improve their resilience to climate change. Wesfarmers supports the recommendations of the Task Force on Climate-related Financial Disclosures and is committed to providing stakeholders with information in relation to how we are managing climate change risks. Our position on climate change Wesfarmers accepts the Intergovernmental Panel on Climate Change's (IPCC) assessment of climate change science and believes the world can pursue three objectives: a stable and reliable energy market; reduce emissions; and reduce the cost of energy. We have identified climate change as the most material environmental and social sustainability issue relevant to our businesses and have incorporated it into our long-term planning. We recognise that the climate is changing due to human actions and we acknowledge that business has a part to play in mitigating this climate change. Wesfarmers supports Australia s commitments under the Paris Agreement to limit global warming to 1.5 C 2 C above pre-industrial levels. Industry and governments must work together to achieve this outcome. Long-term policy certainty is a prerequisite for decarbonisation (meaning the economy reaches net zero carbon emissions) by 2050 to occur efficiently and affordably. During the year, we met with the Federal Government to reiterate our position that stable bipartisan action on climate change is critical for business to manage risk and invest in climate mitigation. Climate change is a critical, Board-level, governance and strategic issue at Wesfarmers. Management is responsible for assessing and managing climate related risks and opportunities and the Board of Wesfarmers has oversight of these risks and opportunities. Coles invests in renewable energy In a first for Coles in Western Australia, its new supermarket at Byford installed solar power to generate enough electricity for 50 average Australian homes. Powered by 770 solar panels, up to 20 per cent of the supermarket s annual energy use comes from the 1,260sqm of solar panels installed on the store s roof. Climate change strategy Climate change is incorporated into our broader sustainability strategy. The governance structure we have in place has been designed so that it is flexible enough to cater to the needs of our diverse conglomerate business model while remaining clear and practical. Given the diversity of our businesses and consequently the range of risks and opportunities posed by climate change, we believe this approach is more effective than a stand-alone Group strategy. Two degree scenario analysis To understand the longer term impacts to the Australian economy, including risks and opportunities for Wesfarmers, of limiting global warming to less than two degrees Celsius above pre-industrial levels, we have undertaken scenario analysis. Shadow carbon price Since 2014, we have put a shadow price on carbon to help reduce our carbon footprint cost effectively. Shadow pricing is a method of investment decision analysis that adds a hypothetical surcharge to market prices for goods that involve significant carbon emissions. Climate change risk management Our divisions respond to climate change in two ways. Firstly, we work to understand the specific risks created by climate change for our businesses and address those risks. Secondly, we actively monitor and manage our own greenhouse gas emissions and reduce them where possible. Once again this year we have tested the robustness of our businesses against climate change using CSIRO 2030 data in our annual risk process. Our annual risk review process confirmed existing operational, strategic and compliance risk controls are adequate for managing climate change risk in our businesses. We believe suitable action is being taken and we are making appropriate disclosures. Our annual risk review process has identified climate change as an emerging risk and our businesses are therefore taking steps to actively consider and monitor its potential impact on business operations, the community and the broader economy. The climate change risks we assess are physical, regulatory, reputational and competitive risks. 58

61 Overview Physical risks Our analysis has found that projected changes in sea level, storm surge intensity, temperature, precipitation and more frequent changes in extreme weather will exacerbate existing risks while also exposing our divisions to the following risks: energy infrastructure reliability food safety energy cost store openings infrastructure damage. To mitigate the effect of physical risks for our businesses, we are working to improve the efficiency of our electricity supply which reduces our overall emissions as well as demands on distribution networks. Some of our retail business units are working to include solar systems into new stores as standard and on existing stores where feasible and with landlord agreement. Most of our stores have detailed equipmentlevel energy consumption monitoring in place. Intelligent management systems go beyond the equipment level to optimise overall site operations, interfacing with preventive maintenance, proactive energy management and forward planning of energy efficiency opportunities. Strong business continuity plans are in place to ensure we can still transport and provide products to customers living in areas experiencing extreme weather events. We work to educate our customers about sustainable living choices to reduce their carbon footprint and provide them with products which can assist with adapting to climate change. Regulatory risks Our businesses test resilience against a climate change regulatory risk scenario where the governments of Australia and our trading partners implement regulation to limit global warming to 1.5 C 2 C above pre-industrial levels. We anticipate that there are a number of policy levers the Federal Government could use between now and 2030, which could have an impact on our businesses. By reducing our emissions as much as possible through employing innovative energy efficiency projects, staying abreast of any regulatory changes and incorporating a shadow carbon price into our capital expenditure decision-making, we believe our existing controls are adequate for managing regulatory risk. Australian first on LNG refuelling EVOL LNG successfully conducted Australia s first commercial liquid natural gas (LNG) refuelling (or bunkering as it is known in the industry) to supply a vessel near Dampier in Western Australia. This was followed by the first LNG bunkering at Fremantle Port in February. LNG is a cleaner fuel alternative to marine diesel, emitting less carbon dioxide and nitrogen oxides, almost zero sulphur oxides and fewer harmful particulates. Reputational risks In the context of more frequent severe weather events and shifting global attitudes, customers may have changing expectations of companies, including their operational efficiency, environmental transparency in their supply chain and product range. While this is difficult to quantify, by reducing emissions as much as possible through employing innovative energy efficiency initiatives and reporting on our progress to stakeholders, we believe our existing controls are adequate for managing reputational risk. Competitive risks Emerging business models that take advantage of climate change opportunities or are more resilient to climate change risks may become a threat. Such business models are considered in the context of our current business model and our businesses consider whether any competitive risk mitigation is required over the next 10 years. There is recognition that as our economy transitions to a low carbon economy as a result of climate change there will be opportunities for our businesses. The Group actively explores opportunities to support positive environmental outcomes. Managing our emissions The scale of the climate challenge is great but the IPCC highlights that the world has the means to address it. Our divisions are looking for ways to improve energy efficiency, reduce emissions across their operations and supply chains and invest in low-emissions and renewable technologies. This year, we emitted a total of 4,078 thousand tonnes of carbon dioxide equivalent (CO 2 e) in scope one and two emissions, which was 4.2 per cent higher than last year. This represents an improvement in emissions intensity of 16 per cent over the past five years. This year, the increase in our emissions was driven predominantly by an increase in mining activity in our Resources business where production was up 13.7 per cent on 2016 levels. Greenhouse gas emissions 4,078 tonnes CO 2 e: '000 THOUSAND TONNES CO 2 e (LHS) TONNES CO 2 e PER $M OF REVENUE (RHS) 5, ,078 4, ,915 3, ,012 2, ,047 1, , Operating and financial review Sustainability Governance Directors report Financial statements Signed reports Shareholder and ASX information


62 Sustainability Community contributions We make a positive contribution to the communities in which we operate. Reflecting the divisional autonomy of the Group, our approach to community engagement is driven and managed by our businesses to ensure value is created in ways that best fit with their operations and geographic spread. With businesses right across Australia, New Zealand, United Kingdom and Ireland, Wesfarmers has a local footprint in many communities. Many of our divisions have major, long-term partnerships at a national level, such as Coles' support of national cancer charity Redkite. This partnership achieved a significant milestone in 2017, with more than $20 million raised since the partnership started in In addition to these major partnerships, a significant part of our community investment is directed to smaller, notfor-profit organisations operating locally. For example, the Bunnings sausage sizzles and cake stalls enjoyed by many Bunnings customers every week are valuable fundraising opportunities for local community groups, where all of the funds raised go directly to the group conducting the fundraiser. Coles, Kmart and Target provide gift cards to community groups or facilitate the collection of customer donations for local fundraising initiatives. As a result of these locally-driven activities, there is a significant number of community programs supported across Australia, including environmental projects, education programs and mental health initiatives. For Wesfarmers Limited, the Board approves partnerships focused on four areas: medical research and health; Indigenous programs, particularly targeting education and employment outcomes; community and education initiatives; and the Wesfarmers Arts program. The majority of these partnerships are long-term commitments with West Australian-based organisations. Wesfarmers continues to support organisations in the medical research and health field, believing that investing in innovation now benefits future generations. Our support for community and education was strengthened with a new partnership with Teach For Australia. Wesfarmers is also committed to establishing community partnerships focused on Indigenous programs. In 2017, our contribution in this area increased in part due to the greater funding directed towards Clontarf Foundation to support its national expansion. Wesfarmers Arts Wesfarmers has supported the arts in Australia for more than three decades. Our engagement in the cultural life of the Western Australian and broader national community embraces our long-term support for a wide range of premier performing and visual arts organisations and the ongoing development of The Wesfarmers Collection of Australian Art. In 2017, the Wesfarmers Arts program continued to build on the contribution made by our arts partnerships and our art collection to the life of the company and our engagement with the community. Wesfarmers provided $3.1 million in support of the activities of 12 leading arts organisations. Wesfarmers Arts and WASO celebrate 20-year partnership In recognition of our long-term relationship we announced an expanded partnership with WASO which will focus on regional and international touring, as well as the development of WASO s extensive and award-winning education and community program. Our community contributions were $132m. This includes $73m in direct contributions and a further $59m from our customers and team members. 60


63 Overview Waste and water use We strive to reduce our waste to landfill and water use where possible. We are working to reduce our waste to landfill intensity rate and to divert as much as possible to recycling, both in our operations and for our customers. Water use is a material issue in our industrial businesses and our focus is on using water more efficiently, reducing our water use intensity rate and replacing scheme water with reclaimed or recycled water where possible. Recycling and waste This year, we increased our waste to landfill by six per cent to close to 160,000 tonnes and increased our waste recycled by six per cent to 373,000 tonnes. This was primarily due to an increase in our store network to include 255 Homebase and Bunnings stores in the United Kingdom and Ireland. In July 2017, Coles announced it would phase out single use plastic bags from all stores nationwide over the next year. More than 670 Coles supermarkets across Australia also donate surplus fresh food to SecondBite, an organisation redistributing food to community food programs, with a total of 23 million kilograms donated since the partnership began in late Reducing water use This year, the Group's water use increased slightly to close to 16,000 megalitres. Of this, 32 per cent is reclaimed and recycled water at the Curragh mine site. Water use by source 16,000 megalitres Product safety We are committed to providing consumers with safe products. All consumer products we supply must be safe and meet consumer guarantees under the consumer laws of the countries where we operate. We do not sell banned products and ensure that all our products comply with relevant mandatory standards before they are offered for sale. As well as safety testing and compliance with required standards, our divisions implement product recalls where possible safety issues arise. Operating and financial review Sustainability Municipal supply 57% Recycled and reclaimed 32% Ground water 11% Governance Directors report Officeworks Global Sourcing Merchandiser, Leah Coleman, visits a supplier's factory in China. Robust governance We maintain robust corporate governance policies in all our businesses. Financial statements Curragh reduces water use Since raw water saving initiatives were introduced in 2014, Curragh mine has cut back consumption by almost one-third. This means the team is exceeding its target of a five per cent annual reduction. Wesfarmers is committed to being transparent with all our stakeholders about our sustainability risks and opportunities. We measure and publish our performance for each of our material issues in our sustainability report. Our full sustainability report contains more than 45 case studies, detailed information about the individual performance of each of our businesses and data available for download. It is prepared in accordance with Global Reporting Initiative Standards and assured by Ernst & Young. It will be available in October 2017 at sustainability.wesfarmers.com.au 61 Signed reports Shareholder and ASX information
64 Governance Board of directors MICHAEL CHANEY AO Age 67 Chairman BSc, MBA, Hon. LLD W.Aust, FTSE Term: Chairman since November 2015; Director since June Skills and experience: After an early career in petroleum geology and corporate finance, Michael joined Wesfarmers in 1983 as Company Secretary and Administration Manager. He became Finance Director in 1984 and was appointed Managing Director in July He retired from that position in July Directorships of listed entities (last three years), other directorships/offices (current and recent): Chairman of Woodside Petroleum Limited (since July 2007) Chancellor of The University of Western Australia (since December 2005) Member of Commonwealth Science Council (since October 2014) Chairman of Gresham Partners Holdings Limited (retired May 2015) Chairman of National Australia Bank Limited (retired December 2015) Member of Prime Minister s Business Advisory Council (retired December 2015) RICHARD GOYDER AO Age 57 Managing Director BCom, FAICD Term: Director since July Skills and experience: Richard joined Wesfarmers in 1993 after working in various commercial roles at Tubemakers of Australia Limited. He was Managing Director of Wesfarmers Landmark Limited in 1999 until he became Finance Director of Wesfarmers Limited in 2002 and then Deputy Managing Director and Chief Financial Officer in Richard assumed the role of Managing Director and Chief Executive Officer in July Directorships of listed entities (last three years), other directorships/offices (current and recent): Director and Chairman-elect of Woodside Petroleum Limited (since August 2017) Director of Gresham Partners Holdings Limited (since July 2002) Director of the Business Council of Australia (since October 2009) Chairman of the Australian Football League Commission (Commissioner since November 2011, Chairman since April 2017) Chairman of JDRF Australia (director since March 2016, Chairman since June 2016) TERRY BOWEN Age 50 Finance Director (to 4 September 2017) BAcct, FCPA Term: Director appointed May 2009 resigned September Skills and experience: Terry held a number of finance positions with Tubemakers of Australia Limited. Terry joined Wesfarmers in 1996 and undertook various roles with Wesfarmers Landmark Limited, including Chief Financial Officer until He then became Chief Financial Officer for Jetstar Airways, prior to rejoining Wesfarmers as Managing Director, Wesfarmers Industrial and Safety in Terry became Finance Director, Coles in 2007 and Wesfarmers Finance Director in He resigned as Finance Director in September 2017, and will remain as the Group's Chief Financial Officer until 10 November Directorships of listed entities (last three years), other directorships/offices (current and recent): Director of Gresham Partners Group Limited (resigned August 2017) Director of Gresham Partners Holdings Limited (resigned August 2017) Chairman of the West Australian Opera Company Incorporated (since April 2014) Director of West Coast Eagles Board (since May 2017) President of the National Executive of the Group of 100 Inc (retired December 2013) JENNIFER WESTACOTT Age 57 BA (Honours), FAICD, FIPAA Term: Director since April Skills and experience: Jennifer is Chief Executive of the Business Council of Australia. Prior to that, she was a Board director and lead partner at KPMG. Jennifer has extensive experience in critical leadership positions in the New South Wales and Victorian governments. Directorships of listed entities (last three years), other directorships/offices (current and recent): Adjunct Professor at the City Futures Research Centre of the University of New South Wales Co-chair, Advisory Board, Australia Sino One Hundred Year Agricultural and Food Safety Partnership (since July 2015) Chair of the Mental Health Council of Australia (since January 2013) Co-chair of the Australia-Canada Economic Leadership Forum Organising Committee (since February 2016) Member of the Melbourne School of Government Advisory Board (since March 2016) Member of the Prime Minister s Expert Advisory Panel on the Reform of the Federation (concluded December 2015) Member of the Prime Minister s Cyber Security Review Panel (concluded April 2016) 62
 for more than 25 years.")
65 Overview VANESSA WALLACE Age 54 B.Comm (UNSW), MBA (IMD Switzerland), MAICD Term: Director since July Skills and experience: Vanessa is an experienced strategy management consultant who had been with Strategy& (formerly Booz & Company) for more than 25 years. She has deep expertise in the financial services sector across the spectrum of wealth management, retail banking and insurance, with particular functional depth in risk management, post-merger integration and capturing business opportunities associated with channels, customers and markets. Directorships of listed entities (last three years), other directorships/offices (current and recent): Director of SEEK Limited (since 1 March 2017) Director of AMP Limited (since March 2016) Chairman of AMP Capital Holdings Limited (director since March 2016, Chairman since August 2016) Executive Chairman of Strategy& (Japan) Inc. (retired June 2015) WAYNE OSBORN Age 66 Dip Elect Eng, MBA, FAICD, FTSE Term: Director since March Skills and experience: Wayne started working in the iron ore industry in the mid-1970s and joined Alcoa in He worked in various roles across the Australian business, including accountability for Alcoa s Asia Pacific operations, prior to being appointed Managing Director in 2001, retiring in Directorships of listed entities (last three years), other directorships/offices (current and recent): Director of South32 Limited (since May 2015) Director of Alinta Holdings (retired April 2017) Director of Iluka Resources Limited (retired May 2016) Chairman of the Australian Institute of Marine Science (retired December 2014) PAUL BASSAT Age 49 B.Comm, LL.B. (Melb) Term: Director since November Skills and experience: Paul started his career as a lawyer in He co-founded SEEK Limited in 1997, and served as Chief Executive Officer and then as joint Chief Executive Officer until He is a co-founder and director of Square Peg Capital Pty Ltd, a venture capital fund that invests in early stage and growth stage technology companies. He is also a director of the Peter MacCallum Cancer Foundation, Mt Scopus College Foundation and the P&S Bassat Foundation and is a member of Innovation and Science Australia. Directorships of listed entities (last three years), other directorships/offices (current and recent): Australian Football League Commissioner (since February 2012) Director of AFL Sportsready Pty Ltd (since August 2015) Operating and financial review Sustainability Governance Directors report TONY HOWARTH AO Age 65 CitWA, Hon.LLD (UWA), SF Fin, FAICD Term: Director since July Skills and experience: Tony has more than 30 years experience in the banking and finance industry. He was Chairman of Home Building Society Limited and Deputy Chairman of Bank of Queensland Limited. Tony has held several senior management positions during his career, including Managing Director of Challenge Bank Limited and Chief Executive Officer of Hartleys Limited. Directorships of listed entities (last three years), other directorships/offices (current and recent): Director of BWP Management Limited (since October 2012) Chairman of MMA Offshore Limited (director since July 2001, Chairman since August 2006) Chairman of St John of God Health Care Inc. (since January 2004) Chairman of the West Australian Rugby Union Inc.(since September 2015) Director of Alinta Holdings (since March 2011) Director Alinta Energy Limited (since September 2016) Chairman of International Chamber of Commerce, Australia Limited (retired March 2014) DIANE SMITH-GANDER Age 59 B.Ec, MBA, Hon.DEc W.Aust (UWA), FAICD, FGIA Term: Director since August Skills and experience: Diane has extensive experience in corporate governance and providing strategic advice to corporations in Australia and overseas. She was a partner with McKinsey & Company in the USA, became a senior adviser to McKinsey & Company in Australia in 2016 and has more than a decade of executive experience in the banking industry. Directorships of listed entities (last three years), other directorships/offices (current and recent): Director of AGL Energy Limited (since September 2016) Chairman of Broadspectrum Limited (formerly known as Transfield Services Limited) which delisted in June 2016 (director since October 2010, Chairman since October 2013, retired September 2016) Chair of Safe Work Australia (since February 2016) Trustee and director of CEDA Committee for Economic Development of Australia (trustee since September 2014, director since November 2015) Director of Keystart Home Loans (since July 2016) Board member of Henry Davis York (since July 2016) Chair of the Asbestos Safety and Eradication Council (since December 2016) JAMES GRAHAM AM Age 69 BE (Chem)(Hons)(Syd), MBA (UNSW), FIEAust, FTSE, FAICD, SF Fin Term: Director since May Skills and experience: James has had an active involvement in the growth of Wesfarmers since 1976 as Chairman and Managing Director of Gresham Partners Limited, and previously as Managing Director of Rothschild Australia Limited. James was also previously Chairman of Rabobank Australia Limited, Chairman of the Darling Harbour Authority and a director of Hill Samuel Australia Limited. Directorships of listed entities (last three years), other directorships/offices (current and recent): Chairman of the Advisory Council of the Institute for Neuroscience and Muscle Research (since 1999) Director of Wesfarmers General Insurance Limited (resigned June 2014) 63 Financial statements Signed reports Shareholder and ASX information
66 Governance Corporate Governance Overview The Board of Wesfarmers Limited is committed to providing a satisfactory return to its shareholders and fulfilling its corporate governance obligations and responsibilities in the best interests of the company and its stakeholders. This statement details the key aspects of the governance framework and practices of Wesfarmers. Wesfarmers regularly reviews its governance framework and practices so as to ensure it consistently reflects market practice and stakeholder expectations. Set out below is an overview of selected aspects of Wesfarmers corporate governance framework and key focus areas of the Board and its committees in A copy of Wesfarmers full 2017 Corporate Governance Statement, which provides detailed information about governance, and a copy of Wesfarmers Appendix 4G which sets out the company s compliance with the recommendations in the third edition of the ASX Corporate Governance Council s Principles and Recommendations (ASX Principles) is available on the corporate governance section of the company s website at The Board believes that the governance policies and practices adopted by Wesfarmers during 2017 are in accordance with the recommendations contained in the ASX Principles. Roles and responsibilities of the Board and management The role of the Board is to approve the strategic direction of the Group, guide and monitor the management of Wesfarmers and its businesses in achieving its strategic plans and oversee good governance practice. The Board aims to protect and enhance the interests of its shareholders, while taking into account the interests of other stakeholders, including employees, customers, suppliers and the wider community. In performing its role, the Board is committed to a high standard of corporate governance practice and fostering a culture of compliance which values ethical behaviour, personal and corporate integrity, accountability and respect for others. The Wesfarmers Group Managing Director has responsibility for the day-to-day management of Wesfarmers and its businesses, and is supported in this function by the Wesfarmers Leadership Team. Details of the members of the Wesfarmers Leadership Team are set out under the Wesfarmers Leadership Team profiles in the corporate governance section of the company s website ( The Board maintains ultimate responsibility for strategy and control of Wesfarmers and its businesses. In fulfilling its roles and responsibilities, some key focus areas for the Board during the 2017 financial year are set out below. Key focus areas of the Board during the 2017 financial year included: Overseeing Group Managing Director succession planning, resulting in the appointment in February 2017 of Mr Rob Scott as the Group s Deputy Chief Executive Officer, to succeed the current Group Managing Director, Mr Richard Goyder, at the conclusion of the 2017 Annual General Meeting Approving leadership appointments, including Mr Anthony Gianotti who became the Group s Deputy Chief Financial Officer in July 2017 and will succeed the current Chief Financial Officer, Mr Terry Bowen, on 10 November 2017, and senior management changes Overseeing management s performance in strategy implementation Monitoring the Group s operating and cash flow performance, financial position and key metrics, including financial covenants and credit ratings Reviewing business operations and development plans of each division likely to impact long-term shareholder value creation through portfolio management and consideration of divestment options Monitoring the Group s safety performance and overseeing implementation of strategies to improve safety performance and enhance workplace safety awareness Reviewing talent management and development Monitoring and evaluating growth opportunities to complement the existing portfolio Approving revisions to the Board and committee charters Reviewing policies, reporting and processes to improve the Group s system of corporate governance Structure and composition of the Board Wesfarmers is committed to ensuring that the composition of the Board continues to include directors who bring an appropriate mix of skills, experience, expertise and diversity (including gender diversity) to Board decision-making. The Board currently comprises nine directors, including eight non-executive directors. Detailed biographies of the directors as at 30 June 2017 are set out on pages 62 and 63 of this annual report. The current directors possess an appropriate mix of skills, experience, expertise and diversity to enable the Board to discharge its responsibilities and deliver the company s strategic priorities 64
67 Corporate Governance Overview Overview as a diversified corporation with current businesses operating in supermarkets, liquor, hotels and convenience stores; home improvement; department stores; office supplies; and an Industrials division with businesses in chemicals, energy and fertilisers, industrial and safety products, and coal. On 14 February 2017 Wesfarmers announced that Mr Richard Goyder will retire from the Board and his role as Group Managing Director at the end of the 2017 Annual General Meeting after serving as a director for more than 15 years. Mr Rob Scott was appointed as Wesfarmers' Deputy Chief Executive Officer in February 2017 and will join the Board as Group Managing Director at the conclusion of the 2017 Annual General Meeting. Operating and financial review On 4 September 2017 Wesfarmers announced that Mr Terry Bowen resigned from the Board after serving as a director for eight years. Mr Bowen will remain as Wesfarmers Chief Financial Officer until 10 November The Board skills matrix set out below describes the combined skills, experience and expertise presently represented on the Board. Skills, experience and expertise CEO level experience Capital markets Sustainability ASX-listed company experience Finance and banking Strategy and risk management E-commerce and digital Governance Human resources and executive remuneration Financial acumen Marketing/customers/retail Regulatory and government policy Resources and industrial International experience Corporate sustainability Governance To the extent that any skills are not directly represented on the Board, they are augmented through management and external advisors. Mr Archie Norman, who has significant retail experience, was appointed in 2009 as an advisor to the Board on retail issues. In this role, Mr Norman attends Wesfarmers Board meetings as required and is a director of the Coles and Target boards. Mr Norman is also an advisor to the Bunnings UK & Ireland business. Director independence Directors are expected to bring views and judgement to Board deliberations that are independent of management and free of any business or other relationship or circumstance that could materially interfere with the exercise of objective, unfettered or independent judgement, having regard to the best interests of the company as a whole. The Board s assessment of independence and the criteria against which it determines the materiality of any facts, information or circumstances is formed by having regard to the ASX Principles, in particular, the factors relevant to assessing the independence of a director set out in recommendation 2.3; the materiality guidelines applied in accordance with Australian Accounting Standards; any independent professional advice sought by the Board at its discretion; and developments in international corporate governance standards. The Board has reviewed the position and relationships of all directors in office as at the date of this report and considers that: Seven of the eight non-executive directors are independent. The Chairman is independent. Mr James Graham is not independent, by virtue of his position as Chairman of Gresham Partners Limited (Gresham), which acts as an investment advisor to the company. Details of Mr Graham s association with Gresham are set out in note 25 on pages 134 and 135 of this annual report. Committees of the Board The Board has established a Nomination Committee, a Remuneration Committee, an Audit and Risk Committee, and a Gresham Mandate Review Committee as standing committees to assist with the discharge of its responsibilities. Details of the current membership and composition of each committee are set out in the 2017 Corporate Governance Statement. Directors report Financial statements Signed reports Role of the Nomination Committee As part of the Nomination Committee s oversight of Board succession planning, it is responsible for identifying suitable candidates to fill Board vacancies as and when they arise, or to identify candidates to complement the existing Board, and make recommendations to the Board on their appointment. Where appropriate, external consultants are engaged to assist in searching for candidates. The Nomination Committee is responsible for scheduling formal performance reviews of the Board and its committees at least every two years. The Board then undertakes an evaluation process to review its performance which is facilitated by an external consultant. More details about Wesfarmers review process for both the Board and its committees is set out in the 2017 Corporate Governance Statement. 65 Shareholder and ASX information
68 Governance Corporate Governance Overview Key focus areas of the Nomination Committee during the 2017 financial year included: Succession planning for the Group Managing Director Consideration of directors to be recommended to shareholders for re-election at the 2016 Annual General Meeting Consideration of feedback from major shareholders during the Chairman s Roadshow conducted prior to the 2016 Annual General Meeting Role of the Remuneration Committee The role of the Remuneration Committee is to review and make recommendations to the Board in relation to overall remuneration policy. Full details of the remuneration paid to non-executive and executive directors, and senior executives are set out in the remuneration report on pages 73 to 92 of this annual report. Senior executives comprising members of the Wesfarmers Leadership Team have a variable or at risk component as part of their total remuneration package either under an annual incentive and long-term incentive arrangement or under the Key Executive Equity Performance Plan (KEEPP). The mix of remuneration components and the performance measures used in the incentive plans have been chosen to ensure that there is a strong link between remuneration earned and the achievement of the Group s strategy and business objectives and, ultimately, generating satisfactory returns for shareholders. Annual performance reviews of each member of the Wesfarmers Leadership Team, including the executive directors, for the 2017 financial year have been undertaken. More details about Wesfarmers performance and development review process for senior executives is set out in the 2017 Corporate Governance Statement. Key focus areas of the Remuneration Committee during the 2017 financial year included: Reviewing and making a recommendation to the Board in relation to the fixed remuneration, annual incentive and long-term incentive awards for the Group Managing Director and his direct reports Reviewing the succession and transition plans for the Wesfarmers Leadership Team, including recommending to the Board the remuneration package and contractual arrangements for the incoming Group Managing Director and Group Chief Financial Officer Reviewing the senior executive remuneration framework and policies, including terms of employment such as notice periods, restraint and non-solicitation clauses Reviewing and making a recommendation to the Board in relation to the structure of the Wesfarmers variable remuneration plans, including the approval and implementation of KEEPP and recommending to the Board the vesting outcomes of the 2013 Wesfarmers Long Term Incentive Plan shares, based on the achievement of the performance conditions as at 30 June 2017 Reviewing and making a recommendation to the Board in relation to non-executive director fees Reviewing and monitoring diversity targets and gender pay equity Role of Audit and Risk Committee Wesfarmers is committed to the identification, monitoring and management of material risks associated with its business activities across the Group. The Board recognises that a sound culture is fundamental to an effective risk management framework. Wesfarmers promotes a culture which values the principles of honesty, integrity, fairness and accountability, and these values are reflected in the Group Code of Conduct. The Audit and Risk Committee monitors internal control policies and procedures designed to safeguard Group assets and to maintain the integrity of financial reporting. Key focus areas of the Audit and Risk Committee during the 2017 financial year included: Reviewing and assessing the Group s processes which ensure the integrity of financial statements and reporting, and associated compliance with accounting, legal and regulatory requirements Reviewing the processes and controls around the recognition of commercial income by the retail divisions to ensure recognition is in accordance with Accounting Standards and accepted industry practice Monitoring the ethical sourcing of products for resale through the Group s retail networks to ensure that there are appropriate safeguards and processes in place Monitoring the Group s cyber security framework, including data protection management, and the reporting structure and escalation process on information security risks Reviewing and evaluating the adequacy of the Group s insurance arrangements to ensure appropriate cover for identified operational and business risks Monitoring the retail shrinkage control measures and reporting procedures in the Group s divisions Monitoring the Group s tax compliance program both in Australia and overseas, including cross-border intra-group transactions, to ensure its obligations are met in the jurisdictions in which the Group operates. 66
69 Corporate Governance Overview Overview Role of the external auditor The company s external auditor is Ernst & Young. The effectiveness, performance and independence of the external auditor is reviewed annually by the Audit and Risk Committee. Mr Darren Lewsen is the lead partner for Ernst & Young and was appointed on 1 July Ernst & Young provided the required independence declaration to the Board for the financial year ended 30 June The independence declaration forms part of the directors report and is provided on page 72 of this annual report. Risk Management Framework The Risk Management Framework of Wesfarmers is reviewed by the Board on an annual basis and was approved in May This framework details the overarching risk management controls that are embedded in the Group s risk management processes, procedures and reporting systems, and the division of the key risk management functions between the Board, Wesfarmers Managing Director and Finance Director, Audit and Risk Committee, divisional management and Group Assurance and Risk, including: the Group Code of Conduct; established Group and divisional structures, reporting lines and, appropriate authorities and responsibilities, including guidelines and limits for approval of all expenditure, including capital expenditure and investments, and contractual commitments; Operating Cycle and Divisional Reporting Requirements documents that clearly set out the Board, Board committees and divisional board activities and reports; a formal director induction program and a directors program of annual site visits to Wesfarmers operations to enhance the Board s understanding of key and emerging business risks; a formal corporate planning process which requires each division to assess trends that are likely to affect and shape their industry, perform scenario planning and prepare a SWOT analysis; Group policies and procedures for the management of financial risk and treasury operations, such as exposures to foreign currencies and movements in interest rates; a Group compliance reporting program supported by approved guidelines and standards covering safety; information technology; the environment; legal liability; taxation compliance; risk identification, quantification and reporting; and financial reporting controls; a comprehensive risk financing program, including risk transfer to external insurers and reinsurers; annual budgeting and monthly reporting systems for all businesses which enable the monitoring of progress against performance targets and the evaluation of trends; appropriate due diligence procedures for acquisitions and divestments; crisis management systems for all key businesses in the Group; and external and internal assurance programs. Operating and financial review Sustainability Governance Directors report Investor engagement Wesfarmers recognises the importance of providing its shareholders and the broader investment community with facilities to access up-to-date high quality information, participate in shareholder decisions of the company and provide avenues for two-way communication between the company, the Board and shareholders. Wesfarmers has developed a program on investor engagement for engaging with shareholders, debt investors, the media and the broader investment community. In addition, the company s shareholders have the ability to elect to receive communications and other shareholder information electronically. Governance policies The corporate governance section of the company s website ( contains access to all relevant corporate governance information, including Board and committee charters, and Group policies referred to in the 2017 Corporate Governance Statement. Financial statements Ethical and responsible behaviour Wesfarmers primary objective is to deliver satisfactory returns to shareholders through financial discipline and exceptional management of a diversified portfolio of businesses. The Wesfarmers Way is the framework for the company s business model and comprises our core values of integrity, openness, accountability and boldness. The Wesfarmers Way, together with the Code of Conduct and other policies, guide the behaviour of everyone who works at Wesfarmers as we strive to achieve our primary objective. Signed reports Diversity As a diverse workforce is of significant social and commercial value, Wesfarmers recognises the importance of being an inclusive employer. Wesfarmers strives to create a work environment which is inclusive of all people regardless of gender, age, race, disability, sexual orientation, cultural background, religion, family responsibilities or any other areas of potential difference. All areas of diversity are important and Wesfarmers pays particular attention to gender diversity and the inclusiveness of Indigenous people. Further details on diversity are set out on page 56 of this annual report and in the 2017 Corporate Governance Statement on the company s website at 67 Shareholder and ASX information
70 Directors' report Directors' report Wesfarmers Limited and its controlled entities The information appearing on pages 4 to 67 forms part of the directors report for the financial year ended 30 June 2017 and is to be read in conjunction with the following information: Results and dividends $m $m Year ended 30 June Profit Profit attributable to members of the parent entity 2, Dividends The following dividends have been paid by the company or declared by the directors since the commencement of the financial year ended 30 June 2017: (a) out of the profits for the year ended 30 June 2016 and retained earnings on the fully-paid ordinary shares: (i) fully-franked final dividend of 95 cents (2015: 111 cents) per share paid on 5 October 2016 (as disclosed in last year s directors report) 1,070 1,247 (b) out of the profits for the year ended 30 June 2017 on the fully-paid ordinary shares: (i) fully-franked interim dividend of 103 cents (2016: 91 cents) per share paid on 28 March ,165 1,025 (ii) fully-franked final dividend of 120 cents (2016: 95 cents) per share to be paid on 28 September ,361 1,070 Principal activities The principal activities of entities within the consolidated Group during the year were: retailing operations including supermarkets, general merchandise and specialty department stores; fuel, liquor and convenience outlets; retailing of home improvement and outdoor living products and supply of building materials; retailing of office and technology products; coal mining and production; gas processing and distribution; industrial and safety product distribution; chemicals and fertilisers manufacture; and investments. Directors The directors in office at the date of this report are: M A Chaney (Chairman) R J B Goyder (Group Managing Director) P M Bassat J P Graham A J Howarth W G Osborn D L Smith-Gander V M Wallace J A Westacott All directors served on the Board for the period from 1 July 2016 to 30 June T J Bowen resigned as Finance Director on 4 September Mr Bowen will remain as Chief Financial Officer until 10 November The qualifications, experience, special responsibilities and other details of the directors in office during the financial year or as at the date of this report appear on pages 62 and 63 of this annual report. 68
71 Directors' report Wesfarmers Limited and its controlled entities Overview Directors shareholdings Securities in the company or in a related body corporate in which directors had a relevant interest as at the date of this report are: BWP TRUST WESFARMERS LIMITED Units Performance Rights Shares P M Bassat 19,411 M A Chaney 87,597 R J B Goyder* 247, ,150 J P Graham 15, ,483 A J Howarth 20,000 17,848 W G Osborn 8,481 D L Smith-Gander 12,045 V M Wallace 13,483 J A Westacott 5,493 * R J B Goyder holds 247,928 performance rights allocated under the 2014 Wesfarmers Long Term Incentive Plan (WLTIP), 2015 and 2016 WLTIP. The 79,186 performance rights issued under the 2014 WLTIP are subject to a four-year performance period, being 1 July 2014 to 30 June The 87,220 performance rights issued under the 2015 WLTIP are subject to a four-year performance period, being 1 July 2015 to 30 June The 81,522 performance rights issued under the 2016 WLTIP performance rights are subject to a four-year performance period, being 1 July 2016 to 30 June For the 2014 and 2015 WLTIP performance rights, if the relative total shareholder return and compound annual growth rate in return on equity performance conditions are met, executives will be allocated Wesfarmers fully-paid ordinary shares at the end of the performance period. For the 2016 WLTIP performance rights, if the relative total shareholder return performance conditions are met, executives will be allocated Wesfarmers fully-paid ordinary shares at the end of the performance period. For further details, please see the remuneration report on pages 73 to 92 of this annual report. T J Bowen resigned as Finance Director on 4 September He will remain as Chief Financial Officer until 10 November At 4 September 2017, Mr Bowen had a relevant interest in 184,172 shares and 217,079 performance rights in Wesfarmers Limited. He had no relevant interests in BWP Trust units as at his resignation date. Operating and financial review Sustainability Governance Directors meetings The following table sets out the number of directors meetings (including meetings of Board committees) held during the year ended 30 June 2017 and the number of meetings attended by each director: Board Audit and Risk Committee Remuneration Committee Nomination Committee Gresham Mandate Review Committee (A) 1 (B) 2 (A) (B) (A) (B) (A) (B) (A) (B) P M Bassat T J Bowen M A Chaney R J B Goyder J P Graham A J Howarth W G Osborn D L Smith-Gander V M Wallace J A Westacott (A) = number of meetings held while the director was a member of the Board/Committee. 2 (B) = number of meetings attended. 3 Notwithstanding he is not a member, M A Chaney attended the majority of the meetings of the Audit and Risk Committee held during the year. Directors report Financial statements Signed reports 69 Shareholder and ASX information
72 Directors' report Directors' report Wesfarmers Limited and its controlled entities Insurance and indemnification of directors and officers During or since the end of the financial year, the company has paid premiums in respect of a contract insuring all directors and officers of Wesfarmers Limited and its related entities against certain liabilities incurred in that capacity. Disclosure of the nature of the liability covered by the insurance and premiums paid is subject to confidentiality requirements under the contract of insurance. In accordance with the company s constitution, the company has entered into Deeds of Indemnity, Insurance and Access with each of the directors of the company. These Deeds: indemnify a director to the full extent permitted by law against any liability incurred by the director: as an officer of the company or of a related body corporate; and to a person other than the company or a related body corporate, unless the liability arises out of conduct on the part of the director which involves a lack of good faith; provide for insurance against certain liabilities incurred as a director; and provide a director with continuing access, while in office and for a specific period after the director ceases to be a director, to certain company documents which relate to the director s period in office. In addition, the company s constitution provides for the indemnity of officers of the company or its related bodies corporate from liability incurred by a person in that capacity. No indemnity payment has been made under any of the documents referred to above during or since the end of the financial year. Indemnification of auditors The company s auditor is Ernst & Young. The company has agreed with Ernst & Young, as part of its terms of engagement, to indemnify Ernst & Young against certain liabilities to third parties arising from the audit engagement. The indemnity does not extend to any liability resulting from a negligent, wrongful or wilful act or omission by Ernst & Young. During the financial year: the company has not paid any premium in respect to any insurance for Ernst & Young or a body corporate related to Ernst & Young; and there were no officers of the company who were former partners or directors of Ernst & Young, whilst Ernst & Young conducted audits of the company. Directors and other officers remuneration Discussion of the Board s policy for determining the nature and amount of remuneration for directors and senior executives and the relationship between such policy and company performance are contained in the remuneration report on pages 73 to 92 of this annual report. Options No options over unissued shares in the company were in existence at the beginning of the financial year or granted during, or since the end of the financial year. Company Secretary Linda Kenyon was appointed as Company Secretary of Wesfarmers Limited in April Linda holds Bachelor of Laws and Bachelor of Jurisprudence degrees from The University of Western Australia and is a Fellow of the Governance Institute of Australia (formerly the Chartered Secretaries Australia). She joined Wesfarmers in 1987 as legal counsel and held that position until 2000 when she was appointed Manager of BWP Management Limited (formerly Bunnings Property Management Limited), the responsible entity for the listed BWP Trust (formerly Bunnings Warehouse Property Trust). Linda is also Company Secretary of a number of Wesfarmers Group subsidiaries, and a member of the Wesfarmers Executive Leadership Team. 70
73 Directors' report Wesfarmers Limited and its controlled entities Overview Significant changes in the state of affairs Particulars of the significant changes in the state of affairs of the consolidated entity during the financial year are as follows: revenue from ordinary activities up from $65,981 million to $68,444 million profit for the year up from $407 million (including impairment of Target and Curragh of $1,844 million net of tax) to $2,873 million dividends per share of $2.23 (2016: $1.86 per share) total assets down from $40,783 million to $40,115 million shareholders equity up from $22,949 million to $23,941 million net debt down from $7,103 million to $4,809 million net cash flows from operating activities up from $3,365 million to $4,226 million Review of results and operations The operations, financial position, business strategies and prospects for future financial years of the consolidated entity are detailed in the operating and financial review on pages 12 to 52 of this report. Operating and financial review Sustainability Events after the reporting period The following significant events have arisen since the end of the financial year: Dividend On 17 August 2017, a fully-franked final dividend of 120 cents per share resulting in a total dividend of $1,361 million was declared for a payment date of 28 September This dividend has not been provided for in the 30 June 2017 full-year financial statements. Kmart brand name acquisition Governance In August 2017, Kmart acquired the Kmart brand name in Australia and New Zealand, which was previously used by the business under a long-term licence agreement, for $100 million. The transaction is not expected to have a material impact on Kmart s earnings. Non-audit services Ernst & Young provided non-audit services to the consolidated entity during the year ended 30 June 2017 and received, or is due to receive, the following amounts for the provision of these services: Directors report $ 000 Tax compliance 1,088 Other 1,219 Total 2,307 The total non-audit services fees of $2,307 thousand represents 23.1 per cent of the total fees paid or payable to Ernst & Young and related practices for the year ended 30 June Total non-audit services fees and assurance-related services fees was $3,579 thousand representing 35.8 per cent of the total fees paid or payable to Ernst & Young and related practices for the year ended 30 June Financial statements The Audit and Risk Committee has, following the passing of a resolution of the Committee, provided the Board with written advice in relation to the provision of non-audit services by Ernst & Young. The Board has considered the Audit and Risk Committee s advice, and the non-audit services provided by Ernst & Young, and is satisfied that the provision of these services during the year by the auditor is compatible with, and did not compromise, the general standard of auditor independence imposed by the Corporations Act 2001 for the following reasons: the non-audit services provided do not involve reviewing or auditing the auditor s own work or acting in a management or decision-making capacity for the company; Signed reports all non-audit services were subject to the corporate governance procedures and policies adopted by the company and have been reviewed by the Audit and Risk Committee to ensure they do not affect the integrity and objectivity of the auditor; and there is no reason to question the veracity of the auditor s independence declaration (a copy of which has been reproduced on the following page). 71 Shareholder and ASX information
74 Directors' report Directors' report Wesfarmers Limited and its controlled entities The directors received the following declaration from Ernst & Young: Ernst & Young 11 Mounts Bay Road Perth WA 6000 Australia GPO Box M939 Perth WA 6843 Tel: Fax: ey.com/au Auditor s Independence Declaration to the Directors of Wesfarmers Limited As lead auditor for the audit of Wesfarmers Limited for the financial year ended 30 June 2017, I declare to the best of my knowledge and belief, there have been: a) no contraventions of the auditor independence requirements of the Corporations Act 2001 in relation to the audit; and b) no contraventions of any applicable code of professional conduct in relation to the audit. This declaration is in respect of Wesfarmers Limited and the entities it controlled during the financial year. Ernst & Young D S Lewsen Partner 19 September 2017 A member firm of Ernst & Young Global Limited Liability limited by a scheme approved under Professional Standards Legislation Environmental regulation and performance The activities of the consolidated entity are subject to environmental regulation by various authorities throughout Australia and the other countries in which the Group operates. Licences granted to the consolidated entity regulate the management of air and water quality and quantity, the storage and carriage of hazardous materials, the disposal of wastes and other environmental matters associated with the consolidated entity s operations. During the year there have been no known material breaches of the consolidated entity s licence conditions. Proceedings on behalf of the company No proceedings have been brought on behalf of the company, nor have any applications been made in respect of the company under section 237 of the Corporations Act Corporate governance In recognising the need for high standards of corporate behaviour and accountability, the directors of Wesfarmers Limited support and have followed the third edition of the ASX Corporate Governance Council s Corporate Governance Principles and Recommendations. An overview of the company s corporate governance statement can be found on pages 64 to 67 of this annual report. The full corporate governance statement is available on the Corporate Governance section of the company s website at Corporate information Wesfarmers Limited is a company limited by shares that is incorporated and domiciled in Australia. The company s registered office and principal place of business is Level 14, Brookfield Place Tower 2, 123 St Georges Terrace, Perth, Western Australia. Rounding The amounts contained in this report and in the financial statements have been rounded to the nearest million dollars unless otherwise stated (where rounding is applicable) under the option available to the company under ASIC Corporations (Rounding in Financial/Directors Reports) Instrument 2016/191. The company is an entity to which the instrument applies. 72
75 Remuneration report 2017 (audited) Overview Contents Executive remuneration Section 1: Introduction 73 Section 2: Executive KMP and remuneration frameworks 75 Section 3: Outcomes 78 Non-executive director remuneration Section 4: Framework and outcomes 88 Other remuneration information Section 5: Remuneration governance 90 Section 6: Further information on remuneration 92 Operating and financial review Executive remuneration 1. Introduction a year of transition The 2017 f inancial year has been one of transition for the Wesfarmers Group. Key management personnel (KMP) changes Having led the Wesfarmers Group for more than 12 years as the Group's Managing Director, Richard Goyder will be retiring at the conclusion of the 2017 Annual General Meeting (AGM). Demonstrating our strong commitment to developing talent internally, Rob Scott was appointed Deputy Chief Executive Off icer in February 2017 to allow for a smooth transition of leadership responsibilities and will be appointed Group Managing Director upon Mr Goyder's retirement. In May 2017, Wesfarmers announced three senior executive appointments as part of the Group s leadership transition. At a Group level, Anthony Gianotti will be the next Group Chief F inancial Off icer, succeeding Terry Bowen, who stepped down as Finance Director in September 2017 after eight years in the role and 12 years on the Wesfarmers Leadership Team. At a divisional level, David Baxby was appointed Managing Director, Wesfarmers Industrials, effective August 2017, succeeding Mr Scott. Michael Schneider, previously Managing Director, Bunnings Australia and New Zealand, was promoted to Managing Director, Bunnings Group, replacing John Gillam who stepped down from the role in December Key Executive Equity Performance Plan (KEEPP) The Wesfarmers board is committed to an executive remuneration framework that is focused on driving a performance culture to reflect the diversif ied portfolio of businesses. It seeks to link executive pay to the achievement of the Group s strategy and business objectives and, ultimately, to generate satisfactory returns to shareholders. After an extensive review of the effectiveness and appropriateness of our reward and retention framework for the Group s operating model and the circumstances of our divisions, engagement with key stakeholders both internally and externally, and a review of the overarching principles on which our remuneration is based, the Board has made a major change to our reward framework. There are two primary objectives of the new structure: f irstly to reflect our operating model - each of the divisions has a strong and autonomous management capability that is accountable for strategy execution, as well as day-to-day operational performance; and secondly to reward our executives for achieving the objectives for which they are accountable and responsible. We seek to provide very strong alignment to the interests of the Group and its shareholders by delivering the major part of that reward in Wesfarmers shares that are held for the long term. Key design principles of the KEEPP are: To provide focus on the long term with each KEEPP cycle operating over seven years. Annual awards under the plan are determined with respect to performance against a scorecard that comprises f inancial and strategic metrics relevant to the role of each participant. For the divisional managing directors these comprise divisional f inancial and divisional strategic measures. The award is delivered primarily in shares as detailed below, with a cash component which is lower than under our legacy incentive schemes and will reduce over time. The shares comprise 50 per cent Restricted Shares and 50 per cent Performance Shares. The total award granted for at target performance is 200 per cent of f ixed annual remuneration (FAR) and the maximum award is 300 per cent of FAR. The Full KEEPP Cycle: YEAR 1 Annual KEEPP scorecard agreed (e.g., in the 2017 f inancial year) YEAR 2 Outcome against KEEPP scorecard calculated following the end of Year 1 YEARS 2 TO 7 Remainder of KEEPP cycle Cash 1 KEEPP scorecard Restricted Shares Shares not completely released until the end of full KEEPP cycle Performance Shares Hurdles set for Years 2 to 5, measured at the end of Year 5 Sustainability Governance Directors report Financial statements Signed reports 1 There was no cash component for the 2016 KEEPP allocation as the 2016 annual incentives were tested, as reported in the 2016 remuneration report. 73 Shareholder and ASX information
76 Directors' report Remuneration report 2017 (audited) The cash and shares awarded under the KEEPP have the following features: The maximum cash component is lower under the KEEPP than under the legacy annual incentive and is only paid when performance against the scorecard generates a total award of more than 100 per cent of FAR. In the 2017 f inancial year, a maximum of 22.5 per cent of the divisional managing directors at target award may be paid in cash. The maximum cash component for these participants will reduce over the next four KEEPP cycles. One half of the award (after reduction for the cash component) is provided in the form of Restricted Shares, with half (50 per cent) of these shares restricted for f ive years and half (50 per cent) restricted for six years. These time periods have been chosen to align the ultimate value of this part of the award with the long-term experience of our shareholders. The shares are subject to forfeiture conditions if the participant resigns within a set period of time following allocation, resigns to join a competitor or is dismissed for circumstances such as cause or signif icant underperformance. Otherwise they will remain in the plan for the balance of the full restriction period even if employment ceases. The other half of the award is provided as Performance Shares that are subject to a four-year performance period with performance measures relevant to the role of the participant. The Performance Shares will forfeit if the participant resigns during the performance period, subject to Board discretion. During the 2017 f inancial year, our divisional managing directors transitioned from our legacy incentive schemes into the KEEPP. Our divisional managing directors are the leaders of our four main operating divisions (Managing Director, Coles; Managing Director, Bunnings Group; Managing Director, Wesfarmers Industrials; and Chief Executive Off icer, Department Stores). Due to the timing of Mr Gillam stepping into an advisory role, neither Mr Gillam nor Mr Schneider participated in the 2016 KEEPP. Mr Schneider will participate in the 2017 KEEPP. KEEPP for the incoming Group Managing Director and the incoming Group Chief F inancial Off icer The incoming Group Managing Director and the incoming Group Chief F inancial Off icer will participate in the 2017 KEEPP. Following the end of the 2017 f inancial year it was determined that the performance conditions to apply to the Performance Shares allocated to the incoming Group Managing Director and the incoming Group Chief F inancial Off icer under the 2017 KEEPP will be relative total shareholder return against the ASX100 (50 per cent weighting), absolute return on equity (20 per cent weighting) and strategic measures (30 per cent weighting). The performance period will be four years, measured from 1 July 2017 until 30 June The conditions applicable for the Restricted Shares will be as per other KEEPP participants. The annual KEEPP scorecards for the incoming Group Managing Director and the incoming Group Chief F inancial Off icer will comprise f inancial (Group NPAT and Group ROE) and strategic measures. As a transitional arrangement, up to 10 per cent of the total 'at target' opportunity can be paid in cash for the 2018 f inancial year outcomes. This is a third of the amount that would have been paid in cash in a year 'at target' to the outgoing Group Managing Director and the outgoing Group Chief F inancial Off icer under the legacy annual incentive and long-term incentive arrangements. By the end of year three of the KEEPP, the incoming Group Managing Director and the incoming Group Chief F inancial Off icer will not receive any annual cash amount under the KEEPP. Further details on the terms of the KEEPP and on how the KEEPP has been applied for this f inancial year are set out in section 3.5 of this remuneration report Summary F ixed remuneration The FAR of our Group Managing Director, Mr Goyder, was not increased this year and has not changed since October The Board, upon recommendation from the Remuneration Committee, has continued to exercise restraint in relation to FAR increases. In the October 2016 remuneration review, the salaries of the Executive Leadership Team increased on average by 2.9 per cent. In February 2017, Mr Scott s FAR increased to $2,000,000 per annum on his appointment as Deputy Chief Executive Off icer in recognition of his greater workload as he transitions to the Group Managing Director at the conclusion of the 2017 AGM. Reward arrangements that applied this year As this is a year of transition, our remuneration report is slightly more complex than in recent years. In summary, we had three categories of executive remuneration in place this year: The divisional managing directors transitioned to the KEEPP, replacing both the annual incentive plan and the Wesfarmers Long Term Incentive Plan (WLTIP). They received their initial 2016 KEEPP allocation in Restricted Shares and Performance Shares only. Following the end of the 2017 f inancial year, their 2017 KEEPP allocation (comprising cash, Restricted Shares and Performance Shares) has been determined using their performance against their 2017 KEEPP scorecard. Given the already signif icant tenure of the Group Managing Director and the Group Chief F inancial Off icer, both participated in the legacy annual incentive plan and received a f inal grant under the WLTIP in the 2017 f inancial year. Mr Scott (as the incoming Group Managing Director) and Mr Gianotti (as the incoming Group Chief F inancial Off icer) will participate in the 2017 KEEPP. Mr Schneider was designated a KMP during the year (following Mr Gillam stepping into an advisory role) and participated in the legacy annual incentive plan during the 2017 f inancial year. He will participate in the 2017 KEEPP. Incentive outcomes Annual incentive For the 2017 f inancial year, the Board, upon recommendation from the Remuneration Committee, increased the weighting of the f inancial performance targets under the annual incentive for the Group Managing Director from 60:40 f inancial/strategic to 70:30 and for the Group Chief F inancial Off icer from 50:50 f inancial/strategic to 70:30. Mr Goyder, Mr Bowen and Mr Schneider received greater than target awards under the annual incentive plan for the 2017 f inancial year due to strong Group results and, for Mr Schneider specif ically, due to strong results for Bunnings Australia and New Zealand. 74
77 Remuneration report 2017 (audited) Overview WLTIP (2013) The 2013 WLTIP grant was available to vest this year. Following testing of the relative TSR and relative ROE performance measures (explained further in section 3.4), 56.7 per cent of the 2013 WLTIP grant vested KEEPP scorecards An annual scorecard (comprising f inancial and strategic divisional measures agreed between the participant and the Group Managing Director) is used in determining the KEEPP award allocation to be recommended by the Group Managing Director to be made for our divisional managing directors. Following the end of the 2017 f inancial year and assessment of the 2017 KEEPP scorecards, Mr Scott achieved a maximum 2017 KEEPP allocation due to the strong results of Wesfarmers Industrials. Mr Russo achieved an above target award as the Department Stores division performed well overall. Mr Durkan faced a challenging trading environment within Coles and achieved a below target outcome. The 2017 KEEPP cash component for Mr Scott and Mr Russo was paid on 22 August Executive KMP and remuneration frameworks 2.1 Executive KMP The executive KMP includes the Group Managing Director and the Group Chief F inancial Off icer and those executives who have authority and responsibility for planning, directing and controlling the activities of a major prof it generating division of Wesfarmers. The executive KMP are: Executive KMP Group Managing Director (Richard Goyder) Group Chief F inancial Off icer (Terry Bowen) Following the changes announced by Wesfarmers throughout the 2017 f inancial year, it is anticipated that there will be changes to the members of the executive KMP for Mr Gianotti, as the Group Chief F inancial Off icer, and David Baxby as Managing Director, Wesfarmers Industrials, are expected to become executive KMP with Mr Goyder and Mr Bowen ceasing to be executive KMP during the 2018 f inancial year. 2.2 Remuneration framework and policy Wesfarmers is committed to an executive remuneration framework that is focused on: driving a performance culture; and our autonomous management model which rewards our executives for achieving the objectives for which they are accountable and responsible, while providing very strong alignment to the interests of the Group and its shareholders by delivering, at target, the vast majority of that reward in Wesfarmers shares that are held for the long term. The primary objective is to provide satisfactory returns to shareholders and the remuneration principles are focused on driving the leadership performance and behaviours consistent with achieving this objective. In this transitional year, our executive remuneration framework comprises FAR and variable incentives (either participation in the KEEPP or participation in the annual incentive (STI) and a long-term incentive (LTI)). The graphs below show each of the components as a percentage of total target remuneration for the 2017 f inancial year for the divisional managing directors this is calculated using a weighted average: Group Managing Director Operating and financial review Sustainability Governance Directors report Deputy Group Chief Executive Off icer (Rob Scott) 1 Managing Director, Coles (John Durkan) Chief Executive Off icer, Department Stores (Guy Russo) F ixed remuneration 33.3% Variable remuneration 66.7% Newly appointed executive KMP Managing Director, Bunnings Group (Michael Schneider) 2 Former executive KMP Chief Executive Off icer, Bunnings Group (John Gillam) 3 1 R G Scott commenced in the role of Deputy Group Chief Executive Off icer on 14 February M D Schneider was appointed as an executive KMP on 7 December 2016 and appointed Managing Director, Bunnings Group on 29 May J C Gillam ceased in the role of CEO, Bunnings Group on 6 December 2016 and from this date his new role as Senior Advisor no longer met the def inition of a KMP. Group Chief F inancial Off icer F ixed remuneration 35.7% Variable remuneration 64.3% Divisional managing directors F ixed remuneration 31.8% Variable remuneration 68.2% Financial statements Signed reports 75 Shareholder and ASX information
78 Directors' report Remuneration report 2017 (audited) The following table shows the way in which each element of remuneration has been structured in the 2017 f inancial year to support our Group business objectives with a view to generate satisfactory returns to shareholders. In this transitional year, executives either received their FAR and participated in the annual incentive and WLTIP, or received their FAR and participated in the KEEPP. Component F IXED ANNUAL REMUNERATION (FAR) ANNUAL INCENTIVE 1 WESFARMERS LONG-TERM INCENTIVE PLAN (WLTIP) Salary and other benef its (including statutory superannuation). Cash for target performance. Restricted shares for performance above target. Voluntary deferral (of portion of cash award into shares). Performance rights. Performance measure Key result areas for the role: As outlined in the individual s position description. For the Group Managing Director and the Group Chief F inancial Off icer: 70% of the annual incentive comprises Group f inancial measures: Group NPAT and ROE. 30% of the annual incentive comprises Group strategic measures: Including strategy execution, succession, gender balance, talent management, safety and agreed key objectives. Total Shareholder Return (TSR), relative to ASX 50 Index (100% weighting). Measured over a four-year performance period. Opportunity Total remuneration levels are set at competitive levels to attract, retain and engage key talent, with FAR set at a level that is appropriate given the Group s focus on long term performance % of FAR for the Group Managing Director and the Group Chief F inancial Off icer % of FAR for the Group Managing Director and % for the Group Chief F inancial Off icer. Strategic objective/ performance link Considerations: Role and responsibility. Business and individual performance. Internal and external relativities. Contribution, competencies and capabilities. Rewards performance at Group level. The f inancial performance measures were chosen principally because Group NPAT and ROE should drive dividends and share price growth over time. Drives leadership performance and behaviours consistent with achieving the Group s long-term objectives in areas including safety, gender balance, succession planning and talent management. Aligns to the Group s material business risks, including strategy execution (earnings delivery) and loss of key management personnel (succession planning). Provides a link with the creation of shareholder value. TSR was chosen because it provides a relative, external market performance measure having regard to Wesfarmers ASX 50 peers. While the Board and management are committed to managing the generation of acceptable levels of ROE, it was not felt appropriate to use ROE given the impairment charges taken against Target and Curragh and the material effect these had in the 2016 f inancial year ROE (which would be the starting point from when performance would be measured). 1 As set out in section 1.2, the Managing Director, Bunnings Group also participated in the legacy annual incentive measured by Bunnings Australia and New Zealand f inancial measures (Earnings Before Interest and Tax (EBIT) and Return on Capital (ROC)) and strategic measures (including gender balance, talent management, safety and agreed key objectives) and a target opportunity of 60 per cent of FAR and a maximum opportunity of 120 per cent of FAR. 76
79 Remuneration report 2017 (audited) Overview KEY EXECUTIVE EQUITY PERFORMANCE PLAN (KEEPP) Operating and financial review 2016 KEEPP ALLOCATION As no annual scorecard was in place prior to the 2017 f inancial year, the amount of the 2016 KEEPP allocation was determined based on the recommendation of the Group Managing Director to the Board based on performance for the 2016 f inancial year. Accordingly there is no ongoing performance condition for the Restricted Shares but these are subject to a service condition. There was no cash component the 2016 KEEPP allocation consisted of Restricted Shares (50%) and Performance Shares (50%) only (see section 3.5) KEEPP ALLOCATION For the 2017 KEEPP allocation, the amount of the allocation to current KEEPP participants has been determined using performance against the 2017 scorecard. The 2017 KEEPP allocation to these participants consists of: cash; with the remainder split between Restricted Shares (50%) and Performance Shares (50%). The cash component is only paid to the extent that the KEEPP award is above 100% of FAR and up to a maximum of 22.5% of the participant s total at target opportunity. Sustainability Restricted Shares: 50% will be released after 5 years and the remaining 50% after 6 years. Restricted Shares are subject to forfeiture if a participant leaves within 12 months from the date of allocation or leaves Wesfarmers and breaches the restraint clause in their employment agreement or is dismissed in certain circumstances including cause or signif icant underperformance. Performance Shares: Performance Shares are subject to the following measures: Cumulative divisional EBIT targets over a four-year period subject to a divisional ROC gateway (80% weighting); and Total Shareholder Return (TSR), relative to ASX 50 Index (20% weighting). These are measured over a four-year performance period from the grant date of the Performance Shares KEEPP Scorecard: 60% of the annual scorecard comprises divisional f inancial measures: Divisional EBIT, divisional ROC and, where appropriate, store sales growth and transaction growth. 40% of the annual scorecard comprises divisional strategic measures: Including delivery of strategy in line with the approved Corporate Plan, gender balance, talent management, succession planning, safety improvement and other agreed key objectives KEEPP Allocation (Restricted Shares and Performance Shares): As at the date of this report, the service and performance conditions to determine vesting of the 2017 KEEPP allocation had not yet been f inalised. Governance Directors report % of FAR Target: 200% of FAR Maximum: 300% of FAR Recognises and rewards achievement of divisional goals over both the short term and the long term. Aligns to the Group s material business risks, including strategy execution (earnings delivery) and loss of key management personnel (succession planning). Drives leadership performance and behaviours consistent with achieving the Group s long-term objectives in areas including safety, customer metrics, gender balance, succession planning and talent management, which are lead indicators of f inancial performance. The Restricted Shares and Performance Shares provide long-term alignment with shareholders. Performance Shares are measured against the four-year divisional EBIT target (80% weighting), subject to average ROC, to ensure the remuneration of participants is directly linked to the achievement of long-term f inancial returns for the businesses in which they are directly involved. In addition Performance Shares are measured against TSR (20% weighting) to ensure participants are still remunerated against Group results, in addition to the majority of the KEEPP award being delivered in Wesfarmers shares. Financial statements Signed reports The applicable components of remuneration make up Total Remuneration: The remuneration mix is designed to reflect the diversif ied nature of Wesfarmers and is structured to reward executives for performance at a Group level and, for divisional executives, also at a divisional level, and to align executive and stakeholder interests through share ownership. 77 Shareholder and ASX information
80 Directors' report Remuneration report 2017 (audited) 3. Outcomes 3.1 Overview of company performance The Group reported NPAT of $2,873 million for the 2017 f inancial year. This is an increase of $2,466 million from the 2016 f inancial year, which included $1,946 million of significant items being $1,249 million non-cash impairment of Target, $595 million non-cash impairment of Curragh and $102 million of restructuring costs and provisions to reset Target. The majority of Wesfarmers businesses have continued to demonstrate strong performance against key measures. The 2017 f inancial year has seen strong results from our Industrials division, Bunnings Australia and New Zealand, Off iceworks and Kmart. The table below summarises details of Wesfarmers performance for key f inancial measures over the past f ive f inancial years. F inancial year ended 30 June Net prof it after tax (NPAT) ($m) 2,261 2,689 2, ,873 Adjusted NPAT ($m) 1 2,261 2,253 2,440 2,353 2,873 Total dividends per share (declared) (cents) Closing share price ($ as at 30 June) Capital management distribution (paid) (cents) Earnings per share (cents) Return on equity (rolling 12) (%) excludes $1,179 million in discontinued operations relating to the disposal of the Insurance division and WesCEF s interest in Air Liquide WA Pty Ltd along with ($743) million in non-trading items relating to the impairment of Target s goodwill and Coles Liquor restructuring provision excludes $1,249 million non-cash impairment of Target, $595 million non-cash impairment of Curragh and $102 million of restructuring costs and provisions to reset Target total dividends per share includes the 10 cent special Centenary dividend earnings per share includes the items outlined in footnote 1 above; excluding these items, earnings per share were cents per share. 3.2 F ixed annual remuneration Wesfarmers practice is not to increase f ixed remuneration by reference to inflation or indexation as a matter of course. Increases are based on: merit; or where there has been a material change in role or responsibility; or the market rate for comparable roles rising materially; or as a result of internal relativities. The f ixed remuneration of the Group Managing Director, Mr Goyder, was not increased this year and has not changed since October During the annual remuneration review, the f ixed remuneration increased by an average of 2.9 per cent for the Executive Leadership Team to protect the signif icant investment of Wesfarmers in developing its key talent. Mr Scott s f ixed remuneration was increased to $2,000,000 per annum on his appointment as Deputy Chief Executive Off icer in recognition of his greater workload as he transitions to the Group Managing Director role later this year. Upon transitioning, Mr Scott s f ixed remuneration will be increased to $2,500,000 per annum, a signif icantly lower amount than the current Group Managing Director. 78
81 Remuneration report 2017 (audited) Overview 3.3 Annual incentive overview The details of Wesfarmers annual incentive plan are set out in section 3.3(c). The Board, upon recommendation from the Remuneration Committee, increased the weighting on the f inancial metrics for both the Group Managing Director and the Group Chief F inancial Off icer for the 2017 f inancial year. (a) Weighting of performance conditions and outcomes The table below sets out the performance conditions for the 2017 annual incentive and commentary on the performance outcome for each participant. Operating and financial review Group Managing Director (R J B Goyder) F inancial measures (70%) Strategic measures (30%) Measure Outcome Performance commentary Group NPAT (with ROE gate) Succession/transition, gender balance, talent management and safety Both the 2017 Group NPAT and ROE results were greater than budget with strong results from most businesses. Mr Goyder was judged to have performed well against each of his objectives, exceeding overall targets. Sustainability Group Chief F inancial Off icer (T J Bowen) F inancial measures (70%) Strategic measures (30%) Group NPAT (with ROE gate) Gender balance, talent management and succession planning Both the 2017 Group NPAT and ROE results were greater than budget with strong results from most businesses. Mr Bowen performed very strongly against each of his objectives and the maximum score was given. Managing Director, Bunnings Group and Managing Director, Bunnings Australia and New Zealand (M D Schneider) F inancial measures (70%) Strategic measures (30%) Divisional EBIT and Divisional ROC Gender balance, talent management and key objectives agreed with the Group Managing Director Safety Threshold not met Threshold met or exceeded Target met or exceeded Maximum achieved Bunnings Australia and New Zealand continued with another strong year of f inancial results with both divisional EBIT and ROC exceeding budget. Mr Schneider was judged as having made strong progress against his objectives. Safety improved across Bunnings Australia and New Zealand, and the annual improvement target was exceeded. Governance Directors report (b) Annual incentive outcomes 2017 f inancial year The table below sets out specif ic information relating to the actual annual incentive awards for the 2017 f inancial year. Name Total award Awarded $ 1 % PERCENTAGE OF MAXIMUM STI Forfeited % R J B Goyder 4,073, T J Bowen 2,179, Financial statements M D Schneider 1,178, The Board has agreed to pay the annual incentive for R J B Goyder and T J Bowen wholly in cash with no change in value. These payments were made on 22 August M D Schneider received the portion of his total award above target in Wesfarmers shares. The deferred restricted shares were allocated on 22 August On behalf of Mr Schneider $428,385 worth of shares were acquired and the number of shares, 10,359, was determined based upon the allocation share price on 22 August The shares were purchased on market at an average price of $ No voluntary deferred shares were allocated. Signed reports 79 Shareholder and ASX information
82 Directors' report Remuneration report 2017 (audited) (c) At risk component annual incentive Additional details of Wesfarmers annual incentive plan are summarised below. Annual incentive (STI) Description Conditions and vesting Restrictions upon shares allocated Change of control Clawback Annual incentive plan delivered in cash (up to 60 per cent of FAR) and mandatory deferred shares (any amounts awarded above that) restricted for three years with forfeiture condition. Opportunity to elect upfront for a longer restriction (up to 15 years from the grant date) and to defer a portion of the cash award into shares (in addition to the mandatory deferral arrangement). F inancial and non-f inancial performance conditions (see section 3.3(a)). Incentive awards are determined after the preparation of the f inancial statements each year (in respect of the f inancial measures) and after a review of performance against non-f inancial measures by the Group Managing Director (and in the case of the Group Managing Director, by the Board) at the end of the f inancial year. F inancial measures (i.e., NPAT, ROE, EBIT, ROC and other specif ic divisional objectives) and safety measures (i.e., total recordable injury frequency rate) are calculated based on the achievement of actual results against the targets set for these measures at the start of the f inancial year. The performance and development review process is used to capture and assess key objectives and outcomes in relation to non-f inancial measures (i.e., succession/transition, gender balance, talent management, safety and key objectives for the role). In respect of the f inancial measures, depending on the division, threshold begins at 92.5 per cent or 95 per cent of target and stretch is awarded at or above 105 per cent or 110 per cent of target. Safety targets are based on an improvement on last year s results. The Board conf irms f inal awards based on overall personal and Group performance. In accordance with the terms of the plan, the Board has discretion to make adjustments to the performance conditions. Restricted shares are subject to a three-year trading restriction while the executive remains an employee of Wesfarmers and the executive can elect for an additional restriction of up to 15 years from the grant date. The Board may determine that mandatory restricted shares are forfeited if an executive resigns or is terminated for cause within one year of the share allocation. Board discretion to release restricted shares. The terms of the annual incentive plan contain a mechanism for the Board to clawback or adjust any incentive awards which vest (or may vest) as a result of a material misstatement in, or omission from, the f inancial statements or otherwise as a result of fraud, dishonesty or breach of obligations. The Board has discretion to adjust any conditions applicable to an award, if considered appropriate. The Board may, up to the value of the overpaid remuneration, reduce or defer or otherwise require the repayment of any amount paid or payable to the executive to ensure no unfair benef it is derived. 3.4 WLTIP overview The Group Managing Director and the Group Chief F inancial Off icer received performance rights granted under the WLTIP during the 2017 f inancial year. While originally a four-year service period, the Group Managing Director and the Group Chief F inancial Off icer s WLTIP grants will be left restricted in the plan upon retirement and tested in the normal course. Key terms of this scheme are detailed in section 3.4(d). (a) LTI awarded during the year Performance rights were allocated to Mr Goyder and Mr Bowen under the 2016 WLTIP on 11 November 2016, and are subject to a four-year performance period but are not subject to any additional trading restrictions. Awards are subject to a relative TSR hurdle (detailed in section 3.4(d)). Rights granted 1 Face value 2 ($) Value at grant 3 ($) R J B Goyder 81,522 3,505,970 1,797,723 T J Bowen 43,016 1,849, ,589 1 The number of performance rights allocated is determined based upon the 10-day volume weighted average price (VWAP) of Wesfarmers shares over the period immediately following the full-year results announced in August 2016 (i.e., 25 August to 7 September 2016) being $ Performance rights have no exercise price. 2 Face value represents the number of rights multiplied by the 10-day VWAP. 3 For accounting purposes, the fair value at grant is shown above, in accordance with AASB 2: Share-Based Payment. The rights have been independently valued using the Monte Carlo simulation using the Black-Scholes framework. The value per right for Mr Goyder and Mr Bowen is $
83 Remuneration report 2017 (audited) Overview (b) LTI vesting during the year Vesting condition Outcome ( ) Percentile ranking vs ASX 50 % of maximum award CAGR in ROE (75% of the award) 8.61% 62.80% 75.60% TSR (25% of the award) 27.03% 31.10% 0.00% Total % of shares vested Number of shares vested 56.70% 147,007 The table above shows the performance of the Group against the targets for the 2013 WLTIP award, whose four-year performance period ended on 30 June The Group outperformed the majority of its peers over the vesting period, with regard to compound annual growth rate (CAGR) in ROE leading to a majority of the awards vesting (56.7 per cent of the potential total award). None of the awards tested against TSR vested. The shares vested per individual are shown in section 3.4(c). The shares were released from a trading restriction on 19 September J C Gillam and G A Russo elected to extend their trading restriction to 8 November 2018 and 8 November 2020 respectively. (c) Summary of awards held under WLTIP The table below sets out details of performance rights granted to senior executives under the 2016 WLTIP allocation, rights vested and lapsed in relation to the 2013 WLTIP allocation as well as details of rights granted under prior year WLTIP awards. As noted in the table, during the year the Board approved that the unvested WLTIP allocations for Mr Goyder and Mr Bowen would continue to be restricted in the WLTIP until the end of their original performance period, notwithstanding they are expected to leave the Group earlier. The Board has approved this treatment on the basis that they are good leavers at the time they leave the Group. Name Executive KMP Held at Granted 1 July during year 2 Vested Lapsed during the year 3 Net change Held at 30 June R J B Goyder 5 254,406 81,522 (49,896) (38,104) (6,478) 247,928 Operating and financial review Sustainability Governance T J Bowen 5 174,063 43,016 (31,185) (23,815) (11,984) 162,079 R G Scott 86,774 - (15,628) (11,935) (27,563) 59,211 J P Durkan 174,757 - (28,337) (21,641) (49,978) 124,779 G A Russo 129,466 - (21,961) (16,772) (38,733) 90,733 Former KMP J C Gillam 6 151,906 - (25,681) (19,612) (106,613) - Directors report 1 Reflects prior year WLTIP allocations which are subject to performance conditions at that time which remain unvested (i.e., under the 2013, 2014 and 2015 WLTIP allocation of performance rights). 2 Due to the introduction of the KEEPP and J C Gillam stepping down from his role as CEO, Bunnings Group, only R J B Goyder and T J Bowen received performance rights under WLTIP in the 2017 f inancial year. 3 The rights that did not vest under the 2013 WLTIP, as performance hurdles were not met, lapsed. 4 Reflects the WLTIP allocations subject to performance conditions at that time which remain unvested (i.e., the 2014, 2015 and 2016 WLTIP rights). 5 On 28 June 2017 the Board approved that Mr Goyder and Mr Bowen will be entitled to have their unvested WLTIP rights continue to be restricted in the plan after they leave the Group, waiving the four-year service period normally required for a WLTIP grant as at the date they cease employment, resulting in an accelerated expensing prof ile over the revised vesting period. The Wesfarmers Limited share price on that date was $ All other terms of the grant, including the applicable performance conditions to be satisf ied for vesting, remain the same and will be tested at the end of the applicable performance period. The fair value of these WLTIP grants has not changed. 6 Reflects the period until J C Gillam ceased to be a member of the executive KMP on 6 December Financial statements Signed reports 81 Shareholder and ASX information
84 Directors' report Remuneration report 2017 (audited) (d) At risk component WLTIP The key details of WLTIP are summarised below. Wesfarmers Long-term Incentive Plan (WLTIP) Description Performance period Conditions and vesting Award of performance rights subject to a four-year performance period. Four years. For the 2016 WLTIP allocation (granted during the 2017 f inancial year) there is one performance hurdle Wesfarmers TSR relative to the TSR of the ASX 50 Index. The move to a single measure has been made given the advantageous effect for executives that the impairments made in the 2016 f inancial year would have made achieving the targets under the relative ROE measure. The following vesting schedule applies to the performance hurdle: Percentile ranking Percentage of awards vesting Below the 50th percentile Equal to the 50th percentile Between the 50th and 75th percentile Equal to the 75th percentile or above 0% vesting 50% vesting An additional 2% of awards vest for each percentile increase 100% vesting Following testing, any rights that do not vest, lapse. The number of performance rights allocated is determined based upon the 10-day volume weighted average price of Wesfarmers shares over the period immediately following the full-year results announced in August Restrictions upon shares allocated Change of control Clawback Vesting will be determined after the end of the four-year performance period. While the treatment for participants who cease employment with Wesfarmers before the end of the performance period depends upon the circumstances of cessation, in the case of the Group Managing Director and the Group Chief F inancial Off icer the Board intends treating them as good leavers and leaving their unvested WLTIP performance rights restricted in the plan to be tested, and, if appropriate, vest at the end of the applicable performance period. Board discretion to determine treatment of awards. The terms of WLTIP contain a mechanism for the Board to clawback or adjust any incentive awards which vest (or may vest) as a result of a material misstatement in, or omission from, the f inancial statements or otherwise as a result of fraud, dishonesty or breach of obligations. The Board has discretion to adjust any conditions applicable to an award, if considered appropriate. The Board may, up to the value of the overpaid remuneration, reduce or defer or otherwise require the repayment of any amount paid or payable to the executive to ensure no unfair benef it is derived. 3.5 KEEPP overview During the 2017 f inancial year, for the f irst time, our divisional managing directors received an allocation of KEEPP awards, being the 2016 KEEPP allocation (see section 3.5(a)). In the 2018 f inancial year, they will receive their second KEEPP allocation, being the 2017 KEEPP allocation determined using the performance outcomes against their 2017 f inancial year scorecard (see section 3.5(b)). Further key terms of this new reward program are detailed in section 3.5(d). (a) KEEPP awarded during the year (2016 KEEPP allocation) As there was no scorecard in place for the 2016 KEEPP allocation, the amount of KEEPP awarded during the year was approved by the Board on recommendation from the Group Managing Director based on performance in the 2016 f inancial year: Name Awarded % FAR R G Scott 230 J P Durkan 200 G A Russo 220 There was no cash component for the 2016 KEEPP allocation as the 2016 annual incentives were tested, as reported in the 2016 remuneration report. 82
85 Remuneration report 2017 (audited) Overview Restricted Shares and Performance Shares were allocated to participants under the 2016 KEEPP allocation. One half of the award that is provided in Restricted Shares are restricted for five years (50 per cent) and six years (50 per cent). The other half of the award that is provided in Performance Shares are subject to a four-year performance period. Further details are in section 3.5(d). Name Restricted Shares granted Performance Shares granted Total Share Award value 1 ($) Fair value at grant 2 ($) R G Scott 32,088 32,088 2,759,980 2,742,171 J P Durkan 48,830 48,829 4,199,964 4,172,870 Operating and financial review G A Russo 47,319 47,318 4,069,999 4,043,740 1 The number of Restricted Shares and Performance Shares allocated is determined based upon the 10-day VWAP of Wesfarmers shares over the period immediately following the full-year results announced in August 2016 (i.e., 25 August to 7 September 2016) being $ This amount shown represents the total number of Restricted Shares and Performance Shares multiplied by the 10-day VWAP. 2 For accounting purposes, the fair value at grant is shown above, in accordance with AASB 2: Share-Based Payment. The Performance Shares subject to market conditions (TSR hurdle) have been independently valued using the Monte Carlo simulation using the Black-Scholes framework. The Restricted Shares and the Performance Shares subject to non-market conditions (divisional EBIT and ROC) have been valued using the Black-Scholes option pricing model. The value per Performance Share for the TSR performance hurdle is $29.94 and the value per Restricted Share and per Performance Share subject to divisional EBIT and ROC hurdle is $ Sustainability (b) Weighting of performance conditions and outcomes for the 2017 f inancial year scorecard The results of the performance against the annual scorecard for the 2017 KEEPP allocation are outlined below: Measure Outcome Performance commentary Deputy Chief Executive Off icer, Wesfarmers Limited (R G Scott) Divisional f inancial measures (60%) Strategic measures (40%) Divisional EBIT Divisional ROC Business turnaround and strategic outcome Succession Safety Talent Gender balance Managing Director, Coles (J P Durkan) Divisional f inancial measures (60%) Strategic measures (40%) Divisional EBIT Divisional ROC Comparative sales Comparative transactions Strategic outcome Succession Safety Talent Gender balance Chief Executive Off icer, Department Stores (G A Russo) Divisional f inancial measures (60%) Strategic measures (40%) Divisional EBIT Divisional ROC Business turnaround and strategic outcome Succession Safety Talent Gender balance Very strong f inancial results for Wesfarmers Industrials resulted in Mr Scott receiving maximum for these measures. As Managing Director, Wesfarmers Industrials, Mr Scott delivered very strong results across each of his objectives, in addition to taking on Deputy Chief Executive Off icer duties part way through the year. Diff icult trading conditions for Coles resulted in below threshold performance for f inancial measures. Mr Durkan achieved good progress in relation to safety, talent and gender balance and overall was considered to have exceeded threshold for his strategic measures. Despite below target f inancial results for Target, the strong f inancial performance for Kmart and for the Departments Stores division overall, resulted in above target performance. Although Mr Russo did not meet the target set for safety improvement for the year, he has performed very well and achieved good results in relation to his other objectives. Governance Directors report Financial statements Signed reports Threshold not met Threshold met or exceeded Target met or exceeded Maximum achieved 83 Shareholder and ASX information
86 Directors' report Remuneration report 2017 (audited) (c) KEEPP outcomes 2017 f inancial year scorecard The table below sets out specif ic information relating to the actual KEEPP outcomes for the 2017 f inancial year, based upon the 2017 f inancial year scorecards. Name Total outcome 2017 KEEPP scorecard $ Cash (paid in August 2017) $ Balance available for Restricted Shares and Performance Shares 1 $ PERCENTAGE OF MAXIMUM 2017 KEEPP OPPORTUNITY Awarded % Forfeited % R G Scott 6,000, ,000 5,100, J P Durkan 1,870,000-1,870, G A Russo 4,197, ,500 3,364, % allocated as Restricted Shares and 50% allocated as Performance Shares. The KEEPP cash component for the 2017 f inancial year scorecard was paid on 22 August The Restricted Shares and Performance Shares are expected to be allocated in late September 2017 and details of those share grants will be provided in the 2018 remuneration report. (d) At risk component KEEPP The key details of the KEEPP are summarised below. Description Annual scorecard measures Annual scorecard assessment and award type KEEPP allocations Reward plan designed to reflect Wesfarmers autonomous management model and to reward divisional managing directors for their division's results while providing strong long-term alignment with shareholders. This replaces both the annual incentive and WLTIP for participants with a single plan operating over a total of seven years and delivered (heavily) in Wesfarmers shares (to align with shareholder experience) with long vesting periods (up to six years from the grant date). An annual scorecard (agreed between participants and the Group Managing Director and reviewed by the Remuneration Committee) is used in determining the amount to be recommended by the Group Managing Director as the overall value of the KEEPP allocation. The annual scorecard comprises divisional f inancial and divisional strategic performance conditions that are quantif iable and measurable and specif ic to each division (see section 3.5(b)). In respect of the f inancial measures for 2017 which include divisional EBIT and ROC targets, threshold vesting begins at 95 per cent of target and maximum is awarded at or above 105 per cent of target KEEPP Allocation: As there was no scorecard in place for the 2016 KEEPP allocation, the annual amount awarded during the year was approved by the Board on recommendation from the Group Managing Director based on performance in the 2016 f inancial year. There was no cash component for the 2016 KEEPP allocation as the 2016 annual incentives were tested and paid as normal KEEPP Allocation (and future allocations): The value of the full KEEPP award for the f inancial year is determined using performance against the annual scorecard in the preceding f inancial year, and as recommended by the Group Managing Director. Performance is assessed after the preparation of the f inancial statements each year (in respect of the f inancial measures) and after a review of performance against strategic measures by the Group Managing Director at the end of the f inancial year. In accordance with the terms of the plan, the Board has discretion to make adjustments to the performance conditions, where the Board considers this appropriate. Following the determination of the opportunity amount, KEEPP awards are granted in cash, Restricted Shares and Performance Shares. Cash is only paid where the overall KEEPP award is greater than 100 per cent of FAR and for the divisional managing directors, cash may be paid up to a maximum of 22.5 per cent of the participant s total at target opportunity. This cash component will be reduced over the next few KEEPP cycles as the participant s shareholding and attached dividend flow increases. The remainder of the KEEPP award is granted as Restricted Shares and Performance Shares as follows: 50 per cent will be granted as Restricted Shares for up to six years where half of the shares will be restricted for f ive years and the balance will be subject to a restriction for six years; and the remaining 50 per cent will be performance-based shares (Performance Shares) which will vest subject to divisional performance against corporate plan EBIT and ROC, and relative TSR over four years. KEEPP cash payments are made in late August, and the Restricted Shares and Performance Shares are allocated following the Board deciding on and communicating the conditions and restrictions to apply to them to the participant. The number of shares allocated is determined using a face value calculated based upon the 10-day VWAP of Wesfarmers shares over the period immediately following the full-year results announced in August of that year. 84
87 Remuneration report 2017 (audited) Overview (d) At risk component KEEPP (continued) Performance Shares conditions and vesting 2016 KEEPP Allocation: The Performance Shares have f inancial performance conditions over a four-year performance period: cumulative EBIT and ROC (80 per cent weighting); and Wesfarmers TSR relative to the TSR of the ASX 50 Index (20 per cent weighting). Vesting schedule against EBIT and ROC: 50 per cent of the Performance Shares vest if 90 per cent of the cumulative EBIT target is achieved, subject to achieving 90 per cent of the average ROC target; and 100 per cent of the Performance Shares vest if 100 per cent of the cumulative EBIT target is achieved, subject to achieving 90 per cent of the average ROC target. Straight-line vesting occurs in between and following testing, any shares that do not vest are forfeited. Vesting schedule against relative TSR: Percentile ranking Below the 50th percentile Percentage of awards vesting 0% vesting Operating and financial review Sustainability Equal to the 50th percentile Between the 50th and 75th percentile 50% vesting An additional 2% of awards vest for each percentile increase Restrictions upon shares allocated Cessation of employment Change of control Clawback Equal to the 75th percentile or above 100% vesting Following testing, any Performance Shares that do not vest will be forfeited. In accordance with the terms of the plan, the Board has discretion to make adjustments to the performance conditions where it is considered appropriate to do so KEEPP Allocation: As at the date of this report, the performance conditions to determine vesting of the 2017 KEEPP allocation had not yet been f inalised. Restricted Shares 2016 KEEPP Allocation: Restricted Shares are subject to a f ive- or six-year trading restriction. They will be released from restriction on the day following the full year results announcement for the 2021 and 2022 f inancial years in August 2021 and August 2022 respectively (i.e., the beginning of the trading window) and will not be subject to any trading restrictions on dealing (subject to complying with Wesfarmers' Securities Trading Policy). The Board can elect to provide a cash payment as an alternative to the shares (equivalent in value to the vested shares) KEEPP Allocation: As at the date of this report, the service conditions to determine vesting of the 2017 KEEPP Allocation had not yet been f inalised. Performance Shares Performance Shares that vest subject to the performance conditions are not subject to any additional trading restrictions although the Board can elect to provide a cash payment as an alternative to the shares (equivalent in value to the vested shares). Restricted Shares Restricted Shares are subject to forfeiture if the executive resigns within 12 months of allocation, breaches the restraint clause in their employment agreement or is dismissed in certain circumstances including cause or signif icant underperformance. The restriction is intended to continue even if the executive ceases to be an employee of Wesfarmers. The Board has discretion to lift this restriction early and also to provide a cash payment as an alternative to the shares (equivalent in value to the vested shares). Performance Shares If an executive ceases employment with Wesfarmers before the end of the performance period, their entitlement to the shares (if any) will depend on the circumstances of cessation. All shares will forfeit in the event of resignation or dismissal for cause or signif icant underperformance. If an executive ceases employment during the performance period by reason of redundancy, ill health, death, or other circumstances approved by the Board, the executive will generally be entitled to have his or her Performance Shares left restricted in the plan to be vested (and vest) at the end of the applicable performance period. Board discretion to determine treatment of awards. The terms of the KEEPP contain a mechanism for the Board to clawback or adjust any incentive awards which vest (or may vest) as a result of a material misstatement in, or omission from, the f inancial statements or otherwise as a result of fraud, dishonesty or breach of obligations. The Board has discretion to adjust any conditions applicable to an award, if considered appropriate. The Board may, up to the value of the overpaid remuneration, reduce or defer or otherwise require the repayment of any amount paid or payable to the executive to ensure no unfair benef it is derived. Governance Directors report Financial statements Signed reports Dividends Restricted Shares These will be escrowed until the end of the 12-month forfeiture period and thereafter be paid to the KEEPP participants. Performance Shares These will be escrowed for the full four-year performance period and only paid to the KEEPP participants to the extent that the underlying shares vest. 85 Shareholder and ASX information
88 Directors' report Remuneration report 2017 (audited) 3.6 Executive remuneration (statutory presentation) How remuneration outcomes are presented Remuneration outcomes are presented based on the requirements of accounting standards (which has the benef it of being readily comparable with other companies) rather than a take-home pay basis (being cash and benef its and the value of equity on vesting during the f inancial year). Examples of this are: Annual incentive awards can be paid in restricted shares. These are recognised as an expense over a 12-month period typically spanning two f inancial years, including the year of the award. This year s outcome includes expenses relating to this year s and last year s restricted shares as well as this year s cash award. WLTIP awards are recognised over the performance period (four years) based on their assessed value when originally granted to the executive. This may be signif icantly different to their value, if and when the incentive vests to the executive. KEEPP cash component is recognised for the year to which it relates, KEEPP Restricted Shares are recognised as an expense over a 12-month period typically spanning two f inancial years and KEEPP Performance Shares are recognised over the performance period (four years) based on their assessed value when originally granted to the executive. The value recognised for the KEEPP Restricted Shares and Performance Shares may be signif icantly different to their value if and when the incentive vests to the executive. In some circumstances, amounts are recorded as remuneration when no shares or rights vest to the executive and in other cases there can be negative remuneration from LTIs in a given year due to non-vesting. Footnotes to remuneration table on the following page 1 Share-based payments: Refer to section 3.3 for detailed disclosures under the annual incentive plan and sections 3.4 and 3.5 for the various long-term incentive plans. The amounts included for the Value of annual incentive shares includes the portion of the 2017 annual incentive that was deferred into shares and is recognised for accounting purposes over the performance and forfeiture periods, which together are referred to as the service period. For accounting purposes, the 2015 and 2016 annual incentive shares continue to be expensed in the 2017 f inancial year based on probability of vesting, as these shares are subject to performance and forfeiture conditions. The amounts included for the Value of long-term incentive equity for the 2016 WLTIP are detailed in section 3.4 and for the 2016 KEEPP are detailed in section 3.5. For accounting purposes, the 2013, 2014 and 2015 WLTIP continue to be expensed in the 2017 f inancial year based on probability of vesting, as these shares are subject to performance and forfeiture conditions, together referred to as the service period. The expensing for the Restricted Shares and Performance Shares, that are yet to be granted under the 2017 KEEPP, will start to be included in the remuneration table in the 2018 remuneration report. 2 The percentage performance related for the 2017 f inancial year is the sum of the annual incentive and KEEPP cash and share-based payments divided by the total remuneration, reflecting the actual percentage of remuneration at risk for the year. The percentage of total remuneration that consists of performance rights and KEEPP shares only, being the amount expensed in the 2017 f inancial year for the 2013, 2014, 2015 and 2016 WLTIP and the 2016 KEEPP shares, as applicable, is as follows R J B Goyder 34.7%, T J Bowen 38.1%, R G Scott 35.5%, J P Durkan 51.2% and G A Russo 46.8%. M D Schneider does not hold WLTIP performance rights or KEEPP shares. 3 Short-term benef its, non-monetary benef its, include the cost to the company of providing parking, vehicle, life insurance and travel. Short-term benef its, other, includes the cost of directors and off icer insurance. 4 Long-term benef its relate to leave entitlements accrued for the year. 5 Post-employment benef its, other benef its, include the retention incentive accrual (equal to nine months FAR) from last year to this year, which is payable upon termination of employment for T J Bowen, J C Gillam and G A Russo. A portion of the retention incentive previously earned for satisfying the applicable service condition under the legacy retention incentive plan, equal to nine months FAR (at the level of FAR when the executive departs), is payable to these executives at the time of termination of employment (except in the case of termination for serious misconduct). These amounts were earned in the 2010 f inancial year; however, the payment is not due to be made until the relevant employee ceases his employment with the Group. Although it will be paid at the time of cessation of employment, such payments do not constitute a termination benef it for the purposes of the termination payment legislation. Following Mr Scott s appointment to Deputy Chief Executive Off icer, the Board resolved to crystallise his retention incentive entitlement in the 2017 f inancial year and this was paid to him in April For the 2017 financial year, the Board agreed to pay the annual incentive for R J B Goyder and T J Bowen wholly in cash and therefore the total of their FY17 annual incentive is reflected under 'Annual incentive and KEEPP cash'. Further, on 28 June 2017, the Board approved that R J B Goyder and T J Bowen will be entitled to have their unvested WLTIP rights continue to be restricted in the plan after they leave the Group, waiving the four-year service period normally required for a WLTIP grant as at the date they cease employment, resulting in an accelerated expensing profile over the revised vesting period. This accelerated expensing profile is reflected under the 'Value of long-term incentive equity'. 7 M D Schneider became a member of the KMP, effective 7 December J C Gillam ceased to be a member of the KMP following his stepping into a Senior Adviser role from his original role of Chief Executive Off icer, Bunnings Group on 6 December S B Machin ceased to be a member of the KMP following the establishment of the Department Stores division effective 23 February 2016 and resigned on 8 April Following his resignation, all unvested STI and LTI awards were forfeited. 10 T J P O Leary ceased to be a member of the KMP following the restructure of the Wesfarmers Industrials division effective 1 September
89 Remuneration report 2017 (audited) Overview PERCENTAGE PERFORMANCE RELATED 2 TOTAL SHARE-BASED TERMINATION PAYMENTS 1 BENEF ITS POST-EMPLOYMENT BENEF ITS LONG-TERM BENEF ITS SHORT-TERM BENEF ITS Termination payments $ $ % Value of longterm incentive (LTI) LTI equity Value of annual incentive (STI) STI shares Other benef its 5 Superannuation Leave 4 Other 3 Nonmonetary benef its 3 Annual incentive and KEEPP cash Cash salary $ $ $ $ $ $ $ $ $ Executive director R J B Goyder 6 Group Managing Director, Wesfarmers Limited ,349,179 4,073, ,096 8,040 58,433 31, ,237 4,200,391-12,097, ,348,935 1,051, ,891 7,482 58,433 31, ,442 (94,191) - 5,489, Senior executives T J Bowen 6 Group Chief F inancial Off icer, Wesfarmers Limited ,818,053 2,179,506 16,145 8,040 30,833 31,947-46,941 2,548,008-6,679, ,798,052 1,036,000 16,596 7,482 30,833 26,948 75, , ,741-3,545, R G Scott Deputy Chief Executive Off icer, Wesfarmers Limited ,500, ,000 63,611 8,040 23,333 19, , ,543 1,988,058-5,607, , ,033 43,943 6,215 16,612 16,092 60, ,992 20,785-1,907, J P Durkan Managing Director, Coles ,155,380-3,053 8,040 36,666 19, ,539 3,129,281-5,658, ,055,690 1,260,000 3,053 7,482 35,000 19, ,851 1,500,619-5,288, G A Russo Chief Executive Off icer, Department Stores ,818, ,500 27,093 8,040 30,833 31, ,020 2,936,836-6,042, ,705,552 1,110,000 3,053 7,482 30,833 31, , , ,942-4,037, M D Schneider 7 Managing Director, Bunnings Group , ,288 45,960 4,538 8,231 11, , ,622-1,364, Former senior executives J C Gillam 8 Chief Executive Off icer, Bunnings Group ,409-1,694 3,502 14,520 12, , ,029-1,608, ,822,344 1,200,000 13,822 7,482 33,333 27, , , ,162-4,400, S B Machin 9 Managing Director, Target ,414-1,985 4,865 13,005 17, (678,404) - 122,403 (554.2) T J P O Leary 10 Managing Director, Wesfarmers Chemicals, Energy & Fertilisers , , ,257 2,964 5,412-12,717 7, , Total ,032,935 8,408, ,652 48, , , ,000 1,314,887 15,513,225-39,058, ,606,076 6,443, ,860 49, , , ,926 3,402,943 1,366,335-25,179, Operating and financial review Sustainability Governance Directors report Financial statements Signed reports Shareholder and ASX information
90 Directors' report Remuneration report 2017 (audited) Non-executive director remuneration 4. Framework and outcomes 4.1 Overview of non-executive directors remuneration policy and arrangements Policy objectives To be market competitive: aim to set fees at a level competitive with non-executive directors in comparator companies; and To safeguard independence: to not include any performance-related element, to preserve the independence of non-executive directors. Aggregate fees approved by shareholders The current maximum aggregate fee pool for non-executive directors of $3,600,000 was approved by shareholders at the 2015 Annual General Meeting. Fees paid to Wesfarmers non-executive directors for membership of Wesfarmers divisional boards, in addition to Wesfarmers Board and Committee fees and superannuation contributions made on behalf of the non-executive directors in accordance with Wesfarmers statutory superannuation obligations, are included in this aggregate fee pool. Regular reviews of remuneration The Board periodically reviews the level of fees paid to non-executive directors, including seeking external advice. A review was undertaken during the 2017 f inancial year with the assistance of 3 degrees consulting. Main Board non-executive directors fees were increased by 4.5 per cent and the Chairman fee increased by 2.5 per cent effective 1 January 2017 in order to remain competitive in the market, having regard to the size, complexity and market position of the Group. No change was made to the Audit and Risk Committee fees or Remuneration Committee fees, as the current level of fees were considered appropriate. 4.2 Non-executive director fees and other benef its The fees shown in the table below (inclusive of superannuation) took effect from 1 January Members of the Nomination Committee and Gresham Mandate Review Committee do not receive any additional fees. Fees/benef its Description 2017 $ Included in shareholder approved cap Board fees Committee fees Superannuation Other Group fees Other benef its Main Board Chairman M A Chaney 770,000 Members all non-executive directors 230,000 Audit and Risk Committee Chairman A J Howarth 80,000 Members D L Smith-Gander, J A Westacott 40,000 Remuneration Committee Chairman W G Osborn 52,000 Members M A Chaney*, J P Graham, P M Bassat and V M Wallace 26,000 Made to the Wesfarmers Group Superannuation Plan or another regulated superannuation fund. An amount is deducted from gross fees to meet statutory superannuation obligations. Non-executive directors are paid additional fees for participation on Wesfarmers divisional boards, where applicable. Non-executive directors are entitled to reimbursement for business-related expenses, including travel expenses and also receive the benef it of coverage under a directors and off icer insurance policy. Yes Yes Yes Yes Yes No * From 1 January 2014, the Chairman of the Board no longer receives a separate fee for sitting on any of the Board s committees. 88
91 Remuneration report 2017 (audited) Overview 4.3 Non-executive director remuneration The fees paid or payable to the non-executive directors in relation to the 2017 f inancial year are set out below: Non-executive directors Fees Wesfarmers Limited $ SHORT-TERM BENEF ITS Fees Wesfarmers Group $ Other benef its 1 $ POST-EMPLOYMENT BENEF ITS Superannuation 2 P M Bassat ,380-8,040 19, , ,690-7,482 19, ,482 M A Chaney ,380-8,040 19, , ,150-7,482 19, ,942 J P Graham ,000-8, , ,000-7, ,482 $ Total $ Operating and financial review Sustainability A J Howarth , ,900 8,040 19, , ,690 99,700 7,482 19, ,182 W G Osborn ,380-8,040 19, , ,690-7,482 19, ,482 D L Smith-Gander , ,568 8,040 19, , ,690-7,482 19, ,482 V M Wallace ,380-8,040 19, , ,690-7,482 19, ,482 J A Westacott ,380-8,040 19, ,040 Former non-executive directors R L Every 7 (retired 12/11/15) ,690-7,482 19, , ,311-87,301 8, ,658 Total remuneration ,487, ,468 64, ,340 2,916, ,492,601 99, , ,216 2,882,674 1 The benef it included in this column is an apportionment of the premium paid on a policy for directors and off icer insurance. In 2016, this benef it included the cost to the company (inclusive of fringe benef its tax) of a retirement gift for R L Every. 2 Superannuation contributions are made on behalf of non-executive directors in accordance with Wesfarmers statutory superannuation obligations. Also included is any part of a non-executive director s fees that have been sacrif iced into superannuation. 3 M A Chaney was appointed as Chairman on 12 November J P Graham s fees are paid to Gresham Partners Group Limited for participation on the Board of Wesfarmers Limited. 5 A J Howarth receives fees for participation on the board of BWP Management Limited. Governance Directors report Financial statements 6 D L Smith-Gander received fees for participation in the strategic review of Officeworks Limited. 7 R L Every retired as Chairman at the conclusion of the 2015 Annual General Meeting on 12 November Signed reports 89 Shareholder and ASX information
92 Directors' report Remuneration report 2017 (audited) Other remuneration information 5. Remuneration governance 5.1 Responsibility for setting remuneration Responsibility for setting a remuneration policy and determining non-executive director, executive director and senior executive remuneration rests with the Board. The Remuneration Committee is delegated responsibility to review and make recommendations to the Board. Management and remuneration consultants provide information to assist the Board and Remuneration Committee, but do not substitute for the Board and committee processes. Details of the composition of the Remuneration Committee is set out on page 88 of this annual report. Further information regarding the objectives and role of the Remuneration Committee is contained in its charter, which is available on the Corporate Governance section of the company s website at Use of remuneration advisers during the year 3 degrees consulting was engaged by the Remuneration Committee to provide independent advice to it on a range of matters, including KMP remuneration. In the 2017 f inancial year, 3 degrees consulting provided remuneration recommendations as def ined in section 9B of the Corporations Act 2001 in relation to the remuneration of the Deputy Chief Executive Off icer, Mr Scott, and levels of our non-executive director fees. 3 degrees consulting was paid $37,000 excluding GST and disbursements, for these services. The Board is satisf ied that the recommendations were made free from any undue influence by the member or members of KMP to whom the recommendations relate. In addition to adhering to Board approved protocols, 3 degrees consulting provided a formal declaration in this regard. 3 degrees consulting also acted as the independent remuneration adviser to the Remuneration Committee and has been involved in the design and implementation of the KEEPP program for the divisional managing directors, the incoming Group Managing Director and the incoming Group Chief F inancial Off icer. 3 degrees consulting also provided a broad range of services to Wesfarmers and the broader group during this transitional year, including human resources strategy and forward planning, human resources legal advice, advice regarding senior leadership succession and retirement transition, as well as advice on other aspects of remuneration of the Group s senior executives, and related governance and legal advice. Services also included advice regarding senior executive employment terms, advice relating to executives who ceased employment during the year, internal and external stakeholder communications (including assistance in relation to the remuneration report), the provision of market data regarding peer remuneration practices and assistance with various human resources and remuneration planning regarding the potential IPO of Off iceworks. 3 degrees consulting was paid a total of $972,550 excluding GST and disbursements for these services to the Wesfarmers Group for the 2017 f inancial year. During the year, 3 degrees consulting was acquired by KPMG and was rebranded KPMG-3dc. KPMG-3dc did not provide any remuneration recommendations as def ined in section 9B of the Corporations Act 2001 in the 2017 f inancial year. 5.3 Senior executive and director share ownership The Board considers it an important foundation of the Wesfarmers executive remuneration framework that the senior executive team and directors hold a signif icant number of Wesfarmers shares to encourage executives to behave like long-term owners. At the date of this report, all senior executive KMP held approximately one year s FAR in Wesfarmers shares, with the majority holding signif icantly more. Directors are required to hold a minimum of 1,000 Wesfarmers shares within two months of appointment. Directors are also expected to increase their holdings in Wesfarmers shares to the equivalent of their annual main board fee within a f ive-year period of appointment. The following table sets out the number of shares held directly, indirectly or benef icially by directors and senior executives (including their related parties). 90
93 Remuneration report 2017 (audited) Overview Director and executive share and rights holdings Name Non-executive directors Balance of shares at beginning of year Shares granted as remuneration Net change in shares 1 Share balance at year-end 2 Number of shares and rights not vested at year-end 3 P M Bassat 19, ,411 - M A Chaney 87, ,597 - J P Graham 796, ,516 - A J Howarth 17, ,848 - W G Osborn 9, ,988 - D L Smith-Gander 12, ,045 - V M Wallace 13, ,483 - J A Westacott 1,957-2,000 3,957 - Executive directors, senior executives and former senior executives R J B Goyder 795,626 - (35,645) 759, ,928 T J Bowen 332,260 - (148,088) 184, ,079 R G Scott 240,575 69, , ,814 J P Durkan 51, ,764 (44,728) 118, ,543 J C Gillam 4 496,073 23, , ,724 G A Russo 328, ,726 (58,776) 379, ,459 M D Schneider ,358 24,358 20,786 Total 3,202, ,204 (259,809) 3,257,284 1,126,333 Operating and financial review Sustainability Governance 1 The net change may include changes due to personal trades, shares granted as remuneration and forfeited shares. 2 Where a director or senior executive has ceased to be a director or senior executive throughout the year, the balance at year-end reflects the number of shares as at the date they ceased to be a director or senior executive. 3 This number reflects the 2016 annual incentive mandatory deferral into shares (which were subject to forfeiture if the executive resigned prior to 26 August 2017), the 2014, 2015 and 2016 WLTIP allocations, which remain subject to performance conditions and the 2016 KEEPP Restricted Shares and Performance Shares, which remain subject to forfeiture and performance conditions, as applicable. 4 The information for J C Gillam reflects his time as a member of the KMP, up until 6 December The information for M D Schneider reflects his time as a member of the KMP, from 7 December Directors report 5.4 Share trading restrictions Wesfarmers Securities Trading Policy reflects the Corporations Act prohibition on key management personnel and their closely related parties entering into any arrangement that would have the effect of limiting the key management personnel s exposure to risk relating to an element of their remuneration that remains subject to restrictions on disposal. Wesfarmers directors, the Wesfarmers Leadership Team, and certain members of their immediate family and controlled entities are also required to obtain clearance from the Wesfarmers Company Secretary for the sale, purchase or transfer of Wesfarmers securities and for short selling, short-term trading, security interests, margin loans and hedging relating to Wesfarmers securities. The Wesfarmers Company Secretary refers all requests for clearance to at least two members of the Disclosure Committee. Clearance from the Chairman is also required for requests from Wesfarmers directors. Clearance cannot be requested for dealings that are subject to the Corporations Act prohibition referred to above. The policy is available on the Corporate Governance section of the company s website at Breaches of the policy are subject to disciplinary action, which may include termination of employment. Financial statements Signed reports 91 Shareholder and ASX information

94 Directors' report Remuneration report 2017 (audited) 6. Further information on remuneration 6.1 Service agreements The remuneration and other terms of employment for the Group Managing Director, the Group Chief F inancial Off icer and executive KMPs are covered in formal employment contracts. All service agreements are for unlimited duration and may be terminated immediately for serious misconduct. All executives are entitled to receive pay in lieu of any accrued but untaken annual and long service leave on cessation of employment. In the 2017 f inancial year, Wesfarmers amended certain key contractual arrangements for a number of Wesfarmers most senior executives. Mr Durkan, Mr Russo, Mr Scott and Mr Schneider must give a minimum 12 month's notice should they wish to resign. In addition, the restraint and non-solicitation clauses have been strengthened to further protect the business interests of the Wesfarmers Group. In return, Wesfarmers has agreed to give 12 month's notice should it wish to terminate employment (other than for cause). Mr Goyder must give a minimum 12 month's notice should he wish to resign. Mr Bowen is required to give six month's notice should he wish to resign. As previously announced, Mr Goyder and Mr Bowen s remuneration arrangements on retirement will be determined in line with their contractual entitlements. 6.2 Other transactions and balances with key management personnel Mr Bassat, a director of Wesfarmers, is a director of AFL Sportsready Limited which has provided training services to Wesfarmers Group companies on an arm's length and normal commercial terms basis and was paid $449,350 in Mr Graham, a director of Wesfarmers, has a majority shareholding interest in a company which jointly owns Gresham Partners Group Limited on an equal basis with a wholly owned subsidiary of Wesfarmers. Partly owned subsidiaries of Gresham Partners Group Limited have provided off ice accommodation and advisory services to Wesfarmers and were paid fees of $2,356,069 in 2017 (2016: $1,698,838). From time to time, directors of the company or its controlled entities, or their director-related entities, may purchase goods or services from the Group. These purchases are on the same terms and conditions as those entered into by other Group employees or customers and are minor or domestic in nature. There were no loans made during the year, or remaining unsettled at 30 June 2017, between Wesfarmers and its key management personnel and/or their related parties. 6.3 Independent audit of remuneration report The remuneration report has been audited by Ernst & Young. Please see page 144 of this annual report for Ernst & Young s report on the remuneration report. The directors report, including the remuneration report, is signed in accordance with a resolution of the directors of Wesfarmers Limited. M A Chaney AO Chairman Perth 19 September 2017 R J B Goyder AO Managing Director 92
95 Financial statements For the year ended 30 June 2017 Wesfarmers Limited and its controlled entities Overview Contents Financial statements Income statement Page 94 Statement of comprehensive income Page 95 Balance sheet Page 96 Cash flow statement Page 97 Statement of changes in equity Page 98 Operating and financial review Sustainability Notes to the financial statements About this report Page 99 Segment information Page 101 Key numbers Page 104 Capital Page 113 Risk Page 117 Group structure Page 127 Unrecognised items Page 132 Other Page 133 Governance 1. Income 10. Capital management 2. Expenses 11. Dividends and distributions 15. Financial risk management 18. Associates and joint arrangements 20. Commitments and contingencies 16. Hedging 19. Subsidiaries 21. Events after the reporting period 22. Parent disclosures 23. Deed of Cross Guarantee Directors report 3. Tax expense 12. Equity and reserves 17. Impairment of non-financial assets 24. Auditors remuneration 4. Cash and cash equivalents 13. Earnings per share 5. Receivables 14. Interestbearing loans and borrowings 25. Related party transactions 26. Other accounting policies Financial statements 6. Inventories 27. Share-based payments 7. Property, plant and equipment 28. Director and executive disclosures Signed reports 8. Goodwill and intangible assets 29. Tax transparency disclosures 9. Provisions 93 Shareholder and ASX information
96 Financial statements Income statement For the year ended 30 June 2017 CONSOLIDATED Note $m $m Revenue 1 Expenses Raw materials and inventory Employee benefits expense 2 Freight and other related expenses Occupancy-related expenses 2 Depreciation and amortisation 2 Impairment expenses 2 Other expenses 2 Total expenses Other income 1 Share of net profits of associates and joint venture 18 Earnings before interest and income tax expense (EBIT) Finance costs 2 Profit before income tax Income tax expense 3 Profit attributable to members of the parent Earnings per share attributable to ordinary equity holders of the parent 13 Basic earnings per share Diluted earnings per share 68,444 65,981 (46,359) (45,525) (9,132) (8,847) (1,096) (1,078) (3,229) (2,959) (1,266) (1,296) (49) (2,172) (3,346) (3,107) (64,477) (64,984) ,402 1,346 (264) (308) 4,138 1,038 (1,265) (631) 2,
97 Statement of comprehensive income For the year ended 30 June 2017 Financial statements CONSOLIDATED Note $m $m Profit attributable to members of the parent Other comprehensive income Items that may be reclassified to profit or loss: 2, Foreign currency translation reserve 12 Exchange differences on translation of foreign operations (2) 15 Cash flow hedge reserve 12 Unrealised losses on cash flow hedges (136) (34) Realised losses transferred to net profit Realised losses/(gains) transferred to non-financial assets 84 (257) Share of associates and joint venture reserves - 8 Tax effect 3,12 (17) 46 Items that will not be reclassified to profit or loss: Retained earnings 12 Remeasurement loss on defined benefit plan (5) (5) Tax effect Other comprehensive income/(loss) for the year, net of tax 18 (78) Total comprehensive income for the year, net of tax, attributable to members of the parent 2, About this report Capital Risk Segment information Key numbers Group structure Unrecognised items Other 95
98 Financial statements Balance sheet As at 30 June 2017 CONSOLIDATED Note $m $m Assets Current assets Cash and cash equivalents 4 Receivables - Trade and other 5 Receivables - Finance advances and loans 5 Inventories 6 Derivatives 16 Other Total current assets Non-current assets Investments in associates and joint venture 18 Deferred tax assets 3 Property 7 Plant and equipment 7 Goodwill 8 Intangible assets 8 Derivatives 16 Other Total non-current assets Total assets Liabilities Current liabilities Trade and other payables Interest-bearing loans and borrowings 14 Income tax payable Provisions 9 Derivatives 16 Other Total current liabilities Non-current liabilities Interest-bearing loans and borrowings 14 Provisions 9 Derivatives 16 Other Total non-current liabilities Total liabilities Net assets Equity Equity attributable to equity holders of the parent Issued capital 12 Reserved shares 12 Retained earnings 12 Reserves 12 Total equity 1, ,633 1, ,530 6, ,667 9, ,042 2,195 2,396 7,245 7,216 14,360 14,448 4,576 4, ,448 31,099 40,115 40,783 6,615 6,491 1,347 1, ,743 1, ,417 10,424 4,066 5,671 1,511 1, ,757 7,410 16,174 17,834 23,941 22,949 22,268 21,937 (26) (28) 1, ,941 22,949 96
99 Cash flow statement For the year ended 30 June 2017 Financial statements CONSOLIDATED Note $m $m Cash flows from operating activities Receipts from customers 74,042 71,157 Payments to suppliers and employees (68,713) (66,671) Net movement in finance advances and loans (47) (29) Dividends and distributions received from associates Interest received Borrowing costs (234) (288) Income tax paid (951) (1,009) Net cash flows from operating activities 4 4,226 3,365 Cash flows from investing activities Payments for property, plant and equipment and intangibles 4 (1,681) (1,899) Proceeds from sale of property, plant and equipment and intangibles Net proceeds from sale of businesses and associates Net investments in associates and joint arrangements (2) (2) Acquisition of subsidiaries, net of cash acquired (24) (748) Net redemption of/(investment in) loan notes 54 (47) Net cash flows used in investing activities (53) (2,132) Cash flows from financing activities Proceeds from borrowings 220 2,360 Repayment of borrowings (1,994) (1,424) Proceeds from exercise of in-substance options under the employee share plan Equity dividends paid (1,998) (2,270) Net cash flows used in financing activities (3,771) (1,333) Net increase/(decrease) in cash and cash equivalents 402 (100) Cash and cash equivalents at beginning of year Cash and cash equivalents at end of year 4 1, About this report Capital Risk Segment information Key numbers Group structure Unrecognised items Other 97
100 Financial statements Statement of changes in equity For the year ended 30 June 2017 Issued capital ATTRIBUTABLE TO EQUITY HOLDERS OF THE PARENT Reserved shares Retained earnings Hedging reserve Other reserves Consolidated Note $m $m $m $m $m $m Total equity Balance at 1 July 2015 Net profit for the year Other comprehensive income Exchange differences on translation of foreign operations 12 Changes in the fair value of cash flow hedges, net of tax 12 Remeasurement loss on defined benefit plan, net of tax 12 Total other comprehensive income/(loss) for the year, net of tax Total comprehensive income/(loss) for the year, net of tax Share-based payment transactions 12 Issue of shares 12 Proceeds from exercise of in-substance options 12 Equity dividends 12,11 Balance at 30 June 2016 and 1 July 2016 Net profit for the year Other comprehensive income Exchange differences on translation of foreign operations 12 Changes in the fair value of cash flow hedges, net of tax 12 Remeasurement loss on defined benefit plan, net of tax 12 Total other comprehensive income/(loss) for the year, net of tax Total comprehensive income/(loss) for the year, net of tax Share-based payment transactions 12 Issue of shares 12 Proceeds from exercise of in-substance options 12 Equity dividends 12,11 Balance at 30 June ,844 (31) 2,742 (15) , (90) - (90) - - (3) - - (3) - - (3) (90) 15 (78) (90) (2,272) - - (2,270) 93 3 (2,272) - 15 (2,161) 21,937 (28) 874 (105) , , , (2) (2) (3) - - (3) - - (3) 23 (2) , (2) 2, (2,235) - - (2,234) (2,235) - 3 (1,899) 22,268 (26) 1,509 (82) ,941 98
101 Notes to the financial statements: About this report For the year ended 30 June 2017 Financial statements About this report Wesfarmers Limited (referred to as Wesfarmers ) is a for-profit company limited by shares incorporated and domiciled in Australia whose shares are publicly traded on the Australian Securities Exchange. The nature of the operations and principal activities of Wesfarmers and its subsidiaries (referred to as the Group ) are described in the segment information. The consolidated general purpose financial report of the Group for the year ended 30 June 2017 was authorised for issue in accordance with a resolution of the directors on 19 September The Directors have the power to amend and reissue the financial report. The financial report is a general purpose financial report which: has been prepared in accordance with the requirements of the Corporations Act 2001, Australian Accounting Standards and other authoritative pronouncements of the Australian Accounting Standards Board (AASB) and International Financial Reporting Standards (IFRS) as issued by the International Accounting Standards Board (IASB); has been prepared on a historical cost basis, except for investments held by associates and certain financial instruments which have been measured at fair value. The carrying values of recognised assets and liabilities that are the hedged items in fair value hedge relationships, which are otherwise carried at amortised cost, are adjusted to record changes in the fair values attributable to the risks that are being hedged; is presented in Australian dollars with all values rounded to the nearest million dollars ($ 000,000) unless otherwise stated, in accordance with ASIC Corporations (Rounding in Financial/ Directors Reports) Instrument 2016/191; presents reclassified comparative information where required for consistency with the current year s presentation; adopts all new and amended Accounting Standards and Interpretations issued by the AASB that are relevant to the Group and effective for reporting periods beginning on or before 1 July Refer to note 26 for further details; does not early adopt Accounting Standards and Interpretations that have been issued or amended but are not yet effective with the exception of AASB 9 Financial Instruments (December 2010) as amended by (AASB 9 (2013)) including consequential amendments to other standards which was adopted on 1 July 2014; and equity accounts for associates and joint venture listed at note 18. Key judgements and estimates In the process of applying the Group s accounting policies, management has made a number of judgements and applied estimates of future events. Judgements and estimates which are material to the financial report are found in the following notes: Basis of consolidation The consolidated financial statements comprise the financial statements of the Group. A list of controlled entities (subsidiaries) at year-end is contained in note 19. The financial statements of subsidiaries are prepared for the same reporting period as the parent company, using consistent accounting policies. Adjustments are made to bring into line any dissimilar accounting policies that may exist. In preparing the consolidated financial statements, all inter-company balances and transactions, income and expenses and profits and losses resulting from intra-group transactions have been eliminated. Subsidiaries are consolidated from the date on which control is obtained to the date on which control is disposed. The acquisition of subsidiaries is accounted for using the acquisition method of accounting. Foreign currency The functional currencies of overseas subsidiaries are listed in note 19. As at the reporting date, the assets and liabilities of overseas subsidiaries are translated into Australian dollars at the rate of exchange ruling at the balance sheet date and the income statements are translated at the average exchange rates for the year. The exchange differences arising on the retranslation are taken directly to a separate component of equity. Transactions in foreign currencies are initially recorded in the functional currency at the exchange rates ruling at the date of the transaction. Monetary assets and liabilities denominated in foreign currencies are translated at the rate of exchange ruling at the balance sheet date. Exchange differences arising from the application of these procedures are taken to the income statement, with the exception of differences on foreign currency borrowings that provide a hedge against a net investment in a foreign entity, which are taken directly to equity until the disposal of the net investment and are then recognised in the income statement. Tax charges and credits attributable to exchange differences on those borrowings are also recognised in equity. Other accounting policies Significant and other accounting policies that summarise the measurement basis used and are relevant to an understanding of the financial statements are provided throughout the notes to the financial statements. About this report Segment information Key numbers Capital Risk Group structure Page 104 Note 1 Income 106 Note 3 Tax expense 108 Note 6 Inventories 109 Note 7 Property, plant and equipment 110 Note 8 Goodwill and intangible assets 111 Note 9 Provisions Unrecognised items 125 Note 17 Impairment of non-financial assets 127 Note 18 Associates and joint arrangements 132 Note 20 Commitments and contingencies Other 99
102 Financial statements Notes to the financial statements: About this report For the year ended 30 June 2017 The notes to the financial statements The notes include information which is required to understand the financial statements and is material and relevant to the operations, financial position and performance of the Group. Information is considered material and relevant if, for example: the amount in question is significant because of its size or nature; it is important for understanding the results of the Group; it helps to explain the impact of significant changes in the Group s business for example, acquisitions and impairment writedowns; or it relates to an aspect of the Group s operations that is important to its future performance. The notes are organised into the following sections: Key numbers: provides a breakdown of individual line items in the financial statements that the directors consider most relevant and summarises the accounting policies, judgements and estimates relevant to understanding these line items; Capital: provides information about the capital management practices of the Group and shareholder returns for the year; Risk: discusses the Group s exposure to various financial risks, explains how these affect the Group s financial position and performance and what the Group does to manage these risks; Group structure: explains aspects of the group structure and how changes have affected the financial position and performance of the Group; Unrecognised items: provides information about items that are not recognised in the financial statements but could potentially have a significant impact on the Group s financial position and performance; and Other: provides information on items which require disclosure to comply with Australian Accounting Standards and other regulatory pronouncements. However, these are not considered critical in understanding the financial performance or position of the Group. Significant items in the current reporting period Funding activities Borrowings - Proceeds A number of surplus bank facilities were cancelled during the year, resulting in a net reduction to available facilities of approximately $950 million. The remaining bank facilities that matured during the financial year were renewed and extended for periods ranging from one to three years. Borrowings - Repayments In November 2016, Australian bonds totalling $500 million matured. This was repaid using existing bank facilities and available cash balances. For further details refer to note 14 for the Group s debt profile. Coles credit card transaction The credit card receivables have been derecognised in Refer to note 5 for further details. Business combinations In February 2016, Wesfarmers acquired 100 per cent of Home Retail Group plc s holding in Homebase for 340 million (A$665 million). Homebase is based in the United Kingdom (UK) and operates as a home improvement and garden retail business in the UK and Republic of Ireland. As at 30 June 2016, the acquisition accounting balances recognised were provisional due to ongoing work finalising valuations and tax related matters which may affect acquisition accounting entries. There have been no changes to the provisional fair values of the identifiable assets acquired and liabilities assumed at the date of acquisition from those disclosed in the 30 June 2016 financial statements. As described in the 2016 financial statements, it was not practicable to determine the profit of the Group had the combination taken place at 1 July 2015, as the fair value of the identifiable assets and liabilities was not known at that date. Assuming that the same fair values detailed in the 2016 financial statements were applied at 1 July 2015, the profit for the comparative year ended 30 June 2016 of the Group would not have been materially different from that reported. 100
103 Notes to the financial statements: Segment information For the year ended 30 June 2017 Financial statements The Group s operating segments are organised and managed separately according to the nature of the products and services provided. Each segment represents a strategic business unit that offers different products and operates in different industries and markets. The Board and executive management team (the chief operating decision-makers) monitor the operating results of the business units separately for the purpose of making decisions about resource allocation and performance assessment. The types of products and services from which each reportable segment derives its revenues are disclosed below. Segment performance is evaluated based on operating profit or loss (segment result), which in certain respects, is presented differently from operating profit or loss in the consolidated financial statements. Interest income and expenditure are not allocated to operating segments, as this type of activity is managed on a group basis. Transfer prices between business segments are set on an arm s length basis in a manner similar to transactions with third parties. Segment revenue, expenses and results include transfers between business segments. Those transfers are eliminated on consolidation and are not considered material. The operating segments and their respective types of products and services are as follows: Retail Coles Supermarket and liquor retailer, including a hotel portfolio; Retailer of fuel and operator of convenience stores; Financial services agent, including insurance and credit cards (Coles credit card receivables were disposed on 1 February 2017); and Coles property business operator. Home Improvement Retailer of building material and home and garden improvement products; and Servicing project builders and the housing industry. Officeworks Retailer and supplier of office products and solutions for home, small to medium-sized businesses and education. Department Stores Kmart Retailer of apparel and general merchandise, including toys, leisure, entertainment, home and consumables; and Provision of automotive service, repairs and tyre service. Target Retailer of apparel, homewares and general merchandise, including accessories, electricals and toys L Revenues by segment for FY2017 $m Coles 39,217 Home Improvement 13,586 Department stores 8,528 Officeworks 1,964 Industrials 5,161 Industrials Resources Coal mining and development; and Coal marketing to both domestic and export markets. Industrial and Safety (WIS) Supplier and distributor of maintenance, repair and operating products; Manufacturer and marketing of industrial gases and equipment; Supplier, manufacturer and distributor of workwear clothing in Australia and internationally; Specialised supplier and distributor of industrial safety products and services; and Provider of risk management and compliance services. Chemicals, Energy and Fertilisers (WesCEF) Manufacturer and marketing of chemicals for industry, mining and mineral processing; Manufacturer and marketing of broadacre and horticultural fertilisers; National marketing and distributor of LPG and LNG; and LPG and LNG extraction for domestic and export markets. Other Includes: Forest products: non-controlling interest in Wespine Pty Ltd; Property: non-controlling interest in BWP Trust; Investment banking: non-controlling interest in Gresham Partners Group Limited; Private equity investment: non-controlling interests in Gresham Private Equity Fund No. 2; and Corporate: includes treasury, head office, central support functions and other corporate entity expenses. Corporate is not considered an operating segment and includes activities that are not allocated to other operating segments. Seasonality Revenue and earnings of various businesses are affected by seasonality and cyclicality as follows: For retail divisions, earnings are typically greater in the December half of the financial year due to the impact of the Christmas holiday shopping period; For Resources, the majority of the entity s coal contracted tonnages are renewed on an annual basis from April each calendar year; and For Chemicals, Energy and Fertilisers, earnings are typically greater in the second half of the financial year due to the impact of the Western Australian winter season break on fertiliser sales. Seasonality of revenues in FY2017 % Jul to Dec Retail Resources Chemicals, Energy and Fertilisers Jan to Jun Group About this report Capital Risk Segment information Key numbers Group structure Unrecognised items Other 101
104 Financial statements Notes to the financial statements: Segment information For the year ended 30 June 2017 Segment information (continued) DEPARTMENT STORES COLES HOME IMPROVEMENT 1 KMART TARGET $m $m $m $m $m $m $m $m Segment revenue Adjusted EBITDA 5 Depreciation and amortisation Segment result Items not included in segment result 6 EBIT Finance costs Profit before income tax expense Income tax expense 39,217 39,242 13,586 11,571 5,578 5,190 2,950 3,456 2,256 2,475 1,463 1, (105) (647) (615) (218) (169) (112) (101) (84) (90) 1,609 1,860 1,245 1, (10) (195) (1,266) Profit attributable to members of the parent Other segment information Segment assets Investments in associates and joint venture Tax assets Total assets Segment liabilities Tax liabilities Interest-bearing liabilities Total liabilities Other net assets 7 Net assets Capital expenditure 8 Share of net profit or loss of associates and joint venture included in EBIT 21,140 22,122 6,612 6,620 2,410 2,324 1,518 1, (4,245) (4,273) (2,227) (2,186) (955) (857) (468) (479) (209) (1,409) (4,266) (4,237) (379) (488) 16,686 16, ,692 1, The Home Improvement result includes the UK operation acquired on 27 February The 2016 Target result includes $145 million of restructuring costs and provisions incurred to reset Target. 3 The Resources result includes Government royalties and Stanwell rebates of $262 million (2016: $143 million) and hedge losses of $92 million (2016: $147 million). 4 The 2017 WesCEF result includes profit on sale of land of $22 million (before tax) and $33 million relating to WesCEF s share of revaluation gains recognised by its associate, Australian Energy Consortium Pty Ltd. 5 Adjusted EBITDA represents earnings before interest, tax, depreciation, amortisation and other items not included in the segment results outlined in footnote 6. 6 The 2016 segment result excludes $1,266 million impairment of Target s goodwill and non-current assets and $850 million impairment of Curragh s assets. 7 Other net assets relate predominantly to inter-company financing arrangements and segment tax balances. 8 Capital expenditure includes accruals to represent costs incurred during the year. The amount excluding movement in accruals is $1,681 million (2016: $1,899 million). Segment result FY2013 to FY2017 $m 2,000 1,800 1,600 1,400 1, FY2013 to FY2016 FY Coles Home Improvement Department Stores Officeworks Industrials 102
105 Notes to the financial statements: Segment information For the year ended 30 June 2017 Financial statements INDUSTRIALS OFFICEWORKS RESOURCES 3 WIS WesCEF 4 OTHER CONSOLIDATED $m $m $m $m $m $m $m $m $m $m $m $m 1,964 1,851 1,746 1,008 1,776 1,844 1,639 1,820 (12) (1) 68,444 65, (164) (53) (63) 5,668 4,758 (24) (22) (60) (146) (43) (42) (77) (106) (1) (5) (1,266) (1,296) (310) (54) (68) 4,402 3, (850) (2,116) 4,402 1,346 (264) (308) 4,138 1,038 (1,265) (631) 2, ,401 1,379 1,084 1,004 1,661 1,663 1,484 1,553 1, ,441 39, , ,042 40,115 40,783 (488) (416) (470) (498) (385) (420) (270) (303) (961) (1,070) (10,469) (10,502) (292) (29) (292) (29) (5,413) (7,303) (5,413) (7,303) (16,174) (17,834) (25) 31 (1,090) (1,202) (585) (581) (793) (869) 7,110 8, (476) (696) ,049 2,490 23,941 22, ,683 1, Capital expenditure by segment for FY K $m Coles 811 HI 445 Kmart 154 Target 68 $m Officeworks 36 Resources 91 WIS 34 WesCEF 44 Geographical information The table below provides information on the geographical location of revenue and non-current assets (other than financial instruments, deferred tax assets and pension assets). Revenue from external customers is allocated to a geography based on the location of the operation in which it was derived. Non-current assets are allocated based on the location of the operation to which they relate. NON-CURRENT REVENUE ASSETS $m $m $m $m Australia 64,532 63,356 27,715 27,933 New Zealand 1,774 1, United Kingdom 2,119 1,052 1,114 1,133 Other foreign countries ,444 65,981 29,136 29,348 About this report Capital Risk Segment information Key numbers Group structure Unrecognised items Other 103
106 Financial statements Notes to the financial statements: Key numbers For the year ended 30 June Income Sale of goods Rendering of services Interest revenue Other Revenue Gains on disposal of property, plant and equipment Other Other income CONSOLIDATED $m $m 68,003 65, ,444 65, Recognition and measurement Revenue Revenue is measured at the fair value of the consideration received or receivable. Revenue is recognised if it meets the criteria outlined below. Sale of goods The Group generates a significant proportion of its revenue from the sale of the following finished goods: Merchandise direct to customers through the Group s retail operations; Sales to other businesses of products for which the Group has distribution rights, principally related to industrial maintenance and industrial safety; Fertilisers and specialty gases; Coal, both nationally and internationally; and LPG and LNG. Revenue is recognised when the significant risks and rewards of ownership of the goods have passed to the buyer and it can be measured reliably. Risks and rewards are considered passed to the buyer at the time of delivery of the goods to the customer. Revenue from lay-by transactions is recognised on the date when the customer completes payment and takes possession of the merchandise. Rendering of services With respect to services rendered, revenue is recognised depending on the stage of completion of those services. Interest The Group generated a significant proportion of its interest revenue from finance advances and loans through the Group s financial services operation. The Group s finance advances and loans consisted of the Coles credit card receivables and were disposed of on 1 February Operating lease rental revenue Operating lease revenue consists of rentals from investment properties and sub-lease rentals. Rentals received under operating leases and initial direct costs are recognised on a straight-line basis over the term of the lease. Key estimate: loyalty program The Group operates a loyalty points program, which allows customers to accumulate points when they purchase products in the Group s retail stores. The points can then be redeemed for products, subject to a minimum number of points being obtained. Consideration received on transactions where points are issued is allocated between the products sold and the points issued. The fair value of the points issued is deferred and recognised as revenue when the points are redeemed. At 30 June 2017, $267 million of revenue is deferred in relation to the loyalty program (2016: $246 million). Any reasonably possible change in the estimate is unlikely to have a material impact. Key estimate: gift cards Revenue from the sale of gift cards is recognised when the card is redeemed and the customers purchase goods by using the card, or when the customer card is no longer expected to be redeemed. At 30 June 2017, $217 million of revenue is deferred in relation to gift cards (2016: $198 million). The key assumption in measuring the liability for gift cards and vouchers is the expected redemption rates by customers, which are reviewed annually based on historical information. Any reassessment of expected redemption rates in a particular year impacts the revenue recognised from expiry of gift cards and vouchers (either increasing or decreasing). Any reasonably possible change in the estimate is unlikely to have a material impact. Total revenue From continuing operations $m 75,000 50, FY17 $68,444m 3.7% $m FY17 68,444 FY16 65,981 FY15 62,447 FY14 60,181 FY13 57,749 Revenue is recognised as the interest accrues on the related financial asset. Interest is determined using the effective interest rate method, which applies the interest rate that exactly discounts estimated future cash receipts over the expected life of the financial instrument. Dividends Revenue from dividends is recognised when the Group s right to receive the payment is established. 104
107 Notes to the financial statements: Key numbers For the year ended 30 June 2017 Financial statements 2. Expenses Remuneration, bonuses and on-costs Superannuation expense Share-based payments expense Employee benefits expense Minimum lease payments Contingent rental payments Other Occupancy-related expenses Depreciation Amortisation of intangibles Amortisation other Depreciation and amortisation Impairment of plant, equipment and other assets Impairment of freehold property Impairment of goodwill Impairment expenses Mining royalties (including Stanwell rebate) Repairs and maintenance Utilities and office expenses Insurance expenses Other Other expenses Interest expense Discount rate adjustment Amortisation of debt establishment costs Other costs related to finance Finance costs CONSOLIDATED $m $m 8,392 8, ,132 8,847 2,399 2, ,229 2, ,266 1, , , ,106 1, ,410 1,336 3,346 3, Recognition and measurement Employee benefits expense The Group s accounting policy for liabilities associated with employee benefits is set out in note 9. The policy relating to share based payments is set out in note 27. The majority of employees in Australia and New Zealand are party to a defined contribution scheme and receive fixed contributions from Group companies and the Group s legal or constructive obligation is limited to these contributions. Contributions to defined contribution funds are recognised as an expense as they become payable. Prepaid contributions are recognised as an asset to the extent that a cash refund or a reduction in the future payment is available. The Group also operates a defined benefit superannuation scheme, the membership of which is now closed. Employee benefits expense by segment $ m 10,000 9,000 8,000 7,000 6,000 Coles Occupancy-related expenses Operating leases Operating lease payments are recognised as an expense in the income statement on a straight-line basis over the lease term. Operating lease incentives are recognised as a liability when received and released to the income statement on a straight-line basis over the lease term. Fixed rate increases to lease payments, excluding contingent or index based rental increases, are recognised on a straight-line basis over the lease term. An asset or liability is recognised for the difference between the amount paid and the lease expense recognised in earnings on a straight-line basis. Contingent rental payments Contingent rental payments are made as a result of either turnover based rentals or movements in relevant indices. Such payments are recognised in the income statement as they are incurred. Occupancy-related expenses by segment $ m 4,000 3,500 3,000 2,500 2,000 1,500 1, FY2017 FY2016 Coles Home Improvement Officeworks Industrials Department stores Depreciation and amortisation Refer to notes 7 and 8 for details on depreciation and amortisation. Impairment Impairment expenses are recognised to the extent that the carrying amounts of assets exceed their recoverable amounts. Refer to note 17 for further details on impairment. Finance costs Finance costs are recognised as an expense when they are incurred, except for interest charges attributable to major projects with substantial development and construction phases. Provisions and other payables are discounted to their present value when the effect of the time value of money is significant. The impact of the unwinding of these discounts and any changes to the discounting is shown as a discount rate adjustment in finance costs. Capitalisation of borrowing costs To determine the amount of borrowing costs to be capitalised as part of the costs of major construction projects, the Group uses the weighted average interest rate (excluding non-interest costs) applicable to its outstanding borrowings during the year. For 2017, had there been major long-term construction projects, the weighted average interest rate applicable would have been 3.64 per cent (2016: 4.15 per cent). About this report Capital Risk Segment information Key numbers Group structure Unrecognised items 5,000 Home Improvement 4,000 3,000 Officeworks 2,000 1,000 0 FY2017 FY2016 Industrials Department stores Other 105
108 Financial statements Notes to the financial statements: Key numbers For the year ended 30 June Tax expense CONSOLIDATED The major components of tax expense are: $m $m Income statement Current income tax expense Current year (paid or payable) 1, Adjustment for prior years (7) (7) Deferred income tax expense Temporary differences 37 (342) Adjustment for prior years 7 (4) Income tax reported in the income statement 1, Statement of changes in equity Net loss on revaluing cash flow hedges 17 (46) Other (2) (2) Income tax reported in equity 15 (48) Tax reconciliation Profit before tax 4,138 1,038 Income tax at the statutory tax rate of 30% 1, Adjustments relating to prior years - (11) Non-deductible items Share of results of associates and joint venture (18) (22) Effect of differences and changes in tax rate in UK 20 1 Other 10 (10) Income tax on profit before tax 1, Recognition and measurement Current taxes Current tax assets and liabilities are measured at the amount expected to be recovered from or paid to taxation authorities at the tax rates and tax laws enacted or substantively enacted by the balance sheet date. Deferred taxes Deferred income tax liabilities are recognised for all taxable temporary differences. Deferred income tax assets are recognised for all deductible temporary differences, carried forward unused tax assets and unused tax losses, to the extent it is probable that taxable profit will be available to utilise them. The carrying amount of deferred income tax assets is reviewed at balance sheet date and reduced to the extent that it is no longer probable that sufficient taxable profit will be available to utilise them. Deferred income tax assets and liabilities are measured at the tax rates that are expected to apply to the year when the asset is realised or the liability is settled, based on tax rates and tax laws that have been enacted or substantively enacted at the balance sheet date. Deferred income tax is provided on temporary differences at balance sheet date between accounting carrying amounts and the tax bases of assets and liabilities, other than for the following: Where they arise from the initial recognition of an asset or liability in a transaction that is not a business combination and at the time of the transaction, affects neither the accounting profit nor taxable profit or loss. Where taxable temporary differences relate to investments in subsidiaries, associates and interests in joint ventures: Deferred income tax in the balance sheet relates to the following: Provisions Employee benefits Accrued and other payables Borrowings Derivatives Trading stock Fixed assets Other individually insignificant balances Deferred tax assets Accelerated depreciation for tax purposes Derivatives Accrued income and other Intangible assets Other individually insignificant balances Deferred tax liabilities Net deferred tax assets Deferred income tax in the income statement relates to the following: Provisions Depreciation, amortisation and impairment Other individually insignificant balances Deferred tax expense Refer to note 29 for tax transparency disclosures ,693 1, ,042 - (61) 10 (239) 27 (42) 37 (342) 1. Deferred tax liabilities are not recognised if the timing of the reversal of the temporary differences can be controlled and it is probable that the temporary differences will not reverse in the foreseeable future. 2. Deferred tax assets are not recognised if it is not probable that the temporary differences will reverse in the foreseeable future and taxable profit will not be available to utilise the temporary differences. Deferred tax liabilities are also not recognised on recognition of goodwill. Income taxes relating to items recognised directly in equity are recognised in equity and not in the income statement. Offsetting deferred tax balances Deferred tax assets and deferred tax liabilities are offset only if a legally enforceable right exists to set off current tax assets against current tax liabilities and the deferred tax assets and liabilities relate to the same taxable entity and the same taxation authority. Key estimate: unrecognised deferred tax assets Capital losses: The Group has unrecognised benefits relating to carried forward capital losses, which can only be offset against eligible capital gains. The Group has determined that at this stage future eligible capital gains to utilise the tax assets are not currently sufficiently probable. The unrecognised deferred tax assets of $127 million (2016: $130 million) relate wholly to capital losses in Australia. Key judgement: unrecognised deferred tax liability A deferred tax liability has not been recognised on indefinite life intangibles for which the carrying value has been assessed as recoverable through sale, consistent with the Group s practice and strategy to maximise shareholder returns. 106
109 Notes to the financial statements: Key numbers For the year ended 30 June 2017 Financial statements 4. Cash and cash equivalents Cash on hand and in transit Cash at bank and on deposit Reconciliation of net profit after tax to net cash flows from operations Net profit Non-cash items Depreciation and amortisation Impairment and writedowns of assets Net gain on disposal of non-current assets Share of profits of associates and joint venture Dividends and distributions received from associates Discount adjustment in borrowing costs Other (Increase)/decrease in assets Receivables - Trade and other Receivables - Finance advances and loans Inventories Prepayments Deferred tax assets Other assets Increase/(decrease) in liabilities Trade and other payables Current tax payable Provisions Other liabilities Net cash flows from operating activities Net cash capital expenditure Cash capital expenditure Payment for property Payment for plant and equipment Payment for intangibles Less: Proceeds from sale of property, plant, equipment and intangibles Net cash capital expenditure Recognition and measurement Cash at bank and on deposit CONSOLIDATED $m $m , , ,266 1, ,172 (83) (22) (147) (114) (47) (29) (296) (444) 18 (39) 39 (347) 5 (5) (31) (146) ,226 3, ,251 1, ,681 1, ,028 1,336 Cash and short-term deposits in the balance sheet comprise cash at bank and on hand, and short-term deposits with an original maturity of three months or less and are classified as financial assets held at amortised cost. Cash at bank earns interest at floating rates based on daily bank deposit rates. Short-term deposits are made for varying periods of between one day and three months, depending on the immediate cash requirements of the Group, and earn interest at the respective short-term deposit rates. 5. Receivables Trade and other Trade receivables Allowance for credit losses Other debtors Allowance for credit losses Movements in the allowance for credit losses were as follows: Carrying value at the beginning of the year Allowance for credit losses recognised Receivables written off as uncollectable Unused amounts reversed Allowance for credit losses at year-end Trade receivables past due but not impaired Under three months Three to six months Over six months Finance advances and loans Finance advances and loans Allowance for credit losses CONSOLIDATED $m $m 1,300 1,288 (60) (64) ,633 1, (15) (8) (5) (4) (48) On 1 February 2017, Wesfarmers entered into a ten-year agreement with Citi for the distribution of Coles branded credit cards in exchange for an ongoing share of risk-adjusted revenues. As part of the transaction, Citi acquired the Coles credit card receivables. As of 30 June 2016, the entirety of the finance advances and loans balance consisted of the Coles credit card receivables. Aging of trade receivables past due but not impaired L L $ m $ m Under three months Three to six months Over six months About this report Capital Risk Segment information Key numbers Group structure Unrecognised items Other 107
110 Financial statements Notes to the financial statements: Key numbers For the year ended 30 June Receivables (continued) 6. Inventories Recognition and measurement Trade receivables, finance advances, loans and other debtors are all classified as financial assets held at amortised cost. CONSOLIDATED $m $m Trade receivables Trade receivables generally have terms of up to 30 days. They are recognised initially at fair value and subsequently at amortised cost using the effective interest method, less an allowance for impairment. Customers who wish to trade on credit terms are subject to extensive credit verification procedures. Receivable balances are monitored on an ongoing basis and the Group s exposure to bad debts is not significant. With respect to trade receivables that are neither impaired nor past due, there are no indications as of the reporting date that the debtors will not meet their payment obligations. Impairment of trade receivables Collectability and impairment are assessed on an ongoing basis at a divisional level. Impairment is recognised in the income statement when there is objective evidence that the Group will not be able to collect the debts. Financial difficulties of the debtor, probability that the debtor will enter bankruptcy or financial reorganisation and default or delinquency in payments are considered objective evidence of impairment. The amount of the impairment loss is the receivable carrying amount compared to the present value of estimated future cash flows, discounted at the original effective interest rate. Cash flows relating to short-term receivables are not discounted if the effect of discounting is immaterial. Debts that are known to be uncollectable are written off when identified. If an impairment allowance has been recognised for a debt that then becomes uncollectable, the debt is written off against the allowance account. If an amount is subsequently recovered, it is credited against profit or loss. Other debtors These amounts generally arise from transactions outside the usual operating activities of the Group. They do not contain impaired assets and are not past due. Based on the credit history, it is expected that these other balances will be received when due. Raw materials Work in progress Finished goods ,424 6,150 6,530 6,260 Inventories recognised as an expense for the year ended 30 June 2017 totalled $49,083 million (2016: $48,182 million). Recognition and measurement Inventories are valued at the lower of cost and net realisable value. The net realisable value of inventories is the estimated selling price in the ordinary course of business less estimated costs to sell. Key estimate: net realisable value The key assumptions, which require the use of management judgement, are the variables affecting costs recognised in bringing the inventory to their location and condition for sale, estimated costs to sell and the expected selling price. These key assumptions are reviewed at least annually. The total expense relating to inventory writedowns during the year was $11 million (2016: $50 million). Any reasonably possible change in the estimate is unlikely to have a material impact. Costs incurred in bringing each product to its present location and condition are accounted for as follows: Raw materials: purchase cost on a weighted average basis. Manufactured finished goods and work in progress: cost of direct materials and labour and a proportion of manufacturing overheads based on normal operating capacity, but excluding borrowing costs. Work in progress also includes run-of-mine coal stocks for Resources, consisting of production costs of drilling, blasting and overburden removal. Retail and wholesale merchandise finished goods: purchase cost on a weighted average basis, after deducting any settlement discounts, supplier rebates and including logistics expenses incurred in bringing the inventories to their present location and condition. Volume-related supplier rebates, and supplier promotional rebates where they exceed spend on promotional activities, are accounted for as a reduction in the cost of inventory and recognised in the income statement when the inventory is sold. Key estimate: supplier rebates The recognition of supplier rebates in the income statement requires management to estimate both the volume of purchases that will be made during a period of time and the related product that was sold and remains in inventory at reporting date. Management s estimates are based on existing and forecast inventory turnover levels and sales. Reasonably possible changes in these estimates are unlikely to have a material impact. 108
111 Notes to the financial statements: Key numbers For the year ended 30 June 2017 Financial statements 7. Property, plant and equipment Consolidated Year ended 30 June 2017 Cost Accumulated depreciation and impairment Net carrying amount Movement Net carrying amount at the beginning of the year Additions Disposals and write-offs Depreciation and amortisation Acquisition of controlled entities Transfers between classes Other including foreign exchange movements Net carrying amount at the end of the year Assets under construction included above: Year ended 30 June 2016 Cost Accumulated depreciation and impairment Net carrying amount Movement Net carrying amount at the beginning of the year Additions Disposals and write-offs Depreciation and amortisation Acquisition of controlled entities Transfers between classes Other including foreign exchange movements Net carrying amount at the end of the year PROPERTY PLANT AND EQUIPMENT Freehold land Buildings Leasehold improvements Plant, vehicles and equipment Mineral lease and development Total $m $m $m $m $m $m 1,334 1,035 1,773 13,544 1,010 18,696 - (174) (860) (7,679) (543) (9,256) 1, , ,440 1, , , , ,559 (205) (285) (12) (113) - (615) - (26) (127) (933) (22) (1,108) (5) (2) (8) - (3) (17) (30) 1, , , ,470 1,082 1,682 12, ,090 - (156) (757) (7,030) (535) (8,478) 1, , ,612 1, , , , ,738 (247) (252) (81) (684) (182) (1,446) - (26) (124) (959) (53) (1,162) (6) (19) - (5) , , ,612 About this report Capital Risk Segment information Key numbers Assets under construction included above: Recognition and measurement The carrying value of property, plant and equipment is measured as the cost of the asset, minus depreciation and impairment. The cost of the asset also includes the cost of replacing parts that are eligible for capitalisation, and the cost of major inspections. Depreciation and amortisation Items of property, plant and equipment are depreciated on a straight-line basis over their useful lives. The estimated useful life of buildings is between 20 and 40 years; plant and equipment is between 3 and 40 years. Land is not depreciated. Expenditure on mining areas of interest in which production has commenced is amortised over the life of the mine, based on the rate of depletion of the economically recoverable reserves. If production has not yet commenced, amortisation is not charged. Leasehold improvements are amortised over the period of the lease or the anticipated useful life of the improvements, whichever is shorter. Derecognition An item of property, plant and equipment is derecognised when it is sold or otherwise disposed of, or when its use is expected to bring no future economic benefits. Any gain or loss from derecognising the asset (the difference between the proceeds of disposal and the carrying amount of the asset) is included in the income statement in the period the item is derecognised. Impairment Refer to note 17 for details on impairment testing. Key estimates: property, plant and equipment The estimations of useful lives, residual value and amortisation methods require management judgement and are reviewed annually. If they need to be modified, the change is accounted for prospectively from the date of reassessment until the end of the revised useful life (for both the current and future years). Such revisions are generally required when there are changes in economic circumstances impacting specific assets or groups of assets, such as changes in store performance or changes in the long-term coal price forecasts. These changes are limited to specific assets and as such, any reasonably possible change in the estimate is unlikely to have a material impact on the estimations of useful lives, residual value or amortisation methods. Group structure Unrecognised items Other 109
112 Financial statements Notes to the financial statements: Key numbers For the year ended 30 June Goodwill and intangible assets Consolidated GOODWILL INTANGIBLE ASSETS Contractual Goodwill Brand and noncontractual relationships 1 Software Gaming and liquor licences Total $m $m $m $m $m $m Year ended 30 June 2017 Cost Accumulated amortisation and impairment Net carrying amount Movement Net carrying amount at the beginning of the year Additions Disposals and write-offs Amortisation for the year Other including foreign exchange movements Net carrying amount at the end of the year 16,468 3, , ,860 (2,108) (24) (27) (765) - (2,924) 14,360 3, ,936 14,448 3, , (48) - - (12) - (60) - (3) (15) (140) - (158) (40) (2) - (1) - (43) 14,360 3, ,936 Year ended 30 June 2016 Cost Accumulated amortisation and impairment Net carrying amount 16,556 3, , ,968 (2,108) (21) (28) (738) - (2,895) 14,448 3, ,073 Movement Net carrying amount at the beginning of the year 14,708 3, ,309 Additions Acquisition/(disposal) of controlled entities 1, ,069 Amortisation for the year - (2) (11) (121) - (134) Impairment charge (1,208) - - (6) (1) (1,215) Other including foreign exchange movements (70) (2) (2) (2) - (76) Net carrying amount at the end of the year 14,448 3, ,073 1 Contractual and non-contractual relationships are intangible assets that have arisen through business combinations. They represent the value of pre-existing customer relationships in the acquired company. Recognition and measurement Goodwill Goodwill acquired in a business combination is initially measured at cost. Cost is measured as the cost of the business combination minus the net fair value of the acquired and identifiable assets, liabilities and contingent liabilities. Following initial recognition, goodwill is measured at cost less any accumulated impairment losses. Refer to note 17 for further details on impairment. Intangible assets Intangible assets acquired separately are measured on initial recognition at cost. The cost of intangible assets acquired in a business combination is their fair value at the date of acquisition. Following initial recognition, intangible assets are carried at cost less amortisation and any impairment losses. Intangible assets with finite lives are amortised on a straight-line basis over their useful lives and tested for impairment whenever there is an indication that they may be impaired. The amortisation period and method is reviewed at each financial year-end. Intangible assets with indefinite lives are tested for impairment in the same way as goodwill. A summary of the useful lives of intangible assets is as follows: Intangible asset Useful life Brand 1 Indefinite and finite (up to 20 years) Contractual and non-contractual Finite (up to 15 years) relationships Software Finite (up to seven years) Gaming and liquor licences Indefinite 1 Includes trade names and other intangible assets with characteristics of a brand. Assets with an assumed indefinite useful life are reviewed at each reporting period to determine whether this assumption continues to be appropriate. If not, it is changed to a finite life and accounted for prospectively as a change in accounting estimate. Key judgement: useful lives of intangible assets Certain brands have been assessed as having indefinite lives on the basis of strong brand strength, ongoing expected profitability and continuing support. The brand incorporates complementary assets such as store formats, networks and product offerings. Gaming and liquor licences have been assessed as having indefinite lives on the basis that the licences are expected to be renewed in line with business continuity requirements. 110
113 Notes to the financial statements: Key numbers For the year ended 30 June 2017 Financial statements 8. Goodwill and intangible assets (continued) Allocation of indefinite life intangible assets to groups of cash-generating units Carrying amount of intangibles Home Improvement Officeworks Industrial and Safety Coles Kmart Target Allocation of goodwill to groups of cash generating units Carrying amount of goodwill Chemicals, Energy and Fertilisers Home Improvement Officeworks Industrial and Safety Coles Kmart Target Impairment Refer to note 17 for details on impairment testing. CONSOLIDATED $m $m ,962 2, ,944 3, ,692 1, ,375 10, ,360 14, Provisions Current Employee benefits Self-insured risks Restructuring and make good Lease provision Off-market contracts Other Non-current Employee benefits Self-insured risks Mine and plant rehabilitation Restructuring and make good Lease provision Off-market contracts Other Total provisions Recognition and measurement Provisions are recognised when: CONSOLIDATED $m $m 1,150 1, ,743 1, ,511 1,554 3,254 3,415 the Group has a present obligation (legal or constructive) as a result of a past event; it is probable that resources will be expended to settle the obligation; and a reliable estimate can be made of the amount of the obligation. About this report Capital Risk Segment information Key numbers Key estimate: discounting Provisions are determined by discounting the expected future cash flows at a pre-tax rate that reflects current market assessments of the time value of money and the risks specific to the liability to the extent they are not included in the cash flows. Provisions have been calculated using discount rates of between 2 and 4.5 per cent (2016: between 2 and 4 per cent). Key estimate: employee benefits Group structure Employee benefit provision balances are calculated using discount rates derived from the high quality corporate bond (HQCB) market in Australia provided by Milliman Australia. Unrecognised items Other 111
114 Financial statements Notes to the financial statements: Key numbers For the year ended 30 June Provisions (continued) Employee benefits The provision for employee benefits represents annual leave, long service leave entitlements and incentives accrued by employees. Wages and salaries Liabilities for wages and salaries, including non-monetary benefits expected to be settled within 12 months of the reporting date, are recognised in provisions and other payables in respect of employees services up to the reporting date. They are measured at the amounts expected to be paid when the liabilities are settled. Annual leave and long service leave The liability for annual leave and long service leave is recognised in the provision for employee benefits. It is measured as the present value of expected future payments for the services provided by employees up to the reporting date. Expected future payments are discounted using market yields at the reporting date on HQCB with terms to maturity and currencies that match, as closely as possible, the estimated future cash outflows. Key estimate: long service leave Long service leave is measured using the projected unit credit method. Management judgement is required in determining the following key assumptions used in the calculation of long service leave at balance sheet date: future increases in salaries and wages; future on-cost rates; and future probability of employee departures and period of service. The total long service leave liability is $606 million (2016: $586 million). Given the magnitude of the liability and the nature of the key assumptions, any reasonably possible change in one or a combination of the estimates is unlikely to have a material impact. Lease provision The lease provision covers stepped lease arrangements to enable the lease expenses to be recognised on a straight-line basis over the lease term. Actual lease payments may vary from the amounts provided where alternate uses are found for these premises, including attraction of new tenants. The obligation for discounted future above-market payments are provided for, calculated using the discount rate determined at acquisition date. The discounted future above-market provision is released to earnings over the duration of the contract. Self-insured risks The Group is self-insured for workers compensation and general liability claims. Provisions are recognised based on claims reported, and an estimate of claims incurred but not reported. These provisions are determined on a discounted basis, using an actuarially determined method. Key estimate: self-insured risks The self-insured risk liability is based on a number of management estimates including, but not limited to: future inflation; investment return; average claim size; claim development; and claim administration expenses. These assumptions are reviewed periodically and any reassessment of these assumptions will affect workers compensation or claims expense (either increasing or decreasing the expense). Any reasonable change in these assumptions will not have significant impact on the Group. Mine and plant rehabilitation Mining lease agreements and Group policies impose obligations to remediate areas where mining activity has taken place. Work is ongoing at various sites and in some cases will extend for more than 15 years. Provisions for remediation have been calculated assuming current technologies. As part of the valuation methodology, the risks are incorporated in the cash flows rather than the discount rates. Restructuring and make good These provisions relate principally to: the closure of retail outlets or distribution centres; restructuring; and associated redundancies. Off-market contracts When undertaking business acquisitions, Wesfarmers often takes on responsibility for contracts that are in place within the acquiree. Changes in market conditions may result in the original terms of the contract becoming unfavourable in comparison to market conditions present at the date of acquisition. Consolidated Lease provision Off-market contracts Provisions for restructuring are recognised where steps have been taken to implement a detailed plan, including discussions with affected personnel, with employee-related costs recognised over the period of any required further service. Selfinsured risks Mine and plant rehabilitation Restructuring and make good Other Total $m $m $m $m $m $m $m Carrying amount at 1 July 2015 Arising and acquired during the year Utilised Adjustments Carrying amount at 30 June 2016 and 1 July 2016 Arising during the year Utilised Adjustments Carrying amount at 30 June , ,005 (7) (32) (165) (3) (50) (144) (401) - (20) - 36 (12) (2) , (7) (32) (190) (19) (134) (245) (627) - (15) - (28) (10) - (53) ,
115 Notes to the financial statements: Capital For the year ended 30 June 2017 Financial statements 10. Capital management The Group s capital management objectives The primary objective of Wesfarmers is to provide a satisfactory return to its shareholders. The Group aims to achieve this objective by: improving returns on invested capital relative to that cost of capital; and ensuring a satisfactory return is made on any new capital invested. Capital is defined as the combination of shareholders equity, reserves and net debt. The Board is responsible for monitoring and approving the capital management framework within which management operates. The purpose of the framework is to safeguard the Group s ability to continue as a going concern whilst optimising its debt and equity structure. Wesfarmers aims to maintain a capital structure that is consistent with a stable investment grade credit rating. Note Equity and reserves Issued capital 12 Reserved shares 12 Retained earnings 12 Reserves 12 Net financial debt Total interest-bearing debt 14 Less: Cash and cash equivalents 4 Net capital CONSOLIDATED $m $m 22,268 21,937 (26) (28) 1, ,941 22,949 5,413 7,303 (1,013) (611) 4,400 6,692 28,341 29,641 The Group manages its capital through various means, including: adjusting the amount of ordinary dividends paid to shareholders; maintaining a dividend investment plan; raising or returning capital; and raising or repaying debt for working capital requirements, capital expenditure and acquisitions. Wesfarmers regularly monitors its capital requirements using various benchmarks, with the main internal measures being cash interest cover, debt cover and fixed charges cover. The principal external measures are the Group s credit ratings from Standard & Poor s and Moody s. Cash interest cover Profit before income tax Finance costs Depreciation and amortisation EBITDA (A) Net cash interest paid (B) Cash interest cover (times) (A/B) Adjusted EBITDA 1 (C) Cash interest cover (times) (C/B) (applying adjusted EBITDA) Debt cover Total interest-bearing debt Less: cash and cash equivalents Net financial debt (D) EBITDA (A) Debt cover (times) (D/A) Adjusted EBITDA 1 (C) Debt cover (times) (D/C) (applying adjusted EBITDA) Fixed charges cover EBITDA Minimum lease payments EBITDA plus minimum lease payments (E) Finance costs (net of discount adjustment), and minimum lease payments (F) Fixed charges cover (times) (E/F) Adjusted EBITDA 1 (C) Minimum lease payments Adjusted EBITDA plus minimum lease payments (G) Fixed charges cover (times) (G/F) (applying adjusted EBITDA) CONSOLIDATED $m $m 4,138 1, ,266 1,296 5,668 2, ,668 4, ,413 7,303 (1,013) (611) 4,400 6,692 5,668 2, ,668 4, ,668 2,642 2,399 2,330 8,067 4,972 2,636 2, ,668 4,758 2,399 2,330 8,067 7, Group credit ratings Standard & Poor s 2 A (negative) A (negative) Moody s A3(stable) A3(stable) 1 The 2016 adjusted EBITDA excludes pre-tax non-cash impairments relating to Target ($1,266 million) and Curragh ($850 million). 2 In September 2017, Standard & Poor s revised the Group s outlook from negative to stable. Shareholder distributions $/share Interim dividend Final dividend (FY17: proposed) Special dividend Capital management About this report Capital Risk Segment information Key numbers Group structure Unrecognised items Other 113
116 Financial statements Notes to the financial statements: Capital For the year ended 30 June Dividends and distributions CONSOLIDATED $m $m Declared and paid during the year (fully-franked at 30 per cent) Interim dividend for 2017: $1.03 (2016: $0.91) Final dividend for 2016: $0.95 (2015: $1.11) Proposed and unrecognised as a liability (fully-franked at 30 per cent) Final dividend for 2017: $1.20 (2016: $0.95) Franking credit balance Franking credits available for future years at 30 per cent adjusted for the payment of income tax and dividends receivable or payable Impact on the franking account of dividends proposed before the financial report was issued but not recognised as a distribution to equity holders during the period 1,165 1,025 1,070 1,247 2,235 2,272 1,361 1, (583) (458) Wesfarmers dividend policy considers free cash flow generation, profit generation, availability of franking credits and seeks to deliver growing dividends over time. The Group operates a dividend investment plan which allows eligible shareholders to elect to invest dividends in ordinary shares. All holders of Wesfarmers ordinary shares with addresses in Australia or New Zealand are eligible to participate in the plan. The allocation price for shares is based on the average of the daily volume weighted average price of Wesfarmers ordinary shares sold on the Australian Securities Exchange, calculated with reference to a period of not less than five consecutive trading days as determined by the directors. An issue of shares under the dividend investment plan results in an increase in issued capital unless the Group elects to purchase the required number of shares on-market. 12. Equity and reserves Movement in shares on issue At 1 July 2015 Exercise of in-substance options Dividends applied Issue of ordinary shares under the Wesfarmers Employee Share Acquisition Plan At 30 June 2016 and 1 July 2016 Exercise of in-substance options Dividends applied Issue of ordinary shares under the Wesfarmers Dividend Investment Plan Issue of ordinary shares under the Wesfarmers Employee Share Acquisition Plan Transfer from other reserves At 30 June 2017 ORDINARY SHARES RESERVED SHARES Thousands $m Thousands $m 1,123,753 21,844 (2,515) (31) , ,126,131 21,937 (2,294) (28) , , ,133,840 22,268 (2,088) (26) 114
117 Notes to the financial statements: Capital For the year ended 30 June 2017 Financial statements 12. Equity and reserves (continued) The nature of the Group s contributed equity Ordinary shares are fully-paid and have no par value. They carry one vote per share and the right to dividends. They bear no special terms or conditions affecting income or capital entitlements of the shareholders and are classified as equity. Reserved shares are ordinary shares that have been repurchased by the company and are being held for future use. They include employee reserved shares, which are shares issued to employees under the share loan plan. Once the share loan has been paid in full, they are converted to ordinary shares and issued to the employee. Incremental costs directly attributable to the issue of new shares are shown in equity as a deduction, net of tax, from the proceeds. There are no shares authorised for issue that have not been issued at reporting date. Consolidated Balance at 1 July 2015 Net profit Dividends Remeasurement loss on defined benefit plan Net loss on financial instruments recognised in equity Realised gains transferred to balance sheet/net profit Share of associates and joint venture reserve Tax effect of transfers and revaluations Currency translation differences Share-based payment transactions Balance at 30 June 2016 and 1 July 2016 Net profit Dividends Remeasurement loss on defined benefit plan Net loss on financial instruments recognised in equity Realised losses transferred to balance sheet/ net profit Tax effect of transfers and revaluations Currency translation differences Share-based payment transactions Balance at 30 June 2017 Retained earnings Restructure tax reserve Capital reserve Foreign currency translation reserve Cash flow hedge reserve Financial assets reserve Sharebased payments reserve $m $m $m $m $m $m $m 2, (15) (2,272) (3) (34) (110) (105) , (2,235) (3) (136) (17) (2) , (82) 5 41 Nature and purpose of reserves Restructure tax reserve The restructure tax reserve is used to record the recognition of tax losses arising from the equity restructuring of the Group under the 2001 ownership simplification plan. These tax losses were generated on adoption by the Group of the tax consolidation regime. Capital reserve The capital reserve was used to accumulate capital profits. The reserve can be used to pay dividends or issue bonus shares. Foreign currency translation reserve The foreign currency translation reserve is used to record exchange differences arising from the translation of the financial statements of foreign subsidiaries. Cash flow hedge reserve The hedging reserve records the portion of the gain or loss on a hedging instrument in a cash flow hedge that is determined to be an effective hedge relationship. Financial assets reserve The financial assets reserve records fair value changes on financial assets designated at fair value through other comprehensive income. Share-based payments reserve The share-based payments reserve is used to recognise the value of equity-settled share-based payments provided to employees, including key management personnel, as part of their remuneration. Refer to note 27 for further details of these plans. About this report Capital Risk Segment information Key numbers Group structure Unrecognised items Other 115
118 Financial statements Notes to the financial statements: Capital For the year ended 30 June Earnings per share 14. Interest-bearing loans and borrowings Profit attributable to ordinary equity holders of the parent ($m) WANOS 1 used in the calculation of basic EPS 2 (shares, million) WANOS 1 used in the calculation of diluted EPS 2 (shares, million) Basic EPS (cents per share) Diluted EPS (cents per share) CONSOLIDATED , ,128 1,123 1,130 1, Weighted average number of ordinary shares. 2 The variance in the WANOS used in the calculation of the basic EPS and the diluted EPS is attributable to in-substance options. There have been no transactions involving ordinary shares between the reporting date and the date of completion of these financial statements, apart from the normal conversion of employeereserved shares (treated as in-substance options) to unrestricted ordinary shares. Calculation of earnings per share Basic earnings per share Basic earnings per share is calculated as net profit attributable to members of the parent, adjusted to exclude any costs of servicing equity (other than dividends), divided by the weighted average number of ordinary shares, adjusted for any bonus element. Diluted earnings per share Diluted earnings per share is calculated as net profit attributable to members of the parent, adjusted for: costs of servicing equity (other than dividends); the after-tax effect of dividends and interest associated with dilutive potential ordinary shares that have been recognised as expenses; and other non-discretionary changes in revenues or expenses during the year that would result from the dilution of potential ordinary shares; divided by the weighted average number of ordinary shares and dilutive potential ordinary shares, adjusted for any bonus element. Earnings per share From continuing operations cents cents/share FY17 1 FY16 includes post-tax impairment of Target and Curragh ($1,844m) 2 FY14 includes post-tax impairment of Target ($677m) cents FY FY FY FY FY Current Unsecured Bank debt Capital market debt Non-current Unsecured Bank debt Capital market debt Total interest-bearing loans and borrowings Funding activities CONSOLIDATED $m $m 378 1, ,347 1, ,450 3,203 4,221 4,066 5,671 5,413 7,303 The current year funding activities have been outlined on page 100 in the significant items in the current reporting period. The illustration below provides details, including the principal repayment obligations, of all loans and borrowings on issue at 30 June 2017: Outstanding loans and borrowings A$m 2,700 2,250 1,800 1, Current: $1,347 m FY2018 Recognition and measurement Bank debt Non-current: $4,066 m Capital market debt FY2019 FY2020 FY All loans and borrowings are initially recognised at fair value of the consideration received, less directly attributable transaction costs. After initial recognition, interest-bearing loans and borrowings are subsequently measured at amortised cost using the effective interest method. Gains and losses are recognised in profit or loss when the liabilities are derecognised. The carrying values of recognised assets and liabilities that are the hedged items in fair value hedge relationships, which are otherwise carried at amortised cost, are adjusted to record changes in the fair values attributable to the risks that are being hedged. 116
119 Notes to the financial statements: Risk For the year ended 30 June 2017 Financial statements 15. Financial risk management The Group holds financial instruments for the following purposes: Financing: to raise finance for the Group s operations or, in the case of short-term deposits, to invest surplus funds. The principal types of instruments used include other bank loans, bank accepted bills, commercial paper, corporate bonds and cash and short-term deposits. Operational: the Group s activities generate financial instruments, including cash, trade receivables, trade payables and finance advances. Risk management: to reduce risks arising from the financial instruments described above, including forward exchange contracts and interest rate swaps. It is, and has been throughout the year, the Group s policy that no speculative trading in financial instruments shall be undertaken. The Group s holding of these financial instruments exposes it to risk. The Board reviews and agrees the Group s policies for managing each of these risks, which are summarised below: liquidity risk (note 15(b)); market risk, including foreign currency, interest rate and commodity price risk (note 15(c)); and credit risk (note 15(d)). These risks affect the fair value measurements applied by the Group. This is discussed further within note 15(e). 15(a) Offsetting financial instruments The Group presents its derivative assets and liabilities on a gross basis. Derivative financial instruments entered into by the Group are subject to enforceable master netting arrangements, such as an International Swaps and Derivatives Association (ISDA) master netting agreement. In certain circumstances, for example, when a credit event such as a default occurs, all outstanding transactions under an ISDA agreement are terminated, the termination value is assessed and only a single net amount is payable in settlement of all transactions. The amounts set out in note 16 represent the derivative financial assets and liabilities of the Group, that are subject to the above arrangements and are presented on a gross basis. 15(b) Liquidity risk Nature of the risk Wesfarmers is exposed to liquidity risk primarily due to its capital management policies, which view debt as a key element of the Group s capital structure (see note 10). In addition, Wesfarmers maintains a flexible financing structure to enable it to take advantage of new investment opportunities that may arise. To facilitate effective use of debt as part of the capital structure, the Group continues to maintain investment grade credit ratings from Standard & Poor s and Moody s. These policies expose the Group to risk including the sufficiency of available unused facilities and the maturity profile of existing financial instruments. Liquidity risk management Liquidity risk is managed centrally by Group Treasury, by considering over a period of time the operating cash flow forecasts of the underlying businesses and the degree of access to debt and equity capital markets. The Group s objective is to maintain a balance between continuity of funding and flexibility through the use of bank loans, bank accepted bills, commercial paper, corporate bonds and the overnight money market across a range of maturities. Although the bank debt facilities have fixed maturity dates, from time to time they are reviewed and extended, thus deferring the repayment of the principal. The Group aims to spread maturities to avoid excessive refinancing in any period. The Group endeavours to maintain funding flexibility by keeping committed credit lines available with a variety of counterparties. Surplus funds are generally invested in instruments that are tradeable in highly liquid markets with highly rated counterparties. Financing facilities available Total facilities Commercial paper Other bank loans Facilities used at balance date Other bank loans Facilities unused at balance date Commercial paper Other bank loans CONSOLIDATED $m $m ,245 4,920 4,245 4,980 1,244 2,582 1,244 2, ,001 2,338 3,001 2,398 Assets pledged as security A controlled entity has issued a floating charge over assets, capped at $80 million (2016: $80 million), as security for payment obligations to a trade creditor. The assets are excluded from financial covenants in all debt documentation. Maturity of financial liabilities The following tables analyse the Group s financial liabilities, including net and gross settled financial instruments, into relevant maturity periods based on the remaining period at the reporting date to the contractual maturity date. The amounts disclosed in the table are the contractual undiscounted cash flows and hence will not necessarily reconcile with the amounts disclosed in the balance sheet. Expected future interest payments on loans and borrowings exclude accruals already recognised in trade and other payables. Derivative cash flows exclude accruals recognised in trade and other payables. For foreign exchange derivatives and cross-currency interest rate swaps, the amounts disclosed are the gross contractual cash flows to be paid. For interest rate swaps, the cash flows are the net amounts to be paid at each quarter, excluding accruals included in trade and other payables, and have been estimated using forward interest rates applicable at the reporting date. About this report Capital Risk Segment information Key numbers Group structure Unrecognised items Other 117
120 Financial statements Notes to the financial statements: Risk For the year ended 30 June (b) Liquidity risk (continued) Consolidated < 3 months, or on demand Carrying amount (assets)/ liabilities 3-6 months 6-12 months 1-2 years 2-3 years 3-4 years 4-5 years >5 years Total contractual cash flows $m $m $m $m $m $m $m $m $m $m Year ended 30 June 2017 Non-derivatives Trade and other payables Loans and borrowings before swaps Expected future interest payments on loans and borrowings Total non-derivatives Derivatives Hedge interest rate swaps (net settled) Cross-currency interest rate swaps (gross settled) (inflow) outflow Net cross-currency interest rate swaps Hedge foreign exchange contracts (gross settled) (inflow) outflow Net foreign exchange contracts Total derivatives 6, ,615 6, ,256 1, ,100 5,669 5, , ,342 1, ,039 1,130 12,657 12,028 - (1) (2) (2) (1) (1) - - (7) (7) (6) (3) (987) (39) (40) (41) (1,039) (1,131) (3,286) (481) , (210) (108) (345) (508) (481) (1,132) (1,102) (1,173) (1,074) (46) (4,527) 173 1,179 1,153 1,226 1, , (159) (108) (345) (346) (315) Year ended 30 June 2016 Non-derivatives Trade and other payables Loans and borrowings before swaps Expected future interest payments on loans and borrowings Total non-derivatives Derivatives Hedge interest rate swaps (net settled) Cross-currency interest rate swaps (gross settled) (inflow) outflow Net cross-currency interest rate swaps Hedge foreign exchange contracts (gross settled) (inflow) outflow Net foreign exchange contracts Total derivatives 6, ,491 6, ,130 1, ,111 7,577 7, ,467 1, ,276 1, ,184 14,644 13,794 - (1) (2) (2) (2) (3) (1) - (11) (11) (7) (3) (10) (1,088) (40) (41) (42) (2,185) (3,416) (555) ,718 2, (258) (467) (531) (555) (1,503) (1,387) (1,691) (1,777) (100) (6,458) 188 1,523 1,416 1,744 1, , (186) (467) (364) (378) 118
121 Notes to the financial statements: Risk For the year ended 30 June 2017 Financial statements 15(c) Market risk Nature of foreign currency risk The Group s primary currency exposure is to US dollars and arises from sales or purchases by a division in currencies other than the division s functional currency. The Group is also exposed to the US dollar and Euro through its borrowing facilities. As a result of operations in New Zealand and the United Kingdom, the Group s balance sheet can also be affected by movements in the AUD/NZD and AUD/GBP exchange rates. The Group mitigates the effect of its translational currency exposure by borrowing in NZ dollars in New Zealand and in GBP in the United Kingdom. Exposure The Group s exposure to the US dollar and Euro (prior to hedging contracts) at the reporting date were as follows: Consolidated 2017 Financial assets Cash and cash equivalents Trade and other receivables Cross-currency interest rate swap Hedge foreign exchange derivative assets Financial liabilities Trade and other payables Interest-bearing loans and borrowings Hedge foreign exchange derivative liabilities 2016 Financial assets Cash and cash equivalents Trade and other receivables Cross-currency interest rate swap Financial liabilities Trade and other payables Interest-bearing loans and borrowings Hedge foreign exchange derivative liabilities USD A$m EUR A$m ,026 1, ,009 1, Foreign currency risk management The hedging function of the Group to address foreign currency risk is managed centrally. The Group requires all divisions to hedge foreign exchange exposures for firm commitments relating to sales or purchases or when highly probable forecast transactions have been identified. Before hedging, the divisions are also required to take into account their competitive position. The hedging instrument must be in the same currency as the hedged item. Divisions are not permitted to speculate on future currency movements. The objective of Wesfarmers policy on foreign exchange hedging is to protect the Group from adverse currency fluctuations. Hedging is implemented for the following reasons: protection of competitive position; and greater certainty of earnings due to protection from sudden currency movements. The Group has hedged a portion of its foreign currency sales for which firm commitments or highly probable forecast transactions existed. Such foreign currency sales arose predominantly in Resources. The Group aims to hedge approximately 70 to 100 per cent of its non-capital expenditure-related foreign currency purchases for which firm commitments or highly probable forecast transactions exist, up to 24 months forward. The Group currently hedges 100 per cent of capital expenditure-related foreign currency purchases to match expected payment dates and these may extend beyond 12 months. The current hedge contracts extend out to July The Group has also hedged 100 per cent of its US dollar and Euro borrowing facilities. The Wesfarmers Audit and Risk Committee can approve temporary amendments to this policy, such as the hedging time horizon and hedge levels, with such amendments reviewed on a regular basis. The Group s sensitivity to foreign exchange movements The sensitivity analysis below shows the impact that a reasonably possible change in foreign exchange rates over a financial year would have on profit after tax and equity, based solely on the Group s foreign exchange risk exposures existing at the balance sheet date. The Group has used the observed range of actual historical rates for the preceding five-year period, with a heavier weighting placed on recently observed market data, in determining reasonably possible exchange movements to be used for the current year s sensitivity analysis. Past movements are not necessarily indicative of future movements. The following exchange rates have been used in performing the sensitivity analysis: USD EUR Actual % % Actual % % The impact on profit and equity is estimated by relating the hypothetical changes in the US dollar and Euro exchange rate to the balance of financial instruments at the reporting date. Foreign currency risks, as defined by AASB 7 Financial Instruments: Disclosures, arise on account of financial instruments being denominated in a currency that is not the functional currency in which the financial instrument is measured. Differences from the translation of financial statements into the Group s presentation currency are not taken into consideration in the sensitivity analysis and as such the NZ dollar and GBP have no material impact. The results of the foreign exchange rate sensitivity analysis are driven by three main factors, as outlined below: the impact of applying the above foreign exchange movements to financial instruments that are not in hedge relationships will be recognised directly in profit; to the extent that the foreign currency denominated derivatives on balance sheet form part of an effective cash flow hedge relationship, any fair value movements caused by applying the above sensitivity movements will be deferred in equity and will not affect profit; and movements in financial instruments forming part of an effective fair value hedge relationship will be recognised in profit. However, as a corresponding entry will be recognised for the hedged item, there will be no net effect on profit. At 30 June 2017, had the Australian dollar moved against the US dollar and Euro, as illustrated in the table above, with all other variables held constant, the Group s profit after tax and other equity would have been affected by the change in value of its financial assets and financial liabilities as shown in the table on the following page. About this report Capital Risk Segment information Key numbers Group structure Unrecognised items Other 119
122 Financial statements Notes to the financial statements: Risk For the year ended 30 June (c) Market risk (continued) Consolidated AUD/USD +10% AUD/USD 10% AUD/EUR +10% AUD/EUR 10% Impact Impact Impact Impact USD exposure Impact on profit on equity Impact on profit on equity EUR exposure Impact on profit on equity Impact on profit on equity A$m A$m A$m A$m A$m A$m A$m A$m A$m A$m Year ended 30 June 2017 Financial assets Cash and cash equivalents Trade and other receivables Cross-currency interest rate swap Hedge foreign exchange derivative assets Financial liabilities Trade and other payables Interest-bearing loans and borrowings Hedge foreign exchange derivative liabilities Net impact 12 (1) (10) (62) (1) (131) (1) (67) (3) - 1, (76) - 1, (207) 174 (56) (173) (174) (3) (45) Year ended 30 June 2016 Financial assets Cash and cash equivalents Trade and other receivables Cross-currency interest rate swap Hedge foreign exchange derivative assets Financial liabilities Trade and other payables Interest-bearing loans and borrowings Cross-currency interest rate swap Hedge foreign exchange derivative liabilities Net impact 28 (2) (1) (6) (64) (1) (135) (59) (3) - 1, (79) - 1, (207) (49) (223) (4) (224) (2) (38) Nature of interest rate risk The Group s exposure to the risk of changes in market interest rates relates primarily to the Group s debt obligations that have floating interest rates. Interest rate risk management The policy of the Group is to limit the Group s exposure to adverse fluctuations in interest rates, which could erode the Group s profitability and adversely affect shareholder value. The policy requires that an interest rate risk management (IRRM) plan be developed based on cash flow forecasts. A committee comprising senior management meets periodically to review the IRRM plan and make interest rate hedging recommendations, which are provided to the Group s Chief Financial Officer for approval. The Group s interest rate hedging profile is regularly reported to the Wesfarmers Board and senior executives. To manage the interest rate exposure, the Group generally enters into interest rate swaps, in which the Group agrees to exchange, at specified intervals, the difference between fixed and variable rate interest amounts calculated by reference to an agreed-upon notional principal amount. These swaps are designated to hedge interest costs associated with underlying debt obligations. At 30 June 2017, after taking into account the effect of interest rate swaps, economic hedging relationships and early repayment of a portion of core debt facilities, approximately 40 per cent of the Group s core borrowings are exposed to movements in variable rates (2016: approximately 54 per cent). From a Group perspective, any internal contracts are eliminated as part of the consolidation process, leaving only the external contracts in the name of Wesfarmers Limited. Although Wesfarmers has issued US and Euro bonds, cross-currency swaps are in place that remove any exposure to US and Euro interest rates. These cross-currency swaps ensure that the effective interest rate to Wesfarmers is referenced to Australian interest rates. Exposure As at the reporting date, the Group had the following financial assets and liabilities with exposure to interest rate risk. Interest on financial instruments, classified as floating rate, is repriced at intervals of less than one year. Interest on financial instruments, classified as fixed rate, is fixed until maturity of the instrument. The classification between fixed and floating interest takes into account applicable hedge instruments. Other financial instruments of the Group that are not included in the following table are non interest-bearing and are therefore not subject to interest rate risk. 120
123 Notes to the financial statements: Risk For the year ended 30 June 2017 Financial statements 15(c) Market risk (continued) Financial assets Fixed rate Finance advances and loans Floating rate Cash assets Total weighted average effective interest rate on financial assets at balance date Financial liabilities Fixed rate Other bank loans Corporate bonds Weighted average effective interest rate on fixed rate liabilities Floating rate Other unsecured bank loans Corporate bonds Weighted average effective interest rate on floating rate liabilities Total weighted average effective interest rate on financial liabilities: at balance date during the year during the year, including bank and liquidity charges The Group s sensitivity to interest rate movements The following sensitivity analysis shows the impact that a reasonably possible change in interest rates would have on Group profit after tax and equity. The impact is determined by assessing the effect that such a reasonably possible change in interest rates would have had on the interest income/(expense) and the impact on financial instrument fair values. This sensitivity is based on reasonably possible changes over a financial year, determined using observed historical interest rate movements for the preceding five-year period, with a heavier weighting given to more recent market data. The results of the sensitivity analysis are driven by three main factors, as outlined below: for unhedged floating rate financial instruments, any increase or decrease in interest rates will impact profit; to the extent that derivatives form part of an effective cash flow hedge relationship, there will be no impact on profit and any increase/(decrease) in the fair value of the underlying derivative instruments will be deferred in equity; and movements in the fair value of derivatives in an effective fair value hedge relationship will be recognised directly in profit. However, as a corresponding entry will be recognised for the hedged item, there will be no net impact on profit. The following sensitivity analysis is based on the Australian variable interest rate risk exposures in existence at balance sheet date. If interest rates had moved by +/ 100bps (basis point(s)) and with all other variables held constant, profit after tax and equity would be affected as follows: Consolidated Balance Weighted average interest rate Balance Weighted average interest rate $m % $m % , , , , , Impact on profit A$m Impact on equity A$m 2017 Australian variable interest rate +100bps (5) 53 Australian variable interest rate 100bps 5 (56) 2016 Australian variable interest rate +100bps (17) 66 Australian variable interest rate 100bps 17 (70) Commodity price risk The Group s exposure to commodity price risk is purely operational and arises largely from coal price fluctuations, which impact on its coal mining operations, or in relation to the purchase of inventory with commodity price as a significant input, such as natural gas. the Group entered into a Brent oil future contract on 30 June 2017 to hedge the variability in cash flows arising from movements in the natural gas price applicable to forecast natural gas purchases over the three years to 30 June the Group does not enter into any financial instruments that vary with movements in other commodity prices. Excluding the foreign exchange risk component, which is managed as part of the Group s overall foreign exchange risk management policies and procedures referred to previously, these exposures are not hedged. No commodity price sensitivity analysis is provided, as: the Brent oil future contract was entered into on the balance sheet date; and the Group s other commodity own use contracts are outside the scope of AASB 139 Financial Instruments: Recognition and Measurement. About this report Capital Risk Segment information Key numbers Group structure Unrecognised items Other 121
124 Financial statements Notes to the financial statements: Risk For the year ended 30 June (d) Credit risk Nature of the risk Credit risk is the risk that a contracting entity will not complete its obligation under a financial instrument or customer contract that will result in a financial loss to the Group. The Group is exposed to credit risk from its operating activities (primarily from customer receivables) and from its financing activities, including deposits with financial institutions, foreign exchange transactions and other financial instruments. Credit risk management: receivables Customer credit risk is managed by each division subject to established policies, procedures and controls relating to customer credit risk management. The Group trades with recognised, creditworthy third parties. Depending on the division, credit terms are generally up to 30 days from date of invoice. The Group s exposure to bad debts is not significant and default rates have historically been very low. Customers who wish to trade on credit terms are subject to credit verification procedures, including an assessment of their independent credit rating, financial position, past experience and industry reputation. In addition, receivable balances are monitored on an ongoing basis with the result that the Group s exposure to bad debts is not significant. An ageing of trade receivables past due is included in note 5. The credit quality of trade receivables neither past due nor impaired has been assessed as high on the basis of credit ratings (where available) or historical information about counterparty default. The carrying amounts of the Group s trade and other receivables are denominated in Australian dollars, US dollars, NZ dollars and GBP. Since the Group trades only with recognised third parties, no requests or requirement for collateral covering trade and other receivables balances have been made. Exposure The Group s maximum credit exposure to current receivables, finance advances and loans are shown below: % % Coles Home Improvement Officeworks Kmart Target Resources Industrial and Safety Chemicals, Energy and Fertilisers Corporate Credit risk management: financial instruments and cash deposits Credit risk from balances with banks and financial institutions is managed by Group Treasury in accordance with Board-approved policy. Investments of surplus funds are made only with approved counterparties or counterparties rated AA or higher by Standard & Poor s. Surplus funds are invested within credit limits assigned to each counterparty, unless appropriate approval is provided. The carrying amount of financial assets represents the maximum credit exposure. There is also exposure to credit risk when the Group provides a guarantee to another party. Details of contingent liabilities are disclosed in note 20. There are no significant concentrations of credit risk within the Group. 15(e) Fair values The carrying amounts and estimated fair values of all the Group s financial instruments recognised in the financial statements are materially the same, with the exception of the following: Consolidated $m $m Corporate bonds: carrying amount 4,172 4,721 Corporate bonds: fair value 4,313 4,867 The methods and assumptions used to estimate the fair value of financial instruments are as follows: Cash The carrying amount is fair value due to the asset s liquid nature. Receivables/payables Due to the short-term nature of these financial rights and obligations, carrying amounts are estimated to represent fair values. Other financial assets/liabilities The fair values of corporate bonds and term deposits held at fair value have been calculated by discounting the expected future cash flows at prevailing interest rates using market observable inputs. The fair values of loan notes and other financial assets have been calculated using market interest rates. Derivatives The Group enters into derivative financial instruments with various counterparties, principally financial institutions with investment grade credit ratings. Foreign exchange forward contracts, interest rate swap contracts, cross-currency interest rate swaps and commodity future contracts are all valued using forward pricing techniques. This includes the use of market observable inputs, such as foreign exchange spot and forward rates, yield curves of the respective currencies, interest rate curves and forward rate curves of the underlying commodity. Accordingly, these derivatives are classified as Level 2. Interest-bearing loans and borrowings Quoted market prices or dealer quotes for similar instruments are used to value long-term debt instruments except corporate bonds. Valuation of financial instruments For all fair value measurements and disclosures, the Group uses the following to categorise the method used: Level 1: the fair value is calculated using quoted prices in active markets. Level 2: the fair value is estimated using inputs other than quoted prices included in Level 1 that are observable for the asset or liability, either directly (as prices) or indirectly (derived from prices). Level 3: the fair value is estimated using inputs for the asset or liability that are not based on observable market data. All of the Group s financial instruments were valued using market observable inputs (Level 2) with the exception of shares in unlisted companies at fair value (Level 3) that were valued at under $1 million (2016: $1 million). For financial instruments that are carried at fair value on a recurring basis, the Group determines whether transfers have occurred between Levels in the hierarchy by reassessing categorisation (based on the lowest level input that is significant to the fair value measurement as a whole) at the end of each reporting period. There were no transfers between Level 1 and Level 2 during the year. There were no material Level 3 fair value movements during the year. 122
125 Notes to the financial statements: Risk For the year ended 30 June 2017 Financial statements 16. Hedging Types of hedging instruments The Group is exposed to risk from movements in foreign exchange and interest rates. As part of the risk management strategy set out in note 15, the Group holds the following types of derivative instruments: Forward exchange contracts: contracts denominated in US dollar and Euro to hedge highly probable sale and purchase transactions (cash flow hedges). Interest rate swaps: to optimise the Group s exposure to fixed and floating interest rates arising from borrowings. These hedges incorporate cash flow hedges, which fix future interest payments, and fair value hedges, which reduce the Group s exposure to changes in the value of its assets and liabilities arising from interest rate movements. Notional $m Cross-currency interest rate swaps: to either reduce the Group s exposure to exchange rate variability in its interest repayments of foreign currency denominated debt (cash flow hedges) or to hedge against movements in the fair value of those liabilities due to exchange and interest rate movements (fair value hedges). The borrowing margin on Wesfarmers cross-currency interest rate swaps has been treated as a cost of hedging and deferred into equity. These costs are then amortised to the profit and loss as a finance cost over the remaining life of the borrowing. Brent oil future contract: to reduce the Group s exposure to price variability in its forecast purchases of natural gas Weighted Average Asset $m Liability $m Notional $m Weighted Average Foreign exchange contracts Cash flow hedge - sales (AUD) US$335 Asset: (10) US$734 Asset: (88) Liability: 0.81 Liability: 0.81 Cash flow hedge - sales (GBP) US$0 Asset: nil - - US$35 Asset: nil - (3) Liability: nil Liability: 0.69 Cash flow hedge - purchases (AUD) US$2,906 Asset: nil - (154) US$3,723 Asset: (135) Liability: 0.74 Liability: 0.71 Cash flow hedge - purchases (GBP) US$65 Asset: nil - (2) US$138 Asset: Liability: 1.27 Liability: nil Cash flow hedge - purchases (NZD) US$156 Asset: nil - (11) US$145 Asset: (11) Liability: 0.69 Liability: 0.66 Cash flow hedge - purchases (AUD) 15 Asset: Asset: nil - (2) Liability: nil Liability: 0.64 Interest rate swap contracts Cash flow hedge % fixed - (1) % fixed - (2) Fair value hedge A$300 BBSW +0.82% 7 - A$300 BBSW +0.82% 13 - floating floating Cross-currency interest rate swaps Fair value hedge US$750 BBSW +1.24% floating US$750 BBSW +1.24% floating Asset $m Liability $m Cash flow hedge 1, % fixed 240-1, % fixed Brent oil contracts Cash flow hedge 1.3m barrels US$68.52 per barrel Total derivative asset/(liability) 493 (178) 619 (241) Recognition and measurement Recognition Derivative financial instruments are initially recognised at fair value on the date on which a derivative contract is entered into and are subsequently remeasured to fair value per note 15(e). The method of recognising any remeasurement gain or loss depends on the nature of the item being hedged. For hedging instruments, any hedge ineffectiveness is recognised directly in the income statement in the period in which it is incurred. This was immaterial in the current year. Hedge accounting At the start of a hedge relationship, the Group formally designates and documents the hedge relationship, including the risk management strategy for undertaking the hedge. This includes identification of the hedging instrument, the hedged item or transaction, the nature of the risk being hedged and how the entity will assess the hedging instrument s effectiveness. Hedge accounting is only applied where effective tests are met on a prospective basis. For the purposes of hedge accounting, hedges are classified as: fair value hedges when they hedge the exposure to changes in the fair value of a recognised asset, liability or firm commitment that could affect profit or loss; or cash flow hedges when they hedge a particular risk associated with the cash flows of recognised assets and liabilities and highly probable forecast transactions. A hedge of the foreign currency risk of a firm commitment is accounted for as a cash flow hedge. Wesfarmers will discontinue hedge accounting prospectively only when the hedging relationship, or part of the hedging relationship no longer qualifies for hedge accounting, which includes where there has been a change to the risk management objective and strategy for undertaking the hedge and instances when the hedging instrument expires or is sold, terminated or exercised. For this purposes, the replacement or rollover of a hedging instrument into another hedging instrument is not an expiration or termination if such a replacement or rollover is consistent with our documented risk management objective. About this report Capital Risk Segment information Key numbers Group structure Unrecognised items Other 123
126 Financial statements Notes to the financial statements: Risk For the year ended 30 June Hedging (continued) Hedges that meet the criteria for hedge accounting are classified and accounted for as follows: Fair value hedges The Group uses fair value hedges to mitigate the risk of changes in the fair value of foreign currency borrowings from foreign currency and interest rate fluctuations over the hedging period. Where these fair value hedges qualify for hedge accounting, gains or losses from remeasuring the fair value of the hedging instrument are recognised within finance costs in the income statement, together with gains or losses in relation to the hedged item where those gains of losses relate to the risk intended to be hedged. For fair value hedges, the carrying value of the hedged item is adjusted for gains and losses attributable to the risk being hedged. The derivative is also remeasured to fair value, and gains and losses from both are taken to profit or loss. The net amount recognised in the income statement in this financial year was less than $1 million. The maturity profile of the fair value hedges is shown in note 15(b). If the hedged item is a firm commitment (and therefore not recognised), the subsequent cumulative change in the fair value of the hedged risk is recognised as an asset or liability with a corresponding gain or loss recognised in profit or loss. The changes in the fair value of the hedging instrument are also recognised in profit or loss. The accumulated amount of fair value adjustment which is included in the carrying amount of borrowings in the balance sheet is as follows: Foreign bonds $m Domestic bonds $m Foreign bonds $m Domestic bonds $m Face value at inception 2,358 1,350 2,358 1,850 Change arising from revaluation to spot rates at 30 June ,834 1,350 2,876 1,850 Balance of unamortised discount/premium (10) (4) (12) (6) Amortised cost 2,824 1,346 2,864 1,844 Accumulated amount of fair value hedge adjustment attributable to hedge risk (6) 7-13 Carrying amount 2,818 1,353 2,864 1,857 There was no material ineffectiveness relating to financial instruments in designated fair value hedge relationships during the year (2016: nil). Cash flow hedges The Group uses cash flow hedges to mitigate the risk of variability of future cash flows attributable to foreign currency fluctuations over the hedging period associated with our foreign currency borrowings and our ongoing business activities, predominantly where we have highly probable purchase or settlement commitments in foreign currencies. The Group also uses cash flow hedges to hedge variability in cash flows due to interest rate or natural gas price movements associated with some of our domestic borrowings or forecast natural gas purchases respectively. For cash flow hedges, the portion of the gain or loss on the hedging instrument that is effective is recognised directly in equity, while the ineffective portion is recognised in profit or loss. The maturity profile of these hedges is shown in note 15(b), the recognition of the gain or loss is expected to be consistent with this. Trade $m Foreign bonds $m Foreign debt $m Trade $m Foreign bonds $m Foreign debt $m Change in the fair value of the hedge item 15 (30) 1 (189) 54 (2) Amounts recognised in equity are transferred to the income statement when the hedged transaction affects profit or loss, such as when hedged income or expenses are recognised or when a forecast sale occurs or the asset is consumed. When the hedged item is the cost of a non-financial asset or liability, the amounts taken to equity are transferred to the initial carrying amount of the non-financial asset or liability. If the forecast transaction is no longer expected to occur, amounts previously recognised in equity are transferred to the income statement. If the hedging instrument expires or is sold, terminated or exercised without replacement or roll over, or if its designation as a hedge is revoked, amounts previously recognised in equity remain in equity until the forecast transaction occurs. 124
127 Notes to the financial statements: Risk For the year ended 30 June 2017 Financial statements 17. Impairment of non-financial assets Testing for impairment The Group tests property, plant and equipment, intangibles and goodwill for impairment: at least annually for indefinite life intangibles and goodwill; and where there is an indication that the asset may be impaired (which is assessed at least each reporting date); or where there is an indication that previously recognised impairment (on assets other than goodwill) may have changed. If the asset does not generate independent cash inflows and its value in use cannot be estimated to be close to its fair value, the asset is tested for impairment as part of the cash generating unit (CGU) to which it belongs. Assets are impaired if their carrying value exceeds their recoverable amount. The recoverable amount of an asset or CGU is determined as the higher of its fair value less costs of disposal (FVLCOD) or value in use (VIU). Impairment calculations In assessing VIU, the estimated future cash flows are discounted to their present value using a discount rate that reflects current market assessments of the time value of money and the risks specific to the asset or CGU. In determining FVLCOD, a discounted cash flow model is used based on a methodology consistent with that applied by the Group in determining the value of potential acquisition targets, maximising the use of market observed inputs. These calculations, classified as Level 3 on the fair value hierarchy, are compared to valuation multiples, or other fair value indicators where available, to ensure reasonableness. Inputs to impairment calculations For VIU calculations, cash flow projections are based on Wesfarmers corporate plans and business forecasts prepared by management and approved by the Board. The corporate plans are developed annually with a five-year outlook and, for these calculations, are adjusted to exclude the costs and benefits of expansion capital and on the understanding that actual outcomes may differ from the assumptions used. In determining FVLCOD, the valuation model incorporates the cash flows projected over the balance of the current corporate plan period, or, in the case of CGUs within the Resources business, over their respective life-of-mine (LOM). These projections are discounted using a risk-adjusted discount rate commensurate with a typical market participant s assessment of the risk associated with the projected cash flows. For both the VIU and FVLCOD models, cash flows beyond the five year corporate plan period are extrapolated using estimated growth rates, which are based on Group estimates, taking into consideration historical performance as well as expected long-term operating conditions. Growth rates do not exceed the consensus forecasts of the long-term average growth rate for the industry in which the CGU operates. Discount rates used in both calculations are based on the weighted average cost of capital determined by prevailing or benchmarked market inputs, risk adjusted where necessary. Other assumptions are determined with reference to external sources of information and use consistent, conservative estimates for variables such as terminal cash flow multiples. Increases in discount rates or changes in other key assumptions, such as operating conditions or financial performance, may cause the recoverable amounts to fall below carrying values. Recognised impairment There was no material impairment recognised during the 2017 financial year. Previously recognised impairment During the 2016 financial year, the carrying values of both the Target CGU and Curragh CGU exceeded their respective recoverable amounts. Target CGU A $1,266 million impairment was recognised in 2016 in respect of its goodwill ($1,208 million) and plant and equipment ($58 million) in impairment expenses. The prior year decrease in the recoverable amount largely reflected, Target s trading performance, short-term outlook and changes in its strategic plan. Target s recoverable value at 30 June 2017 continues to approximate its carrying value. Details of the assumptions used in determining the recoverable amount of Target are provided on the following page. Curragh CGU An $850 million impairment was recognised in 2016 in respect of its non-current assets, predominantly plant and equipment ($607 million) and mineral lease and development assets ($182 million), in impairment expenses. The reduction in the recoverable value of Curragh reflected, the continued deterioration in export coal price forecasts and long-term exchange rate assumptions. Curragh s recoverable value as at 30 June 2017 continues to approximate its carrying value. Details of the assumptions used in determining the recoverable amount of Curragh are provided on the following page. Reversal of impairment Where there is an indication that previously recognised impairment losses may no longer exist or have decreased, the asset is tested. If there has been a change to the estimates used to determine the asset s recoverable amount since the last impairment loss was recognised, the carrying value of the asset is increased to its recoverable amount. That increased amount cannot exceed the carrying value that would have been determined, net of depreciation, had no impairment loss been recognised for the asset in prior years. Such reversal is recognised in profit or loss and the depreciation charge is adjusted in future periods to allocate the asset s revised carrying value, less any residual value, on a systematic basis over its remaining useful life. Impairments recognised against goodwill are not reversed. There were no material reversals of impairment during the 2017 financial year. About this report Capital Risk Segment information Key numbers Group structure Unrecognised items Other 125
128 Financial statements Notes to the financial statements: Risk For the year ended 30 June Impairment of non-financial assets (continued) Key assumptions: fair value less costs of disposal calculations Coles and Target CGUs The key assumptions used for assessing the recoverable amounts of the Coles CGU (which accounts for over 73 per cent of the Group s goodwill and intangible assets with indefinite useful lives at 30 June 2017) and Target CGU, are set out below. Both CGUs adopt the FVLCOD valuation methodology to determine the recoverable amount. EBIT growth over the forecast period is based on past experience, expectations of general market conditions and, in the case of Target, a program of business improvement strategies. The post-tax discount rates incorporate a risk-adjustment relative to the risks associated with the net post-tax cash flows being achieved, whilst the growth rates beyond the corporate plan are based on market estimates of the long-term average industry growth rate. Coles Target Discount rate (post-tax) 8.9% 8.9% 11.0% 11.0% Growth rate beyond corporate plan 3.0% 3.0% 2.5% 2.5% Headroom as a percentage of the CGU s net carrying value 29.9% 62.4% 4.9% 0% Terminal value as a percentage of the Target CGU s recoverable value 77.1% 83.6% As Target s recoverable amount is marginally above its carrying value, any adverse movements in key assumptions may lead to an impairment. Consistent with 30 June 2016, the recoverable amount of Target has been based on assumed improvements in its operating and financial performance, notwithstanding that the timing of cash flows arising from these improvements will be influenced by general market conditions. The recoverable value of Target is sensitive to changes in its discount rate and its forecast long-term EBIT that drives terminal value. A one per cent change in discount rate or a 17 per cent change in its forecast long-term EBIT approximates a $150 million change in recoverable value. Curragh CGU The recoverable value of Curragh was determined using the LOM FVLCOD valuation methodology and considers both JORC reserves and JORC resources. The key assumptions used for assessing the recoverable amount of the Curragh CGU are set out below: remaining mine life of approximately 17 years; long-term export coal price estimates sourced from Wood Mackenzie, a global provider of market intelligence to the energy, metals and mining industries; AUD/USD exchange rates based on the June 2017 forward curve off the spot rate of 0.77; mine cash cost escalations of approximately 2.5 per cent per annum; and post-tax discount rate of 9.9 per cent (2016: 10 per cent). The recoverable value of Curragh is sensitive to changes in its discount rate and forecast post-tax cash flows over the LOM. A 3.6 per cent change in discount rate or a 35 per cent change in forecast pre-tax cash flows over the LOM approximates a $150 million change in recoverable value. As Curragh s recoverable amount approximates its carrying value, any adverse movements in key assumptions may lead to an impairment. Other CGUs Based on current economic conditions and CGU performances, no reasonably possible change in a key assumption used in the determination of the recoverable value of Coles or CGUs other than Curragh or Target would result in a material impairment to the Group. 126
129 Notes to the financial statements: Group structure For the year ended 30 June 2017 Financial statements 18. Associates and joint arrangements Consolidated Investments in associates Interests in joint venture Net profits from operations of associates Other comprehensive (loss)/income of associates Profit from operations of joint venture Other comprehensive income/(loss) of joint venture Total comprehensive income Investments in associates $m $m (7) (7) Recognition and measurement The Group s investments in its associates, being entities in which the Group has significant influence and are neither subsidiaries nor jointly controlled assets, are accounted for using the equity method. Under this method, the investment in associates is carried in the consolidated balance sheet at cost plus post-acquisition changes in the Group s share of the associates net assets. Goodwill relating to associates is included in the carrying amount of the investment and is not amortised. After application of the equity method, the Group determines whether it is necessary to recognise any additional impairment loss with respect to the Group s investment. The Group s income statement reflects the Group s share of the associate s result. Where there has been a change recognised directly in the associate s equity, the Group recognises its share of any changes and discloses this in the consolidated statement of comprehensive income. Where the reporting dates of the associates and the Group vary, management accounts of the associate for the period to the Group s balance date are used for equity accounting. The associates accounting policies are consistent with those used by the Group for like transactions and events in similar circumstances. Investment properties owned by associates are initially measured at cost, including transaction costs. Subsequent to initial recognition, investment properties are stated at fair value, which reflects market conditions at the balance sheet date. Gains or losses arising from changes in the fair values of investment properties are recognised in profit or loss of the associate, in the year in which they arise. This is consistent with the Group s policy. Interests in joint arrangements Recognition and measurement The Group recognises its share of the assets, liabilities, expenses and income from the use and output of its joint operations. The Group s investment in its joint venture is accounted for using the equity method of accounting. Key judgement: control and significant influence The Group has a number of management agreements with associates and joint arrangements it considers when determining whether it has control, joint control or significant influence. The Group assesses whether it has the power to direct the relevant activities of the investee by considering the rights it holds to appoint or remove key management and the decision-making rights and scope of powers specified in the contract. Where the Group has the unilateral power to direct the relevant activities of an investee, the Group then assesses whether the power it holds is for its own benefit (acting as principal) or for the benefit of others (acting as agent). This determination is based on a number of factors including an assessment of the magnitude and variability of the Group s exposure to variable returns associated with its involvement with the investee. In an agency capacity, the Group is considered to be acting on behalf of other parties and therefore does not control the investee when it exercises its decision-making powers. About this report Capital Risk Segment information Key numbers Group structure Unrecognised items Other 127
130 Financial statements Notes to the financial statements: Group structure For the year ended 30 June Associates and joint arrangements (continued) Interests in associates and joint arrangements Associates Principal activity Reporting date Country of incorporation % % Australian Energy Consortium Pty Ltd 1 Oil and gas 31 December Australia Bengalla Coal Sales Company Pty Limited Sales agent 31 December Australia Bengalla Mining Company Pty Limited Management company 31 December Australia BWP Trust Property investment 30 June Australia Gresham Partners Group Limited Investment banking 30 September Australia Gresham Private Equity Funds Private equity fund 30 June Australia (a) (a) icix International, Inc. Information technology 31 December USA Queensland Nitrates Management Pty Ltd Chemical manufacture 30 June Australia Queensland Nitrates Pty Ltd Chemical manufacture 30 June Australia Wespine Industries Pty Ltd Pine sawmillers 30 June Australia Joint operations Principal activity Reporting date Country of incorporation % % Sodium Cyanide Sodium cyanide manufacture 30 June Australia Bengalla Coal mining 31 December Australia ISPT Property ownership 30 June Australia Joint ventures Principal activity Reporting date Country of incorporation % % BPI NO 1 Pty Ltd Property management 30 June Australia (b) (b) 1 Australian Energy Consortium Pty Ltd has a 50.0 per cent interest in Quadrant Energy Holdings Pty Ltd. (a) Gresham Private Equity Funds: Whilst the Group s interest in the unit holders funds of Gresham Private Equity Fund No. 2 amounts to greater than 50.0 per cent, it is not a controlled entity as the Group does not have the practical ability to direct their relevant activities. Such control requires a unit holders resolution of 75.0 per cent of votes pursuant to the Funds trust deeds. (b) BPI NO 1 Pty Ltd: Whilst the Group owns the only equity share in BPI NO 1 Pty Ltd, the Group s effective interest approximates 50.0 per cent and joint control is effected through contractual arrangements with the joint venture partner. 19. Subsidiaries The consolidated financial statements include the financial statements of Wesfarmers Limited and the subsidiaries listed in the following table. Refer to page 131 for the respective legend. Entity % % Entity % % A.C.N Pty Limited A.C.N Pty Ltd A.C.N Pty Ltd A.C.N Pty Ltd A.C.N Pty Ltd A.C.N Pty Ltd A.C.N Pty Ltd A.C.N Pty Ltd AEC Environmental Pty Ltd Andearp Pty Ltd Auridiam Botswana (Proprietary) Ltd y Australian Gold Reagents Pty Ltd Australian Graphics Pty Ltd Australian International Insurance Limited Australian Liquor Group Ltd Australian Underwriting Holdings Limited Australian Underwriting Services Pty Ltd Australian Vinyls Corporation Pty Ltd AVC Holdings Pty Ltd AVC Trading Pty Ltd BBC Hardware Limited BBC Hardware Properties (NSW) Pty Ltd BBC Hardware Properties (Vic) Pty Ltd Beddington House (No.4) Limited p Beddington House Holdings Limited p Bi-Lo Pty Limited Blacksmith Jacks Pty Ltd Blackwoods 4PL Pty Ltd (formerly WIS Australia Pty Ltd) Blackwoods Training Pty Ltd (formerly Integrated Safety Training Pty Ltd) Blackwoods Xpress Pty Ltd (formerly GotStock Pty Ltd) BPI Management Pty Ltd Brian Pty Ltd BUKI (Australia) Pty Ltd Bullivants International Pty Ltd Bullivants Pty Limited Bunnings (NZ) Limited Bunnings (UK & I) Holdings Limited p Bunnings Group Limited Bunnings Joondalup Pty Ltd Bunnings Limited # Bunnings Management Services Pty Ltd Bunnings Manufacturing Pty Ltd Bunnings Properties Pty Ltd Bunnings Pulp Mill Pty Ltd Bunnings Services Limited p BWP Management Limited < C S Holdings Pty Limited Campbells Hardware & Timber Pty Limited CGNZ Finance Limited Charlie Carter (Norwest) Pty Ltd Chef Fresh Pty Ltd Chemical Holdings Kwinana Pty Ltd
131 Notes to the financial statements: Group structure For the year ended 30 June 2017 Financial statements 19. Subsidiaries (continued) Entity % % Entity CMFL Services Ltd CMNZ Investments Pty Ltd CMPQ (CML) Pty Ltd Coles Ansett Travel Pty Ltd Coles Financial Services Pty Ltd Coles Group Asia Pty Ltd Coles Group Deposit Services Pty Ltd Coles Group Finance (USA) Pty Ltd Coles Group Finance Limited Coles Group International Pty Ltd Coles Group Limited Coles Group New Zealand Holdings Limited Coles Group Properties Holdings Ltd Coles Group Property Developments Ltd Coles Group Superannuation Fund Pty Ltd Coles Group Supply Chain Pty Ltd Coles Melbourne Ltd Coles Online Pty Ltd Coles Properties WA Ltd Coles Property Management Pty Ltd Coles Retail Services Pty Ltd Coles Stores (New Zealand) Limited Coles Supermarkets Australia Pty Ltd ConsortiumCo Pty Ltd Coo-ee Investments Pty Limited Coregas NZ Coregas Pty Ltd CSA Retail (Finance) Pty Ltd CSBP Ammonia Terminal Pty Ltd CSBP Limited CTE Pty Ltd Cuming Smith and Company Limited Curragh Coal Sales Co Pty Ltd Curragh Queensland Mining Pty Ltd Dairy Properties Pty Ltd Ditchburn Property Investments (UK) Ltd p Dowd Corporation Pty Ltd e.colesgroup Pty Ltd e.tailing (Coles Group) Pty Ltd Eastfarmers Pty Ltd ECC Pty Ltd ENV.Australia Pty Ltd Environmental and Licensing Professionals Pty Ltd Eureka Operations Pty Ltd FBP Awards Fund Pty Ltd FIF Investments Pty Limited Fifthgrange Limited p Fitzgibbons Hotel Pty Ltd Fitzinn Pty Ltd Focal Point (Lighting) Limited p Fosseys (Australia) Pty Ltd GBPL Pty Ltd GPML Pty Ltd Greencap Holdings Limited % % Greencap Pty Ltd (formerly Greencap - NAA Pty Ltd) Grocery Holdings Pty Ltd Hampden Group Limited p HHGL (ROI) Limited (formerly Homebase House and Garden Centre Limited) p HHGL Limited (formerly Homebase Limited) p Home Charm Group Limited p Home Charm Group Trustees Limited p Homebase (NI) Limited p Homebase Card Handling Services Limited p Homebase Direct Limited p Homebase Group (2000) Limited p Homebase Group Limited p Homebase Holdings Limited p Homebase Spend & Save Limited p Hotel Wickham Investments Pty Ltd HouseWorks Co Pty Ltd Howard Smith Limited Howard Smith Nominees Pty Limited Hunter Property Investments s Iconford Limited p Incorporatewear Limited p Index Limited p J Blackwood & Son Pty Ltd James Patrick & Co Pty Ltd (in liquidation) KAS Direct Sourcing Private Limited # KAS Global Holdings Pty Ltd (formerly Kmart Australia Sourcing Pty Ltd) KAS Global Trading Pty Ltd t KAS International Sourcing Bangladesh PVT x KAS International Trading (Shanghai) Company Limited u KAS Pty Limited t Katies Fashions (Aust) Pty Limited Kleenheat Gas House Franchising Pty Ltd Kleenheat Pty Ltd Kmart Australia Limited Kwinana Nitrogen Company Proprietary Limited Lawvale Pty Ltd Lexden BH (Colchester) p Lexden BH p LHG Pty Ltd LHG2 Pty Ltd LHG3 Pty Ltd Liftco Pty Limited Liquorland (Australia) Pty Ltd Liquorland (Qld) Pty Ltd Loggia Pty Ltd Loyalty Pacific Pty Ltd Manacol Pty Limited Masters Hardware Limited Masters Home Improvement Limited MC2 Pacific Pty Ltd Meredith Distribution (NSW) Pty Ltd Meredith Distribution Pty Ltd About this report Capital Risk Segment information Key numbers Group structure Unrecognised items Other 129
132 Financial statements Notes to the financial statements: Group structure For the year ended 30 June Subsidiaries (continued) Entity % % Entity % % MI Home Limited p Millars (WA) Pty Ltd Modern Interiors Limited p Modwood Technologies Pty Ltd Multimedia Services Pty Ltd ~ Mycar Automotive Pty Ltd Neat N Trim Uniforms Pty Ltd Newmart Pty Ltd now.com.au Pty Ltd NZ Finance Holdings Pty Limited Officeworks Businessdirect Pty Ltd Officeworks Ltd Officeworks Property Pty Ltd Officeworks Superstores NZ Limited Pailou Pty Ltd Patrick Operations Pty Ltd Petersen Bros Pty Ltd Powertrain Pty Limited Premier Power Sales Pty Ltd Procurement Online Pty Ltd Protector Alsafe Pty Ltd Protex Healthcare (Aus) Pty Ltd PT Blackwoods Indonesia m Quickinstant Limited p R & N Palmer Pty Ltd Rapid Evacuation Training Services Pty Ltd Relationship Services Pty Limited Retail Australia Consortium Pty Ltd Retail Investments Pty Ltd Retail Ready Operations Australia Pty Ltd Richardson & Richardson, Unipessoal, LDA v Richmond Plaza Shopping Centre Pty Ltd Ruissellement Limited p Sandfords Limited p SBS Rural IAMA Pty Limited Scones Jam n Cream Pty Ltd Sellers (SA) Pty Ltd Share Nominees Limited Sotico Pty Ltd Target Australia Pty Ltd Target Australia Sourcing (Shanghai) Co Ltd # u Target Australia Sourcing Limited # t Texas (NI) Limited p Texas Homecare (Northern Ireland) Limited p Texas Homecare Installation Services Limited p Texas Homecare Limited p Texas Installations Limited p Texas Services Limited p TGT Sourcing India Private Limited # The Builders Warehouse Group Pty Limited The Franked Income Fund The Grape Management Pty Ltd The Westralian Farmers Limited The Workwear Group HK Limited (formerly TGT Procurement Asia Limited) # t The Workwear Group Holding Pty Ltd The Workwear Group Pty Ltd Tickoth Pty Ltd Tooronga Holdings Pty Ltd Trend Décor Limited p Trimevac Pty Ltd Tyre and Auto Pty Ltd Tyremaster (Wholesale) Pty Ltd Tyremaster Pty Ltd Ucone Pty Ltd Validus Group Pty Ltd Valley Investments Pty Ltd Viking Direct Pty Limited W4K.World 4 Kids Pty Ltd Waratah Cove Pty Ltd Wesfarmers Agribusiness Limited Wesfarmers Bengalla Limited Wesfarmers Bengalla Management Pty Ltd Wesfarmers Bunnings Limited Wesfarmers Chemical US Holdings Corp z Wesfarmers Chemicals, Energy & Fertilisers Limited Wesfarmers Coal Resources Pty Ltd Wesfarmers Curragh Pty Ltd Wesfarmers Emerging Ventures Pty Ltd Wesfarmers Energy (Gas Sales) Limited Wesfarmers Energy (Industrial Gas) Pty Ltd Wesfarmers Fertilizers Pty Ltd Wesfarmers Finance Holding Company Pty Ltd Wesfarmers Finance Pty Ltd Wesfarmers Gas Limited Wesfarmers Holdings Pty Ltd Wesfarmers Industrial & Safety Holdings NZ Limited # Wesfarmers Industrial & Safety NZ Limited # Wesfarmers Industrial and Safety Pty Ltd Wesfarmers Insurance Investments Pty Ltd Wesfarmers Investments Pty Ltd Wesfarmers Kleenheat Gas Pty Ltd Wesfarmers LNG Pty Ltd Wesfarmers Loyalty Management Pty Ltd Wesfarmers LPG Pty Ltd Wesfarmers Oil & Gas Pty Ltd Wesfarmers Private Equity Pty Ltd Wesfarmers Provident Fund Pty Ltd Wesfarmers Railroad Holdings Pty Ltd Wesfarmers Resources Limited Wesfarmers Retail Holdings Pty Ltd Wesfarmers Retail Pty Ltd Wesfarmers Risk Management (Singapore) Pte Ltd z Wesfarmers Risk Management Limited # t Wesfarmers Securities Management Pty Ltd Wesfarmers Sugar Company Pty Ltd Wesfarmers Superannuation Pty Ltd Wesfarmers Transport Indonesia Pty Ltd Wesfarmers Transport Limited Weskem Pty Ltd Westralian Farmers Superphosphates Limited
133 Notes to the financial statements: Group structure For the year ended 30 June 2017 Financial statements 19. Subsidiaries (continued) Entity % % WEV Capital Investments Pty Ltd WFCL Investments Pty Ltd WFPL Funding Co Pty Ltd WFPL No 2 Pty Ltd WFPL Security SPV Pty Ltd WFPL SPV Pty Ltd WIS International Pty Ltd WIS Solutions Pty Ltd WIS Supply Chain Management (Shanghai) Co Ltd u WPP Holdings Pty Ltd WWG Middle East Apparel Trading LLC q XCC (Retail) Pty Ltd Yakka Pty Limited Entity acquired/incorporated during the Entity dissolved/deregistered during the year. ~ Audited by firms of Ernst & Young International. # Audited by other firms of accountants. < An ASIC-approved Deed of Cross Guarantee has been entered into by Wesfarmers Limited and these entities. + Refer note 23 for further details. All subsidiaries are incorporated in Australia unless identified with one of the following symbols: Bangladesh Bermuda Botswana Cayman Islands China Hong Kong India Indonesia Republic of Ireland New Zealand Portugal Singapore United Arab Emirates United Kingdom United States of America x t y s u t m p v z z All entities utilise the functional currency of the country of incorporation with the exception of Wesfarmers Risk Management Limited, which utilises the Australian dollar and KAS International Trading (Shanghai) Company Limited, PT Blackwoods Indonesia and Wesfarmers Oil & Gas Pty Ltd, which utilise the US dollar. About this report Capital Risk Segment information Key numbers Group structure Unrecognised items Other 131
134 Financial statements Notes to the financial statements: Unrecognised items For the year ended 30 June Commitments and contingencies Consolidated Operating lease commitments Group as lessee (i) Within one year Greater than one year but not more than five years More than five years Group as lessor (ii) Within one year Greater than one year but not more than five years More than five years Capital commitments (iii) Within one year Arising from agreements to invest in Gresham Private Equity Funds Other expenditure commitments (iv) Within one year Greater than one year but not more than five years More than five years Contingencies (v) Trading guarantees $m $m 2,410 2,456 7,986 8,097 9,158 9,519 19,554 20, At 30 June 2017, the Group did not have any commitments relating to its joint arrangements. i. The Group has entered into commercial leases on office, retail and distribution properties, motor vehicles and office equipment. The lease terms and implicit interest rates vary significantly. For the lease of buildings, the lease terms range from one year to 25 years and have various renewal or purchase options, escalation clauses, termination rights and residual liability clauses. Operating lease commitments refer to future undiscounted minimum rentals payable under noncancellable operating leases not included within this financial report. Operating lease payments are recognised as an expense in the income statement on a straight-line basis over the lease term. Operating lease incentives are recognised as a liability when received and released to earnings on a straight-line basis over the lease term. Fixed rate increases to lease payments, excluding contingent or index-based rental increases, such as Consumer Price Index, turnover rental and other similar increases, are recognised on a straight-line basis over the lease term. ii. Contracted non-cancellable future minimum lease payments expected to be received in relation to non-cancellable sub-leases are not included in this financial report. iii. Commitments arising from contracts for capital expenditure contracted for at balance date are not included in this financial report. iv. Contracted other expenditure commitments are not included in this financial report. v. Contingent liabilities at balance date are not included in this financial report. Group operating lease commitments as lessee ($m) Within one year One to five years Greater than five years 0 2,000 4,000 6,000 8,000 10,000 Guarantees The Group has issued a number of bank guarantees to third parties for various operational and legal purposes. It is not expected that these guarantees will be called on. On acquisition of the Coles group, Wesfarmers assumed responsibility for the guarantees entered into by the Coles group relating to the sale of its Myer business in June 2006, under which Coles group had guaranteed the performance of certain lease agreements held by Myer Ltd. The guarantees amount to $2 million (2016: $4 million). The fair value of these guarantees is not considered to be material and has not been recognised in this financial report. Other Certain companies within the Group are party to various legal actions that have arisen in the normal course of business. It is expected that any liabilities arising from such legal action would not have a material effect on the Group s financial performance. 21. Events after the reporting period Dividends A fully-franked final ordinary dividend of 120 cents per share resulting in a dividend of $1,361 million was declared for a payment date of 28 September The dividend has not been provided for in the 30 June 2017 full-year financial statements. Kmart brand name acquisition In August 2017, Kmart acquired the Kmart brand name in Australia and New Zealand, which was previously used by the business under a long-term licence agreement, for $100 million. The transaction is not expected to have a material impact on Kmart s earnings. Key judgements: leases The Group classifies leases between finance and operating depending on whether the Group holds substantially all of the risks and rewards incidental to ownership or not. In making this assessment, the Group primarily considers the asset ownership at the end of the lease term, any purchase options, the lease term in relation to the asset s life, the present value of future lease payments in relation to the asset s fair value and the nature of the asset. The reported lease commitments of the Group excludes rent that was considered contingent at lease inception. The effect of this exclusion on the reported lease commitments is not material. 132
135 Notes to the financial statements: Other For the year ended 30 June 2017 Financial statements 22. Parent disclosures Assets Current assets Non-current assets Total assets Liabilities Current liabilities Non-current liabilities Total liabilities Net assets Equity Equity attributable to equity holders of the parent Issued capital Employee reserved shares Retained earnings Dividends reserve Restructure tax reserve Hedging reserve Share-based payments reserve Total equity Profit attributable to members of the parent Total comprehensive income for the year, net of tax, attributable to members of the parent Contingencies Contingent liabilities at balance date, not included in this financial report, were as follows: Trading guarantees PARENT $m $m 8,681 9,255 22,639 23,002 31,320 32,257 2,039 1,718 4,017 5,871 6,056 7,589 25,264 24,668 22,239 21,908 - (2) 2, , ,264 24,668 2,474 2,330 2,458 2, Wesfarmers is party to various legal actions that have arisen in the normal course of business. It is expected that any liabilities arising from such legal action would not have a material adverse effect on the Group s financial report. Dividends reserve The dividends reserve was created by the parent entity for the purposes of segregating profits from which dividends to shareholders can be paid. Guarantees Wesfarmers Limited and certain Australian controlled entities are parties to a Deed of Cross Guarantee (the Deed) as disclosed in note 23. Parent entity financial information The financial information for the parent entity has been prepared on the same basis as the consolidated financial statements, except as set out below. Investments in subsidiaries, associates and joint venture entities Investments in subsidiaries, associates and joint venture entities are accounted for at cost in the financial statements of the parent. Dividends received from associates are recognised in the parent entity s profit or loss when its right to receive the dividend is established. 23. Deed of Cross Guarantee The subsidiaries identified with a + in note 19 are parties to a deed of cross guarantee under which each company guarantees the debts of the others. By entering into the Deed, the wholly owned entities have been relieved from the requirement to prepare a financial report and directors report under ASIC Corporations (Wholly-owned Companies) Instrument 2016/785. These subsidiaries and Wesfarmers Limited together referred to as the Closed Group, either originally entered into the Deed on 27 June 2008 or have subsequently joined the Deed by way of an Assumption Deed. The effect of the Deed is that each party to it has guaranteed to pay any deficiency in the event of the winding up of any of the entities in the Closed Group. No entities joined the Closed Group by way of an Assumption Deed throughout the period. The entities leaving the Closed Group by way of a Revocation Deed are: Coles Group Asia Pty Ltd, on 13 June 2017 Protector Alsafe Pty Ltd, on 13 June 2017 Wesfarmers Curragh Pty Ltd, on 31 January 2017 No entities left the Closed Group by way of a disposal throughout the period. The consolidated income statement and retained earnings of the entities that are members of the Closed Group is as follows: Consolidated income statement and retained earnings Profit from continuing operations before income tax Profit from discontinued operations before income tax Income tax expense Net profit for the year Retained earnings at beginning of year Remeasurement gain on defined benefit plan, net of tax Adjustment for companies transferred into/out of the Closed Group Total available for appropriation Dividends provided for or paid Retained earnings at end of year Consolidated statement of comprehensive income Profit for the year Other comprehensive income Items that may be reclassified to profit or loss: Foreign currency translation reserve Exchange differences on translation of foreign operations Cash flow hedge reserve Unrealised losses on cash flow hedges Realised losses/(gains) transferred to non-financial assets/net profit Share of associates and joint venture reserves Tax effect Items that will not be reclassified to profit or loss: Retained earnings Remeasurment loss on defined benefit plan Other comprehensive income/(loss) for the year, net of tax Total comprehensive income for the year, net of tax Continuing operations Discontinued operations DEED DEED $m $m 4,030 1, (1,227) (617) 3, ,049 4,154 1 (3) (1,136) 1,458 6,025 6,321 (2,235) (2,272) 3,790 4,049 DEED DEED $m $m 3, (3) (143) (46) 191 (105) - 8 (17) 46 1 (3) 80 (103) 2, , About this report Capital Risk Segment information Key numbers Group structure Unrecognised items Other 133
136 Financial statements Notes to the financial statements: Other For the year ended 30 June Deed of Cross Guarantee (continued) 24. Auditors remuneration The consolidated balance sheet of the entities that are members of the Closed Group is as follows: DEED DEED Consolidated balance sheet $m $m Assets Current assets Cash and cash equivalents Receivables - Trade and other Receivables - Finance advances and loans Inventories Derivatives Other Total current assets Non-current assets Receivables Investment in controlled entities Investments in associates and joint ventures Deferred tax assets Property Plant and equipment Goodwill Intangible assets Derivatives Other Total non-current assets Total assets Liabilities Current liabilities Trade and other payables Interest-bearing loans and borrowings Income tax payable Provisions Derivatives Other Total current liabilities Non-current liabilities Payables Interest-bearing loans and borrowings Provisions Derivatives Other Total non-current liabilities Total liabilities Net assets Equity Issued capital Reserved shares Retained earnings Reserves Total equity 1, ,266 1, ,536 5, ,058 8, ,579 4, ,056 1,556 2,150 6,374 6,913 13,725 13,770 4,539 4, ,627 33,739 41,685 42,250 5,850 5,743 1, ,649 1, ,378 8,423 1, ,649 5,402 1,125 1, ,187 7,841 15,565 16,264 26,120 25,986 22,268 21,937 (26) (28) 3,790 4, ,120 25,986 Fees of the auditors of the company for: Audit services Audit and review of financial reports Ernst & Young (Australia) Ernst & Young (Overseas network firms) Assurance-related services Ernst & Young (Australian & overseas network firms) Other audit firms Non-audit services Ernst & Young (Australian & overseas network firms): - tax compliance - other Total paid to auditors CONSOLIDATED $ 000 $ 000 5,723 5, ,272 2, ,915 8,684 1,088 1,096 1, ,307 1,978 10,222 10,662 The total non-audit services fees of $2,307 thousand represents 23.1 per cent of the total fees paid or payable to Ernst & Young and related practices for the year ended 30 June The total non-audit services fees and assurance-related services fees was $3,579 thousand representing 35.8 per cent of the total fees paid or payable to Ernst & Young and related practices for the year ended 30 June Related party transactions CONSOLIDATED $ 000 $ 000 Associates Management fees received 12,129 11,881 Operating lease rent paid 141, ,098 Financial advisory fees paid 2,356 1,699 Amounts receivable from associates 14,549 14,030 Reimbursement for lease upgrades Amounts owing to associates Other related party transactions Joint arrangements Management fees received Operating lease rent paid 57,598 74,788 Amounts receivable from joint venture 4,981 5,097 Other related party transactions Management fees have been paid by associated entity, BWP Trust, to the Group on normal commercial terms and conditions for staff and other services provided to associates. Rent for retail stores and warehouses has been paid by the Group to an associated entity, BWP Trust, and to the ISPT and BPI No. 1 Pty Ltd joint arrangements. During the year, ISPT paid the Group $186,100 thousand (2016: nil from ISPT and $9,200 thousand from BWP Trust) for the acquisition and development of rental properties. Gains and losses were made on disposal, a portion of which was eliminated in the consolidated accounts under equity accounting. Other related party transactions include sales to associates and joint arrangements on normal commercial terms and conditions. 134
137 Notes to the financial statements: Other For the year ended 30 June 2017 Financial statements 25. Related party transactions (continued) J P Graham, a director of Wesfarmers, has a majority shareholding interest in a company which jointly owns Gresham Partners Group Limited on an equal basis with a wholly owned subsidiary of Wesfarmers. Partly owned subsidiaries of Gresham Partners Group Limited have provided office accommodation and advisory services to Wesfarmers and were paid fees of $2,356,069 in 2017 (2016: $1,698,838). P M Bassat, a director of Wesfarmers, is a director of AFL Sportsready Limited which has provided training services to Wesfarmers Group companies on an arm s length and normal commercial terms basis and was paid $449,350 in Other accounting policies (a) New and amended accounting standards and interpretations adopted from 1 July 2016 All new and amended Australian Accounting Standards and Interpretations mandatory as at 1 July 2016 to the Group have been adopted, including: Reference Description The effects of the following Standards were not material: AASB Amendments to Australian Accounting Standards Accounting for Acquisitions of Interests in Joint Operations AASB Clarification of Acceptable Methods of Depreciation and Amortisation AASB Amendments to Australian Accounting Standards Annual Improvements to Australian Accounting Standards Cycle AASB Amendments to Australian Accounting Standards Disclosure Initiative: Amendments to AASB 101 This makes amendments to AASB 11 Joint Arrangements to provide guidance on the accounting for acquisitions of interests in joint operations in which the activity constitutes a business. The IASB has clarified that the use of revenue-based methods to calculate the depreciation of an asset is not appropriate because revenue generated by an activity that includes the use of an asset generally reflects factors other than the consumption of the economic benefits embodied in the asset. The amendment also clarified that revenue is generally presumed to be an inappropriate basis for measuring the consumption of an intangible asset. The amendment makes changes to a number of accounting policies including the methods of disposal in AASB 5 Non-current Assets Held for Sale and Discontinued Operations, disclosure requirements in AASB 7 Financial Instruments: Disclosures and AASB 134 Interim Financial Reporting and clarification of discount rates utilised in AASB 119 Employee Benefits. The Standard makes amendments to AASB 101 Presentation of Financial Statements arising from the IASB s Disclosure Initiative project. (b) New and amended standards and interpretations issued but not yet effective The following standards, amendments to standards and interpretations are relevant to current operations. They are available for early adoption but have not been applied by the Group in this financial report. About this report Capital Risk Segment information Key numbers Reference Description Application of Standard Application by Group The effects of the following Standards are not expected to be material: Amendments to AASB 9 Financial Instruments (December 2014) and AASB Amendments to Australian Accounting Standards arising from AASB 9 (December 2014) This Standard makes amendments to a number of Australian Accounting Standards as a result of AASB 9 Financial Instruments (December 2014). The final version of AASB 9 introduces a new expected-loss impairment model that will require more timely recognition of expected credit losses. Specifically, the new Standard requires entities to account for expected credit losses from when financial instruments are first recognised and to recognise full lifetime expected losses on a more timely basis. 1 January July 2018 Group structure AASB Amendments to Australian Accounting Standards Sale or Contribution of Assets between an Investor and its Associate or Joint Venture AASB Amendments to Australian Accounting Standards Recognition of Deferred Tax Assets for Unrealised Losses AASB Amendments to Australian Accounting Standards Disclosure Initiative: Amendments to AASB 107 The amendments require: a full gain or loss to be recognised when a transaction involves a business (whether it is housed in a subsidiary or not); and a partial gain or loss to be recognised when a transaction involves assets that do not constitute a business, even if these assets are housed in a subsidiary. This Standard amends AASB 112 Income Taxes (July 2004) and AASB 112 Income Taxes (August 2015) to clarify the requirements on recognition of deferred tax assets for unrealised losses on debt instruments measured at fair value. This Standard amends AASB 107 Statement of Cash Flows (August 2015) to require entities preparing financial statements in accordance with Tier 1 reporting requirements to provide disclosures that enable users of financial statements to evaluate changes in liabilities arising from financing activities, including both changes arising from cash flows and non-cash changes. 1 January July January July January July 2017 Unrecognised items Other 135
138 Financial statements Notes to the financial statements: Other For the year ended 30 June Other accounting policies (continued) Reference AASB Amendments to Australian Accounting Standards - Classification and Measurement of Share-based Payment Transactions Description Application of Standard Application by Group This Standard amends AASB 2 Share-based Payment to clarify accounting for the effects of vesting and non-vesting conditions on the measurement of cash-settled share-based payments, transactions with a net settlement feature for withholding tax obligations and a modification to the terms and conditions that changes the classification of the transaction from cash-settled to equity-settled share-based payments. 1 January July 2018 AASB Amendments to Australian Accounting Standards Further Annual Improvements Cycle AASB Interpretation 22 Foreign Currency Transactions and Advance Consideration IFRIC 23 Uncertainty over Income Tax Treatments This Standard clarifies the scope of AASB 12 Disclosure of Interests in Other Entities by specifying that the disclosure requirements apply to an entity s interests in other entities that are classified as held for sale or discontinued operations in their capacity as owners or discontinued operations in accordance with AASB 5 Non-current Assets Held for Sale and Discontinued Operations. This interpretation clarifies the determination of the spot exchange rate on initial recognition of related assets, expenses or income on the derecognition of a non-monetary asset or nonmonetary liability arising from the payment or receipt of advance considerations. This interpretation clarifies the application of the recognition and measurement criteria in IAS Income Taxes when there is uncertainty over income tax treatments. The interpretation addresses whether an entity considers uncertain tax treatments separately and how an entity determines taxable profit or loss, tax bases, unused tax losses or tax credits and tax rates. 1 January July January July January July 2019 AASB 15 Revenue from Contracts with Customers (AASB 15) This Standard establishes new principles for reporting information to users of financial statements about the nature, amount, timing and uncertainty of revenue and cash flows arising from an entity s contracts with customers and supersedes a number of current Revenue Standards. The core principle of the Standard is that an entity recognises revenue to depict the transfer of promised goods or services to customers in an amount that reflects the consideration to which the entity expects to be entitled in exchange for those goods or services. 1 January July 2018 Revenue recognition streams are continually evolving across the Group and management will continue to assess the impact of this Standard accordingly. As at 30 June 2017, the Group does not expect the application of AASB 15 to have a material effect on the consolidated net income, balance sheet or cash flows of the Group. The Group is planning to adopt this standard on 1 July 2018 using the modified transition approach. The effect of the following Standard is expected to be material: AASB 16 Leases (AASB 16) This Standard introduces a single lessee accounting model and requires a lessee to recognise assets and liabilities for all leases with a term of more than 12 months, unless underlying asset is of low value. A lessee is required to recognise a right-of-use asset representing its right to use the underlying leased asset and a lease liability representing its obligations to make lease payments. 1 January July 2019 The Group is currently evaluating the implications of AASB 16. Information on the undiscounted amount of the Group s operating lease commitments at 30 June 2017 under AASB 117, the current leases standard, is disclosed in note 20. Under AASB 16, the present value of these commitments would be shown as a liability on the balance sheet together with an asset representing the right-of-use. The ongoing income statement classification of what is currently predominantly presented as occupancy-related expenses will be split between amortisation and interest expense. (c) Tax consolidation Wesfarmers and its 100 per cent-owned Australian resident subsidiaries have formed a tax consolidated group with effect from 1 July Wesfarmers is the head entity of the tax consolidated group. Members of the group have entered into a tax sharing agreement in order to allocate income tax expense to the wholly owned subsidiaries on a stand-alone basis. The tax sharing arrangement provides for the allocation of income tax liabilities between the entities should the head entity default on its tax payment obligations. The possibility of such a default is considered remote at the date of this report. Members of the tax consolidated group have entered into a tax funding agreement. The group has applied the group allocation approach in determining the appropriate amount of current taxes to allocate to members of the tax consolidated group. The tax funding agreement provides for each member of the tax consolidated group to pay a tax equivalent amount to or from the parent in accordance with their notional current tax liability or current tax asset. Such amounts are reflected in amounts receivable from or payable to the parent company in their accounts and are settled as soon as practicable after lodgement of the consolidated return and payment of the tax liability. 136
139 Notes to the financial statements: Other For the year ended 30 June 2017 Financial statements 27. Share-based payments The Group provides benefits to employees (including executive directors) of the Group through share-based incentives. Employees are paid for their services or incentivised for their performance in part through shares or rights over shares. The expense arising from these transactions is shown in note 2. The total number of ordinary Wesfarmers shares acquired on market during the financial year to satisfy employee incentive schemes was 482,356 (2016: 602,433) at an average price of $42.84 (2016: $40.54) per share. Recognition and measurement Share-based payments can either be equity-settled or cashsettled. If the employee is provided a choice of settlement options then the scheme is considered to be cash-settled. Equity-settled transactions The cost of equity-settled transactions with employees is measured using their fair value at the date at which they are granted. In determining the fair value, no account is taken of any performance conditions other than those linked to the price of the shares of Wesfarmers Limited (market conditions). The cost of equity-settled transactions is recognised, together with a corresponding increase in equity, over the period in which any performance conditions (excluding market conditions) are met, ending on the date on which the employees become fully entitled to the award (vesting date). The cumulative expense recognised for equity-settled transactions at each reporting date until vesting date reflects the extent to which the vesting period has expired and the proportion of the awards that are expected to ultimately vest. No expense is recognised for awards that do not ultimately vest due to a performance condition not being met. The expense is recognised in full if the awards do not vest (or are not exercised) due to a market condition not being met. Where the terms of an equity-settled award are modified, as a minimum, an expense is recognised as if the terms had not been modified. In addition, an expense is recognised for any increase in the value of the transaction as a result of the modification, as measured at the date of modification. Where an equity-settled award is cancelled, it is treated as if it had vested on the date of cancellation, and any expense not yet recognised for the award is recognised immediately. However, if a new award is substituted for the cancelled award, and designated as a replacement award on the date that it is granted, the cancelled and new award are treated as if they were a modification of the original award, as described above. Cash-settled transactions The ultimate expense recognised in relation to cash-settled transactions will be equal to the actual cash paid to the employees, which will be the fair value at settlement date. The expected cash payment is estimated at each reporting date and a liability recognised to the extent that the vesting period has expired and in proportion to the amount of the awards that are expected to ultimately vest. Additional information on award schemes Wesfarmers Employee Share Plan (WESP) The last issue under the WESP was made in December Under the plan, employees were invited to apply for ordinary shares in the company, funded by an interest-free loan from the Group. The employees obligation for repayment of the loans is limited to the dividends declared and capital returns by the company and, in the event the employee ceases employment, the market price achieved on the sale of the shares. The plan is accounted for as an in-substance equity-settled award, with the contractual life of each option equivalent to the estimated loan life and no maximum term. Wesfarmers Long-Term Incentive Plan (WLTIP) Under the 2016 WLTIP, the Group Managing Director and Finance Director were invited to receive performance rights in the company. The performance hurdle for these performance rights is Wesfarmers TSR relative to the TSR of the ASX 50 Index. The fair value of the performance rights are determined using an option pricing model with the following inputs: Grant date 10 Nov 2016 Grant date share price ($) Volatility (per cent) Dividend yield (per cent) 4.49 Risk-free rate (per cent) 1.85 Fair value ($) The Board approved Mr Goyder and Mr Bowen s unvested WLTIP rights continuing to be restricted in the plan after they leave the Group, waiving the four-year service period required for a WLTIP grant as at the date they cease employment. Key Executive Equity Performance Plan (KEEPP) KEEPP was introduced in September 2016 and under the plan, eligible executives were invited to receive performance shares in the company. There are two performance hurdles divisional EBIT and RoC (80 per cent weighting) and Wesfarmers TSR relative to the TSR of the ASX 50 Index (20 per cent weighting). The fair value of the performance shares with a TSR hurdle is determined using an option pricing model with the following inputs: Grant date 29 Sep 2016 Grant date share price ($) Volatility (per cent) Risk-free rate (per cent) 1.61 Fair value ($) About this report Capital Risk Segment information Key numbers Group structure Equity-settled awards outstanding Weighted average share price in 2017 was $42.33 (2016: $40.56). The following table includes shares subject to trading restrictions. WESP WLTIP KEEPP WESAP (options) (shares) (rights) (shares) (shares) (rights) Outstanding at the beginning of the year 793, ,236 1,975,983-7,160,218 - Granted during the year - 90, , ,472 3,062, ,621 Exercised during the year (342,961) (144,770) (42,064) - (2,194,780) - Lapsed during the year - - (560,798) - (281,613) - Other adjustments (20,274) - Outstanding at the end of the year 450, ,553 1,497, ,472 7,725, ,621 Exercisable at the end of the year 1,091,268 1,569, ,666,546 - Unrecognised items Other 137
140 Financial statements Notes to the financial statements: Other For the year ended 30 June Share-based payments (continued) 29. Tax transparency disclosures Key Executive Equity Performance Plan (KEEPP) (continued) Eligible executives also received a restricted shares award under the KEEPP. However, if an executive resigns or is terminated for cause within a year, the Board may decide to cancel that share allocation. The fair value of the share at grant date is expensed over the one year forfeiture period. The grant date share price is the fair value of both the restricted share and the performance share with EBIT and RoC hurdles. Further details of the WLTIP and KEEPP and of the terms of the grants during the year are provided in the remuneration report. Wesfarmers Employee Share Acquisition Plan (WESAP) The WESAP was introduced in October Under the plan, all eligible employees are invited to acquire fully-paid ordinary shares in the company. The shares are either acquired under a salary sacrifice arrangement or are granted as an award, subject to the Group achieving a net profit after tax performance hurdle. Eligibility for an award of shares is dependent upon an in-service period with a participating division and being a permanent employee. The plan qualifies as a non-discriminatory employee share scheme complying with the requirements of Division 83A of the Income Tax Assessment Act 1997 (as amended) for Australian resident employees. The fair value of the equity instruments granted (2017 average: $42.52 (2016 average: $40.29)) is determined with reference to the share price on the date of grant. Wesfarmers Employee Share Acquisition Plan (WESAP) - Executives In November 2016, WESAP was introduced to eligible executives. Under this offer, eligible executives were invited to receive an award of Wesfarmers fully-paid ordinary shares or an equivalent cash payment at the end of a three-year performance period. The Board has discretion to settle the award with shares or cash. If an executive resigns or is terminated for cause within three years, the Board may decide whether to cancel the share allocation or cash payment.the fair value of the equity instruments granted (2017 average: $42.52) is determined with reference to the share price on the date of grant. In February 2016, the Board of Taxation provided its final report to the Australian Government on a voluntary tax transparency code (TTC). The report contained recommendations for additional disclosure of tax information by companies split between Part A and Part B disclosures. The Part B disclosures are publishable in a separate Taxes Paid report. The Part A disclosures are: a reconciliation of accounting profit to tax expense and to income tax paid or income tax payable; the identification of material temporary and non-temporary differences; and the effective company tax rates for Australian and global operations. A reconciliation of Wesfarmers accounting profit to its tax expense and material temporary and non-temporary differences are disclosed in note 3. A reconciliation of accounting profit to income tax paid or payable and the effective company tax rates for the Group s Australian and global operations are tabled below. CONSOLIDATED $m $m Tax paid or payable reconciliation Accounting profit 4,138 1,038 Income tax at the statutory tax rate of 30% 1, Non-deductible items Temporary differences: deferred tax Associates and other (25) (31) Current year tax paid or payable 1, Effective tax rate Effective tax rate for Australian operations 29.9% 67.8% Effective tax rate for Australian operations (excluding Target goodwill impairment 1 ) 29.9% 28.9% Effective tax rate for global operations 30.6% 60.8% Effective tax rate for global operations (excluding Target goodwill impairment 1 ) 30.6% 28.1% 28. Director and executive disclosures Compensation of key management personnel The remuneration disclosures are provided in sections one to six of the remuneration report on pages 73 to 92 of this annual report designated as audited and forming part of the directors report. 1 The $1,208 million impairment of Target s goodwill recognised during FY2016 was a non-deductible item. CONSOLIDATED $ 000 $ 000 Short-term benefits 23,674 22,129 Long-term benefits Post-employment benefits 1, Share-based payments 16,828 4,769 41,976 28,062 Other transactions with key management personnel Refer to note 25 in relation to transactions with Gresham Partners Group Limited and AFL Sportsready Limited in which J P Graham and P M Bassat are directors respectively. From time to time, directors of Wesfarmers or its controlled entities, or their director-related entities, may purchase goods or services from the Group. These purchases are on the same terms and conditions as those entered into by other consolidated entity employees or customers and are trivial or domestic in nature. 138
141 Directors declaration Wesfarmers Limited and its controlled entities Overview In accordance with a resolution of the directors of Wesfarmers Limited, we state that: 1. In the opinion of the directors: 1.1 the financial statements, notes and the additional disclosures included in the directors report designated as audited, of the consolidated entity for the full-year ended 30 June 2017 are in accordance with the Corporations Act 2001, including: (a) giving a true and fair view of the consolidated entity s financial position as at 30 June 2017 and of its performance for the year ended on that date; and (b) complying with Australian Accounting Standards (including the Australian Accounting Interpretations) and the Corporations Regulations 2001; and 1.2 the financial statements and notes comply with International Financial Reporting Standards as disclosed in the notes to the financial statements on page 99 of the 2017 Annual Report; and 1.3 there are reasonable grounds to believe that the company will be able to pay its debts as and when they become due and payable. 2. This declaration has been made after receiving the declaration required to be made to the directors in accordance with section 295A of the Corporations Act 2001 for the financial year ended 30 June In the opinion of the directors, as at the date of this declaration, there are reasonable grounds to believe that the members of the Closed Group comprising the company and the controlled entities marked + as identified in note 19 will be able to meet any obligations or liabilities to which they are or may become subject to by virtue of the Deed of Cross Guarantee referred to in note 23. On behalf of the Board: Operating and financial review Sustainability Governance M A Chaney AO Chairman Perth 19 September 2017 R J B Goyder AO Managing Director Directors report Financial statements Signed reports 139 Shareholder and ASX information
142 Signed reports Independent auditor's report to the Members of Wesfarmers Limited Ernst & Young 11 Mounts Bay Road Perth WA 6000 Australia GPO Box M939 Perth WA 6843 Tel: Fax: ey.com/au Report on the audit of the financial report Opinion We have audited the financial report of Wesfarmers Limited (the Company) and its subsidiaries (collectively the Group), which comprises the consolidated balance sheet as at 30 June 2017, the consolidated income statement, the consolidated statement of comprehensive income, the consolidated statement of changes in equity and the consolidated cash flow statement for the year then ended, notes to the financial statements and the directors' declaration. In our opinion, the accompanying financial report of the Group is in accordance with the Corporations Act 2001, including: a) giving a true and fair view of the consolidated financial position of the Group as at 30 June 2017 and of its consolidated financial performance for the year ended on that date; and b) complying with Australian Accounting Standards and the Corporations Regulations Basis for opinion We conducted our audit in accordance with Australian Auditing Standards. Our responsibilities under those standards are further described in the Auditor s Responsibilities for the Audit of the Financial Report section of our report. We are independent of the Group in accordance with the auditor independence requirements of the Corporations Act 2001 and the ethical requirements of the Accounting Professional and Ethical Standards Board s APES 110 Code of Ethics for Professional Accountants (the Code) that are relevant to our audit of the financial report in Australia. We have also fulfilled our other ethical responsibilities in accordance with the Code. We believe that the audit evidence we have obtained is sufficient and appropriate to provide a basis for our opinion. Key audit matters Key audit matters are those matters that, in our professional judgement, were of most significance in our audit of the financial report of the current year. These matters were addressed in the context of our audit of the financial report as a whole, and in forming our opinion thereon, but we do not provide a separate opinion on these matters. For each matter below, our description of how our audit addressed the matter is provided in that context. We have fulfilled the responsibilities described in the Auditor s Responsibilities for the Audit of the Financial Report section of our report, including in relation to these matters. Accordingly, our audit included the performance of procedures designed to respond to our assessment of the risks of material misstatement of the financial report. The results of our audit procedures, including the procedures performed to address the matters below, provide the basis for our audit opinion on the accompanying financial report. A member firm of Ernst & Young Global Limited Liability limited by a scheme approved under Professional Standards Legislation 140
143 Independent auditor's report to the Members of Wesfarmers Limited Overview 1. Impairment of non-current assets including intangible assets Why significant The determination of the recoverable amounts of property, plant and equipment, goodwill and other intangible assets requires significant judgement by the Group. As required by Australian Accounting Standards, the Group assesses at the end of each reporting period whether there are any triggers indicating that an asset may be impaired. Goodwill is assessed for impairment at least annually. Impairment assessments are typically complex and judgemental, as they include the modelling of a range of assumptions and estimates that will be impacted by future performance and market conditions. There were no material impairments recognised during the 2017 financial year. Key assumptions, judgements and estimates applied in the Group s assessment are set out in Note 17 Impairment of nonfinancial assets (Note 17) of the financial report. Target Note 17 includes a statement that Target s recoverable value is marginally above its carrying value and is sensitive to changes in the discount rate and the terminal value. Based on the disclosed sensitivity analysis, changes to the key assumptions applied in the impairment test could give rise to an impairment of the carrying value of the Target cash generating unit (CGU). Critical to supporting the recoverability of the Target CGU, is the business ability to achieve its planned trading results. Curragh As disclosed in Note 17, Curragh s recoverable value is sensitive to changes in its discount rate and forecast post-tax cash flows over the life of the mine. Any adverse movement in these key assumptions may result in impairment whilst a strengthening of key inputs would result in a reversal of previously recognised impairment. How our audit addressed the key audit matter Our audit procedures included an evaluation of the assumptions and methodologies utilised in the assessments, in particular those relating to the determination of CGUs, forecast cash flows, growth rates, discount rates, comparative industry valuation multiples and other market evidence. We involved our valuation specialists to evaluate the appropriateness of key inputs, where relevant to the impairment tests, including: Discount rates Terminal growth rates Market evidence of industry earnings valuation multiples Long-term inflation and growth rate assumptions Commodity price assumptions Forecast exchange rate assumptions. We also considered the adequacy of the financial report disclosures regarding the impairment testing approach, key assumptions and sensitivities. Operating and financial review Sustainability Governance Directors report Financial statements Signed reports A member firm of Ernst & Young Global Limited Liability limited by a scheme approved under Professional Standards Legislation 141 Shareholder and ASX information
144 Signed reports Independent auditor's report to the Members of Wesfarmers Limited 2. Supplier rebates Why significant Supplier rebates, also described in the financial report as commercial income, refers to rebates received by the Group from suppliers associated with its retail operations. We have determined this to be a key audit matter due to the quantum of commercial income recognised during the year and the judgement required to be exercised in relation to a number of factors, including: The commercial terms of each individual rebate The appropriate timing of recognition Consideration of the nature of the rebate and whether the amount should be applied against the carrying value of inventory or recognised in the income statement The accurate recognition and measurement of rebates in accordance with Australian Accounting Standards and the Group s related processes and controls. Disclosures relating to the measurement and recognition of commercial income can be found in Note 6 Inventories. How our audit addressed the key audit matter Our audit procedures in respect of commercial income included the following: We gained an understanding of the nature of each material type of commercial income including assessing the significant agreements in place We assessed the design and operating effectiveness of relevant controls in place relating to the recognition and measurement of rebate amounts We performed comparisons of the various rebate arrangements against the prior year and budget, including analysis of aging profiles and where material variances were identified, obtained supporting evidence We tested a sample of supplier rebates to supporting documentation We analysed suppliers with significant promotional credits, other rebates and agreed balances to supporting documentation We inspected a sample of material new contracts entered into, both before and after the balance date and assessed whether the treatment adopted by the Group was appropriate We inquired of legal counsel as to the existence of other rebate contracts or contracts with unusual terms and conditions We inquired of business representatives including product category merchandisers, supply chain managers and procurement staff as to the existence of any non-standard agreements or side arrangements. 3. Finalisation of the acquisition accounting of Homebase Why significant The Group accounted for the acquisition of Hampden Group Limited (Homebase) as a business combination under Australian Accounting Standard AASB 3 Business Combinations (AASB 3) and determined the acquisition date for accounting purposes to be 29 February AASB 3 permits a 12 month provisional accounting period, during which the initial acquisition accounting can be revised to reflect the facts and circumstances that existed at the acquisition date. The 12 month provisional accounting period expired on 28 February 2017, by which time the Group finalised the acquisition accounting valuations. We have determined this to be a key audit matter due to the size of the acquisition and the judgement involved in determining the fair value of the assets acquired and liabilities assumed. How our audit addressed the key audit matter Our audit procedures in respect of the finalisation of the acquisition accounting included the following: We assessed the Group s acquisition accounting methodology including assessing all changes to key judgements and estimates supporting the updated fair value assessment of the assets acquired and liabilities assumed We assessed whether there had been any changes to the provisional fair values of identifiable assets acquired and liabilities assumed at the date of the acquisition from those disclosed in the 30 June 2016 financial report We involved our valuations, tax and real estate specialists to assess the recognition and valuation of resulting assets and liabilities. Disclosures relating to the finalisation of the acquisition can be found in the Significant items in the current reporting period section of the financial report. A member firm of Ernst & Young Global Limited Liability limited by a scheme approved under Professional Standards Legislation 142
145 Independent auditor's report to the Members of Wesfarmers Limited Overview Information other than the financial report and auditor s report thereon The directors are responsible for the other information. The other information comprises the information included in the Group s Annual Report for the year ended 30 June 2017, but does not include the financial report and our auditor s report thereon. Our opinion on the financial report does not cover the other information and accordingly we do not express any form of assurance conclusion thereon, with the exception of the Remuneration Report and our related assurance option. In connection with our audit of the financial report, our responsibility is to read the other information and, in doing so, consider whether the other information is materially inconsistent with the financial report or our knowledge obtained in the audit or otherwise appears to be materially misstated. If, based on the work we have performed, we conclude that there is a material misstatement of this other information, we are required to report that fact. We have nothing to report in this regard. Responsibilities of the directors for the financial report The directors of the Company are responsible for the preparation of the financial report that gives a true and fair view in accordance with Australian Accounting Standards and the Corporations Act 2001 and for such internal control as the directors determine is necessary to enable the preparation of the financial report that gives a true and fair view and is free from material misstatement, whether due to fraud or error. Operating and financial review Sustainability In preparing the financial report, the directors are responsible for assessing the Group s ability to continue as a going concern, disclosing, as applicable, matters relating to going concern and using the going concern basis of accounting unless the directors either intend to liquidate the Group or to cease operations, or have no realistic alternative but to do so. Auditor's responsibilities for the audit of the financial report Our objectives are to obtain reasonable assurance about whether the financial report as a whole is free from material misstatement, whether due to fraud or error, and to issue an auditor s report that includes our opinion. Reasonable assurance is a high level of assurance, but is not a guarantee that an audit conducted in accordance with the Australian Auditing Standards will always detect a material misstatement when it exists. Misstatements can arise from fraud or error and are considered material if, individually or in the aggregate, they could reasonably be expected to influence the economic decisions of users taken on the basis of this financial report. Governance As part of an audit in accordance with the Australian Auditing Standards, we exercise professional judgement and maintain professional scepticism throughout the audit. We also: Identify and assess the risks of material misstatement of the financial report, whether due to fraud or error, design and perform audit procedures responsive to those risks, and obtain audit evidence that is sufficient and appropriate to provide a basis for our opinion. The risk of not detecting a material misstatement resulting from fraud is higher than for one resulting from error, as fraud may involve collusion, forgery, intentional omissions, misrepresentations, or the override of internal control. Obtain an understanding of internal control relevant to the audit in order to design audit procedures that are appropriate in the circumstances, but not for the purpose of expressing an opinion on the effectiveness of the Group s internal control. Evaluate the appropriateness of accounting policies used and the reasonableness of accounting estimates and related disclosures made by the directors. Conclude on the appropriateness of the directors use of the going concern basis of accounting and, based on the audit evidence obtained, whether a material uncertainty exists related to events or conditions that may cast significant doubt on the Group s ability to continue as a going concern. If we conclude that a material uncertainty exists, we are required to draw attention in our auditor s report to the related disclosures in the financial report or, if such disclosures are inadequate, to modify our opinion. Our conclusions are based on the audit evidence obtained up to the date of our auditor s report. However, future events or conditions may cause the Group to cease to continue as a going concern. Evaluate the overall presentation, structure and content of the financial report, including the disclosures, and whether the financial report represents the underlying transactions and events in a manner that achieves fair presentation. Obtain sufficient appropriate audit evidence regarding the financial information of the entities or business activities within the Group to express an opinion on the financial report. We are responsible for the direction, supervision and performance of the Group audit. We remain solely responsible for our audit opinion. We communicate with the directors regarding, among other matters, the planned scope and timing of the audit and significant audit findings, including any significant deficiencies in internal control that we identify during our audit. We also provide the directors with a statement that we have complied with relevant ethical requirements regarding independence, and to communicate with them all relationships and other matters that may reasonably be thought to bear on our independence, and where applicable, related safeguards. Directors report Financial statements Signed reports From the matters communicated to the directors, we determine those matters that were of most significance in the audit of the financial report of the current year and are therefore the key audit matters. We describe these matters in our auditor s report unless law or regulation precludes public disclosure about the matter or when, in extremely rare circumstances, we determine that a matter should not be communicated in our report because the adverse consequences of doing so would reasonably be expected to outweigh the public interest benefits of such communication. A member firm of Ernst & Young Global Limited Liability limited by a scheme approved under Professional Standards Legislation 143 Shareholder and ASX information
146 Signed reports Independent auditor's report to the Members of Wesfarmers Limited Report on the audit of the Remuneration Report Opinion on the Remuneration Report We have audited the Remuneration Report included on pages 73 to 92 of the directors' report for the year ended 30 June In our opinion, the Remuneration Report of Wesfarmers Limited for the year ended 30 June 2017 complies with section 300A of the Corporations Act Responsibilities The directors of the Company are responsible for the preparation and presentation of the Remuneration Report in accordance with section 300A of the Corporations Act Our responsibility is to express an opinion on the Remuneration Report, based on our audit conducted in accordance with Australian Auditing Standards. Ernst & Young D S Lewsen Partner Perth 19 September 2017 A member firm of Ernst & Young Global Limited Liability limited by a scheme approved under Professional Standards Legislation 144
147 Annual statement of coal resources and reserves as at 30 June 2017 Overview Coal resources The table below details the coal resources for Wesfarmers, as at 30 June 2017: Mine Ownership Beneficial interest Location of tenements 2017 COAL RESOURCES TONNES (MILLIONS) Likely mining method Coal type Measured Indicated Inferred Total RESOURCES QUALITY (IN SITU) Ash (%) CV Sulphur (MJ/kg) (%) VM (%) Operating and financial review Curragh Wesfarmers Bowen Basin, 100% equity Curragh Pty Ltd Queensland Open cut Metallurgical and steaming Bengalla Wesfarmers Hunter 40% equity Bengalla Limited Valley, New South Wales Comparative resources as at 30 June 2016: Open cut and underground Metallurgical and steaming Sustainability 2016 COAL RESOURCES TONNES (MILLIONS) RESOURCES QUALITY (IN SITU) Mine Ownership Beneficial interest Location of tenements Likely mining method Coal type Measured Indicated Inferred Total Ash (%) CV Sulphur (MJ/kg) (%) VM (%) Curragh Bengalla Wesfarmers Bowen Basin, 100% equity Curragh Pty Ltd Queensland Wesfarmers Hunter 40% equity Bengalla Limited Valley, New South Wales Open cut Open cut and underground Metallurgical and steaming Metallurgical and steaming Governance Resource notes: 1. Inclusion/exclusion of reserves a) Curragh s coal resources are reported as being in addition to coal reserves. b) Bengalla s coal resources are reported as being in addition to coal reserves. 2. Quality a) Curragh s in situ resource quality parameters are quoted on an air-dried basis. b) Bengalla s in situ resource quality parameters are quoted on an air-dried basis. c) Tonnage and grades have been rounded and therefore small differences may be present in the totals. Curragh a) Curragh's resources, as stated, are 100 per cent of the site resources, including all resources in the Curragh Project mining leases. Wesfarmers Curragh Pty Ltd ( WCPL ) and Stanwell Corporation ( Stanwell ) share in value generated from certain parts of the Curragh Project (being the Curragh and Curragh North mining areas, but excluding the MDL 162 area) pursuant to the terms of a Coal Supply Agreement between them ('Stanwell CSA'). Resources are reported above on a project basis before any division of economic value under the Stanwell CSA. It is not possible to express the economic entitlements of Stanwell with respect to the Curragh Project as a simple numerical percentage. The reason such a statement is not possible is that the entitlements of Stanwell pursuant to the Stanwell CSA are variable with, and dependent upon, contingent events which include all of the actual export volumes, prices, and the duration of the Stanwell CSA relative to the timing and mine sequencing of production from the various areas of the Curragh Project. It is not necessary for the Competent Person to analyse the Stanwell CSA and respective entitlements of WCPL and Stanwell thereunder given that resources are stated on a total Curragh Project basis before application of the Stanwell CSA. b) In addition to the requirements of the Stanwell CSA, an estimated 318 million tonnes of the resources reported, while within the Curragh North Mining Lease, require further agreement with Stanwell in order for WCPL to access ( Stanwell Reserved Area ). c) There is a change to the coal resource at Curragh due to changes in the mined footprint. d) Since 30 June 2016, no other activity has taken place which would constitute a material change to the resources for the Curragh Project. Directors report Financial statements Signed reports Bengalla a) Bengalla s resources, as stated, are 100 per cent of the site resources, with Wesfarmers Bengalla Limited s beneficial interest in the Bengalla unincorporated joint venture being 40 per cent. b) Since 30 June 2016, no other activity has taken place which would constitute a material change to the resources for Bengalla. 145 Shareholder and ASX information
148 Shareholder and ASX information Annual statement of coal resources and reserves as at 30 June 2017 Coal reserves The table below details the coal reserves for Wesfarmers, as at 30 June 2017: 2017 COAL RESERVES TONNES (MILLIONS) RESERVES QUALITY (INCLUSIVE OF LOSS AND DILUTION) Mine Ownership Beneficial interest Location of tenements Likely mining method Coal type Proved Probable Total Ash (%) CV (MJ/kg) Sulphur (%) VM (%) Curragh Wesfarmers Curragh Pty Ltd 100% equity Bowen Basin, Queensland Open cut Metallurgical and steaming Bengalla Wesfarmers Bengalla Limited 40% equity Hunter Valley, New South Wales Open cut Steaming Comparative reserves as at 30 June 2016: 2016 COAL RESERVES TONNES (MILLIONS) RESERVES QUALITY (INCLUSIVE OF LOSS AND DILUTION) Mine Ownership Beneficial interest Location of tenements Likely mining method Coal type Proved Probable Total Ash (%) CV (MJ/kg) Sulphur (%) VM (%) Curragh Wesfarmers Curragh Pty Ltd 100% equity Bowen Basin, Queensland Open cut Metallurgical and steaming Bengalla Wesfarmers Bengalla Limited 40% equity Hunter Valley, New South Wales Open cut Steaming Reserve notes: 1. Quality and quantity a) Curragh s reserves quality parameters are quoted on an air-dried basis. b) Bengalla s reserves quality parameters are quoted on an air-dried basis. c) Reserve qualities and quantities are inclusive of mining loss and out-of-seam dilution. d) All tonnes and grade information has been rounded and therefore small differences may be present in the totals. 2. Reserves reported on a 100 per cent project basis Curragh a) Curragh s reserves, as stated, are 100 per cent of the site reserves, including all reserves in the Curragh Project. Wesfarmers Curragh Pty Ltd ( WCPL ) and Stanwell Corporation ( Stanwell ) share in value generated from certain parts of the Curragh Project (being the Curragh and Curragh North mining areas, but excluding the MDL 162 area) pursuant to the terms of a Coal Supply Agreement between them ( Stanwell CSA ) Reserves are reported above on a project basis before any division of economic value under the Stanwell CSA. It is not possible to express the economic entitlements of Stanwell from the Curragh Project as a simple numerical percentage. The reason such a statement is not possible is that the entitlements of Stanwell pursuant to the Stanwell CSA are variable with, and dependent upon, contingent events which include all of the actual future export volumes, prices, and the duration of the Stanwell CSA relative to the timing and mine sequencing of production from the various areas of the Curragh Project. It is not necessary for the Competent Person to analyse the Stanwell CSA and respective entitlements of WCPL and Stanwell thereunder given that reserves are stated on a total Curragh Project basis before application of the Stanwell CSA. b) No reserves have been declared with respect to the Stanwell Reserved Area. Bengalla a) Bengalla s reserves, as stated, are 100 per cent of the site reserves, with Wesfarmers Bengalla Limited s beneficial interest in the Bengalla unincorporated joint venture being 40 per cent. b) Since 30 June 2016, the coal reserves have been reduced by a quantity equal to the mining depletion for the 12 months to 30 June No other activity has taken place which would constitute a material change to the reserves for Bengalla. c) Bengalla has development consent to mine within ML1397 and ML1729 until MACH Energy Australia Pty Ltd holds a surface lease (ML1645) which overlays part of ML1729 for the purpose of locating infrastructure associated with their Mount Pleasant Project. There is an agreement between the holder of ML1645 and Bengalla which provides for the removal of the Mount Pleasant infrastructure in stipulated circumstances, to allow for the mining of coal within ML1729. Due to the presence of the aforementioned consent and agreement, it has been assumed that all economic reserves within ML1397 and ML1729 are recoverable at this point in time. 146
149 Annual statement of coal resources and reserves as at 30 June 2017 Overview Characteristics of coal reserves and resources Curragh The coal is bituminous and is used for power generation (principally domestic) and metallurgical processes (primarily steel production overseas). The resource is contained in five seams of varying thickness and quality characteristics. Coal is produced from all of these seams. Coal is extracted by open cut methods and processed through a wash plant using dense medium cyclones and froth flotation. Operating and financial review Bengalla The coal is bituminous and used in export markets for power generation. Coal is extracted from eight seams of varying thickness and quality characteristics. The seams occur at relatively shallow depths and dip gently to the west. Coal is extracted by open cut methods. JORC Code compliance The statement of coal resources and coal reserves presented in this report has been produced in accordance with the 2012 edition of the Australasian Code for Reporting of Exploration Results, Mineral Resources and Ore Reserves (JORC Code). Sustainability Governance arrangements and internal controls Wesfarmers has put in place governance arrangements and internal controls with respect to its estimates of reserves and resources and the estimation process including: Oversight and approval of each annual statement by responsible senior officers; Establishment of internal procedures and controls to meet JORC Code compliance in all external reporting; Independent external review of new and materially changed estimates at regular intervals; Annual reconciliation with internal planning to validate reserves estimates for operating mines; and Internal technical audits of resources and reserves estimates for each asset. For Bengalla, where the Wesfarmers Group is not the managing entity, the Wesfarmers Group relies on the estimates of resources and reserves as reported by the Bengalla Mining Company. General Preparation of this statement requires the Competent Person to adopt certain forward-looking assumptions including export coal price and cost assumptions. These assumptions are commercially confidential. Long-term export price assumptions are considered reasonable but differ from actual prices prevailing as at the balance date. These types of forward-looking assumptions are necessarily subject to risks, uncertainties and other factors, many of which are outside the control of the Wesfarmers Limited Group. For the avoidance of doubt, neither the Competent Persons nor the Wesfarmers Limited Group makes any undertaking to subsequently update any forward-looking statements in this release to reflect events after the date of this release. The information in this report relating to coal resources and reserves is based on, and fairly represents, information compiled by Competent Persons (as defined in the JORC Code, and listed below). All Competent Persons have at the time of reporting, sufficient experience relevant to the style of mineralisation and type of deposit under consideration and to the activity they are undertaking to qualify as a Competent Person as defined by the JORC Code. Each Competent Person consents to the inclusion in this report of the matters based on their information in the form and context in which it appears. Governance Directors report Financial statements Competent Persons Curragh Mr Barry Saunders, Director of QGESS Pty Ltd Member AusIMM (CP), Member AIG Mr Paul Wood, a full-time employee of Wesfarmers Resources Limited, a wholly owned subsidiary of Wesfarmers Limited Member AusIMM (CP) (Min) Signed reports Bengalla Mr Patrick Tyrrell, a full-time employee of New Hope Corporation Limited Member AusIMM (CP) Mr Tony O Connell, a Director of Optimal Mining Solutions Pty Limited Member AusIMM 147 Shareholder and ASX information
150 Shareholder and ASX information Shareholder information Substantial shareholders As at the date of this report The Vanguard Group, Inc., holding per cent, is a substantial shareholder for the purposes of Part 6C.1 of the Corporations Act Voting rights Wesfarmers fully-paid ordinary shares carry voting rights of one vote per share. Distribution of members and their holdings Size of holdings Number of shareholdings 1 1, ,337 1,001 5,000 94,071 5,001 10,000 10,301 10, ,000 5, ,001 and over 169 There were 13,075 shareholders that held less than a marketable parcel of Wesfarmers ordinary shares. There were 1.22 per cent of shareholders with registered addresses outside Australia. Twenty largest shareholders The 20 largest shareholders of ordinary shares on the company s register as at 19 September 2017 were: Name Number of shares % of issued capital HSBC Custody Nominees (Australia) Limited 240,962, J P Morgan Nominees Australia Limited 139,338, Citicorp Nominees Pty Limited 65,400, National Nominees Limited 42,999, BNP Paribas Nominees Pty Ltd (Agency Lending DRP A/C) 24,172, BNP Paribas Noms Pty Ltd (DRP) 13,194, HSBC Custody Nominees (Australia) Limited (Nt-Comnwlth Super Corp A/C) 9,144, Citicorp Nominees Pty Limited (Colonial First State Inv A/C) 7,674, Australian Foundation Investment Company Limited 6,722, CPU Share Plans Pty Limited (WESAP DFE Control A/C) 5,845, Argo Investments Limited 5,440, AMP Life Limited 4,761, Goldman Sachs Australia + Nominee Holdings Pty Ltd (WES Ltd Div Inv Plan A/C) 3,155, Milton Corporation Limited 2,835, IOOF Investment Management Limited (IPS Super A/C) 2,818, CPU Share Plans Pty Limited (WES Exu Control A/C) 2,744, Navigator Australia Ltd (MLC Investment Sett A/C) 2,116, CPU Share Plans Pty Limited (WES WLTIP Control A/C) 1,959, Nulis Nominees (Australia) Limited (Navigator Mast Plan Sett A/C) 1,802, Netwealth Investments Limited (Wrap Services A/C) 1,599, The percentage holding of the 20 largest shareholders of Wesfarmers ordinary shares was
151 Five-year financial history Overview All figures in $m unless shown otherwise Restated Restated Summarised income statement 3 Sales revenue 68,099 65,643 62,129 59,903 57,466 Other operating revenue Operating revenue 68,444 65,981 62,447 60,181 57,749 Operating profit before depreciation and amortisation, finance costs and income tax 5,668 2,642 4,978 3,877 4,486 Depreciation and amortisation (1,266) (1,296) (1,219) (1,082) (1,033) EBIT 4,402 1,346 3,759 2,795 3,453 Finance costs (264) (308) (315) (346) (417) Income tax expense (1,265) (631) (1,004) (939) (908) Profit after tax from discontinued operations , Operating profit after income tax attributable to members of Wesfarmers Limited 2, ,440 2,689 2,261 Capital and dividends Ordinary shares on issue (number) 000's as at 30 June 1,133,840 1,126,131 1,123,753 1,143,275 1,157,194 Paid up ordinary capital as at 30 June 22,268 21,937 21,844 22,708 23,290 Fully-franked dividend per ordinary share declared (cents) Capital management: capital return and fully-franked dividend components Financial performance Earnings per share (weighted average) (cents) Earnings per share growth 603.6% (83.2%) (7.9%) 19.8% 6.4% Return on average ordinary shareholders' equity (R12) (excluding significant items 4 ) 12.4% 9.6% 9.8% 10.5% 8.9% Fixed charges cover (R12, times) (excluding significant items 4 ) Interest cover (cash basis) (R12, times) (excluding significant items 4 ) Operating and financial review Sustainability Governance Financial position as at 30 June Total assets 40,115 40,783 40,402 39,727 43,155 Total liabilities 16,174 17,834 15,621 13,740 17,133 Net assets 23,941 22,949 24,781 25,987 26,022 Net tangible asset backing per ordinary share $4.44 $3.45 $4.85 $6.14 $4.69 Net debt to equity 20.1% 31.0% 25.1% 13.1% 20.2% Total liabilities/total assets 40.3% 43.7% 38.7% 34.6% 39.7% Directors report Stock market capitalisation as at 30 June 45,490 45,158 43,860 47,835 45,936 1 The 2014 numbers have been restated to reflect the disposal of WesCEF's interest in Air Liquide WA Pty Ltd as a discontinued operation. 2 The 2013 numbers have been restated to reflect the classification of the Insurance division as a discontinued operation. 3 The summarised income statement for 2016 includes significant items relating to the following pre-tax (post-tax) items: $1,266 million ($1,249 million) non-cash impairment of Target; $850 million ($595 million) non-cash impairment of Curragh; and $145 million ($102 million) of restructuring costs and provisions to reset Target. 4 The 2016 number excludes the significant items outlined in footnote 3 above. Financial statements Signed reports 149 Shareholder and ASX information
152 Shareholder and ASX information Investor information Managing your shareholding The company s share registry is managed by Computershare Investor Services Pty Limited (Computershare). The Investor Centre website is the fastest, easiest and most convenient way to view and manage your shareholding. Investor Centre enables a shareholder to: view the company share price; change your banking details; change your address (for non-chess sponsored holdings); update your dividend instructions; update your Tax File Number (TFN), Australian Business Number (ABN) or exemption; select your and communication preferences; view your transaction and dividend history; and generate a holding balance letter. Visit and click on Create Login for portfolio membership or click on Access a Single Holding for holding information. When communicating with Computershare or accessing your holding online you will need your Securityholder Reference Number (SRN) or Holder Identification Number (HIN) as shown on your Issuer Sponsored/CHESS statements. You can also contact Computershare by: Post: Telephone Australia: GPO Box 2975 Melbourne, Victoria 3001 Australia International: (+61 3) Website: Tax File Numbers While it is not compulsory to provide a TFN, if shareholders have not provided a TFN and Wesfarmers pays an unfranked or partly-franked dividend, the company will be required to deduct tax from the unfranked portion of the dividend at the top marginal rate plus the Medicare Levy. Shareholders can go online to update their TFN by visiting Change of name or consolidation of holdings Name changes or consolidation of multiple holdings into one single holding must be made in writing by using the required forms, which can be downloaded from and clicking on Need a Printable Form?. Uncertificated Share Register: The Wesfarmers share register is uncertificated. Two forms of uncertificated holdings are available to shareholders: Issuer sponsored holdings these holdings are sponsored by Wesfarmers and there is no need for shareholders to be sponsored by a stockbroker; and Broker sponsored holdings shareholders may arrange to be sponsored by a stockbroker who will require a signed sponsorship agreement. Holding statements are issued to shareholders within five business days after the end of any month in which transactions occur that alter the balance of their holding. Shareholders can also access details of their shareholdings and dividends paid on their holdings by visiting Information on Wesfarmers Wesfarmers website Up-to-date information on the company can be obtained from the company s website Securities Exchange listing Wesfarmers shares are listed on the Australian Securities Exchange under the code WES. Share prices can be accessed from major Australian newspapers, on the Wesfarmers website or at Dividend investment plan The company s dividend investment plan was reinstated with effect from 27 February Details of the plan can be obtained from the share registry or the Wesfarmers website. Privacy A copy of the Wesfarmers Privacy Policy is available on the Wesfarmers website. Wesfarmers Corporate Affairs department Further information and publications about the company s operations are available from the Corporate Affairs department on (08) (within Australia) or (+61 8) (International) or from the Wesfarmers website. 150
153 Corporate directory Wesfarmers Limited ABN Overview Registered office Level 14, Brookfield Place Tower St Georges Terrace Perth, Western Australia 6000 Telephone: (+61 8) Facsimile: (+61 8) Website: info@wesfarmers.com.au Executive directors Richard Goyder AO Group Managing Director and Chief Executive Officer Terry Bowen Finance Director (to 4 September 2017) Non-executive directors Michael Chaney AO Chairman Paul Bassat James Graham AM Tony Howarth AO Wayne Osborn Diane Smith-Gander Vanessa Wallace Jennifer Westacott Company Secretary Linda Kenyon Share registry Computershare Investor Services Pty Limited Yarra Falls, 452 Johnston Street Abbotsford, Victoria 3067 Telephone Australia: International: (+61 3) Facsimile Australia: (03) International: (+61 3) Website: Financial calendar + Record date for final dividend 23 August 2017 Final dividend paid 28 September 2017 Annual general meeting 16 November 2017 Half-year end 31 December 2017 Half-year profit announcement February 2018 Record date for interim dividend February 2018 Interim dividend payable April 2018 Year-end 30 June Timing of events is subject to change. Annual general meeting The 36th Annual General Meeting of Wesfarmers Limited will be held at the Perth Convention and Exhibition Centre, Mounts Bay Road, Perth, Western Australia on Thursday, 16 November 2017 at 1:00pm (Perth time). Website To view the 2017 annual report, shareholder and company information, news announcements, background information on Wesfarmers businesses and historical information, visit the Wesfarmers website at Operating and financial review Sustainability Governance Directors report Financial statements Signed reports 151 Shareholder and ASX information
154 Shareholder and ASX information Wesfarmers brands Coles Home Improvement Department Stores Officeworks Industrials Other businesses 152
155 The cover and pages 1 to 92 are printed on Monza. Monza Recycled is Certified Carbon Neutral by The Carbon Reduction Institute (CRI) in accordance with the global Greenhouse Protocol and ISO framework. Monza Recycled contains 55% recycled fibre (25% post-consumer and 30% preconsumer) and is FSC Mix Certified, which ensures that all virgin pulp is derived from responsible sources. It is manufactured by an ISO certified mill. The paper used from page 93 to 152 is printed on white offset laser. This is an environmentally responsible paper manufactured under the environmental management system ISO using Elemental Chlorine-Free (ECF) pulp derived from responsible sources. This paper is FSC Mixed Sources Chain of Custody (CoC) certified. Designed by Clarity Communications
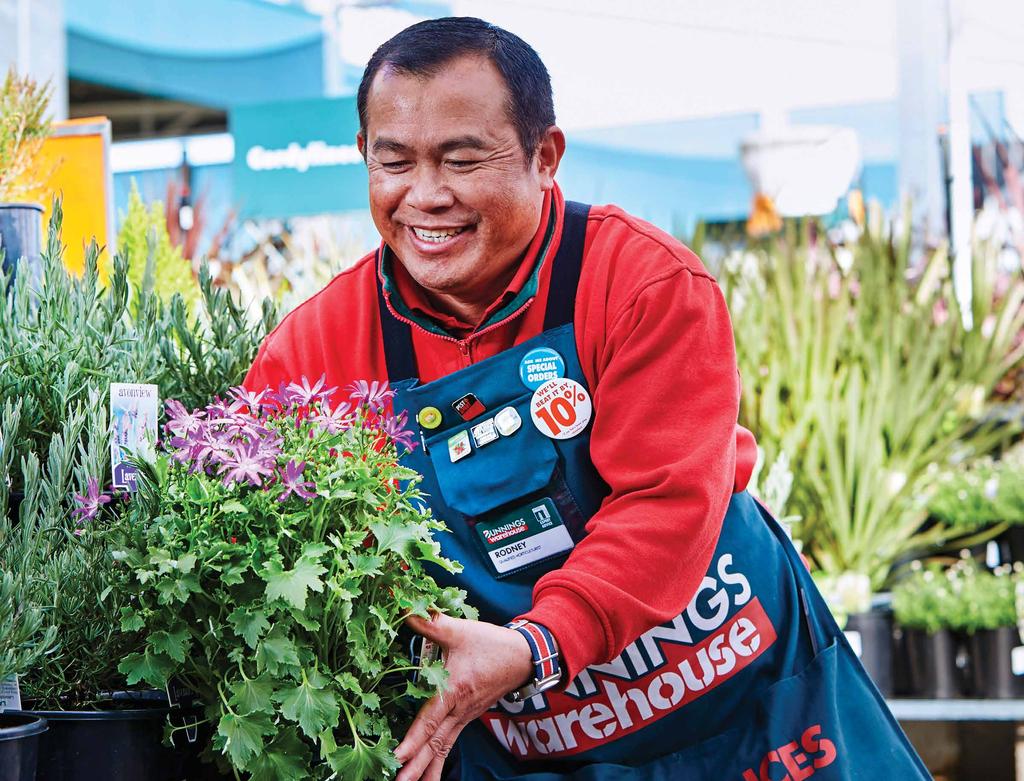
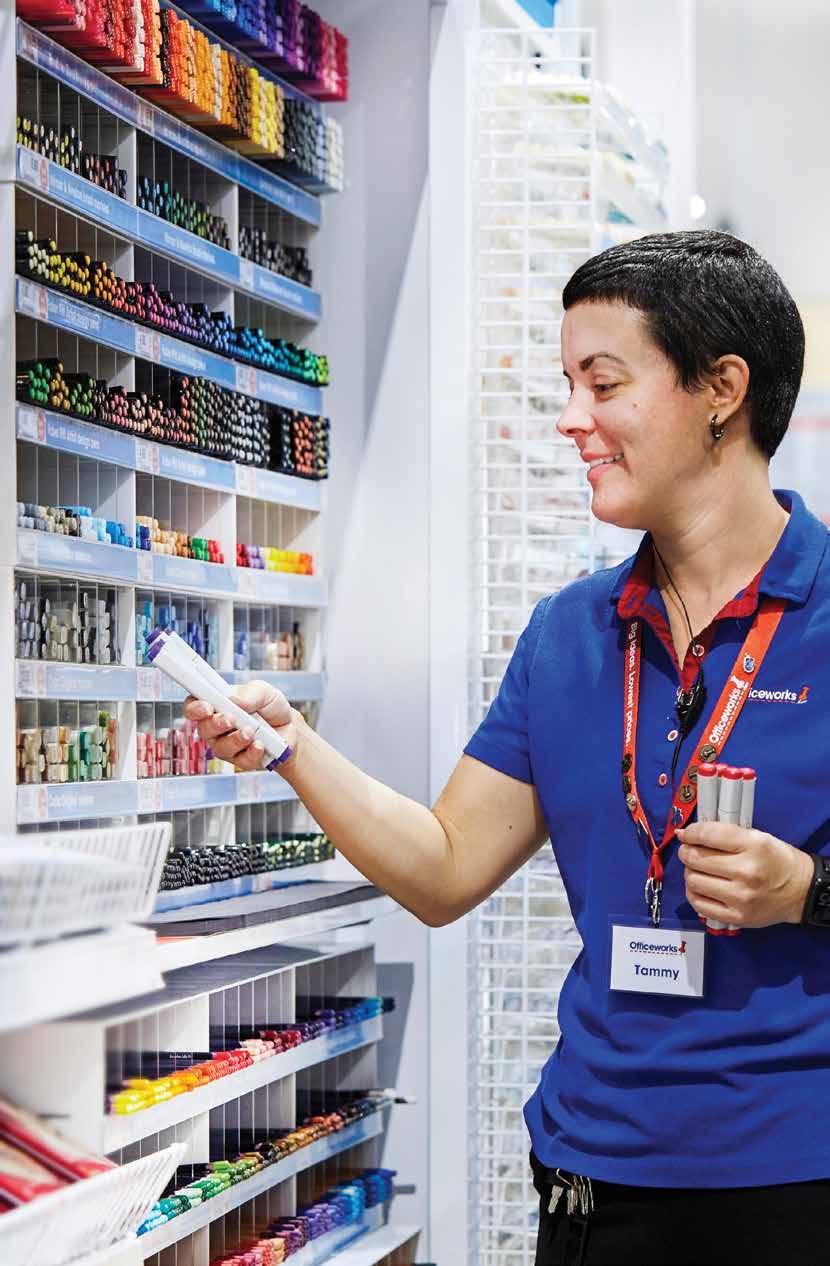

156 Delivering value today and tomorrow wesfarmers.com.au
Following is a presentation that is to be given at the Macquarie Australia Conference in Sydney today, Wednesday, 2 May 2018.
 2 May 218 The Manager Company Announcements Office Australian Securities Exchange Dear Manager, MACQUARIE CONFERENCE BRIEFING PRESENTATION Following is a presentation that is to be given at the Macquarie
2018 HALF-YEAR RESULTS SHAREHOLDER QUICK GUIDE
 2018 HALF-YEAR RESULTS SHAREHOLDER QUICK GUIDE 1 GROUP PERFORMANCE SUMMARY We are pleased to provide shareholders with a summary of Wesfarmers Limited s results for the half-year ended 31 December 2017.
SHAREHOLDER QUICK GUIDE 2016 FULL-YEAR RESULTS
 SHAREHOLDER QUICK GUIDE FULL-YEAR RESULTS FULL-YEAR RESULTS SHAREHOLDER QUICK GUIDE Group performance summary GROUP PERFORMANCE SUMMARY We are pleased to provide shareholders with a summary of Wesfarmers
SHAREHOLDER QUICK GUIDE 2017 FULL-YEAR RESULTS
 SHAREHOLDER QUICK GUIDE FULL-YEAR RESULTS 1 FULL-YEAR RESULTS SHAREHOLDER QUICK GUIDE Group performance summary GROUP PERFORMANCE SUMMARY The Group reported a net profit after tax (NPAT) of $2,873 million
2018 TAX CONTRIBUTION REPORT
 2018 TAX CONTRIBUTION REPORT CONTENTS 2 Wesfarmers brands 3 Message from the Chief Financial Officer 3 The Wesfarmers Way 4 Introduction to the Report 5 Effective company tax rate 6 Reconciliation of accounting
2017 Tax Contribution Report
 Tax Contribution Report Contents 3 Message from the Chief Financial Officer 3 Introduction 4 Effective company tax rate 5 Reconciliation of accounting profit to income tax expense and income tax payable
2018 First Quarter Retail Sales Results
 2018 First Quarter Retail Sales Results 25 October 2017 First Quarter Sales ($m) 2018 2017 Variance % Food & Liquor 1,2 7,968 7,850 1.5 Convenience 1,3 1,402 1,549 (9.5) Total Coles 9,370 9,399 (0.3) Bunnings
15 March The Manager Company Announcements Office Australia Securities Exchange. Dear Manager,
 15 March 2018 The Manager Company Announcements Office Australia Securities Exchange Dear Manager, INTENTION TO DEMERGE COLES - BRIEFING PRESENTATION Following is a presentation to be given at an investor
2017 Full-year Results Supplementary Information
 2017 Full-year Results Supplementary Information Thursday, 17 August 2017 (to be read in conjunction with the 2017 Full-year Results Briefing Presentation) Presentation outline Item Page Group Balance
NEWS 2012 FOURTH QUARTER AND FULL-YEAR RETAIL SALES RESULTS
 NEWS 26 July 2012 2012 FOURTH QUARTER AND FULL-YEAR RETAIL SALES RESULTS Full-Year Sales ($m) Financial Year 2012 Financial Year 2011 Movement (%) Food & Liquor 1,2 26,182 25,025 4.6 Convenience 1,3 7,516
For personal use only
 14 February 2017 The Manager Company Announcements Office Australia Securities Exchange Dear Sir, HALF-YEAR REPORT TO 31 DECEMBER 2016 In accordance with ASX Listing Rule 4.2A, attached is the 2017 Half-year
For personal use only
 29 April The Manager Company Announcements Office Australian Securities Exchange Dear Sir, THIRD QUARTER RETAIL SALES RESULTS Attached is an announcement regarding the third quarter retail sales results.
In accordance with ASX Listing Rule 4.2A, attached is the 2018 Half-year Report (incorporating Appendix 4D).
.") 20 February 2018 The Manager Company Announcements Office Australia Securities Exchange Dear Manager, HALF-YEAR REPORT TO 31 DECEMBER 2017 In accordance with ASX Listing Rule 4.2A, attached is the 2018
20 February 2018 The Manager Company Announcements Office Australia Securities Exchange Dear Manager, HALF-YEAR REPORT TO 31 DECEMBER 2017 In accordance with ASX Listing Rule 4.2A, attached is the 2018
Pre-seen case study for Strategic level examinations Papers E3, P3 and F3. For examinations in May 2014 and September 2014
 Pre-seen case study for Strategic level examinations Papers E3, P3 and F3 For examinations in May 2014 and September 2014 PRE-SEEN MATERIAL, PROVIDED IN ADVANCE FOR PREPARATION AND STUDY FOR THE EXAMINATIONS
2010 FOURTH QUARTER AND FULL YEAR RETAIL SALES RESULTS
 26 July 2010 The Manager Company Announcements Office Australian Securities Exchange Dear Sir, 2010 FOURTH QUARTER AND FULL YEAR RETAIL SALES RESULTS Please find attached an announcement regarding the
Half yearly report to shareholders six months to 31 December 1999
 Half yearly report to shareholders six months to 31 December 1999 Wesfarmers Limited ACN 008 984 049 Interim highlights Operating revenue up 4.3 per cent to $1.6 billion Operating profit after tax before
2017 Full-year Results Briefing Presentation. Thursday, 17 August 2017
 2017 Full-year Results Briefing Presentation Thursday, 17 August 2017 Presentation outline Item Presenter Page Group Performance Overview Richard Goyder 3 Group Balance Sheet & Cash Flow Terry Bowen 10
2018 Half-year Results Debt Investor Update
 2018 Half-year Results Debt Investor Update Group Performance Summary Group performance summary Half-year ended 31 December ($m) 2017 2016 Var % Revenue 35,903 34,917 2.8 EBIT 1,113 2,429 (54.2) EBIT (exc.
For personal use only. Agreement to acquire UK home improvement & garden retailer Homebase
 Agreement to acquire UK home improvement & garden retailer Homebase 18 January 2016 Acquisition overview & rationale Acquisition overview Acquisition of 100 per cent of Home Retail Group plc s holding
WESFARMERS FORECASTS CONTINUED STRONG GROWTH
 WESFARMERS FORECASTS CONTINUED STRONG GROWTH 13 June 2001 Wesfarmers Limited today announced its takeover offer for all of the shares in Howard Smith Limited and provided its bidder s statement (the Bidder
2017 Half-year Results Supplementary Information
 207 Half-year Results Supplementary Information To be read in conjunction with the 207 Half-year Results Briefing Presentation to be held on Wednesday, 5 February 207 Presentation outline Item Page Group
2017 Full-year Results European Debt Investor Update. September 2017
 2017 Full-year Results European Debt Investor Update September 2017 Company overview Long track record established in 1914 7 th largest company listed on the ASX with market capitalisation of A$47.7b 1
In accordance with ASX Listing Rule 4.2A, attached is the 2019 Half-year Report (incorporating Appendix 4D).
.") 20 February 2019 The Manager Company Announcements Office Australia Securities Exchange Dear Manager, HALF-YEAR REPORT TO 31 DECEMBER 2018 In accordance with ASX Listing Rule 4.2A, attached is the 2019
20 February 2019 The Manager Company Announcements Office Australia Securities Exchange Dear Manager, HALF-YEAR REPORT TO 31 DECEMBER 2018 In accordance with ASX Listing Rule 4.2A, attached is the 2019
APPENDIX 4E PRELIMINARY FINAL REPORT AND 2017 FULL-YEAR RESULTS
 17 August 2017 The Manager Company Announcements Office Australian Securities Exchange Dear Manager, APPENDIX 4E PRELIMINARY FINAL REPORT AND 2017 FULL-YEAR RESULTS In accordance with ASX Listing Rule
2018 Half-year Results Supplementary Information
 2018 Half-year Results Supplementary Information Wednesday, 21 February 2018 (to be read in conjunction with the 2018 Half-year Results Briefing Presentation) Presentation outline Item Page Group Balance
2018 Half-year Results Briefing Presentation. Wednesday, 21 February 2018
 2018 Half-year Results Briefing Presentation Wednesday, 21 February 2018 Presentation outline Item Presenter Page Group Performance Overview Rob Scott 3 Group Balance Sheet & Cash Flow Anthony Gianotti
In accordance with ASX Listing Rule 4.3A, the following documents are attached for release to the market:
 14 August 2018 The Manager Company Announcements Office Australian Securities Exchange Dear Sir/Madam, 2018 FULL-YEAR RESULTS In accordance with ASX Listing Rule 4.3A, the following documents are attached
Principal Brands UK and Northern Ireland
 Profile UK and Ireland based Building Materials Group Principal activities Builders and Plumbers Merchanting DIY Retailing in Ireland Dry Mortar Manufacturing Annualised turnover over 2.8 billion Market
Wesfarmers Reconciliation Action Plan For more information visit
 Wesfarmers Reconciliation Action Plan 2014 For more information visit www.wesfarmers.com.au/rap Message from the Managing Director I am pleased to present Wesfarmers 2014 Reconciliation Action Plan (RAP).
For personal use only
 PROPOSED MERGER OF AFTERPAY AND TOUCHCORP 30 MARCH 2017 INTRODUCTION MERGER IMPLEMENTATION AGREEMENT SIGNED BETWEEN AFTERPAY AND TOUCHCORP ON 30 MARCH 2017 RATIONALE ACCELERATE GROWTH PROFILE OF AFTERPAY
DrKW Capital Goods Conference
 DrKW Capital Goods Conference 17 March 2004, United Kingdom Halma p.l.c. Stephen O Shea, Group Chief Executive After introducing himself and welcoming his audience of analysts and fund managers, Stephen
Arun Nayar Senior Vice President, Finance and Treasurer
 Arun Nayar Senior Vice President, Finance and Treasurer November 18, 2010 Forward-Looking Statements / Safe Harbor Certain statements in this presentation are forward-looking statements within the meaning
2019 Half-Year Results Briefing Presentation. To be held on Thursday, 21 February 2019
 2019 Half-Year Results Briefing Presentation To be held on Thursday, 21 February 2019 Presentation outline Item Presenter Page Group Performance Overview Rob Scott 3 Group Balance Sheet & Cash Flow Anthony
Securities Dealing Policy
 Securities Dealing Policy INTRODUCTION PURPOSE AND OBJECTIVES As a public company, CSL is bound by laws governing the conduct for buying, selling and otherwise dealing in securities. This document sets
half yearly report to shareholders
 half yearly report to shareholders six months to 31 December 2000 WESFARMERS LIMITED ABN 28 008 984 049 interim highlights report to shareholders The directors of Wesfarmers Limited have pleasure in presenting
Update - Home Improvement
 12 August 2014 Update - Home Improvement Woolworths Limited (Woolworths) today provided an update to the market on its Home Improvement business. Key points Update on financial results with losses in FY14
ScS Group Plc Interim Results For The 26 Weeks Ended 24 January 2015 March 2015
 ScS Group Plc Interim Results For The 26 Weeks Ended 24 January 2015 March 2015 October 2014 H1 2015 Highlights Financial Highlights: Like for like sales order intake up 7.8% Flooring up 13.0% Total sales
2013 Half Year Results Teleconference. 14 February 2013
 2013 Half Year Results Teleconference 14 February 2013 Presentation outline 2 Item Presenter Page 1 Group Performance Highlights Richard Goyder 3 2 Coles Ian McLeod 11 3 Home Improvement & Office Supplies
INVESTOR PRESENTATION
 TOUCHCORP LIMITED ASX:TCH WWW.TOUCHCORP.COM INVESTOR PRESENTATION $25.6M CAPITAL RAISING SEPTEMBER 2016 TOUCHCORP LIMITED 1 TOUCH SERVICE OFFERING TOUCHCORP NOW OFFERS ITS CUSTOMERS A COMPLETE OMNI-CHANNEL
Class Ruling Income tax: Wesfarmers Limited demerger of Coles Group Limited. Summary what this Ruling is about
 Page status: legally binding Page 1 of 20 Income tax: Wesfarmers Limited demerger of Coles Group Limited Contents LEGALLY BINDING SECTION: Para Summary what this Ruling is about 1 Date of effect 8 Scheme
Matas FY/Q4 2016/17 Results
 Matas FY/Q4 2016/17 Results Forward Looking Statements This presentation contains statements relating to the future, including statements regarding Matas A/S future operating results, financial position,
For personal use only
 202 Full-Year Results Supplementary Information (To be read in conjunction with the Full-Year Results Teleconference presentation) 6 August 202 Presentation outline 2 Item Page Coles 3 2 Home Improvement
SGREIT reports DPU of 1.17 cents for 2Q FY17/18
 Media release by: YTL Starhill Global REIT Management Limited (YTL Starhill Global) Manager of: Starhill Global Real Estate Investment Trust (SGREIT) SGREIT reports DPU of 1.17 cents for 2Q FY17/18 HIGHLIGHTS
FISHER & PAYKEL APPLIANCES HOLDINGS LIMITED
 FISHER & PAYKEL APPLIANCES HOLDINGS LIMITED 5 YEAR STRATEGIC PLAN PRESENTATION 10 September 2012 September 2012 INVESTOR PRESENTATION 1 IMPORTANT DISCLAIMER This presentation includes certain forward-looking
METRO GROUP continues operational improvement trend in 2014/15
 15 December 2015 1/11 METRO GROUP continues operational improvement trend in 2014/15 EBIT before special items totalling 1,511 million, influenced by the negative impact of exchange rate effects amounting
DataDot Technology Limited ABN Securities Exchange Announcement
 DataDot Technology Limited ABN 54 091 908 726 Securities Exchange Announcement 30 th January 2014 Market Update Growth Strategy Being Implemented Background As enunciated at the AGM in November, the company
For personal use only TOUCHCORP 1H2015 RESULTS PRESENTATION DATED: THURSDAY, 27TH AUGUST 2015
 TOUCHCORP 1H2015 RESULTS PRESENTATION DATED: THURSDAY, 27TH AUGUST 2015 DISCLAIMER The material in this presentation has been prepared by Touchcorp Limited ARBN 603 731 184 (Touchcorp) and is general background
Combination to Create a Leading Commercial Real Estate Credit REIT with Approximately $5.5 Billion in Assets and $3.4 Billion in Equity Value
 Colony NorthStar, NorthStar Real Estate Income Trust and NorthStar Real Estate Income II Announce Creation of Colony NorthStar Credit Real Estate, Inc. Combination to Create a Leading Commercial Real Estate
For personal use only
 DRAFT 6 Not For Release PREMIER INVESTMENTS LTD PREMIER INVESTMENTS LTD Half Year 2015 results overview Half Year 2015 results overview 23 March 2015 xx March 2015 Agenda 1 Premier Investments 1H15 overview
COMPLETION OF ACQUISITIONS OF STARHILL GALLERY AND LOT 10 AND USE OF PROCEEDS OF UNDERWRITTEN RENOUNCEABLE RIGHTS ISSUE
 SGX-ST Announcement COMPLETION OF ACQUISITIONS OF STARHILL GALLERY AND LOT 10 AND USE OF PROCEEDS OF UNDERWRITTEN RENOUNCEABLE RIGHTS ISSUE Unless otherwise defined, capitalised terms used herein shall
SEB Seminar. CFO Jukka Erlund Copenhagen
 SEB Seminar CFO 8.1.2015 Copenhagen Kesko today Kesko s net sales 9.2bn - K-Group s sales 11.4bn Net sales Q4/13-Q3/14 9,166m 2,000 stores in eight countries Over 1.3 million customer visits every day
WESFARMERS REINSTATES DIVIDEND INVESTMENT PLAN
 9 January 2007 WESFARMERS REINSTATES DIVIDEND INVESTMENT PLAN The Wesfarmers Limited Dividend Investment Plan ("the Plan"), under which shareholders are able to invest all or a portion of their dividend
STARHILL GLOBAL REIT REPORTS 11.4% INCREASE IN 2Q 2010 GROSS REVENUE
 Media release by: YTL Starhill Global REIT Management Limited (YTL Starhill Global) Manager of: Starhill Global Real Estate Investment Trust (Starhill Global REIT) STARHILL GLOBAL REIT REPORTS 11.4% INCREASE
JOINT VENTURE WITH HANIEL Delivering Shareholder Value. 16 December 2016
 JOINT VENTURE WITH HANIEL Delivering Shareholder Value Andy Ransom Chief Executive Jeremy Townsend Chief Financial Officer 16 December 2016 Executive Summary Today we have announced an agreement with Haniel
Fantastic Holdings and Steinhoff Asia Pacific enter into Scheme Implementation Deed
 62 Hume Hwy, Chullora NSW 2190 ASX ANNOUNCEMENT PO Box 445 Chester Hill, NSW 2162 Tel: (02) 8717 2600 Fax: (02) 8717 2660 www.fantasticholdings.com.au ABN: 19 004 000 775 Fantastic Holdings and Steinhoff
P R E S S R E L E A S E
 P R E S S R E L E A S E from ASSA ABLOY AB (publ) Stockholm 8 November, 1999 no. 16/99 INTERIM REPORT JANUARY-SEPTEMBER 1999 Sales increased by 19% to SEK 7,532 M (6,317) Income before taxes increased
SGREIT reports DPU of 1.09 cents for 3Q FY17/18
 Media release by: YTL Starhill Global REIT Management Limited (YTL Starhill Global) Manager of: Starhill Global Real Estate Investment Trust (SGREIT) SGREIT reports DPU of 1.09 cents for 3Q FY17/18 HIGHLIGHTS
Preliminary Results 2006/07 20 June 2007
 Preliminary Results 2006/07 20 June 2007 John Clare Group Chief Executive Group performance Year of significant change Underlying sales Underlying Like for Like sales Underlying PBT Gross margins down
Annual Results Presentation. Year Ended 30 June 2002
 Annual Results Presentation Year Ended 30 June 2002 Presentation Outline Opening Comments - Michael Chaney 2002 Performance - Richard Goyder Divisional Comments - David Robb - Mark Allison - Bob Denby
CREATING TWO INDEPENDENT INTERNATIONAL LEADERS. 30 March 2016
 CREATING TWO INDEPENDENT INTERNATIONAL LEADERS 30 March 2016 To the extent that statements in this presentation do not relate to historical or current facts, they constitute forwardlooking statements.
CHAIRMAN S ADDRESS AND MANAGING DIRECTOR S ADDRESS TO ANNUAL GENERAL MEETING WEDNESDAY, 9 NOVEMBER 2011, 1:00 pm PERTH TIME
 CHAIRMAN S ADDRESS AND MANAGING DIRECTOR S ADDRESS TO ANNUAL GENERAL MEETING WEDNESDAY, 9 NOVEMBER 2011, 1:00 pm PERTH TIME CHAIRMAN S ADDRESS Good afternoon ladies and gentlemen. My name is Bob Every,
INVESTOR NEWS /16
 Düsseldorf, 14.12.2016 1/8 INVESTOR NEWS 1-2015/16 METRO GROUP meets sales and earnings targets in financial year 2015/16 EBIT from continuing operations before special items reaches 1,560 million (2014/15:
2017 Annual General Meeting 27 October 2017
 ASX: GAP 2017 Annual General Meeting 27 October 2017 Chairman s address: David Allman Chairman s address: David Allman Revenue $A million NPAT $A million 200 150 100 50 0 137.3 76.4 60.9 148.0 80.6 67.4
Wesfarmers. Annual Report Creating value
 Wesfarmers Annual Report 2010 Creating value Wesfarmers Limited ABN 28 008 984 049 The 200,000 people in our teams across our major business groupings of retail, industrial and insurance, reach millions
ACCEPT HAIER NEW ZEALAND INVESTMENT HOLDING COMPANY LIMITED S $1.20 CASH OFFER FOR ALL YOUR SHARES IN FISHER & PAYKEL APPLIANCES HOLDINGS LIMITED.
 ACCEPT HAIER NEW ZEALAND INVESTMENT HOLDING COMPANY LIMITED S $1.20 CASH OFFER FOR ALL YOUR SHARES IN FISHER & PAYKEL APPLIANCES HOLDINGS LIMITED. CERTAIN CASH IN AN UNCERTAIN MARKET REALISE THE VALUE
LOWE S SECURITY ANALYSIS TERRY ASANTE
 LOWE S SECURITY ANALYSIS TERRY ASANTE THE OUTLINE 1. Theme 2. Business Analysis 3. Financial Analysis 4. Stock Valuation 5. The moat 6. Risk 7. Bulls vs.. Bears 8. Investing Strategies THE THEME Lowe s
B&M European Value Retail SA Interim Results Presentation 26 weeks to 23 rd September 2017
 B&M European Value Retail SA Interim Results Presentation 26 weeks to 23 rd September 2017 Interim FY18 Group Highlights Group revenues increased by 21.7% to 1,346.4m B&M LFL revenues +7.5%, Q2 LFL +7.7%
Trading statement for the fourth quarter and full year ended 2 February 2002 KINGFISHER REPORTS SALES GROWTH OF 9.9%, BOOSTED BY 17.
 Thursday 14 February 2002 Trading statement for the fourth quarter and full year ended 2 February 2002 KINGFISHER REPORTS SALES GROWTH OF 9.9%, BOOSTED BY 17.0% GROWTH AT B&Q Kingfisher plc, the leading
Interim Report HORNBACH-BAUMARKT-AG GROUP
 Interim Report HORNBACH-BAUMARKT-AG GROUP 1st QUARTER 2006/2007 (MARCH 1 MAY 31, 2006) HORNBACH-Baumarkt-AG Group Interim Report (IFRS): First Quarter of 2006/2007 (March 1 May 31, 2006) 2 Pleasing business
Kingfisher plc Sarah Levy. Director of Investor Relations
 Kingfisher plc Sarah Levy Director of Investor Relations Agenda Kingfisher at a Glance Strategic History Our Markets and Brands Creating the Leader Strategy Q1 2014/15 Summary Priorities for 2014/15 Appendix
Q1 Report 2014/ September Klas Balkow CEO
 Report 2014/15 10 September 2014 Klas Balkow CEO Agenda 2014/15 Events after period-end Strategic priorities Q&A Store opening in Levanger, Norway, in June 2014 2 High energy and strong position 186 stores
Lowe's Companies Inc (LOW) - Financial and Strategic SWOT Analysis Review
 - Financial and Strategic SWOT Analysis Review") Lowe's Companies Inc (LOW) - Financial and Strategic SWOT Analysis Review Lowe's Companies Inc (LOW) - Financial and Strategic SWOT Analysis Review The Business Research Store is run by Sector Publishing
Lowe's Companies Inc (LOW) - Financial and Strategic SWOT Analysis Review Lowe's Companies Inc (LOW) - Financial and Strategic SWOT Analysis Review The Business Research Store is run by Sector Publishing
(English Translation) January 28, For immediate release:
 January 28, For immediate release:") For immediate release: (English Translation) January 28, 2019 IHI Corporation Representative: Tsugio Mitsuoka President and Chief Executive Officer Securities code: 7013 Contact: Takayoshi Shirai Public
For immediate release: (English Translation) January 28, 2019 IHI Corporation Representative: Tsugio Mitsuoka President and Chief Executive Officer Securities code: 7013 Contact: Takayoshi Shirai Public
2011 Fourth Quarter Results
 2011 Fourth Quarter Results February, 2012 INVESTOR RELATIONS Disclaimer The financial information in this document are consolidated earnings results based on K-IFRS. The previous earnings results have
HONEYWELL ANNOUNCES PLANNED PORTFOLIO CHANGES
 Contacts: Media Investor Relations Scott Sayres Mark Macaluso (480) 257-5921 (973) 455-2222 scott.sayres@honeywell.com mark.macaluso@honeywell.com HONEYWELL ANNOUNCES PLANNED PORTFOLIO CHANGES Plans to
Our primary objective is to provide a satisfactory return to shareholders
 Annual Report 2009 Our primary objective is to provide a satisfactory return to shareholders We aim to achieve this by: satisfying the needs of customers through the provision of goods and services on
Preliminary results 2003/04. Slides will be available at
 Preliminary results 2003/04 Slides will be available at www.kingfisher.com Sir Francis Mackay Chairman 2003 a landmark year Kesa Electricals demerger completed Non-core disposals completed Home Improvement
INVESTOR NEWS /17
 1/5 INVESTOR NEWS 2-2016/17 Profitability and solid growth as benchmarks METRO GROUP: The launch of two strong companies New company names published: It is intended that, in the future, the METRO GROUP
CHAIRMAN S ADDRESS AND MANAGING DIRECTOR S ADDRESS TO ANNUAL GENERAL MEETING THURSDAY, 10 NOVEMBER 2016, 1:00PM PERTH TIME
 CHAIRMAN S ADDRESS AND MANAGING DIRECTOR S ADDRESS TO ANNUAL GENERAL MEETING THURSDAY, 10 NOVEMBER 2016, 1:00PM PERTH TIME CHAIRMAN S ADDRESS Good afternoon ladies and gentlemen. On behalf of the Wesfarmers
INNOVATE RECONCILIATION ACTION PLAN
 2017 2019 INNOVATE RECONCILIATION ACTION PLAN COVER ARTWORK Veronica Hudson PITJANTJARA Veronica grew up in Central Australia and was interested in art from an early age. She grew up watching and listening
Attention ASX Company Announcements Platform. Lodgement of Open Briefing.
 Attention ASX Company Announcements Platform. Lodgement of Open Briefing. Wesfarmers Limited Wesfarmers House 40 The Esplanade Perth Western Australia 6000 Date of Lodgement: 16-May-2003 Title: Open Briefing.
HORNBACH Baumarkt AG Group Q3/9M 2017/2018
 HORNBACH Baumarkt AG Group Q3/9M 2017/2018 Quarterly Statement as of November 30, 2017 2 HORNBACH BAUMARKT AG GROUP QUARTERLY STATEMENT: 3 RD QUARTER AND 1 ST NINE MONTHS OF 2017/2018 HORNBACH BAUMARKT
Camaïeu current. Gondola realised. Maxeda partially realised. Consumer. Sector insights. Our Consumer portfolio in 2014
 Sector insights We invest in consumer-related businesses spanning from the international fast-moving consumer goods market, the mainly regional leisure segment, through to the largely domestic business
FULL YEAR RESULTS 2016/17
 PICTURE BOX Resize your image to this grey area only See example slide for reference FULL YEAR RESULTS 2016/17 24 May 2017 AGENDA Introduction Review of 2016/17 Progress update Guidance Q&A BUILDING A
WESFARMERS STRETCH RECONCILIATION ACTION PLAN NOVEMBER NOVEMBER 2020
 WESFARMERS STRETCH RECONCILIATION ACTION PLAN NOVEMBER 2017 - NOVEMBER 2020 FRONT COVER ELIZABETH NYUMI Born c1947 near Jupiter Well, Western Australia works Kururrungku, close to Balgo, Western Australia
News Release. ADC Media Relations: Mike Smith Office
 News Release FOR IMMEDIATE RELEASE Contacts: Tyco Electronics Media Relations: Joan Wainwright 610-893-9500 Office 609-903-5329 Mobile joan.wainwright@tycoelectronics.com ADC Media Relations: Mike Smith
Second Quarter Interim Report
 2 Second Quarter Interim Report For the Six Months Ended June 30, 1997 W E L L S E R V I C E L T D. Financial Summary ($millions, except per share amounts) Six months ended June 30, Three months ended
EMBARGOED UNTIL 0700 HOURS - Thursday 2 June 2011
 EMBARGOED UNTIL 0700 HOURS - Thursday 2 June 2011 Kingfisher today reports total sales up 3.3% (+3.3% LFL) and retail profit up 19.1% for the first quarter Group Financial Summary (13 weeks ended 30 April
METRO GROUP achieves sales target and confirms EBIT guidance
 19 October 2015 1/5 METRO GROUP achieves sales target and confirms EBIT guidance Like-for-like sales growth of 1.5% in financial year 2014/15 Growth drivers online retail and delivery remain successful
A fresh new offer in home improvement Tuesday 25 August
 A fresh new offer in home improvement Tuesday 25 August We are entering the $24 billion hardware sector The Australian hardware and home improvement sector is worth $24 billion 1 plus Woolworths believes
Adding Value to Our Customers Products and Services ANNUAL REPORT 06 FTK
 Adding Value to Our Customers Products and Services 20 ANNUAL REPORT 06 FTK FLOTEK INDUSTRIES IN SUMMARY Flotek Industries, Inc is a diversified global supplier of drilling and production related products
The following presentation is to be given at a Kmart Investor Site Tour on 4 December 2012.
 4 December 2012 The Manager Company Announcements Office Australian Securities Exchange Dear Sir, Kmart Investor Site Tour The following presentation is to be given at a Kmart Investor Site Tour on 4 December
For personal use only
 13 March 2017 The Manager Company Announcements Office Australia Securities Exchange Dear Sir, BUNNINGS UK & IRELAND INVESTOR TOUR PRESENTATION Following is a presentation to be given at an investor briefing
Bathroom Newsletter August 2011
 Bathroom Newsletter August 2011 International Market Strategy Topics BRG News Sweden Germany BAUHAUS Starts Online Business HORNBACH First Quarter Results Germany BAYWA Denies Rumours On Possible Acquisition
The ADT Corporation Form 10
 The ADT Corporation Form 10 April 10, 2012 Forward-Looking Statements / Safe Harbor This presentation contains a number of forward-looking statements. Words, and variations of words, such as expect, intend,
LANDSCAPE INSTITUTE CORPORATE STRATEGY ISSUED 3RD APRIL Landscape Institute 107 Grays Inn Road London WC1X 8TZ United Kingdom
 LANDSCAPE INSTITUTE CORPORATE STRATEGY ISSUED 3RD APRIL 2018 Landscape Institute 107 Grays Inn Road London WC1X 8TZ United Kingdom MISSION The Landscape Institute (LI) aims to lead and inspire the landscape
Almacenes Éxito S.A. Consolidated Financial Results For the three-month period ended March 31. First Quarter 2013 Financial Highlights
 Almacenes Éxito S.A. Consolidated Financial Results For the three-month period ended March 31 2013 New Éxito Soledad in Atlántico First Quarter 2013 Financial Highlights Note: Consolidated figures include
MERRILL LYNCH 2011 AUSTRALIAN REIT CONFERENCE PRESENTATION MATERIALS
 7 November 20 MERRILL LYNCH 20 AUSTRALIAN REIT CONFERENCE PRESENTATION MATERIALS Attached are the investor presentation materials to be presented by BWP Management Limited, the responsible entity for BWP
Annual General Meeting 2017 Review by the President and CEO. Mikko Helander
 Annual General Meeting 2017 Review by the President and CEO Mikko Helander Group Management Board Mikko Helander Jukka Erlund Johan Friman Terho Kalliokoski Anne Leppälä-Nilsson Matti Mettälä Lauri Peltola