FINAL REPORT STUDY ON BENEFITS OF REMOVAL OF WATER HARDNESS (CALCIUM AND MAGNESIUM IONS) FROM A WATER SUPPLY
|
|
|
- Geraldine Terry
- 5 years ago
- Views:
Transcription
1 FINAL REPORT STUDY ON BENEFITS OF REMOVAL OF WATER HARDNESS (CALCIUM AND MAGNESIUM IONS) FROM A WATER SUPPLY By D. D. Paul, V.V. Gadkari, D.P. Evers, M.E. Goshe, and D.A. Thornton Battelle Memorial Institute 505 King Avenue Columbus, OH Prepared for Water Quality Association 4151 Naperville Road Lisle, Illinois Agreement No.OP53257R1
2 Battelle does not engage in research for advertising, sales promotion, or endorsement of our clients' interests including raising investment capital or recommending investments decisions, or other publicity purposes, or for any use in litigation. Battelle endeavors at all times to produce work of the highest quality, consistent with our contract commitments. However, because of the research and/or experimental nature of this work the client undertakes the sole responsibility for the consequence of any use or misuse of, or inability to use, any information, apparatus, process or result obtained from Battelle, and Battelle, its employees, officers, or Trustees have no legal liability for the accuracy, adequacy, or efficacy thereof.
3 Table of Contents Acronyms...v Executive Summary... ii Fixtures and Appliances... iv 1.0 Introduction Goals and Objectives Technical Approach Water Heaters Fixtures and Appliances Differential Carbon Footprint Test Protocol Water Heaters Fixtures and Appliances Differential Carbon Footprint Assessment Lab Setup Water Heaters Appliances Results Water Heaters Instantaneous Gas Water Heaters Instantaneous Gas Water Heaters on Soft Water Instantaneous Gas Water Heaters on Unsoftened Water Gas Storage Water Heaters Gas Storage Water Heaters on Soft Water Gas Storage Water Heaters on Unsoftened Water Electric Storage Water Heaters Electric Storage Water Heaters on Soft Water Electric Storage Water Heaters on Unsoftened Water Fixtures and Appliance Test Results Low Flow Showerheads Low Flow Faucets Dishwashers and Clothes Washers Tested Using Unsoftened and Softened Water Summary of Findings on Fixtures and Appliances Final Report i
4 5.8 Differential Carbon Footprint Conclusions Instantaneous Gas Water Heaters Gas Storage Water Heaters Electric Water Heaters Fixtures and Appliances References Appendix A Appliance Consumption Test Data Appendix B Carbon Footprint Calculations Appendix C Efficiency Data For Instantaneous Gas Water Heaters Using Softened Water Appendix D Efficiency Data For Instantaneous Gas Water Heaters Using Unsoftened Water Appendix E Efficiency Data For Gas Storage Water Heaters Using Softened Water Appendix F Efficiency Data For Gas Storage Water Heaters Using Unsoftened Water 105 Appendix G Efficiency Data For Electric Storage Water Heaters Using Softened Water Appendix H Efficiency Data For Electric Storage Water Heaters Using Unsoftened Water Appendix I Photos of Heat Exchangers of Instantaneous Water Heaters After 90 Days Using Softened Water Appendix K Photos of Gas Storage Water Heaters After 90 Days Using Softened Water Appendix L Photos of Gas Storage Water Heaters After 90 Days Using Unsoftened Water Appendix M Photos of Electric Storage Water Heaters After 90 Days Using Softened Water. 168 Appendix N Photos of Electric Storage Water Heaters After 90 Days Using Unsoftened Water Appendix O Culligan Analysis of Softened Well Water Appendix P Culligan Analysis of Unsoftened Well Water Appendix Q Culligan Analysis of Hard Water Scale Taken From Piping at Outlet of Instantaneous Water Heater Operating With Water of 26.2 Grains Per Gallon Hardness Appendix R Pictures of Low Flow Showerheads Using Unsoftened Well Water and Softened Well Water Final Report ii
5 List of Tables Table ES-1. Summary of Results for Water Heaters... iii Table ES-2. Estimated Savings for Gas-fired Water Heaters using Softened Water Over 15 years Life...v Table 3-1. Summary of Acceleration Factor Calculations...3 Table 4-1. Summary of Water Heater Operating Conditions...5 Table 4-2. Summary of Appliance Operating Conditions...6 Table 4-3. Carbon Footprint Calculation Data...8 Table 5-1. Predicted efficiencies of instantaneous water heaters as a function of water hardness and hot water usage Table 5-2. costs as a function of water hardness for instantaneous water heaters Table 5-3. Predicted efficiencies of gas storage water heaters as a function of water hardness level and daily household hot water usage Table 5-4. costs for operating a gas storage water heater as a function of water hardness Table 5-5. Hard water scale collected from the gas storage water heaters on unsoftened or softened water Table 5-6. costs for operating an electric storage water heater as a function of water hardness Table 5-7. Hard water scale collected from each of the electric storage water heaters using either unsoftened or softened water Table 5-8. Example Carbon Footprint Calculations Table 5-9. Summary of Carbon Footprint Results List of Figures Figure 4-1. System Boundary for Water Heating Carbon Footprint...7 Figure 4-2. System Boundary for Appliance Carbon Footprint...7 Figure 4-3. Electric Water Heaters...9 Figure 4-4. Gas Water Heaters...9 Figure 4-5. Appliance Testing...9 Figure 5-1. Efficiency of the instantaneous gas water heaters on soft water over time Figure percent confidence intervals for the efficiency measurements of the instantaneous gas water heaters on soft water Figure 5-3. Efficiencies of the instantaneous gas water heaters using unsoftened water Figure 5-4. Loose scale inside the elbow from the instantaneous water heater on unsoftened water Figure 5-5. Clogging of the strainers from the disassembled pressure regulators of the instantaneous water heaters on unsoftened water Figure percent confidence intervals for the efficiency measurements of the instantaneous gas water heaters on unsoftened water Figure 5-7. Linear regression of the efficiency data for the instantaneous water heaters on unsoftened water Figure 5-8. Efficiency of the gas storage water heaters on soft water Final Report iii
6 Figure percent confidence intervals for the efficiency measurements of the gas storage water heaters on soft water Figure Efficiencies of the gas storage water heaters using unsoftened water Figure percent confidence intervals for the efficiency measurements of the gas storage water heaters using unsoftened water Figure Predicted efficiency of a gas storage water heaters operating on soft water (0 grains per gallon) versus one operating on unsoftened water with a hardness of 30 grains per gallon Figure Efficiency of the electric storage water heaters using soft water Figure percent confidence intervals for the efficiency measurements of the electric storage water heaters on soft water Figure Efficiencies of the electric storage water heaters using unsoftened water Figure percent confidence intervals for the efficiency measurements of the electric storage water heaters on unsoftened water Figure Typical spray pattern from one of the showerheads using soft water at the end of the test Figure Typical spray pattern from one of the showerheads using unsoftened water at the end of the test Figure Photo showing the Set 1 faucet strainers at the end of the test Figure Photo showing the Set 2 faucet strainers at the end of the test Figure Photo showing the Set 3 faucet strainers at the end of the test Figure Photo showing the Set 4 faucet strainers at the end of the test Figure Photo showing the Set 5 faucet strainers at the end of the test Figure Photos showing condition of dishwasher at the end of 30 days using soft water Figure Photos showing condition of dishwasher at the end of 30 days using unsoftened water Figure Drum of the laundry washer using softened water was almost completely free from water scale buildup Figure Drum of the laundry washer using unsoftened water had significant water scale buildup on all of the interior surfaces Figure Laundry washer spray nozzles after 30 days of testing Figure Summary of Laundry Washers Daily Average Per Cycle Consumption Figure Summary of Dishwashers Daily Average Per Cycle Consumption Figure Example Dishwasher Operating Curves Final Report iv
7 Acronyms Btu British Thermal Units cf cubic foot Eq equation F Fahrenheit g grams gal gallon gm/yr grams per year gpm gallons per minute gpg grains per gallon lb/yr pounds per year kg kilogram kwh kilowatt-hours MJ Megajoule ppm parts per million scf standard cubic foot SMCL Secondary Maximum Contaminant Level WQA Water Quality Association y or yr year or years Final Report v
8 This page intentionally left blank. Final Report i
9 Executive Summary T his study tested devices fed with softened and unsoftened water under controlled laboratory conditions designed to accelerate the water side scaling in the device and quantify the performance efficiency. The project specifically focused on efficiency improvements in household water heaters from use of softened water, and the subsequent effect on performance of fixtures, such as low flow showerheads and faucets, and appliances, such as laundry washers and dishwashers. For this study, Battelle tested 30 water heaters supplied by WQA over a 90-day period using a Battelle-developed and WQA approved test protocol. Battelle simultaneously studied the effect of water hardness on performance of faucets, low-flow showerheads, dishwashers, and laundry washers. Using the empirical data generated from the water heater testing and the effect on performance of fixtures and appliances, Battelle developed a differential carbon footprint assessment for homes using unsoftened water vs. softened water. Water Heater Results Battelle set up and tested ten storage type gas water heaters, ten storage type electric water heaters, and ten instantaneous gas water heaters with the following specifications using an accelerated scaling methodology developed at Battelle. Gas Water Heaters (10), 40 gal, 38,000 Btu/h burners Electric Water Heaters (10), 40 gal, 4500 W heating elements Tankless Gas Water Heaters (10), 199,000 Btu/h burners Five of each type of device were tested without any preconditioning of the water supply, and the other five were tested using a water softener to remove hardness constituents from the water supply. Five units were chosen for each of the groupings in order to be able to calculate 95 percent confidence intervals for the results. At the start of the test and at approximately one week intervals, the thermal efficiency of each water heater was measured to determine the change in efficiency as water side scale built up in each water heater. Each water heater was instrumented to measure the inlet and outlet water temperature at 15-second intervals, the amount of hot water generated, and the amount of energy (gas or electric) used to produce the hot water. These data were used to calculate the average thermal efficiency of the water heater. In summary, the electric and gas storage water heaters and the instantaneous gas water heaters on soft water performed well throughout the entire testing period. Although the pressure regulators and needle valves were tweaked throughout the testing to maintain constant testing conditions, all of the water heaters on soft water required minimal attention because the conditions were very stable. This is reflected in the efficiency data for these units that show the efficiency remained essentially constant over the duration of the testing with the variations being within the experimental error of the instrumentation and testing protocol. Overall, the softened water did a good job of minimizing scale buildup in the water heaters. Final Report ii
10 In contrast, none of the electric or gas storage water heaters or the instantaneous gas water heaters on unsoftened water made it through the entire testing period because the outlet piping system consisting of one-half inch copper pipe, a needle valve, and a solenoid valve became clogged with scale buildup. Although the pressure regulators and needle valves were tweaked throughout the testing to try to maintain constant testing conditions, all of the water heaters on unsoftened water were removed from the testing at some point due to the inability to maintain sufficient flow. Water Heater Type Instantaneous Gas Water Supply Table ES-1. Summary of Results for Water Heaters Average Thermal Efficiency, (%) Equivalent Field Service (Years) Average Annual Scale Accumulation 1 (grams/year) Carbon Footprint 2 (kg CO 2/ gal hot water) Test Start Test End Unsoftened NA Softened NA Unsoftened Gas Storage Softened Not Unsoftened Electric Determined Storage Not Softened Determined Notes: 1 The submerged heating element in an electric water heater operates at very high temperatures which results in a high rate of scale buildup in electric water heater when compared to a gas water heater. 2 Average over 15 years Equivalent Life. 3 Deliming or Cleaning was performed at this point. A summary of the results, discussed in the following paragraphs, is provided in Table ES-1. The instantaneous water heaters on unsoftened water had to be delimed at 1.6 years of equivalent field service, and the average efficiency of these units dropped from 80 percent at the start of the test to 72 percent when they were delimed. After deliming, the average efficiency of these units increased to about 77 percent, but was still below the 80 percent starting efficiency. The cost implications of these findings are addressed in this report. The average efficiency of the gas storage water heaters on unsoftened water dropped from 70.4 percent at the start of the test to 67.4 percent at two years equivalent field service. These data were used to derive equations to predict the efficiency of gas storage water heaters as a function of water hardness and daily household hot water usage. The average rate of scale buildup in the gas storage water heaters on unsoftened water was about 528 gm/yr (1.16 lb/yr). The average rate of scale buildup in the gas storage water heaters on soft water was about 7 gm/yr (0.01 lb/yr), which is almost negligible. The electric storage water heaters on both softened and unsoftened water were able to maintain a constant efficiency throughout the entire test period because the heating elements were completely submerged in the water. However, the life of the heating element in unsoftened water is expected to be shortened due to scale buildup increasing the operating temperature of the element. The average rate of scale buildup in the electric storage water heaters on unsoftened Final Report iii
11 water was about 907 g/yr (2.00 lb/yr). The average rate of scale buildup in the electric storage water heaters on soft water was about 14 g/yr (0.03 lb/yr), which is almost negligible. Fixtures and Appliances Ten low flow showerheads were installed on the hot water supply coming from the instantaneous gas water heaters; five were tested on unsoftened water and five were tested using softened water. The low flow showerheads on unsoftened water were removed from testing as they clogged up to the point of not allowing adjustment to a 1.25 gpm flow rate at any time during the test. All of the low flow showerheads on softened water made it through the testing without any problems. However, the low flow showerheads on unsoftened water clogged after an average of 3,203 gallons of water flow through them. At the end of testing, the low flow showerheads were disassembled and the amount of scale buildup was documented with photographs of the components. Ten low flow faucets were also installed on the hot water supply coming from the instantaneous gas water heaters; five were tested on unsoftened water and five were tested using softened water. The low flow faucets on unsoftened water were also removed from testing as they clogged up to the point of not allowing adjustment to a 1.25 gpm flow rate at any time during the test. All of the low flow faucets on softened water made it through the testing without any problems. However, the low flow faucets on unsoftened water clogged after the equivalent of 19 days of water flow through the faucets assuming an average household uses about 50 gallons of hot water per day. The collection of scale on the faucets using unsoftened water appears to be the result of scale breaking loose from upstream portions of the plumbing and being trapped in the strainers. Six dishwashers (Kitchenaid ) and laundry washers (General Electric) were purchased to test the effect of unsoftened water on the performance of the appliances. The electronic controls for this equipment were integrated into the automated data acquisition and control system designed for the testing. The wash and dry cycles of the dishwashers and the wash cycles of the laundry washers were controlled automatically with the units going through eight cycles every 24 hours. The clothes washers were loaded with 7 lbs of restaurant hand towels. The dishwashers were loaded with eight place settings of dishes and flatware. At the end of the 30 days of testing, the dishwashers and clothes washers were examined before a teardown analysis was initiated. The units using softened water were almost completely free of any water scale buildup. In contrast, the units using unsoftened water (26 grains per gallon) had noticeable water scale buildup on all of the interior surfaces after only 30 days of testing. Although both of the dishwashers and clothes washers completed the same number of wash cycles (240), the appearance of the inside of the units using unsoftened water shows that it needs to be delimed and cleaned due to the buildup of scale and deposits. On the other hand, the units using soft water look like they could be cleaned up to look like new with just a quick wipe down. Carbon Footprint Battelle assessed that carbon footprint of the water heaters by evaluating the energy consumption within the Home and the resulting greenhouse gas emissions. The results parallel those for the Final Report iv
12 energy consumption, in that where there are energy efficiency differences there are also carbon footprint differences. For the storage type gas water heaters, there was a reduction in carbon footprint of 14.8% over a fifteen year water heater service life with softened water compared to 26 gpg hard water, when considering both the natural gas used for water heating and the electricity used for water softening. For the instantaneous water heaters, there was a reduction in carbon footprint of 4.4% over a fifteen year water heater service life, when considering both the natural gas used for water heating and the electricity used for water softening. Conclusions For gas storage and instantaneous water heaters, the use of a water softener to eliminate or minimize the scale forming compounds in water will result in the efficiency of the water heater remaining constant over the life of the unit. In contrast, gas storage and instantaneous water heaters using unsoftened water had a noticeable decrease in efficiency over the testing period resulting in higher natural gas use. This natural gas savings associated with the use of softened water will lead to direct energy and economic savings, as seen in the summary results in Table ES-2. In addition, because of the need to have the instantaneous water heater delimed or cleaned periodically, the economic savings can lead to recovery of the cost of a water softener and operating supplies in a period as short as a year, if the inlet water is sufficiently hard. Further, there are environmental benefits to the use of a water softener: the lower use of natural gas leads to reductions in the carbon footprint which are related to the decrease in total energy consumption. The increase in total energy consumption (as a result of a reduction in heat transfer efficiency) is related to the hardness: higher water hardness will lead to greater energy consumption without the use of water softener, and consequently greater energy costs. Table ES-2. Estimated Savings for Gas-fired Water Heaters using Softened Water Over 15 years Life Water Hardness, grains per gallon Cost Elements Instantaneous Gas Water Heaters Percent Life Cycle Cost Savings,% 1 NA Percent Total Life Cycle Cost Savings, % 1 NA Estimated Usage before Deliming Required, 2 NA years Gas Storage Water Heaters Life Cycle Operating Efficiency Reduction From Baseline, % Percent Life Cycle Cost Savings, % 4 NA Notes: 1 Derived from Table Derived from Table Derived from Table Derived from Table 5-4 Final Report v
13 Electric storage water heaters did not record any difference in the electricity consumption between units receiving softened or unsoftened water. However, the life of the heating element on the electric water heater receiving unsoftened water would be expected to have a shorter life. Low flow showerheads and faucets using unsoftened water clogged in less than seven days of accelerated life testing, whereas those units using softened water made it through the test without any problems. The dishwashers and clothes washers on either soft or unsoftened water made it through 30 days of accelerated scale testing, but the units on unsoftened water had noticeable scale buildup on all surfaces that had contact with unsoftened water. Final Report vi
14 This page intentionally left blank. Final Report vii
15 1.0 Introduction The Water Quality Association (WQA) is an international trade organization representing members of all facets of the water treatment industry. One of their focus areas is water softening and its beneficial effects on equipment, clothing, and public perception of water quality. However, as with many other industries, the members recognize that consumers are increasingly focused not just on the direct benefits associated with a product, softened water in this case, but are concerned with the effect of a product on the environment. To that end, the members decided they needed to quantify other benefits, in addition to cost benefits, of softened water such as: The effect on longevity of the appliances such as water heaters, laundry washers, dishwashers, beverage machines, shower heads, faucets, fixtures, and other household units from unsoftened water versus softened water. The WQA perceives that many of the differentiators between using softened and unsoftened water may have significant green or sustainable environmental benefits. The ability to substantiate these benefits or better to quantify these benefits, would help WQA communicate the benefits that consumers and society may reap from softened water. In addition, residential point-of-entry water purification systems, specifically water softeners, have come under increasing scrutiny and criticism from local environmental groups and wastewater agencies over the high levels of total dissolved solids and concentrated brine in the discharges. Given these developments, Water Quality Research Foundation, the research arm of WQA, feels that research should be conducted across the water softener life cycle to better understand the potential cost and energy benefits of softened water to a single family home or a household. WQA believes communicating these benefits to the general public would be helpful in addressing the scrutiny and criticism and potentially improve the product sustainability. 2.0 Goals and Objectives The study on benefits of removal of water hardness (Calcium and Magnesium ions) from a water supply tested household appliances fed with softened and unsoftened water under controlled laboratory conditions. Study test protocol included accelerated testing of appliances to get 95 percent confidence intervals around the results. 3.0 Technical Approach For the WQA, Battelle studied the beneficial effects of a water softener to a U.S. household. In addition to the traditional cost benefits of the softened water, this project will foster a better understanding of the effects of softeners on longevity and energy use of water-using appliances like water heaters, laundry washers, dishwashers, and the longevity of other household items, such as low flow shower heads, faucets, and clothing. Final Report 1
16 The project specifically focuses on efficiency improvements in household water heaters from use of softened water and the subsequent effect on longevity of fixtures, such as low flow showerheads and faucets, and appliances, such as laundry washers and dishwashers. For this study, Battelle tested 30 water heaters supplied by WQA over a 90-day period using a Battelledeveloped and WQA approved test protocol that mimics typical U.S. household use of these appliances. Battelle simultaneously studied the effect on longevity of fixtures and appliances on sets of faucets, low-flow showerheads, dishwashers, and laundry washers over a 30-day period or until they failed whichever was earlier. The water heaters and all appliances for this study were provided directly by WQA or were purchased by Battelle upon WQA s approval. The WQA also provided service support for the water heaters during the 90-day test period. Culligan International provided two softeners (Model WS-210) for this study and provided weekly analytical support for water quality analysis. Using the empirical data generated from the water heater testing and the effect on longevity of fixtures and appliances, Battelle developed a differential carbon footprint assessment for homes using unsoftened water vs. softened water. Battelle also assessed the impact of unsoftened and softened water on the longevity of laundry washers, dishwashers and kitchen faucets. Laundry washers and dishwashers were operated on an accelerated schedule for 30 days, with three of each being tested with unsoftened water and an additional three of each with softened water. These were dismantled at the end of testing to assess the effect of unsoftened water on the expected appliance lifetime. 3.1 Water Heaters Under the test protocol, Battelle performed accelerated water-side scale tests on storage type water heaters, instantaneous water heaters, and low flow showerheads to determine the amount of scale buildup in the equipment due to unsoftened water conditions and the impact of this scale on the efficiency or performance of these devices. Battelle set up and tested ten storage type gas water heaters, ten storage type electric water heaters, ten instantaneous gas water heaters with the following specifications using an accelerated scaling methodology developed at Battelle. Gas Water Heaters (10), 40 gal, 38,000 Btu/h burners Electric Water Heaters (10), 40 gal, 4500 W heating elements Tankless Gas Water Heaters (10), ~199,000 Btu/h burners Five of each type of water heaters were tested without any preconditioning of the water supply, and the other five were tested using a water softener to remove hardness constituents from the water supply. Five units were chosen for each of the groupings in order to be able to calculate 95 percent confidence intervals for the results. The accelerated test protocol was based on the following assumptions. The amount of scale buildup in the water heaters is proportional to the amount of hot water put through the device. Final Report 2
17 The water heaters use a periodic water draw of approximately 1.25 gpm for 4 minutes, which is a total draw of 5 gallons of hot water through the device. To allow the water heaters to reheat sufficiently before the next draw, the time between water draws was 15 minutes for the gas storage type water heaters, 30 minutes for the electric storage type water heaters, and 12 minutes for the instantaneous gas water heaters. A control system was setup to automatically withdraw water from each tank at the set intervals for 24 hours a day. This yielded a total of 240, 480, and 600 gallons per day of hot water generated by the electric storage water heater, gas storage water heater, and gas instantaneous water heater, respectively. An average family in the U.S. uses about 50 gallons of hot water per day The acceleration factor for the water usage is 4.8, 9.6, and 12 for the electric storage water heater, gas storage water heater, and gas instantaneous water heater, respectively. The amount of scale buildup in the water heaters is directly proportional to the water hardness. With a water source with a hardness of approximately 26 grains per gallon, the scale buildup in the water heater to be approximately 2.6 times the amount than if Battelle were using a water source with 10 grains per gallon hardness. In this case, the acceleration factor for the water hardness is 2.6 (= 26/10). In addition, a rough rule of thumb is that for every 20 F increase in setpoint temperature of the unit, the amount of water scale buildup is doubled. Electric storage type water heaters are shipped from the factory with their thermostats preset at 120 F. Battelle operated the test units at a setpoint temperature of 140 F for instantaneous water heaters, 160 F for gas storage water heaters, and 150 F for electric storage water heaters. Compared to the same unit operating at 120 F, the instantaneous water heaters, gas storage water heaters, and electric storage water heaters are expected to generate 2, 4, and 2.8 times as much scale, respectively, due to the higher operating temperature. Using the above correlations, the overall acceleration factor for the cases described above is 35, 100, and 62 per day of testing for electric storage, gas storage, and gas instantaneous. Table 3-1 summarizes the individual factors and the composite. Each water heater was tested for 90 days at the above conditions. Table 3-1. Summary of Acceleration Factor Calculations Acceleration Factors Water Heater Water Temperature Type Volume Hardness Increase Electric Storage Final Report 3 Composite, Estimated Days Real Life to Actual Days Tested Gas Storage Gas Instantaneous At the start of the test and at approximately one week intervals, the thermal efficiency of each water heater was measured to determine the change in efficiency as water side scale builds up in
18 each water heater. Each water heater was instrumented to measure the inlet and outlet water temperature at 15 second intervals, the amount of hot water generated, and the amount of energy (gas or electric) used to produce the hot water. This data was used to calculate the average thermal efficiency of the water heater. At the end of the 90 days of testing, each water heater was carefully cut in half and the water side scale removed from the inside surfaces and weighed. A statistical analysis of the data was completed to determine the average performance improvements of the group of water heaters using softened water when compared to the baseline group of water heaters using unsoftened water. Ninety-five percent confidence intervals were calculated based on five water heaters being tested in each group. 3.2 Fixtures and Appliances Ten low flow showerheads were installed on the hot water supply coming from the ten instantaneous gas water heaters. Five low flow showerheads were tested on unsoftened water, and the other five on softened water. Upon completion of the low flow showerheads testing, ten faucets were installed on the hot water supply coming from the ten instantaneous gas water heaters in the same configuration to study the impact of use on unsoftened and softened water. The low flow showerheads or faucets were removed from testing as they clogged up to the point of not allowing adjustment to a 1.25 gpm flow rate at any time during the test. At the end of testing, the low flow showerheads were disassembled and the amount of scale buildup documented with photographs of the components. To study the effect of softened water on longevity of the dish washers and laundry washers, Battelle installed six dishwashers and laundry washers, three of each on the hot water supply from the water heaters using unsoftened water and three of each on the softened water. The wash and dry cycles of the dish washers and the wash cycles of the laundry washers are controlled automatically with the units going through eight cycles every 24 hours. As with the water heaters, Battelle assumed that the amount of scale buildup in the devices is proportional to the amount of hot water throughput. The acceleration factor applied to these tests was computed as follows: 1. The amount of scale buildup in the devices is proportional to the water hardness. Since Battelle used a source of water with a hardness of approximately 26 grains per gallon, the expected scale buildup in the appliances is approximately 2.6 times the amount than if a water source with 10 grains per gallon hardness had been used. 2. The estimated usage for each of these appliances is approximately one cycle per day, versus the eight cycles per day in the current testing. There are other factors that will affect the longevity of appliances that were outside the scope of the current testing. One major factor is changes in habits for cleaning of laundry or dishes that may result from using softened water. Since softened water, in conjunction with detergents or other cleaning products, may clean more effectively than unsoftened water, users might find it acceptable to decrease the cycle time and yet achieve an acceptable level of cleanliness. Final Report 4
19 Remember that consumers are buying cleanliness of clothes and dishes, not soft water directly. This decrease in cycle time will lower the water consumption, the potential scale formation in the appliance and the water heater, the energy consumption, and the carbon footprint. 3.3 Differential Carbon Footprint The energy to heat the water and the energy used by the appliances are the primary drivers to test carbon footprint of the test devices. The energy consumption during the 90-day water heater test and the 30-day appliances tests was monitored to understand both the change as a function of time, and the characteristic value for the energy consumption: long term average, final average, or multiple intermediate values. The energy consumption of the water softening equipment was provided by Culligan International based on data they had acquired during laboratory testing of residential water softeners under typical use conditions. Changes in the daily cumulative energy consumption of the appliances were correlated with observations on water consumption, water heater performance, and appliance operations to help in interpreting the data. 4.0 Test Protocol 4.1 Water Heaters Five of each type of water heater were tested with raw water and the other five were tested using softened water. Water analysis and thermal efficiency tests were performed every week. Five gallons of water were drawn from each of the 30 units periodically at the rate of 1.25 gallons per minute over a 4-minute draw period. The following table, Table 4-1, presents the water draw cycles during the test period and the corresponding acceleration factor for the equipment. The time interval between draws varies because the heat input rate is different for each water heater type, and sufficient time is needed for each type of water heater to heat the incoming water up to the thermostat setpoint temperature before the next water draw. Table 4-1. Summary of Water Heater Operating Conditions Water Heater Type Time Intervals Between Draws Total Flow per unit Acceleration Factor (Based on 50 gal/day use) Gas Storage 15 minutes 480 gal per day 9.6 Electric Storage 30 minutes 240 gal per day 4.8 Gas Instantaneous 12 minutes 600 gal per day 12.0 The test determined the scale build up and the impact on performance and efficiencies of the water heaters, low flow showerheads, and faucets. The test protocol used five units for each of the groupings in order to be able to calculate 95 percent confidence intervals for the results. Final Report 5
20 4.2 Fixtures and Appliances Six laundry washers and dishwashers were tested, three of each on unsoftened and three of each on softened water with their wash cycles automatically controlled at 3-hour intervals to get 8 cycles per unit per 24-hour period, see Table 4-2. Detergents were added automatically to each system at a rate specified by the manufacturer in the Users Manuals for either softened or unsoftened water. Table 4-2. Summary of Appliance Operating Conditions Test Parameters / Variable Dishwashers Appliances Laundry Washers Notes Cycle Time 3 hrs/cycle 3 hrs/cycle Dishwasher cycle includes extended drying option Water Temp 140 F 140 F Test Load 8 place settings of dishes and flatware 7 lbs of test cloth Similar to DOE test protocols for these appliances Monitoring Monitored Daily, Calculated Per Cycle Average Monitored Daily, Calculated Per Cycle Average Watts Up Pro meters monitoring cumulative kwh Make and Model Kitchenaid KUDL03IVWH General Electric WJRE5550H Purchased from Lowes 4.3 Differential Carbon Footprint Assessment To guide the data collection and analysis efforts Battelle developed the system boundaries for each test scenario and case (softened versus unsoftened water use) for this task. These diagrams show the primary energy consuming activities that occur within the home: natural gas and electricity consumption. They also illustrate which activities have been included in the analysis. Battelle also assumed for each scenario that there are no differences in user behavior between cases that influence energy consumption, and therefore carbon footprint. For example, softened water might clean more efficiently leading to a change in the amount of detergent used or reduction in stain removers used for laundry. These actions could lead to a lower carbon footprint, but are ignored in this modeling. System boundaries for the water heater and dishwasher test cases are shown below in Figures 4-1 and 4-2. Since the shower heads and faucets consume no energy themselves, their system boundary is indistinguishable from the water heater case. For this reason a system boundary diagram is not given for these cases. Similarly, the laundry washer system boundary can be derived from the dishwasher system boundary by a simple substitution of laundry washers for dishwashers in the following diagram; hence an explicit system boundary is not shown. Final Report 6
21 Water Heating Scenario Case Study A Electricity In Water In Water Softener Water Heater Case Study B Water In Water Heater Natural gas In Figure 4-1. System Boundary for Water Heating Carbon Footprint Dishwasher Scenario Case Study A Electricity In Water In Water Softener Water Heater Dishwasher Case Study B Water In Water Heater Dishwasher Natural gas In Figure 4-2. System Boundary for Appliance Carbon Footprint From these systems diagrams Battelle developed a data collection scheme and quantitative models for each comparative test case to estimate the potential carbon footprint differences between using softened and unsoftened water, as seen below in Table 4-3. Final Report 7
22 To capture the electricity consumption of the appliances, one or more Watts Up? PRO energy monitoring meters was added to each circuit feeding electricity to the appliances. Three laundry washers are capable of being monitored by one meter, but the dishwashers had to be split between two meters (two dishwashers on one meter and one dishwasher on a meter alone) because of current demand. Each weekday the cumulative energy consumption for each of the four sets of appliances: laundry washer with softened or unsoftened water, and dishwashers with softened or unsoftened water, was tabulated in a spreadsheet, along with the date and time of the observation. Knowing that a typical cycle was three hours, or eight cycles per 24 hours per appliance, the average per cycle energy consumption was calculated for each case (energy consumption between observations divided by number of cycles between observations). These values were plotted to look for trends, and notes on water heater and appliance operations added. The raw data is presented in Appendix A. The calculated results are presented in the next section, with the complete calculations presented in Appendix B. Table 4-3. Carbon Footprint Calculation Data Unit Carbon Footprint Units Sources Natural gas kg/scf US EPA AP-42, Section 1.4 Electricity kg/mj GaBi 4.3, US Power Grid Mix, TRACI GW Emissions 4.4 Lab Setup Battelle filtered the well water source through a two-stage cartridge filtration system to remove large particulates, and reduce the oil and grease concentrations. Each stage was a spiral wound filter. The first stage was 50 micron filter, followed by a 20 micron filter. The outlet pressure from the filters was monitored daily, and filters were changed when the pressure dropped to near or below 30 psi on the water heater inlet side Water Heaters The water heater test lab at Battelle was set up in three rooms, which are assigned by water heater type. The 10 storage type electric water heaters were set up in Room 1 and the 20 gas water heaters were assigned to Rooms 2 and 3, which are connected. The lab set up is pictured below in Figures 4-3 and 4-4. Final Report 8


23 Figure 4-3. Electric Water Heaters Figure 4-4. Gas Water Heaters Appliances The appliance testing was set up along the walls of the rooms, as seen in Figure 4-5, used for the water heater tests. Three laundry washers and three dish washers were installed on the hot softened water line and the second set of appliance in the same configuration is installed on the unsoftened water line. The plastic tanks contained detergents that were dispensed into the appliances in the correct amount using peristaltic pumps. The clothes washers used Tide detergent and the dishwashers used Cascade detergent. Figure 4-5. Appliance Testing Final Report 9
24 5.0 Results The well water Battelle used for this testing contains an elevated concentration of iron which imparted red staining to the scale, the appliances, and the fixtures as is evident throughout the test results presented in this section. The unsoftened well water contained 26.2 grains per gallon of water hardness and 0.99 parts per million (ppm) or milligrams per liter (mg/liter) of iron. The softened well water contained less than 0.55 grain per gallon of water hardness and 0.27 ppm of iron. Samples of the scale were dissolved in solution and a quantitative analysis performed of the solutions to determine the percentage of calcium carbonate, magnesium, iron, and other species in the scale deposits. (See the results presented in Appendix Q). The analyses show the concentrations of calcium, magnesium, iron, copper, and manganese to be 2079 ppm, 96 ppm, 164 ppm, 28 ppm, and 21 ppm, respectively. This shows that calcium carbonate is the most significant constituent of the scale. However; as is evident in the photographs presented further in this section, iron in the water has given the hard water deposits a red/brown tone. Iron causes unsightly red and/or brown staining in not only the scale but also on fixtures, faucets, porcelain, and clothing that contact the water. Iron is a rather common water problem in addition to and often accompanying hard water scaling. Iron is the fourth most abundant element on earth. It enters water naturally as it is dissolved from the earth s crust or as iron or steel pipes corrode. As iron reacts with oxygen it is converted from a water soluble and ionic ferrous iron into a precipitated red water ferric iron, which causes staining. Like water hardness, iron does not cause health related problems in water supplies. Iron and water hardness rather create aesthetic and economic problems. The US Environmental Protection Agency advises a secondary maximum contaminant level (SMCL) for iron of 0.3 ppm to avoid aesthetically displeasing iron staining. Cation exchange water softeners replace hardness causing ions of calcium and magnesium as well as dissolved ions of other metallic elements, including iron and manganese, for those of sodium or potassium. Water softening is generally considered effective for treating levels of iron up to 5 ppm, although many field installations have performed very satisfactorily removing up to 15 ppm of dissolved Fe +2 iron with cation exchange water softeners. Many homeowners purchase water softeners to remove iron from their water supply in addition to calcium and magnesium. As is evident in the photographs, the appliances using unsoftened water were prone to heavy iron staining on all internal surfaces, whereas those appliances on softened water did not show this effect. 5.1 Water Heaters Water heater efficiencies were calculated for the groups of instantaneous gas water heaters, gas storage water heaters, and electric storage water heaters. Five water heaters in each group were operated using unsoftened well water (26.2 grains per gallon, 0.99 ppm iron); and five water heaters were operated using softened well water (0.55 grains per gallon, and 0.27 ppm iron). The efficiencies were calculated using the following energy balance. The energy output delivered from the hot water withdrawn from the tank is: Final Report 10
25 Q out = mc(t out T in ) where m = the measured amount of water withdrawn from the tank, c = the heat capacity of water, T out = the measure outlet water temperature, and T in = the measured inlet water temperature. The energy input into the tank was determined for electric water heaters by directly measuring the kilowatt-hours used with a watt-hour meter. For gas water heaters, the energy input was determined using: Q in = V x H where V = the measured volume of natural gas used, and H = the measured Btu content of the natural gas using a gas chromatograph. The efficiency was then calculated using: E = Q out / Q in where E = the efficiency of the water heater. 5.2 Instantaneous Gas Water Heaters The instantaneous gas water heaters chosen for these tests were residential models that had a maximum set point temperature of 140 F. However, the average outlet water temperature for each instantaneous gas water heater was measured every minute during the testing. The five instantaneous gas water heaters operating with soft water had an average outlet water temperature of F, and the five instantaneous gas water heaters operating with unsoftened water had an average outlet temperature of F. Since scale buildup generally increases with increasing temperature, it is important to operate both groups of water heaters with nearly identical hot water delivery temperatures. These temperatures meet this criterion Instantaneous Gas Water Heaters on Soft Water Water heater efficiency measurements were taken periodically over the course of testing the instantaneous gas water heaters. For reference purposes, the equivalent field service time was determined by taking the total amount of water throughput and assuming the average U.S. household uses 50 gallons of hot water per day. Later the results will be generalized so that predictions can be made assuming either higher or lower household usage rates. All of the efficiency data shown on these plots is included in Appendix C (on a CD) for the individual water heaters. Also included in the appendix are the statistical averages, standard deviations, and 95 percent confidence intervals for each set of data. Figure 5-1 shows the measured efficiencies of the instantaneous gas water heaters did not change significantly over time, and averaged a constant value of 79.1 percent. Also shown on this graph, are the number of water heaters used to determine the average water heater efficiency at Final Report 11
26 each point in time. At the start of the test there were five water heaters setup under identical conditions. In this case all five water heaters survived during the entire test. Figure 5-2 shows the 95 percent confidence interval on each of the data points using the number of water heaters, the calculated standard deviation; and a Student s t-distribution. This shows that the efficiencies of the water heaters on soft water did not change significantly over the course of the testing, and a constant efficiency of 79.1 percent is a reasonable approximation. These instantaneous gas water heaters logged over three years of equivalent field service assuming a household uses 50 gallons of hot water per day. Final Report 12
27 90 85 Instantaneous Gas Water Heaters With Soft Water (Number of water heaters used to calculate averages also shown) Efficiency, % Average efficiency over time was 79.1 percent for instantaneous water heaters on soft water Equivalent Years of Hot Water Use, Years Figure 5-1. Efficiency of the instantaneous gas water heaters on soft water over time Instantaneous Gas Water Heaters With Soft Water (Number of water heaters used to calculate averages also shown) 80 Efficiency, % Equivalent Years of Hot Water Use, Years Figure percent confidence intervals for the efficiency measurements of the instantaneous gas water heaters on soft water. Final Report 13
28 In summary, the instantaneous gas water heaters on soft water performed well throughout the entire testing period. Although the pressure regulators and needle valves were tweaked throughout the testing to maintain constant testing conditions, the instantaneous gas water heaters on soft water required minimal attention because the conditions were very stable. This is reflected in the efficiency data for these units which show that the efficiency remained essentially constant over the duration of the testing with the variations being within the experimental error of the instrumentation and testing protocol. Overall, the softened water appears to have done a good job of preventing scale buildup in the instantaneous gas water heaters Instantaneous Gas Water Heaters on Unsoftened Water Water heater efficiency measurements were also taken for an identical set of five instantaneous gas water heaters operating on unsoftened water. These results are also presented using an equivalent field service time determined by taking the total amount of water throughput and assuming the average U.S. household uses 50 gallons of hot water per day (Paul, et al., 1994). Later the results will be generalized so that predictions can be made assuming either higher or lower household usage rates. All of the efficiency data shown on these plots is included in Appendix C for the individual water heaters. Also included in the appendix are the statistical averages, standard deviations, and 95 percent confidence intervals for each set of data Instantaneous Gas Water Heaters With Hard Water (Number of water heaters used to calculate averages also shown) Efficiency, % Water Heaters Delimed Equivalent Years of Hot Water Use, Years Figure 5-3. Efficiencies of the instantaneous gas water heaters using unsoftened water. Final Report 14
29 Figure 5-3 shows the measured efficiencies of the instantaneous gas water heaters that were operated using unsoftened water. In this case, the efficiency of the water heaters changes significantly with time because the internal surfaces of the heat exchanger begin to collect scale from the unsoftened water. The scale coating introduces an extra layer of resistance to heat transfer, and reduces the effectiveness of the heat exchanger. For reference, the initially measured water heater efficiency is shown as a constant value line over the testing period. Also shown on this graph are the number of water heaters used to determine the average water heater efficiency at each point in time. At the start of the test there were five water heaters setup under identical conditions. All five water heaters were operating until about 1.6 years of equivalent hot water use. At this time the flow rate in two of the instantaneous water heaters on unsoftened water reduced to a trickle even though the control valves and pressure regulators were completely opened. One of the instantaneous water heaters was exhibiting an audible alarm and fault code indicating that the unit needed to be delimed. (Deliming is required when the efficiency falls below a value of approximately 72%.) A service technician from Best Plumbing (New Albany, OH) was called in to examine the units, and he delimed the instantaneous water heaters on unsoftened water using the set of deliming valves on the water heater. The deliming valves on these water heaters are a pair of three way valves that allow a service technician to isolate the instantaneous water heater from the rest of the inlet and outlet piping system, and to circulate a deliming solution through the water. The service technician circulated the deliming solution for 30 minutes through each of the units. The efficiency of the three remaining water heaters on unsoftened water improved after the deliming procedure, but the flow through the two units that were down before the deliming procedure was still inadequate. A decision was made to cut open the one-half inch copper pipe immediately downstream of the water heater, but before the pressure regulator and needle valve. The Battelle technician used a hack saw to cut out the two 90 degree elbows shown in Figure 5-4 Examination of the outlet piping revealed that the copper piping was nearly completely plugged with scale at one of the elbows. However, the cutting of the pipe with the hack saw loosened scale on the vertical pipe walls after the elbows, and the scale collected in the lower elbow. Figure 5-4 also shows the loose scale that was found inside of the elbow after it was dumped out onto a piece of paper. Pieces of the loose scale had a curvature that indicated that the scale was stuck to the one-half inch, vertical pipe walls prior to falling into the elbow. The thickness of several large pieces of scale were carefully measured and found to be about 0.05 inches thick. This scale was sent to Culligan International for analysis. Culligan dissolved the scale in solution and then performed a quantitative analysis of the solution to determine the percentage of calcium carbonate, magnesium, iron, and other species in the scale sample. The results are presented in Appendix O show the results for calcium, magnesium, iron, copper, and manganese to be 2079 ppm, 96 ppm, 164 ppm, 28 ppm, and 21 ppm, respectively. This shows that the overwhelming majority of the scale is calcium carbonate. Final Report 15

30 Figure 5-4. Loose scale inside the elbow from the instantaneous water heater on unsoftened water. The pressure regulators downstream of all of the water heaters were disassembled and found to be clogged with scale as shown in Figure 5-5. Even after the pressure regulators were cleaned and reassembled, the two water heaters with inadequate flow rates before still had marginal flow rates. The instantaneous water heaters would not consistently fire with each water draw. It was subsequently learned that these instantaneous water heaters must have a minimum flow rate of water before they will fire. Based on testing, it was found that if the flow rate of water was greater than 0.5 gallons per minute, the instantaneous water heaters would fire consistently. At flow rates below 0.5 gallons per minute, the water heaters became very inconsistent in firing; sometimes they would fire and other times they would not fire during a water draw. Based on these observations, it was concluded that the downstream piping and fittings (needle valve and solenoid valve) were clogged with scale on these two units. The entire downstream piping and fittings would have to be replaced for these tests to continue, so the testing of these two units was discontinued. At a time of about 2.3 equivalent years, one of the three remaining instantaneous water heaters on unsoftened water could not maintain insufficient flow to fire consistently, and testing was discontinued. At about 2.5 equivalent years, the piping systems on the remaining two instantaneous water heaters also clogged up to the point of causing the water heaters to fire inconsistently, so the testing of these units was discontinued. The downstream piping system on all of the instantaneous water heaters on unsoftened water would have to be either delimed or Final Report 16

31 replaced for additional testing to continue with these units. In contrast to the unsoftened water tests, all of the instantaneous water heaters on soft water operated without difficulty to the scheduled end of the tests at about 3.2 equivalent years Figure 5-5. Clogging of the strainers from the disassembled pressure regulators of the instantaneous water heaters on unsoftened water. With this explanation for the removal of some of the instantaneous water heaters using unsoftened water an examination of the efficiency data can begin. Figure 5-6 shows the 95 percent confidence interval on each of the data points using the number of water heaters, the calculated standard deviation; and a Student s t-distribution. At about 1.3 equivalent years into the testing, the 95 percent confidence intervals began to increase dramatically due to the unsoftened water scale buildup inside the water heaters and on the downstream piping system and control valves. After the water heaters were delimed, the efficiency of the remaining units improved to 77 percent, but did not recover to the measured initial efficiency of 80 percent. Figure 5-7 looks at only the efficiency data of the instantaneous water heaters on unsoftened water prior to being delimed at about 1.6 equivalent years. A linear regression analyses of the efficiency data for the instantaneous water heaters on unsoftened water reveals the efficiency decreased on average about 5.33 efficiency points per year prior to the water heaters being Final Report 17
32 delimed at about 1.6 equivalent years. The linear regression analsis yields a least squares fit to this data that reveals an equation for how the efficiency of the units changes with time as: E = E o 5.14t (Instantaneous Water Heaters Only) Equation 1 where E = the efficiency at time t, E o = the initial efficiency of the water heater at t = 0, in this case 80 %, t = the time in equivalent years defined as usage in gallons divided by gallons per year. This equation can be generalized to predict the efficiency of instantaneous water heaters at other water hardness levels, and for other daily hot water usage amount by putting it into the form below: E = E o bt Equation 2 where b = ( )HG (Instantaneous Water Heaters Only) Equation 3 H = the water hardness in grains per gallon, G = the daily household hot water usage in gallons per day. For the instantaneous water heaters on unsoftened water, the water hardness was 26.2 grains per gallon, and a daily hot water usage of 50 gallons per day was assumed. When these values are plugged into Eq. 3, the value for b is 5.14 which is identical to the coefficient used in Eq. 1. The expression for b assumes that if you double the usage rate, the amount of scale buildup inside the water heater also doubles. For instantaneous water heaters on soft water with a water hardness level of 0.0 grains per gallon, Eq. 2 reduces to a constant value E o for the efficiency for all times, which is consistent with Battelle s research findings discussed in Section 5.2. The time required before deliming an instantaneous water heater can be predicted from Eq. 2 as a function of the water hardness and average household hot water usage. For this testing, the instantaneous water heaters on unsoftened water started out with an efficiency of 80 percent and were delimed when the efficiency dropped to about 72 percent, the level at which the alarm is activated. Using these efficiency limits, Table 5-1 was generated using Eq. 1, and shows how the efficiency of instantaneous water heater changes with time for various water hardness levels and for households that use either 50 or 100 gallons per day of hot water. When the water heater efficiency dropped to less than 72 percent in Table 5-1, a table entry of Delime was inserted to indicate that it was time to delime the instantaneous water heater. For instance, assuming a water hardness level of 10 grains per gallon, the time until deliming would be 4.4 years for a household using an average of 50 gallons of hot water per day, and 2.2 years for the same household using an average of 100 gallons of hot water per day. Besides the nuisance factor associated with having maintenance done on your water heater, the cost to delime the water heater is about $120 per visit. Final Report 18
33 90 85 Instantaneous Gas Water Heaters With Hard Water (Error bars represent 95% confidence limits) 80 Efficiency, % Water Heaters Delimed Equivalent Years of Hot Water Use, Years Figure percent confidence intervals for the efficiency measurements of the instantaneous gas water heaters on unsoftened water InstantaneousGas Water Heaters With Soft Water Efficiency, % Instantaneous Gas Water Heaters With Hard Water (Error bars represent 95% confidence limits) E = t R² = Equivalent Years of Hot Water Use, Years Figure 5-7. Linear regression of the efficiency data for the instantaneous water heaters on unsoftened water. Final Report 19
34 Table 5-1. Predicted efficiencies of instantaneous water heaters as a function of water hardness and hot water usage. 50 Gallons Per Day of Hot Water Usage 100 Gallons Per Day of Hot Water Usage Time Water Hardness in Grains Per Gallon Water Hardness in Grains Per Gallon (Years) Delime Delime Delime Delime Delime Delime Delime Delime Delime Delime Delime Delime 80.0 Final Report 20
35 In comparison, if the instantaneous water heater is using a water softener that is capable of removing all of the water hardness, the unit should never have to be delimed. In addition, there is a considerable cost savings associated with having an instantaneous water heater operating at a constant 80 percent efficiency as opposed to slowly degrading over time to about 72 percent efficiency before being delimed. Table 5-2 shows the energy costs associated with operating an instantaneous water heater as a function of water hardness. A 15-year life of the water heater was assumed. The instantaneous water heater using 30 grains per gallon unsoftened water costs $1,461 more to operate over its useful life than one using softened water (0 grains per gallon). Most of this cost is associated with the deliming process. However, using an inlet water with a lower hardness, the energy savings become more significant over the life of the water heater. (See the results for 5 gpg hardness in Table 5-2, where the energy cost savings is 39%, versus only 9% for the 30 gpg hardness case.) Table 5-2. costs as a function of water hardness for instantaneous water heaters. Cost of Natural Gas Over The Life of an Instantaneous Gas Water Heater Water Hardness, grains/gallon Water Inlet Temperature, F Set Point Temperature, F Life of Water Heater, Years Efficiency at Beginning Efficiency at Delimining NA Natural Gas Used, mmbtu Natural Gas Price, $/mmbtu $10 $10 $10 $10 $10 $10 $10 Cost of Natural Gas, $ $2,565 $2,703 $2,704 $2,703 $2,704 $2,703 $2,703 Added Cost Without Softener $0 $138 $138 $138 $138 $137 $138 Deliming Cost $120 $0 $220 $439 $662 $878 $1,104 $1,324 Additional Operating Costs $0 $358 $577 $799 $1,016 $1,242 $1,461 1 With 0 grains per gallon hardness, the instantaneous water will not need to be delimed over the life of the unit and the efficiency remains constant at 80 %. 2 Instantaneous water heaters using hard water operate at an average efficiency between 80 and 72 percent depending on how many times they need to be delimed over the life of the unit, and for this reason use slightly more gas than units on 0 gpg water (80 % efficient). Final Report 21
36 82 80 Predicted Deliming Intervals for an Instantaneous Water Heater Operating With 30 Grains Per Gallon Water Hardness Predicted Efficiency, % Deliming assumed when instatantaneous water heater efficiency drops to 72% Time, Years Figure 5-7A. The predicted deliming intervals for an instantaneous water heater operating with extremely hard water at 30 grains per gallon hardness. At the end of the testing the instantaneous water heaters were disassembled and the heat exchangers cut in half in order to examine the scaling conditions inside the tubes. Appendices I and J contain the photos of the heat exchangers for instantaneous water heaters on softened and unsoftened water, respectively. The heat exchangers using unsoftened water had more scale inside the tubes than the ones on softened water. However, the heat exchangers on unsoftened water were delimed about 30 days before the end of the test, and therefore, do not have as much scale as might be expected if the water heaters had not been delimed. In addition, at the end of testing, the outlet piping on each water heater was carefully cut into short lengths (ends taped to keep loose scale inside), and shipped to one of the Water Quality Association members for additional analysis. In summary, none of the instantaneous gas water heaters on unsoftened water made it through the entire testing period because the outlet piping system consisting of one-half inch copper pipe, a pressure regulator, a needle valve, and a solenoid valve became clogged with scale buildup. Although the pressure regulators and needle valves were tweaked throughout the testing to try to maintain constant testing conditions, the instantaneous gas water heaters on unsoftened water all dropped out of the testing before 2.5 years of equivalent field service. In contrast, the Final Report 22
37 instantaneous water heaters on soft water all completed testing without difficulty when the tests were stopped at 3.2 years of equivalent field service. In addition, the instantaneous water heaters on unsoftened water had to be delimed at 1.6 years of equivalent field service, and the average efficiency of these units dropped from 80 percent at the start of the test to 72 percent when they were delimed. After deliming, the average efficiency of these units increased to about 77 percent, but was still below the 80.1 percent starting efficiency. The cost implications of these findings are addressed in the section of the report on life cycle costs. 5.3 Gas Storage Water Heaters The gas storage water heaters chosen for these tests were residential models that had a maximum set point temperature of Very Hot, which corresponds to a maximum water temperature of about 160 F. The average outlet water temperature for each gas storage water heater was measured every minute during the testing. The five gas storage water heaters operating with unsoftened water had an average outlet water temperature of F, and the five gas storage water heaters operating with soft water had an average outlet temperature of F. Since scale buildup generally increases with increasing temperature, it was important to operate both groups of water heaters with nearly identical hot water delivery temperatures. These temperatures meet this criterion Gas Storage Water Heaters on Soft Water Water heater efficiency measurements were taken periodically over the course of testing the gas storage water heaters. For reference purposes, the equivalent field service time was determined by taking the total amount of water throughput and assuming the average U.S. household uses 50 gallons of hot water per day (Paul, et al., 1994). Later the results will be generalized so that predictions can be made assuming either higher or lower household usage rates. All of the efficiency data shown on these plots is included in Appendix E for the individual water heaters. Also included in the appendix are the statistical averages, standard deviations, and 95 percent confidence intervals for each set of data. Figure 5-8 shows the measured efficiencies of the gas storage water heaters did not change significantly over time, and averaged a constant value of 69.0 percent. Also shown on this graph, are the number of water heaters used to determine the average water heater efficiency at each point in time. At the start of the test there were five water heaters setup under identical conditions. In this case, all five water heaters survived during the entire test, but one of the water meters failed part way through the test dropping the number of available units to four, and one of the thermocouples on another unit failed later in the test dropping the number of available units to three. Even though this reduced the number of units available for calculating average efficiencies, sufficient data was recorded to yield reasonable results. Figure 5-9 shows the 95 percent confidence interval on each of the data points using the number of water heaters, the calculated standard deviation; and a Student s t-distribution. This shows that the efficiencies of the water heaters on soft water did not change significantly over the course of the testing, and a constant efficiency of 69.0 percent is a reasonable approximation. These water Final Report 23
38 heaters logged over 2.25 years of equivalent field service assuming a household uses 50 gallons of hot water per day Gas Storage Water Heaters With Soft Water (Number of water heaters used to calculate averages also shown) Efficiency, % Equivalent Years of Hot Water Use, Years Figure 5-8. Efficiency of the gas storage water heaters on soft water Gas Storage Water Heaters With Soft Water (Number of water heaters used to calculate averages also shown) Efficiency, % Equivalent Years of Hot Water Use, Years Figure percent confidence intervals for the efficiency measurements of the gas storage water heaters on soft water. In summary, the gas storage water heaters on soft water performed well throughout the entire testing period. Although the pressure regulators and needle valves were tweaked throughout the Final Report 24
39 testing to maintain constant testing conditions, the gas storage water heaters on soft water required minimal attention because the conditions were very stable. This is reflected in the efficiency data for these units which show that the efficiency remained essentially constant over the duration of the testing with the variations being within the experimental error of the instrumentation and testing protocol. Overall, the softened water appears to have done a good job of preventing scale buildup in the gas storage water heaters and piping system Gas Storage Water Heaters on Unsoftened Water Water heater efficiency measurements were also taken for an identical set of five gas storage water heaters operating on unsoftened water. These results are also presented using an equivalent field service time determined by taking the total amount of water throughput and assuming the average U.S. household uses 50 gallons of hot water per day Paul, et al., 1994). Later the results will be generalized so that predictions can be made assuming either higher or lower household usage rates. All of the efficiency data shown on these plots is included in Appendix F for the individual water heaters. Also included in the appendix are the statistical averages, standard deviations, and 95 percent confidence intervals for each set of data. Figure 5-10 shows the measured efficiencies of the gas storage water heaters that were operated using unsoftened water. In this case, the efficiency of the water heaters changes significantly with time because the internal surfaces of the heat exchanger begin to collect scale from the unsoftened water. The scale coating introduces an extra layer of resistance to heat transfer, and reduces the effectiveness of the heat exchanger. For reference, the initially measured water heater efficiency is a constant value of 69% over the testing period as seen in Figure Also shown on this graph are the number of water heaters used to determine the average water heater efficiency at each point in time. At the start of the test there were five water heaters setup under identical conditions. All five water heaters were operating until about 1.3 years of equivalent hot water use. It was at this point in time that it was noticed that the flow rate in one of the gas storage water heaters on unsoftened water had been reduced to a trickle even though the control valves and pressure regulators were completely opened. These water heaters were experiencing the same problems of scale buildup in the outlet piping system that the instantaneous water heaters experienced as explained in Section 5.2 of this report. However, since the gas storage water heaters were operating at a higher temperature (161.8 F) than the instantaneous water heaters (136.6 F), the clogging of the outlet piping started to occur at an earlier equivalent time. By the time the testing reached an equivalent time of 2.0 years only one water heater piping system was operating, and this one clogged up shortly thereafter. At the end of testing, the outlet piping on each water heater was carefully cut into short lengths (ends taped to keep loose scale inside), and shipped to one of the Water Quality Association members for additional analysis. With this explanation for the removal of some of the gas storage water heaters using unsoftened water from the test at various points in time an examination of the efficiency data can begin. Figure 5-11 shows the 95 percent confidence interval on each of the data points using the number of water heaters, the calculated standard deviation; and a Student s t-distribution. At about 0.8 Final Report 25
40 equivalent years into the testing, the 95 percent confidence intervals began to increase dramatically due to the unsoftened water scale buildup inside the water heaters and on the downstream piping system and control valves. A least squares fit to this data reveals an equation for how the efficiency of the units changes with time as: E = E o 1.485t (Gas Storage Water Heaters Only) Equation 4 where E = the efficiency at time t, E o = the initial efficiency of the water heater at t =0, in this case 70.4 %, t = the time in equivalent years defined as usage in gallons divided by gallons per year. This equation can be generalized to predict the efficiency of gas storage water heaters at other water hardness levels, and for other daily hot water usage amount by putting it into the form below: E = E o bt Equation 5 where b = ( )HG, (Gas Storage Water Heaters Only) Equation 6 H = the water hardness in grains per gallon, and G = the daily household hot water usage in gallons per day. For the gas storage water heaters on unsoftened water, the water hardness was 26.2 grains per gallon, and a daily hot water usage of 50 gallons per day was assumed. When these values are plugged into Eq. 3, the value for b is which is identical to the coefficient used in Eq. 4. The expression for b assumes that if you double the usage rate, the amount of scale buildup inside the water heater also doubles. Final Report 26
41 Gas Storage Water Heaters With Hard Water (Number of water heaters used to calculate averages also shown) Efficiency, % Equivalent Years of Hot Water Use, Years Figure Efficiencies of the gas storage water heaters using unsoftened water Efficiency, % Gas Storage Water Heaters With Hard Water (Error bars are 95% confidence limits) y = x R² = Equivalent Years of Hot Water Use, Years Figure percent confidence intervals for the efficiency measurements of the gas storage water heaters using unsoftened water. Final Report 27
42 75.0 Projections based 50 gallons per day hot water use 70.0 Efficiency, percent Soft Water 5 gpg Hardness 10 gpg Hardness 15 gpg Hardness 20 gpg Hardness 25 gpg Hardness 30 gpg Hardness Time, years Figure Predicted efficiency of a gas storage water heaters operating on soft water (0 grains per gallon) versus one operating on unsoftened water with a hardness of 30 grains per gallon. Final Report 28
43 Table 5-3. Predicted efficiencies of gas storage water heaters as a function of water hardness level and daily household hot water usage. 50 Gallons Per Day of Hot Water Usage 100 Gallons Per Day of Hot Water Usage Time Water Hardness in Grains Per Gallon Water Hardness in Grains Per Gallon (Years) Final Report 29
44 For gas storage water heaters on soft water with a water hardness level of 0.0 grains per gallon, Eq. 2 reduces to a constant value E o for the efficiency for all times, which is consistent with Battelle s research findings discussed in Section Table 5-3 shows the predicted gas storage water heater efficiency as a function of the water hardness level and daily household hot water usage. This table was generated using Eq. 5 with Eq. 6 used to predict the value of b. Figure 5-12 shows the efficiencies of gas storage water heaters operating on soft water is constant with time, whereas those units operating on unsoftened water experience significant degradation in efficiency over time. In summary, none of the gas storage water heaters on unsoftened water made it through the entire testing period because the outlet piping system consisting of one-half inch copper pipe, a needle valve, and a solenoid valve became clogged with scale buildup. Although the system controls were tweaked throughout the testing to try to maintain constant testing conditions, the gas storage water heaters on unsoftened water all dropped out of the testing before 2.0 years of equivalent field service. In contrast, the gas storage water heaters on soft water all completed testing without difficulty when the tests were stopped at 2.3 years of equivalent field service. In addition, the average efficiency of these units dropped from 70.4 percent at the start of the test to 67.4percent at two years equivalent field service. Equations 5 and 6 can be used to predict the efficiency of gas storage water heaters as a function of water hardness and daily household hot water usage. Table 5-4 shows the energy costs associated with operating a gas storage water heater as a function of water hardness. A fifteen year life of the water heater was assumed. The gas storage water heater using 30 grains per gallon unsoftened water costs $705 more to operate over its useful life than one using softened water. Table 5-4. costs for operating a gas storage water heater as a function of water hardness. Cost of Natural Gas Over The Life of A Gas Storage Water Heater Water Hardness, grains/gallon Water Inlet Temperature, F Set Point Temperature, F Life of Water Heater, Years Efficiency at Beginning Efficiency at End Natural Gas Used, mmbtu Natural Gas Price, $/mmbtu $10 $10 $10 $10 $10 $10 $10 Cost of Natural Gas, $ $2,915 $3,007 $3,107 $3,216 $3,337 $3,470 $3,620 Added Cost Without Softener $0 $92 $192 $301 $422 $555 $705 At the end of the testing the gas storage water heaters were disassembled and the scale was scraped from the inside surfaces, collected, and weighed. Table 5-5 shows the total amount of Final Report 30
45 scale collected from each unit and the rate of scale buildup assuming an average family uses 50 gallons of hot water per day. The average rate of scale buildup in the gas storage water heaters on unsoftened water was about 528 gm/yr (1.16 lb/yr). The average rate of scale buildup in the gas storage water heaters on soft water was about 7 gm/yr (0.01 lb/yr), which is almost negligible. Appendices K and L contain the photos of the insides of the gas storage water heaters on softened and unsoftened water, respectively. The gas storage water heaters using unsoftened water had hard scale coating all of the hot surfaces, and it is easy to understand why the efficiency of the water heater would be impacted. However, the water heaters on soft water were almost completely free of scale buildup on the interior surfaces. This also explains why the efficiency of the water heaters on soft water did not change during the course of the testing. Table 5-5. Hard water scale collected from the gas storage water heaters on unsoftened or softened water. Gas Storage Water Heaters Using Unsoftened Water at 26.2 grains/gallon Water Heater Inside Scale (gm) Equivalent Field Service (yrs) Scale Buildup Rate (gm/yr) Gas Storage Water Heaters Using Softened Water at 1.2 grains/gallon Water Heater Inside Scale (gm) Equivalent Field Service (yrs) Scale Buildup Rate (gm/yr) Unit Unit Unit Unit Unit Unit Electric Storage Water Heaters The electric storage water heaters chosen for these tests were residential models that had a maximum set point temperature of Very Hot, which corresponds to a maximum water temperature of about 150 F. The average outlet water temperature for each electric storage water heater was measured every minute during the testing. The five electric storage water heaters operating with unsoftened water had an average outlet water temperature of F, and the five electric storage water heaters operating with soft water had an average outlet temperature of F. Since scale buildup generally increases with increasing temperature, it is important to operate both groups of water heaters with nearly identical hot water delivery temperatures. These temperatures meet this criterion Electric Storage Water Heaters on Soft Water Water heater efficiency measurements were taken periodically over the course of testing the electric storage water heaters. For reference purposes, the equivalent field service time was determined by taking the total amount of water throughput and assuming the average U.S. household uses 50 gallons of hot water per day Paul, et al., 1994). Later the results will be generalized so that predictions can be made assuming either higher or lower household usage rates. Final Report 31
46 All of the efficiency data shown on these plots is included in Appendix G for the individual water heaters. Also included in the appendix are the statistical averages, standard deviations, and 95 percent confidence intervals for each set of data. Figure 5-13 shows the measured efficiencies of the electric storage water heaters did not change significantly over time, and averaged a constant value of 99.3 percent. Also shown on this graph, are the number of water heaters used to determine the average water heater efficiency at each point in time. At the start of the test there were five water heaters setup under identical conditions. In this case, all five water heaters survived during the entire test without any problems. Figure 5-14 shows the 95 percent confidence interval on each of the data points using the number of water heaters, the calculated standard deviation; and a Student s t-distribution. This shows that the efficiencies of the water heaters on soft water did not change significantly over the course of the testing, and a constant efficiency of 99.3 percent is a reasonable approximation. These water heaters logged over 1.25 years of equivalent field service assuming a household uses 50 gallons of hot water per day. In summary, the electric storage water heaters on soft water performed well throughout the entire testing period. Although the pressure regulators and needle valves were tweaked throughout the testing to maintain constant flow rates through the water heaters, the electric storage water heaters on soft water required minimal attention because the conditions were very stable. This is reflected in the efficiency data for these units which show that the efficiency remained essentially constant over the duration of the testing with the variations being within the experimental error of the instrumentation and testing protocol. Overall, the softened water appears to have done a good job of preventing scale buildup in the electric storage water heaters and piping system Electric Storage Water Heaters on Unsoftened Water Water heater efficiency measurements were also taken for an identical set of five electric storage water heaters operating on unsoftened water. These results are also presented using an equivalent field service time determined by taking the total amount of water throughput and assuming the average U.S. household uses 50 gallons of hot water per day. Later the results will be generalized so that predictions can be made assuming either higher or lower household usage rates. All of the efficiency data shown on these plots is included in Appendix H for the individual water heaters. Also included in the appendix are the statistical averages, standard deviations, and 95 percent confidence intervals for each set of data. Final Report 32
47 Electric Storage Water Heaters With Soft Water (Number of water heaters used to calculate averages also shown) 102 Efficiency, % Equivalent Years of Hot Water Use, Years Figure Efficiency of the electric storage water heaters using soft water Electric Storage Water Heaters With Soft Water (Error bars represent 95% confidence limits) Efficiency, % Equivalent Years of Hot Water Use, Years Figure percent confidence intervals for the efficiency measurements of the electric storage water heaters on soft water. Final Report 33
48 Figure 5-15 shows the measured efficiencies of the electric storage water heaters that were operated using unsoftened water. In this case, the efficiency of the water heaters did not change significantly with time because the heating element is completely submersed in the tank of water and the heat generated must enter the water. The efficiency of the electric water heaters on unsoftened water averaged 99.5 percent. The internal surfaces of the heating element will collect scale from the unsoftened water. The scale coating introduces an extra layer of resistance to heat transfer, and increases the operating temperature of the heating element, which is expected to reduce the life of the heating element. The 95% confidence intervals are shown in Figure At the start of the test there were five water heaters setup under identical conditions. All five water heaters were operating until about 0.4 years of equivalent hot water use. It was at this point in time that it was noticed that the flow rate in one of the electric storage water heaters on unsoftened water had been reduced to a trickle even though the control valves were completely opened. These water heaters were experiencing the same problems of scale buildup in the outlet piping system that the instantaneous water heaters experienced as explained in Section of this report. By the time the testing reached an equivalent time of 0.8 years only one water heater piping system was operating, and this one clogged up shortly thereafter. In summary, the electric storage water heaters on both softened and unsoftened water were able to maintain a constant efficiency throughout the entire test period because the heating elements were completely submerged in the water. However, the life of the heating element in unsoftened water is expected to be shorted due to scale buildup increasing the operating temperature of the element. Table 5-6 shows the energy costs associated with operating an electric storage water heater as a function of water hardness. A fifteen year life of the water heater was assumed. The electric storage water heater using 26 grains per gallon unsoftenedwater costs same to operate over its useful life as the one using softened water because the efficiency of the submerged heating elements does not change over the life of the unit. At the end of the testing the electric storage water heaters were disassembled and the scale was scraped from the inside surfaces, collected, and weighed. Table 5-7 shows the total amount of scale collected from each unit and the rate of scale buildup assuming an average family uses 50 gallons of hot water per day. The average rate of scale buildup in the electric storage water heaters on unsoftened water was about 907 g/yr (2.00 lb/yr). The average rate of scale buildup in the electric storage water heaters on soft water was about 14 g/yr (0.03 lb/yr), which is almost negligible. Appendices M and N contain the photos of the insides of the electric storage water heaters on softened and unsoftened water, respectively. The electric storage water heaters on unsoftened water had large amounts of loose scale in the bottom of the tank that had fallen off the heating element. However, the water heaters on soft water were almost completely free of scale buildup on the interior surfaces. In addition, at the end of testing, the outlet piping on each water heater was carefully cut into short lengths (ends taped to keep loose scale inside), and shipped to one of the Water Quality Association members for additional analysis. Final Report 34
49 Electric Storage Water Heaters With Hard Water (Number of water heaters used to calculate averages also shown) 102 Efficiency, % Equivalent Years of Hot Water Use, Years Figure Efficiencies of the electric storage water heaters using unsoftened water Efficiency, % Electric Storage Water Heaters With Hard Water (Error bars represent 95% confidence limits) Equivalent Years of Hot Water Use, Years Figure percent confidence intervals for the efficiency measurements of the electric storage water heaters on unsoftened water. Final Report 35
50 Table 5-6. costs for operating an electric storage water heater as a function of water hardness. Cost of Electricity Over The Life of an Electric Storage Water Heater Water Hardness, grains/gallon Water Inlet Temperature, F Set Point Temperature, F Life of Water Heater, Years Efficiency at Beginning Efficiency at End Electricity Used, kwh Electricity Price, $/kwh $0.10 $0.10 $0.10 $0.10 $0.10 $0.10 Cost of Electricity, $ $6,051 $6,051 $6,051 $6,051 $6,051 $6,051 Added Cost Without Softener $0 $0 $0 $0 $0 $0 Table 5-7. Hard water scale collected from each of the electric storage water heaters using either unsoftened or softened water. Electric Storage Water Heaters Using Unsoftened Water at 26.2 grains/gallon Water Heater Inside Scale (g) Equivalent Field Service (yrs) Scale Buildup Rate (g/yr) Electric Storage Water Heaters Using Softened Water at 1.2 grains/gallon Water Heater Inside Scale (g) Equivalent Field Service (yrs) Scale Buildup Rate (g/yr) Unit Unit Unit Unit Unit Unit Unit Fixtures and Appliance Test Results Low Flow Showerheads Ten low flow showerheads were installed on the hot water supply coming from the ten instantaneous gas water heaters; five were tested on unsoftened water and five were tested using softened water. These showerheads were tested for a total of seven days. At the end of the test, the showerheads using softened well water were performing nearly as well as the day they were installed. However, the showerheads using unsoftened well water had over three-fourths of their nozzles clogged at the end of the test. The low flow showerheads on soft water each had an average of 3,663 gallons of water flow through them. Figure 5-17 shows a typical spray pattern from one of the showerheads using soft water at the end of the test. Final Report 36

51 At the end of testing, the low flow showerheads on unsoftened water each had an average of 3,203 gallons of water flow through them. Figure 5-18 shows a typical spray pattern from one of the showerheads using unsoftened water at the end of the test. Assuming an average U.S. household size of 2.56 (2007 Census) and each person takes one shower a day using 10 gallons per shower, the number of days represented by the testing is 125 days for unsoftened water showerheads and 143 days for soft water showerheads. However, since these showerheads were operated at 140 F rather than 100 F, there is an acceleration factor of 4 associated with this temperature difference. Therefore, the showerheads operating on unsoftened water had an equivalent field service of 1.37 years, and the showerheads on soft water had an equivalent field service of 1.57 years. The unsoftened water was at approximately 26 grains per gallon, and the soft water was at approximately 0.55 grain per gallon. Appendix R contains pictures that document the condition of the showerheads while they were being tested, at the end of the test, and after the teardown analysis. Figure Typical spray pattern from one of the showerheads using soft water at the end of the test. Final Report 37
, and five low flow faucets were tested using softened well water (0.55 grains per gallon).")
52 Figure Typical spray pattern from one of the showerheads using unsoftened water at the end of the test Low Flow Faucets After the tests with the showerheads were complete, ten low flow faucets were installed on the hot water supply coming from the ten instantaneous gas water heaters. Five low flow faucets were tested using unsoftened well water (26 grains per gallon), and five low flow faucets were tested using softened well water (0.55 grains per gallon). Figures 5-19 through 5-23 show the condition of the low flow faucet strainers after the equivalent of 19 days of water flow through the faucets assuming an average household uses about 50 gallons of hot water per day. The photos show that the low flow faucets on softened well water are relatively clean and continued to operate without problems over the period of the test. The low flow faucets on unsoftened well water showed large amounts of scale collection on the strainers, and were stopped after 19 equivalent days of testing because the specified flow rate of 1.25 gallons per minute could no longer be maintained. At the end of the test, the faucets using softened well water were performing nearly as well as the day they were installed. However, the strainers on the faucets using unsoftened well water were almost completely clogged. The collection of scale on the faucets using unsoftened water appears to be the result of scale breaking loose from upstream portions of the plumbing and being trapped in the strainers. Prior to installing the faucets, the instantaneous water heaters on unsoftened water had logged the equivalent of 1.6 years of hot water flow and the piping system appears to be coated with scale buildup. The instantaneous water heaters on softened well water had logged the equivalent of Final Report 38


53 2.0 years of hot water flow and yet the faucets on these heaters showed almost no scale collection on the strainers. Figure Photo showing the Set 1 faucet strainers at the end of the test. Figure Photo showing the Set 2 faucet strainers at the end of the test. Figure Photo showing the Set 3 faucet strainers at the end of the test. Figure Photo showing the Set 4 faucet strainers at the end of the test. Final Report 39
54 Figure Photo showing the Set 5 faucet strainers at the end of the test. 5.6 Dishwashers and Clothes Washers Tested Using Unsoftened and Softened Water Six dishwashers (Kitchenaid ) and laundry washers (General Electric) were purchased to test the effect on longevity of the appliances. The electronic controls for this equipment were integrated into the automated data acquisition and control system designed for the testing. The laboratory set up of the appliances was completed with three each connected to hot unsoftened water and softened water from two gas heaters. Battelle s original intent was to use hot water generated from the ongoing water heater tests to run the dish washer and laundry washers test. However, the manufacturer s specifications on the dish washers required incoming water to be at 20 psig which was not available through the gravity feed planned earlier. With this variation, Battelle installed two 40-gal gas water heaters to supply either softened or unsoftened hot water to these appliances. This arrangement of dedicated water heaters for the appliance tests guarantees continuous availability of hot water for appliance tests and also allows a better control over the inlet temperature to the appliances. The wash and dry cycles of the dish washers and the wash cycles are controlled automatically with the units going through eight cycles every 24 hours. The appliances are set up on a 3-hour operation cycle with automated dispensing of detergents. The clothes washers use Tide laundry detergent dispensed in amount indicated on the Tide package. The dishwashers are using Cascade laundry detergent dispensed in the amount indicated on the Cascade package. The clothes washers are loaded with 7 lbs of restaurant hand towels. The dishwashers are loaded with eight place settings of dishes and flatware. These loadings are similar to those specified in the Department of test protocols for clothes washers and dishwashers. At the end of the 30 days of testing, the dishwashers were examined before a teardown analysis was initiated. Figure 5-24 shows the condition inside one of the dishwashers using softened water (0.55 grain per gallon) at the end of the test. The unit was almost completely free of any water scale buildup. In contrast, Figure 5-25 shows the condition inside one of the dishwashers using unsoftened water (26 grains per gallon) at the end of the test. The unit had noticeable water scale buildup on all of the interior surfaces after only 30 days of testing. Although both of the dishwashers completed the same number of wash cycles (240), the appearance of the inside of the dishwasher using unsoftened water shows that it needs to be delimed and cleaned due to the buildup of scale and deposits. On the other hand, the dishwasher using soft water looks like it could be cleaned up to look like new with just a quick wipe down. Final Report 40

55 Figure Photos showing condition of dishwasher at the end of 30 days using soft water. Final Report 41

56 Figure Photos showing condition of dishwasher at the end of 30 days using unsoftened water. Final Report 42

57 Results similar to the dishwashers were also obtained for the clothes washers. At the end of the 30 days of testing, the clothes washers were examined. Figure 5-26 shows that the clothes washers using soft water had almost no buildup of scale or deposits in the drum. In contrast, Figure 5-27 shows that clothes washers using unsoftened water had significant buildup of scale and deposits on the interior of the drum. Figure Drum of the laundry washer using softened water was almost completely free from water scale buildup. Final Report 43
, but the appearance of the inside of the clothes washer using unsoftened water shows that it needs to be delimed and cleaned")
58 Figure Drum of the laundry washer using unsoftened water had significant water scale buildup on all of the interior surfaces. Both of the clothes washers completed the same number of wash cycles (240), but the appearance of the inside of the clothes washer using unsoftened water shows that it needs to be delimed and cleaned due to the buildup of scale and deposits. On the other hand, the clothes washer using soft water looks like it could be cleaned up to look like new with just a quick wipe down. A teardown analysis of the internal components of the clothes washers revealed that the spray nozzles on the clothes washers using softened water were completely open; however, the spray nozzles on the clothes washers using unsoftened water were partially clogged. Both are shown in Figure On the clogged unit shown in the photograph, 15 of the 32 spray nozzles for the water supply to the drum were completely plugged. The plugged holes on the spray nozzles would be very difficult to clean because they are located inside the unit and cannot be seen without sticking your head inside of the drum. Final Report 44
 had almost no water scale buildup at the end of testing.")
59 Figure Laundry washer spray nozzles after 30 days of testing. 5.7 Summary of Findings on Fixtures and Appliances The low flow showerheads, faucets, dishwashers, and clothes washers using softened water (0.55 grains per gallon) had almost no water scale buildup at the end of testing. In contrast, the identical fixtures and appliances tested using unsoftened water (26 grains per gallon) showed significant scale buildup on all interior surfaces. Furthermore, the showerheads and faucets on unsoftened water eventually became clogged to the points where the testing could no longer continue because of the reduced flow rates in these devices. 5.8 Differential Carbon Footprint This section presents the results of the electricity consumption for the appliances testing per the protocol discussed in Section 4.3. Figures 5-29 and 5-30, for laundry washers and dishwashers respectively, present the calculated energy consumption results. These are the per cycle energy consumption results, corrected for test and equipment disruptions, as noted in the raw data in Appendix A. This data is for the electricity consumed by the machines alone. It was combined with the energy consumption for water heating and water softening to compute the carbon footprint. (Note Battelle began by testing the Watts Up? PRO meter on only the laundry washers using unsoftened water to evaluate the Watts Up? PRO device. After a period of approximately two weeks, when the device was shown to operate as advertised and expected, testing began for the rest of the appliances. For this reason there is energy consumption data for the laundry washers using unsoftened water for the period from 7/12/2009 through 7/24/2009, but not for the other appliances.) Final Report 45
60 Daily Average Per Cycle Consumption, kwh /14 7/18 7/22 7/26 7/30 8/3 8/7 8/11 8/15 8/19 8/23 Date Figure Summary of Laundry Washers Daily Average Per Cycle Consumption. Daily Average Per Cycle Consumption, kwh Laundry Washer Per Cycle Consumption Dishwasher Per Cycle Consumption Dishwashers, Hard Water Dishwashers, Soft Water Laundry Washers, Hard Water Laundry Washers, Soft Water 7/23 7/25 7/27 7/29 7/31 8/2 8/4 8/6 8/8 8/10 8/12 8/14 8/16 8/18 8/20 8/22 8/24 Figure Summary of Dishwashers Daily Average Per Cycle Consumption. Date Final Report 46
61 The peak in energy consumption between 8/12 and 8/14 was due to a water heater malfunction the pilot light extinguished. The resulting spike in energy consumption is a result of the internal heater in the dishwasher bringing the water from ambient to operating temperature. The electricity consumption data for the laundry washers is from the motor attached to the drum and agitator. For the dishwashers, the electricity consumption is for the motor and pump for the water dispensing system and the water heating and drying systems, which is why the electricity consumption is much higher. The inlet water temperature to each set of appliances was set to the same value. As seen in the graphs in Figures 5-29 and 5-30, especially for the laundry washers, the electricity consumption is erratic. Despite considerable effort expended, Battelle was not able to locate a reason why the laundry washing machine energy consumption varied so greatly from day-to-day. The only useful observation that could be made is that the sets of units, unsoftened water or softened water, tended to vary in the same direction, which Battelle interpreted to mean there was some variable within the system which the test protocol had not been designed to control. Battelle performed extensive testing of the dishwasher systems and were able to produce the graph shown in Figure As seen, despite efforts to control system parameters, the dishwashers receiving unsoftened water and softened water performed differently. The dishwashers receiving softened water consistently showed a lag between the start of the cycle and the Figure Example Dishwasher Operating Curves initiation of the energy intensive portion of the wash cycle. Battelle believes one or more internal sensors were reacting adversely to the softened water. Final Report 47
62 After reviewing the test data and protocol, Battelle contacted both GE and KitchenAid to ask for clarifications on the appliance design characteristics, performance or environmental factors that might lead to the results seen. Battelle was unable to reach any conclusion with KitchenAid, but discussions with a GE Product Engineer (Jerrod Keppler, telephone conversation with David P. Evers, September 28, 2009) focused on the probability the line pressure was too low. The laundry washers from GE are designed to check the inlet line pressure, and when the pressure is too low they will not complete the cycle as programmed. Because the testing was automated, with each operating cycle initiated by the data logging and system control software at a specified time, the laundry machines were not allowed to wait for the line pressure to recover prior to finishing a cycle. In a home setting the machine would wait for a period for line pressure to recover and then initiate the cycle as programmed. In discussions with GE, the low electricity demand values Battelle measured correspond to the power consumption of the electronic controls (about 2 W per machine, or kwh per cycle), while the highest values Battelle measured correspond with the values GE submitted for Star rating. The water delivery system was designed to maintain a line pressure of 30 psig on the water heater inlet side. (The in line filters were changed when the line pressure dropped to approximately 30 pisg.) The test protocol for appliance cycles, with 30 minute offsets between the initiation of the cycle for each machine, was designed to eliminate water supply and line pressure issues. Based on these results for water heater testing, one sample calculation of the carbon footprint savings that might be expected for natural gas water heating is presented in Table 5-8. The remaining calculations will proceed in a similar manner, and are presented in Appendix B, with the results summarized in Table 5-9. Consumption Table 5-8. Example Carbon Footprint Calculations Units Unit Carbon Footprint Units Carbon Footprint, kg per gallon Purpose Sources Scenario: Water Heating - Natural gas Heating, per gallon hot water, 15 year average savings Case: Unsoftened Water, 26.2 grains per gallon hardness Natural gas 1280 Btu/gal kg/scf Heating water US EPA AP-42, Section 1.4 Electricity 0 MJ/gal kg/mj 0 GaBi 4.3, US Power Grid Mix, TRACI GW Emissions Total Case: Softened Water Natural gas 1065 Btu/gal kg/scf Heating water Operating Electricity MJ/gal kg/mj softener Total Softener energy use derived from Culligan data Final Report 48
63 The carbon footprint is dependent upon the energy consumption. Where the differences in energy consumption are large, such as with the gas storage water heater, the carbon footprint difference is also large. As can be seen in Table 5-8, most of the carbon footprint is a result of the combustion of natural gas for water heating, and not for operation of the water softening system. For the instantaneous water heater, where the system in frequently cleaned of scale, delimed, the natural gas consumption differential between the systems using softened and unsoftened water was much less, and the carbon footprint is also much less. Table 5-9. Summary of Carbon Footprint Results Carbon Footprint, kg per gallon hot water Scenario Case Unsoftened Water Softened Water Reduction Water Heating Natural gas, Storage Type % Water Heating Natural gas, Instantaneous Type % 6.0 Conclusions 6.1 Instantaneous Gas Water Heaters Reviewing the results in Table 5-2, for natural gas consumption, Battelle concludes that use of a water softener to reduce the scale forming compounds in water will result in natural gas savings. This natural gas savings will lead to direct economic savings. Because of the need to have the instantaneous water heater delimed or cleaned periodically, the economic savings can lead to recovery of the cost of a water softener and operating supplies in a period as short as months, if the inlet water is sufficiently hard. Further, the lower use of natural gas leads to reductions in the carbon footprint, see Table 5-9, in proportion to the decrease in total energy consumption. Total energy consumption accounts for both natural gas to fire the water heater and electricity to operate the softener. 6.2 Gas Storage Water Heaters Similar to the conclusions for the instantaneous gas water heater, reviewing the results in Table 5-4, for natural gas consumption, Battelle concludes that use of a water softener to reduce the scale forming compounds in water will result in natural gas savings. Because of the much lower energy intensity of a gas storage water heater, Btu input rate per unit time and volume of water, the natural gas savings for a storage water heater are much lower than those for the instantaneous water heater, being approximately one-half the savings that might be found when using an instantaneous water heater. This energy savings will lead to direct economic savings in proportion to the reduced natural gas consumption. Further, the lower use of energy leads to reductions in the carbon footprint, see Table 5-9, in proportion to the decrease in total energy consumption. Total energy consumption accounts for both natural gas to fire the water heater and electricity to operate the softener. Final Report 49
64 6.3 Electric Water Heaters Because of plugging of piping on the water heater outlet Battelle was unable to conduct a sufficient number of days of testing to demonstrate any changes in electricity consumption or potential cost savings for the electric storage water heaters. As discussed in Section 5.4.2, no difference in the electricity consumption between two electric storage water heaters, one receiving softened and the other unsoftened water, is expected. Given this lack of a difference in electricity consumption for water heating, the additional electricity required to operate a water softener would mean the softened water case would use more electricity than the unsoftened water case, thus the carbon footprint would be higher. However, because the electric water heater receiving softened water would be expected to have a longer life, there is expected to be cost savings supporting the use of softened water. 6.4 Fixtures and Appliances Low flow showerheads and faucets using unsoftened water clogged in less than seven days of accelerated life testing, whereas those units using softened water made it through the test without any problems. Under the testing conditions at Battelle with high hardness of the inlet water, a water softener will significantly increase the life of faucets and fixtures. 7.0 References New Mexico State Water Heater Efficiency Study Paul, D. D., B.E. Ide, and P.A. Hartford, Residential Hot Water Usage: A Review of Published Metered Studies, GRI-94/0442, December Final Report 50
65 Appendix A Appliance Consumption Test Data Final Report 51
66 This page intentionally left blank. Final Report 52
67 Table A-1 Washer and Dishwasher Testing Results Number of Cycles per Day: 8 Number of Machines Tested: 3 Calculation Exception Date Time (24 hour clock) Approximate Number of Cycles Washing Machines, Hard Water 7/14/10 9: Meter Readings, kwh Dishwashers, Washing Hard Water Machines, (Sum of Two Soft Water Meters) Dishwashers, Soft Water (Sum of Two Meters) Date Laundry Washers, Hard Water 7/15/10 8: /15/ /16/10 9: /16/ /17/10 8: /17/ /20/10 8: /20/ /21/10 8: /21/ /22/10 9: /22/ /23/10 8: /23/ Average Consumption per Cycle, kwh Laundry Washers, Soft Water Dishwashers, Hard Water Dishwashers, Soft Water 7/23/10 16: /23/ /24/10 8: /24/ Notes WM-HW: Value seems low. Checking on operation WM-HW: Value seems low. Checking on operation Installation of remaining power meters (Watt Meter Pro) Final Report 53
68 Table A-1 Washer and Dishwasher Testing Results Number of Cycles per Day: 8 Number of Machines Tested: 3 Time (24 hour clock) Approximate Number of Cycles Washing Machines, Hard Water Meter Readings, kwh Washing Machines, Soft Water Dishwashers, Hard Water (Sum of Two Meters) Dishwashers, Soft Water (Sum of Two Meters) Calculation Exception Laundry Washers, Hard Water Average Consumption per Cycle, kwh Laund ry Wash ers, Soft Dishwashers, Hard Water Water Dishwashers, Soft Water Date Date Notes System shut-down (unin-tended) Sat. 7/25 at 2:30 PM; WM HW: Values seems 7/25/10 14: /25/ high. DW HW: Value seems low. Cal-culations revised to account for system restart after delay. DW HW 3 failed to run 5 cycles after restart. 7/28/10 8: /28/ /29/10 8: /29/ All DW failed to cycle once at 11 P 7/29. Labview shutdown 7/30/10 8: /30/ /29 1:45 p to 3:15 P. DW SW: Value seems 7/31/10 8: /31/ low. WM: Values seem 8/3/10 8: /3/ low. 8/4/10 8: /4/ /5/10 8: /5/ /6/10 8: /6/ Washer and Dishwasher Testing Number of Cycles per Day 8 Number of Machines Tested 3 Calc Exception SW WH Temp. Set Point adjust-ed 11 A 8/5. Final Report 54
69 Meter Readings, kwh Average Consumption per Cycle, kwh Date Time (24 hour clock) Approximate Number of Cycles Washing Machines, Hard Water Washing Dishwashers, Machines, Hard Water Soft (Sum of Two Water Meters) Dishwashers, Soft Water (Sum of Two Meters) Date Laundry Washers, Hard Water Laundry Washers, Soft Water Dishwashers, Hard Water Dishwashers, Soft Water Notes 8/7/10 8: /7/ First full day with higher SW 0.60 WH Set Point. 8/10/10 8: /10/ /11/10 8: /11/ /12/10 8: /12/ HW Water Heater Pilot Out 8/13/10 8: /13/ HW Water Heater Pilot Out 8/14/10 8: /14/ /17/10 8: /17/ Labview crash from 9/15 9:30 PM through 9/16 11 AM, no cycling. DW HW 0.56 value seems low. 8/18/10 7: /18/ /19/10 7: /19/ /20/10 8: /20/ /21/10 7: /21/ /24/10 8: /24/ DW SW: Meter appears to have reset between Friday morning and this morning. The value this morning was 27.4 kwh, about 1/10th the expected value. Final Report 55
70 This page intentionally left blank. Final Report 56
71 Appendix B Carbon Footprint Calculations Final Report 57
72 This page intentionally left blank. Final Report 58
73 Table B-1 Water Heating Carbon Footprint Calculations Unit Consumption Units Carboon Footprint Units Carbon Footprint, kg/gal Purpose Sources Scenario: Water Heating - Natural gas Heating, Storage Type, per gallon hot water, 15 year average savings Case: Unsoftened Water, 26.2 grains per gallon Hardness Natural gas 1280 Btu/gal kg/scf Heating water Electricity kg/mj 0 Total Case: Softened Water, 0 grains per gallon Hardness Natural gas 1065 Btu/gal kg/scf Heating water Electricity MJ/gal kg/mj Operating softener Total Savings, kg CO2 equiv. per kg gallon hot water Savings, % 14.8 Scenario: Water Heating - Natural gas Heating, Instantaneous Type, per gallon hot water, 15 year average savings Case: Unsoftened Water, 26.2 grains per gallon Hardness Natural gas 1007 Btu/gal kg/scf Heating water Electricity kg/mj 0 Total Case: Softened Water, 0 grains per gallon Hardness US EPA AP-42, Section 1.4 GaBi 4.3, US Power Grid Mix, TRACI GW Emissions US EPA AP-42, Section 1.4 Culligan Test Data, assuming three days between regeneration and 50 gal per day hot water demand US EPA AP-42, Section 1.4 GaBi 4.3, US Power Grid Mix, TRACI GW Emissions Final Report 59
74 Consumption Units Unit Carboon Footprint Units Carbon Footprint, kg/gal Purpose Sources Natural gas 937 Btu/gal kg/scf Heating water Electricity MJ/gal kg/mj Operating softener Total Savings, kg Savings, % 4.4 kg CO2 equiv. per gallon hot water US EPA AP-42, Section 1.4 Culligan Test Data, assuming three days between regeneration and 50 gal per day hot water demand Final Report 60
75 Appendix C Efficiency Data For Instantaneous Gas Water Heaters Using Softened Water Final Report 61
76 This page intentionally left blank. Final Report 62
77 Total Water Used (Gallons) Equivalent Years Gal/(50*365) (Years) Water Used (Gallons) Water Temperature Difference (F) Gas Used (cf) Water Output (Btu) Gas Input (Btu) Efficiency Unit Average 79.3 Standard Deviation % Confidence Level 0.66 Concentration, % Content Btu/cf Content Btu/cf Component Normalized Isobutene Nbutane IsoPentane Npentane CO Ethane Hexane Propane N Methane Nat Gas Final Report 63
78 Total Water Used (Gallons) Equivalent Years Gal/(50*365) (Years) Water Used (Gallons) Water Temperature Difference (F) Gas Used (cf) Water Output (Btu) Gas Input (Btu) Efficiency Unit Average 77.9 Standard Deviation % Confidence Level 0.56 Concentration, % Content Btu/cf Content Btu/cf Component Normalized Isobutene Nbutane IsoPentane Npentane CO Ethane Hexane Propane N Methane Nat Gas Final Report 64
79 Total Water Used (Gallons) Equivalent Years Gal/(50*365) (Years) Water Used (Gallons) Water Temperature Difference (F) Gas Used (cf) Water Output (Btu) Gas Input (Btu) Efficiency Unit Average 77.9 Standard Deviation % Confidence Level 0.94 Concentration, % Content Btu/cf Content Btu/cf Component Normalized Isobutene Nbutane IsoPentane Npentane CO Ethane Hexane Propane N Methane Nat Gas Final Report 65
80 Total Water Used (Gallons) Equivalent Years Gal/(50*365) (Years) Water Used (Gallons) Water Temperature Difference (F) Gas Used (cf) Water Output (Btu) Gas Input (Btu) Efficiency Unit Average 78.1 Standard Deviation % Confidence Level 0.31 Concentration, % Content Btu/cf Content Btu/cf Component Normalized Isobutene Nbutane IsoPentane Npentane CO Ethane Hexane Propane N Methane Nat Gas Final Report 66
81 Total Water Used (Gallons) Equivalent Years Gal/(50*365) (Years) Water Used (Gallons) Water Temperature Difference (F) Gas Used (cf) Water Output (Btu) Gas Input (Btu) Efficiency Unit Average 78.6 Standard Deviation % Confidence Level 0.36 Concentration, % Content Btu/cf Content Btu/cf Component Normalized Isobutene Nbutane IsoPentane Npentane CO Ethane Hexane Propane N Methane Nat Gas Final Report 67
82 Total Water Used (Gallons) Equivalent Years Gal/(50*365) (Years) Water Used (Gallons) Water Temperature Difference (F) Gas Used (cf) Water Output (Btu) Gas Input (Btu) Efficiency Unit Average 78.4 Standard Deviation % Confidence Level 0.93 Concentration, % Content Btu/cf Content Btu/cf Component Normalized Isobutene Nbutane IsoPentane Npentane CO Ethane Hexane Propane N Methane Nat Gas Final Report 68
83 Total Water Used (Gallons) Equivalent Years Gal/(50*365) (Years) Water Used (Gallons) Water Temperature Difference (F) Gas Used (cf) Water Output (Btu) Gas Input (Btu) Efficiency Unit Average 79.4 Standard Deviation % Confidence Level 1.27 Concentration, % Content Btu/cf Content Btu/cf Component Normalized Isobutene Nbutane IsoPentane Npentane CO Ethane Hexane Propane N Methane Nat Gas Final Report 69
84 Total Water Used (Gallons) Equivalent Years Gal/(50*365) (Years) Water Used (Gallons) Water Temperature Difference (F) Gas Used (cf) Water Output (Btu) Gas Input (Btu) Efficiency Unit Average 77.9 Standard Deviation % Confidence Level 0.60 Concentration, % Content Btu/cf Content Btu/cf Component Normalized Isobutene Nbutane IsoPentane Npentane CO Ethane Hexane Propane N Methane Nat Gas Final Report 70
85 Total Water Used (Gallons) Equivalent Years Gal/(50*365) (Years) Water Used (Gallons) Water Temperature Difference (F) Gas Used (cf) Water Output (Btu) Gas Input (Btu) Efficiency Unit Average 78.9 Standard Deviation % Confidence Level 0.97 Concentration, % Content Btu/cf Content Btu/cf Component Normalized Isobutene Nbutane IsoPentane Npentane CO Ethane Hexane Propane N Methane Nat Gas Final Report 71
86 Total Water Used (Gallons) Equivalent Years Gal/(50*365) (Years) Water Used (Gallons) Water Temperature Difference (F) Gas Used (cf) Water Output (Btu) Gas Input (Btu) Efficiency Unit Average 80.0 Standard Deviation % Confidence Level 1.06 Concentration, % Content Btu/cf Content Btu/cf Component Normalized Isobutene Nbutane IsoPentane Npentane CO Ethane Hexane Propane N Methane Nat Gas Final Report 72
87 Total Water Used (Gallons) Equivalent Years Gal/(50*365) (Years) Water Used (Gallons) Water Temperature Difference (F) Gas Used (cf) Water Output (Btu) Gas Input (Btu) Efficiency Unit Average 78.1 Standard Deviation % Confidence Level 0.69 Concentration, % Content Btu/cf Content Btu/cf Component Normalized Isobutene Nbutane IsoPentane Npentane CO Ethane Hexane Propane N Methane Nat Gas Final Report 73
88 Total Water Used (Gallons) Equivalent Years Gal/(50*365) (Years) Water Used (Gallons) Water Temperature Difference (F) Gas Used (cf) Water Output (Btu) Gas Input (Btu) Efficiency Unit Average 78.7 Standard Deviation % Confidence Level 0.21 Concentration, % Content Btu/cf Content Btu/cf Component Normalized Isobutene Nbutane IsoPentane Npentane CO Ethane Hexane Propane N Methane Nat Gas Final Report 74
89 Appendix D Efficiency Data For Instantaneous Gas Water Heaters Using Unsoftened Water Final Report 75
90 This page intentionally left blank. Final Report 76
91 Total Water Used (Gallons) Equivalent Years Gal/(50*365) (Years) Water Used (Gallons) Water Temperature Difference (F) Gas Used (cf) Water Output (Btu) Gas Input (Btu) Efficiency Unit Average 80.0 Standard Deviation % Confidence Level 1.37 Concentration, % Content Btu/cf Content Btu/cf Component Normalized Isobutene Nbutane IsoPentane Npentane CO Ethane Hexane Propane N Methane Nat Gas Final Report 77
92 Total Water Used (Gallons) Equivalent Years Gal/(50*365) (Years) Water Used (Gallons) Water Temperature Difference (F) Gas Used (cf) Water Output (Btu) Gas Input (Btu) Efficiency Unit Average 76.9 Standard Deviation % Confidence Level 0.97 Concentration, % Content Btu/cf Content Btu/cf Component Normalized Isobutene Nbutane IsoPentane Npentane CO Ethane Hexane Propane N Methane Nat Gas Final Report 78
93 Total Water Used (Gallons) Equivalent Years Gal/(50*365) (Years) Water Used (Gallons) Water Temperature Difference (F) Gas Used (cf) Water Output (Btu) Gas Input (Btu) Efficiency Unit Average 75.9 Standard Deviation % Confidence Level 2.04 Concentration, % Content Btu/cf Content Btu/cf Component Normalized Isobutene Nbutane IsoPentane Npentane CO Ethane Hexane Propane N Methane Nat Gas Final Report 79
94 Total Water Used (Gallons) Equivalent Years Gal/(50*365) (Years) Water Used (Gallons) Water Temperature Difference (F) Gas Used (cf) Water Output (Btu) Gas Input (Btu) Efficiency Unit Average 75.1 Standard Deviation % Confidence Level 0.48 Concentration, % Content Btu/cf Content Btu/cf Component Normalized Isobutene Nbutane IsoPentane Npentane CO Ethane Hexane Propane N Methane Nat Gas Final Report 80
95 Total Water Used (Gallons) Equivalent Years Gal/(50*365) (Years) Water Used (Gallons) Water Temperature Difference (F) Gas Used (cf) Water Output (Btu) Gas Input (Btu) Efficiency Unit Average 75.0 Standard Deviation % Confidence Level 0.74 Concentration, % Content Btu/cf Content Btu/cf Component Normalized Isobutene Nbutane IsoPentane Npentane CO Ethane Hexane Propane N Methane Nat Gas Final Report 81
96 Total Water Used (Gallons) Equivalent Years Gal/(50*365) (Years) Water Used (Gallons) Water Temperature Difference (F) Gas Used (cf) Water Output (Btu) Gas Input (Btu) Efficiency Unit Average 75.0 Standard Deviation % Confidence Level 0.98 Concentration, % Content Btu/cf Content Btu/cf Component Normalized Isobutene Nbutane IsoPentane Npentane CO Ethane Hexane Propane N Methane Nat Gas Final Report 82
97 Total Water Used (Gallons) Equivalent Years Gal/(50*365) (Years) Water Used (Gallons) Water Temperature Difference (F) Gas Used (cf) Water Output (Btu) Gas Input (Btu) Efficiency Unit Average 72.8 Standard Deviation % Confidence Level 3.30 Concentration, % Content Btu/cf Content Btu/cf Component Normalized Isobutene Nbutane IsoPentane Npentane CO Ethane Hexane Propane N Methane Nat Gas Final Report 83
98 Total Water Used (Gallons) Equivalent Years Gal/(50*365) (Years) Water Used (Gallons) Water Temperature Difference (F) Gas Used (cf) Water Output (Btu) Gas Input (Btu) Efficiency Unit Average 71.8 Standard Deviation % Confidence Level 5.02 Concentration, % Content Btu/cf Content Btu/cf Component Normalized Isobutene Nbutane IsoPentane Npentane CO Ethane Hexane Propane N Methane Nat Gas Final Report 84
99 Total Water Used (Gallons) Equivalent Years Gal/(50*365) (Years) Water Used (Gallons) Water Temperature Difference (F) Gas Used (cf) Water Output (Btu) Gas Input (Btu) Efficiency Unit Misread Low flow 1.70 Average 74.7 Standard Deviation % Confidence Level 2.74 Concentration, % Content Btu/cf Content Btu/cf Component Normalized Isobutene Nbutane IsoPentane Npentane CO Ethane Hexane Propane N Methane Nat Gas Final Report 85
100 Total Water Used (Gallons) Equivalent Years Gal/(50*365) (Years) Water Used (Gallons) Water Temperature Difference (F) Gas Used (cf) Water Output (Btu) Gas Input (Btu) Efficiency Unit Low flow 5 Low flow 1.83 Average 76.4 Standard Deviation % Confidence Level 3.19 Concentration, % Content Btu/cf Content Btu/cf Component Normalized Isobutene Nbutane IsoPentane Npentane CO Ethane Hexane Propane N Methane Nat Gas Final Report 86
101 Total Water Used (Gallons) Equivalent Years Gal/(50*365) (Years) Water Used (Gallons) Water Temperature Difference (F) Gas Used (cf) Water Output (Btu) Gas Input (Btu) Efficiency Unit Low flow 5 Low flow 1.94 Average 76.9 Standard Deviation % Confidence Level 0.87 Concentration, % Content Btu/cf Content Btu/cf Component Normalized Isobutene Nbutane IsoPentane Npentane CO Ethane Hexane Propane N Methane Nat Gas Final Report 87
102 Total Equivalent Water Water Gas Water Years Water Temperature Gas Used Gal/(50*365) Used Difference Used Output Input Efficiency Unit (Gallons) (Years) (Gallons) (F) (cf) (Btu) (Btu) Low flow Low flow 5 Low flow 2.31 Average 74.7 Standard Deviation % Confidence Level Concen- tration, Content Content Component % Btu/cf Normalized Btu/cf Isobutene Nbutane IsoPentane Npentane CO Ethane Hexane Propane N Methane Nat Gas Final Report 88
103 Total Equivalent Water Water Gas Water Years Water Temperature Gas Used Gal/(50*365) Used Difference Used Output Input Efficiency Unit (Gallons) (Years) (Gallons) (F) (cf) (Btu) (Btu) Low flow Low flow 5 Low flow 2.44 Average 74.7 Standard Deviation % Confidence Level 5.29 Concen- tration, Content Content Component % Btu/cf Normalized Btu/cf Isobutene Nbutane IsoPentane Npentane CO Ethane Hexane Propane N Methane Nat Gas Final Report 89
104 This page intentionally left blank. Final Report 90
105 Appendix E Efficiency Data For Gas Storage Water Heaters Using Softened Water Final Report 91
106 This page intentionally left blank. Final Report 92
107 Total Equivalent Water Water Gas Water Years Water Temperature Gas Used Gal/(50*365) Used Difference Used Output Input Efficiency Unit (Gallons) (Years) (Gallons) (F) (cf) (Btu) (Btu) Average 69.5 Standard Deviation % Confidence Level 1.33 Concen- tration, Content Content Component % Btu/cf Normalized Btu/cf Isobutene Nbutane IsoPentane Npentane CO Ethane Hexane Propane N Methane Nat Gas Final Report 93
108 Total Equivalent Water Water Gas Water Years Water Temperature Gas Used Gal/(50*365) Used Difference Used Output Input Efficiency Unit (Gallons) (Years) (Gallons) (F) (cf) (Btu) (Btu) Average 68.7 Standard Deviation % Confidence Level 0.80 Concen- tration, Content Content Component % Btu/cf Normalized Btu/cf IsoButane Nbutane IsoPentane Npentane CO Ethane Hexane Propane N Methane Nat Gas Final Report 94
109 Total Equivalent Water Water Gas Water Years Water Temperature Gas Used Gal/(50*365) Used Difference Used Output Input Efficiency Unit (Gallons) (Years) (Gallons) (F) (cf) (Btu) (Btu) Average 69.0 Standard Deviation 0.70 Concen- tration, Content Content Component % Btu/cf Normalized Btu/cf IsoButane Nbutane IsoPentane Npentane CO Ethane Hexane Propane N Methane Nat Gas % Confidence Level 0.87 Final Report 95
110 Total Equivalent Water Water Gas Water Years Water Temperature Gas Used Gal/(50*365) Used Difference Used Output Input Efficiency Unit (Gallons) (Years) (Gallons) (F) (cf) (Btu) (Btu) Meter Out Average 69.6 Standard Deviation % Confidence Level 0.78 Concen- Content Content Component tration, % Btu/cf Normalized Btu/cf IsoButane Nbutane IsoPentane Npentane CO Ethane Hexane Propane N Methane Nat Gas Final Report 96
111 Total Equivalent Water Water Gas Water Years Water Temperature Gas Used Gal/(50*365) Used Difference Used Output Input Efficiency Unit (Gallons) (Years) (Gallons) (F) (cf) (Btu) (Btu) Meter Out Average 69.7 Standard Deviation % Confidence Level 0.76 Concen- Content Content Component tration, % Btu/cf Normalized Btu/cf IsoButane Nbutane IsoPentane Npentane CO Ethane Hexane Propane N Methane Nat Gas Final Report 97
112 Total Equivalent Water Water Gas Water Years Water Temperature Gas Used Gal/(50*365) Used Difference Used Output Input Efficiency Unit (Gallons) (Years) (Gallons) (F) (cf) (Btu) (Btu) Meter Out Average 69.3 Standard Deviation % Confidence Level 0.74 Concen- Content Content Component tration, % Btu/cf Normalized Btu/cf IsoButane Nbutane IsoPentane Npentane CO Ethane Hexane Propane N Methane Nat Gas Final Report 98
113 Total Equivalent Water Water Gas Water Years Water Temperature Gas Used Gal/(50*365) Used Difference Used Output Input Efficiency Unit (Gallons) (Years) (Gallons) (F) (cf) (Btu) (Btu) Meter Out Average 68.4 Standard Deviation % Confidence Level 0.96 Concen- Content Content Component tration, % Btu/cf Normalized Btu/cf IsoButane Nbutane IsoPentane Npentane CO Ethane Hexane Propane N Methane Nat Gas Final Report 99
114 Total Equivalent Water Water Gas Water Years Water Temperature Gas Used Gal/(50*365) Used Difference Used Output Input Efficiency Unit (Gallons) (Years) (Gallons) (F) (cf) (Btu) (Btu) Meter Out Average 69.6 Standard Deviation % Confidence Level 0.88 Concen- Content Content Component tration, % Btu/cf Normalized Btu/cf IsoButane Nbutane IsoPentane Npentane CO Ethane Hexane Propane N Methane Nat Gas Final Report 100
115 Total Equivalent Water Water Gas Water Years Water Temperature Gas Used Gal/(50*365) Used Difference Used Output Input Efficiency Unit (Gallons) (Years) (Gallons) (F) (cf) (Btu) (Btu) Meter Out TC Out 1.66 Average 68.1 Standard Deviation % Confidence Level 0.86 Concen- Content Content Component tration, % Btu/cf Normalized Btu/cf IsoButane Nbutane IsoPentane Npentane CO Ethane Hexane Propane N Methane Nat Gas Final Report 101
116 Total Equivalent Water Water Gas Water Years Water Temperature Gas Used Gal/(50*365) Used Difference Used Output Input Efficiency Unit (Gallons) (Years) (Gallons) (F) (cf) (Btu) (Btu) Meter Out TC Out 1.81 Average 69.4 Standard Deviation % Confidence Level 1.09 Concen- Content Content Component tration, % Btu/cf Normalized Btu/cf IsoButane Nbutane IsoPentane Npentane CO Ethane Hexane Propane N Methane Nat Gas Final Report 102
117 Total Equivalent Water Water Gas Water Years Water Temperature Gas Used Gal/(50*365) Used Difference Used Output Input Efficiency Unit (Gallons) (Years) (Gallons) (F) (cf) (Btu) (Btu) Meter Out TC Out 2.14 Average 68.9 Standard Deviation % Confidence Level 1.63 Concen- Content Content Component tration, % Btu/cf Normalized Btu/cf IsoButane Nbutane IsoPentane Npentane CO Ethane Hexane Propane N Methane Nat Gas Final Report 103
118 Total Equivalent Water Water Gas Water Years Water Temperature Gas Used Gal/(50*365) Used Difference Used Output Input Efficiency Unit (Gallons) (Years) (Gallons) (F) (cf) (Btu) (Btu) Meter Out TC Out 2.26 Average 68.0 Standard Deviation % Confidence Level 0.57 Concen- Content Content Component tration, % Btu/cf Normalized Btu/cf IsoButane Nbutane IsoPentane Npentane CO Ethane Hexane Propane N Methane Nat Gas Final Report 104
119 Appendix F Efficiency Data For Gas Storage Water Heaters Using Unsoftened Water Final Report 105
120 This page intentionally left blank. Final Report 106
121 Total Equivalent Water Water Gas Water Years Water Temperature Gas Used Gal/(50*365) Used Difference Used Output Input Efficiency Unit (Gallons) (Years) (Gallons) (F) (cf) (Btu) (Btu) Average 70.5 Standard Deviation % Confidence Level 0.52 Concen- Content Content Component tration, % Btu/cf Normalized Btu/cf IsoButane Nbutane IsoPentane Npentane CO Ethane Hexane Propane N Methane Nat Gas Final Report 107
122 Efficiency Data For Gas Storage Waters Heater Using unsoftened Water Total Equivalent Water Water Gas Water Years Water Temperature Gas Used Gal/(50*365) Used Difference Used Output Input Efficiency Unit (Gallons) (Years) (Gallons) (F) (cf) (Btu) (Btu) Average 69.4 Standard Deviation % Confidence Level 0.47 Concen- Content Content Component tration, % Btu/cf Normalized Btu/cf IsoButane Nbutane IsoPentane Npentane CO Ethane Hexane Propane N Methane Nat Gas Final Report 108
123 Total Equivalent Water Water Gas Water Years Water Temperature Gas Used Gal/(50*365) Used Difference Used Output Input Efficiency Unit (Gallons) (Years) (Gallons) (F) (cf) (Btu) (Btu) Average 69.6 Standard Deviation % Confidence Level 0.42 Concen- Content Content Component tration, % Btu/cf Normalized Btu/cf IsoButane Nbutane IsoPentane Npentane CO Ethane Hexane Propane N Methane Nat Gas Final Report 109
124 Total Equivalent Water Water Gas Water Years Water Temperature Gas Used Gal/(50*365) Used Difference Used Output Input Efficiency Unit (Gallons) (Years) (Gallons) (F) (cf) (Btu) (Btu) Average 69.1 Standard Deviation % Confidence Level 1.00 Concen- Content Content Component tration, % Btu/cf Normalized Btu/cf IsoButane Nbutane IsoPentane Npentane CO Ethane Hexane Propane N Methane Nat Gas Final Report 110
125 Total Equivalent Water Water Gas Water Years Water Temperature Gas Used Gal/(50*365) Used Difference Used Output Input Efficiency Unit (Gallons) (Years) (Gallons) (F) (cf) (Btu) (Btu) Average 69.3 Standard Deviation % Confidence Level 1.78 Concen- Content Content Component tration, % Btu/cf Normalized Btu/cf IsoButane Nbutane IsoPentane Npentane CO Ethane Hexane Propane N Methane Nat Gas Final Report 111
126 Total Equivalent Water Water Gas Water Years Water Temperature Gas Used Gal/(50*365) Used Difference Used Output Input Efficiency Unit (Gallons) (Years) (Gallons) (F) (cf) (Btu) (Btu) Average 69.8 Standard Deviation % Confidence Level 1.16 Concen- Content Content Component tration, % Btu/cf Normalized Btu/cf IsoButane Nbutane IsoPentane Npentane CO Ethane Hexane Propane N Methane Nat Gas Final Report 112
127 Total Equivalent Water Water Gas Water Years Water Temperature Gas Used Gal/(50*365) Used Difference Used Output Input Efficiency Unit (Gallons) (Years) (Gallons) (F) (cf) (Btu) (Btu) Average 68.8 Standard Deviation % Confidence Level 1.46 Concen- Content Content Component tration, % Btu/cf Normalized Btu/cf IsoButane Nbutane IsoPentane Npentane CO Ethane Hexane Propane N Methane Nat Gas Final Report 113
128 Total Equivalent Water Water Gas Water Years Water Temperature Gas Used Gal/(50*365) Used Difference Used Output Input Efficiency Unit (Gallons) (Years) (Gallons) (F) (cf) (Btu) (Btu) Average 67.6 Standard Deviation % Confidence Level 2.55 Concen- Content Content Component tration, % Btu/cf Normalized Btu/cf IsoButane Nbutane IsoPentane Npentane CO Ethane Hexane Propane N Methane Nat Gas Final Report 114
129 Total Equivalent Water Water Gas Water Years Water Temperature Gas Used Gal/(50*365) Used Difference Used Output Input Efficiency Unit (Gallons) (Years) (Gallons) (F) (cf) (Btu) (Btu) Average 69.5 Standard Deviation % Confidence Level 0.62 Concen- Content Content Component tration, % Btu/cf Normalized Btu/cf IsoButane Nbutane IsoPentane Npentane CO Ethane Hexane Propane N Methane Nat Gas Final Report 115
130 Total Equivalent Water Water Gas Water Years Water Temperature Gas Used Gal/(50*365) Used Difference Used Output Input Efficiency Unit (Gallons) (Years) (Gallons) (F) (cf) (Btu) (Btu) Average 66.8 Standard Deviation 95% Confidence Level NA Concen- Content Content Component tration, % Btu/cf Normalized Btu/cf IsoButane Nbutane IsoPentane Npentane CO Ethane Hexane Propane N Methane Nat Gas Final Report 116
131 Total Equivalent Water Water Gas Water Years Water Temperature Gas Used Gal/(50*365) Used Difference Used Output Input Efficiency Unit (Gallons) (Years) (Gallons) (F) (cf) (Btu) (Btu) Average 66.6 Standard Deviation 95% Confidence Level NA Concen- Content Content Component tration, % Btu/cf Normalized Btu/cf IsoButane Nbutane IsoPentane Npentane CO Ethane Hexane Propane N Methane Nat Gas Final Report 117
132 Total Equivalent Water Water Gas Water Years Water Temperature Gas Used Gal/(50*365) Used Difference Used Output Input Efficiency Unit (Gallons) (Years) (Gallons) (F) (cf) (Btu) (Btu) Average 68.7 Standard Deviation 95% Confidence Level NA Concen- Content Content Component tration, % Btu/cf Normalized Btu/cf IsoButane Nbutane IsoPentane Npentane CO Ethane Hexane Propane N Methane Nat Gas Final Report 118
133 Appendix G Efficiency Data For Electric Storage Water Heaters Using Softened Water Final Report 119
134 This page intentionally left blank. Final Report 120
135 Total Equivalent Water Water Electric Water Years Water Temperature Electricity Used Gal/(50*365) Used Difference Used Output Input Efficiency Unit (Gallons) (Years) (Gallons) (F) kwh (Btu) (Btu) Average 99.2 Standard Deviation % Confidence Level 0.78 Total Equivalent Water Water Electric Water Years Water Temperature Electricity Used Gal/(50*365) Used Difference Used Output Input Efficiency Unit (Gallons) (Years) (Gallons) (F) kwh (Btu) (Btu) Average 99.0 Standard Deviation % Confidence Level 0.60 Final Report 121
136 Total Equivalent Water Water Electric Water Years Water Temperature Electricity Used Gal/(50*365) Used Difference Used Output Input Efficiency Unit (Gallons) (Years) (Gallons) (F) kwh (Btu) (Btu) Average 99.0 Standard Deviation % Confidence Level 0.70 Total Equivalent Water Water Electric Water Years Water Temperature Electricity Used Gal/(50*365) Used Difference Used Output Input Efficiency Unit (Gallons) (Years) (Gallons) (F) kwh (Btu) (Btu) Misread meter Average 99.5 Standard Deviation % Confidence Level 0.59 Final Report 122
137 Total Equivalent Water Water Electric Water Years Water Temperature Electricity Used Gal/(50*365) Used Difference Used Output Input Efficiency Unit (Gallons) (Years) (Gallons) (F) kwh (Btu) (Btu) Misread meter Average 99.2 Standard Deviation % Confidence Level 0.62 Total Equivalent Water Water Electric Water Years Water Temperature Electricity Used Gal/(50*365) Used Difference Used Output Input Efficiency Unit (Gallons) (Years) (Gallons) (F) kwh (Btu) (Btu) Average Standard Deviation % Confidence Level 0.32 Final Report 123
138 Total Equivalent Water Water Electric Water Years Water Temperature Electricity Used Gal/(50*365) Used Difference Used Output Input Efficiency Unit (Gallons) (Years) (Gallons) (F) kwh (Btu) (Btu) Average Standard Deviation % Confidence Level 1.55 Total Equivalent Water Water Electric Water Years Water Temperature Electricity Used Gal/(50*365) Used Difference Used Output Input Efficiency Unit (Gallons) (Years) (Gallons) (F) kwh (Btu) (Btu) Average 99.0 Standard Deviation % Confidence Level 0.71 Final Report 124
139 Total Equivalent Water Water Electric Water Years Water Temperature Electricity Used Gal/(50*365) Used Difference Used Output Input Efficiency Unit (Gallons) (Years) (Gallons) (F) kwh (Btu) (Btu) Average 98.0 Standard Deviation % Confidence Level 1.06 Total Equivalent Water Water Electric Water Years Water Temperature Electricity Used Gal/(50*365) Used Difference Used Output Input Efficiency Unit (Gallons) (Years) (Gallons) (F) kwh (Btu) (Btu) Average 99.5 Standard Deviation % Confidence Level 0.94 Final Report 125
140 Total Equivalent Water Water Electric Water Years Water Temperature Electricity Used Gal/(50*365) Used Difference Used Output Input Efficiency Unit (Gallons) (Years) (Gallons) (F) kwh (Btu) (Btu) Average 99.4 Standard Deviation % Confidence Level 0.50 Total Equivalent Water Water Electric Water Years Water Temperature Electricity Used Gal/(50*365) Used Difference Used Output Input Efficiency Unit (Gallons) (Years) (Gallons) (F) kwh (Btu) (Btu) Average Standard Deviation % Confidence Level 0.40 Final Report 126
141 Total Equivalent Water Water Electric Water Years Water Temperature Electricity Used Gal/(50*365) Used Difference Used Output Input Efficiency Unit (Gallons) (Years) (Gallons) (F) kwh (Btu) (Btu) Average 98.8 Standard Deviation % Confidence Level 0.25 Final Report 127
142 This page intentionally left blank. Final Report 128
143 Appendix H Efficiency Data For Electric Storage Water Heaters Using Unsoftened Water Final Report 129
144 This page intentionally left blank. Final Report 130
145 Total Equivalent Water Water Electric Water Years Water Temperature Electricity Used Gal/(50*365) Used Difference Used Output Input Efficiency Unit (Gallons) (Years) (Gallons) (F) kwh (Btu) (Btu) Average 99.4 Standard Deviation % Confidence Level 0.66 Total Equivalent Water Electric Electric Water Years Water Temperature Electricity Used Gal/(50*365) Used Difference Used Output Input Efficiency Unit (Gallons) (Years) (Gallons) (F) kwh (Btu) (Btu) Average 99.2 Standard Deviation % Confidence Level 0.44 Final Report 131
146 Total Equivalent Water Water Electric Water Years Water Temperature Electricity Used Gal/(50*365) Used Difference Used Output Input Efficiency Unit (Gallons) (Years) (Gallons) (F) kwh (Btu) (Btu) Average 99.2 Standard Deviation % Confidence Level 1.25 Total Equivalent Water Water Electric Water Years Water Temperature Electricity Used Gal/(50*365) Used Difference Used Output Input Efficiency Unit (Gallons) (Years) (Gallons) (F) kwh (Btu) (Btu) Low flow 0.39 Average Standard Deviation % Confidence Level 0.38 Final Report 132
147 Total Equivalent Water Water Electric Water Years Water Temperature Electricity Used Gal/(50*365) Used Difference Used Output Input Efficiency Unit (Gallons) (Years) (Gallons) (F) kwh (Btu) (Btu) Low flow 0.47 Average Standard Deviation % Confidence Level 0.98 Total Equivalent Water Water Electric Water Years Water Temperature Electricity Used Gal/(50*365) Used Difference Used Output Input Efficiency Unit (Gallons) (Years) (Gallons) (F) kwh (Btu) (Btu) Low flow 0.59 Average Standard Deviation % Confidence Level 0.26 Final Report 133
148 Total Equivalent Water Water Electric Water Years Water Temperature Electricity Used Gal/(50*365) Used Difference Used Output Input Efficiency Unit (Gallons) (Years) (Gallons) (F) kwh (Btu) (Btu) Low flow 0.62 Average 99.7 Standard Deviation % Confidence Level 2.50 Total Equivalent Water Water Electric Water Years Water Temperature Electricity Used Gal/(50*365) Used Difference Used Output Input Efficiency Unit (Gallons) (Years) (Gallons) (F) kwh (Btu) (Btu) Low flow 0.74 Average 99.7 Standard Deviation % Confidence Level 0.94 Final Report 134
149 Total Equivalent Water Water Electric Water Years Water Temperature Electricity Used Gal/(50*365) Used Difference Used Output Input Efficiency Unit (Gallons) (Years) (Gallons) (F) kwh (Btu) (Btu) Low flow 3 Low flow 4 Low flow 5 Low flow 0.86 Average 98.7 Standard Deviation NA 95% Confidence Level NA Total Equivalent Water Water Electric Water Years Water Temperature Electricity Used Gal/(50*365) Used Difference Used Output Input Efficiency Unit (Gallons) (Years) (Gallons) (F) kwh (Btu) (Btu) Low flow 3 Low flow 4 Low flow 5 Low flow 0.87 Average 98.1 Standard Deviation NA 95% Confidence Level NA Final Report 135
150 Total Equivalent Water Water Electric Water Years Water Temperature Electricity Used Gal/(50*365) Used Difference Used Output Input Efficiency Unit (Gallons) (Years) (Gallons) (F) kwh (Btu) (Btu) Low flow 3 Low flow 4 Low flow 5 Low flow 1.11 Average 99.6 Standard Deviation NA 95% Confidence Level NA Total Equivalent Water Water Electric Water Years Water Temperature Electricity Used Gal/(50*365) Used Difference Used Output Input Efficiency Unit (Gallons) (Years) (Gallons) (F) kwh (Btu) (Btu) Low flow 3 Low flow 4 Low flow 5 Low flow 1.16 Average 99.8 Standard Deviation NA 95% Confidence Level NA Final Report 136
151 Total Equivalent Water Water Electric Water Years Water Temperature Electricity Used Gal/(50*365) Used Difference Used Output Input Efficiency Unit (Gallons) (Years) (Gallons) (F) kwh (Btu) (Btu) Low flow 3 Low flow 4 Low flow 5 Low flow 1.22 Average 99.1 Standard Deviation NA 95% Confidence Level NA Final Report 137
152 This page intentionally left blank. Final Report 138
153 Appendix I Photos of Heat Exchangers of Instantaneous Water Heaters After 90 Days Using Softened Water Final Report 139
154 This page intentionally left blank. Final Report 140

155 Final Report 141

156 Final Report 142

157 Final Report 143

158 Final Report 144
159 Appendix J Photos of Heat Exchangers of Instantaneous Water Heaters After 90 Days Using Unsoftened Water Final Report 145
160 This page intentionally left blank. Final Report 146

161 Final Report 147

162 Final Report 148

163 Final Report 149

164 Final Report 150

165 Final Report 151
166 This page intentionally left blank. Final Report 152
167 Appendix K Photos of Gas Storage Water Heaters After 90 Days Using Softened Water Final Report 153
168 This page intentionally left blank. Final Report 154

169 Final Report 155

170 Final Report 156

171 Final Report 157

172 Final Report 158
173 This page intentionally left blank. Final Report 159
174 Appendix L Photos of Gas Storage Water Heaters After 90 Days Using Unsoftened Water Final Report 160
175 This page intentionally left blank. Final Report 161

176 Final Report 162

177 Final Report 163

178 Final Report 164

179 Final Report 165

180 Final Report 166
181 This page intentionally left blank. Final Report 167
182 Appendix M Photos of Electric Storage Water Heaters After 90 Days Using Softened Water Final Report 168
183 This page intentionally left blank. Final Report 169

184 Final Report 170

185 Final Report 171

186 Final Report 172

187 Final Report 173
188 This page intentionally left blank. Final Report 174
189 Appendix N Photos of Electric Storage Water Heaters After 90 Days Using Unsoftened Water Final Report 175
190 This page intentionally left blank. Final Report 176

191 Final Report 177

192 Final Report 178

193 Final Report 179

194 Final Report 180

195 Final Report 181
196 Final Report 182
197 Appendix O Culligan Analysis of Softened Well Water Final Report 183
198 Final Report 184
199 Final Report 185
200 Final Report 186
201 Final Report 187
202 Final Report 188
203 Appendix P Culligan Analysis of Unsoftened Well Water Final Report 189
204 This page intentionally left blank. Final Report 190
205 Final Report 191
206 Final Report 192
207 Final Report 193
208 Final Report 194
209 This page intentionally left blank. Final Report 195
210 Appendix Q Culligan Analysis of Hard Water Scale Taken From Piping at Outlet of Instantaneous Water Heater Operating With Water of 26.2 Grains Per Gallon Hardness Final Report 196
211 Final Report 197
212 This page intentionally left blank. Final Report 198
213 SCALE ANALYSIS DATE:11/12/09 DEALER ADDRESS: Culligan International 9399 W. Higgins Rd. Rosemont, IL ANALYSIS #:5693 DEALER FILE #:90005 Reif CONTROL NO: CONSUMER: Battelle SAMPLE TAKEN: DATE RECEIVED: CHARACTERISTICS: MATRIX:Solid COLOR:Red SIZE: Small DENSITY:Sinks in Water TEXTURE: Grainy/Smooth ANALYTICAL RESULTS: The sample is a solid in water. The sample was dried overnight in an oven at 105 degrees C, then ground into a powder using a mortar and pestle. The sample is partly soluble in nitric acid, sulfuric acid and hydrochloric acid. Analysis of anions via wet chemistry techniques detected the presence of the following species; Carbonate Analysis of cations via ICP detected the following elements in order of decreasing concentration; Calcium, Iron, Magnesium, Copper, Manganese Final Report 199
214 Table 1: Percent Compositions of Selected Cations. Cation ppm % Composition Table 2: Wet Chemistry Analysis Results. Species Test Results Tested For: Ca CO Fe OH - - Mg S 2- - Cu Cl Mn SO 4 Orthophosphate - Organics - Soluble - Silicates Insoluble - Silicates + Test indicates presence of species. - Test indicates absence of species. Final Report 200
215 SCALE ANALYSIS DATE:11/12/09 DEALER ADDRESS: Culligan International 9399 W. Higgins Rd. Rosemont, IL ANALYSIS #:5693 DEALER FILE #:90005 Reif CONTROL NO: CONSUMER: Battelle SAMPLE TAKEN: DATE RECEIVED: CHARACTERISTICS: MATRIX:Solid COLOR:Red SIZE: Small DENSITY:Sinks in Water TEXTURE: Grainy/Smooth ANALYTICAL RESULTS: The sample is a solid in water. The sample was dried overnight in an oven at 105 degrees C, then ground into a powder using a mortar and pestle. The sample is partly soluble in nitric acid, sulfuric acid and hydrochloric acid. Analysis of anions via wet chemistry techniques detected the presence of the following species; Carbonate Analysis of cations via ICP detected the following elements in order of decreasing concentration; Calcium, Iron, Magnesium, Copper, Manganese Final Report 201
216 Final Report 202
217 This page intentionally left blank. Final Report 203
218 Appendix R Pictures of Low Flow Showerheads Using Unsoftened Well Water and Softened Well Water 204
219 205
220 This page intentionally left blank. 206


221 207


222 208


223 209

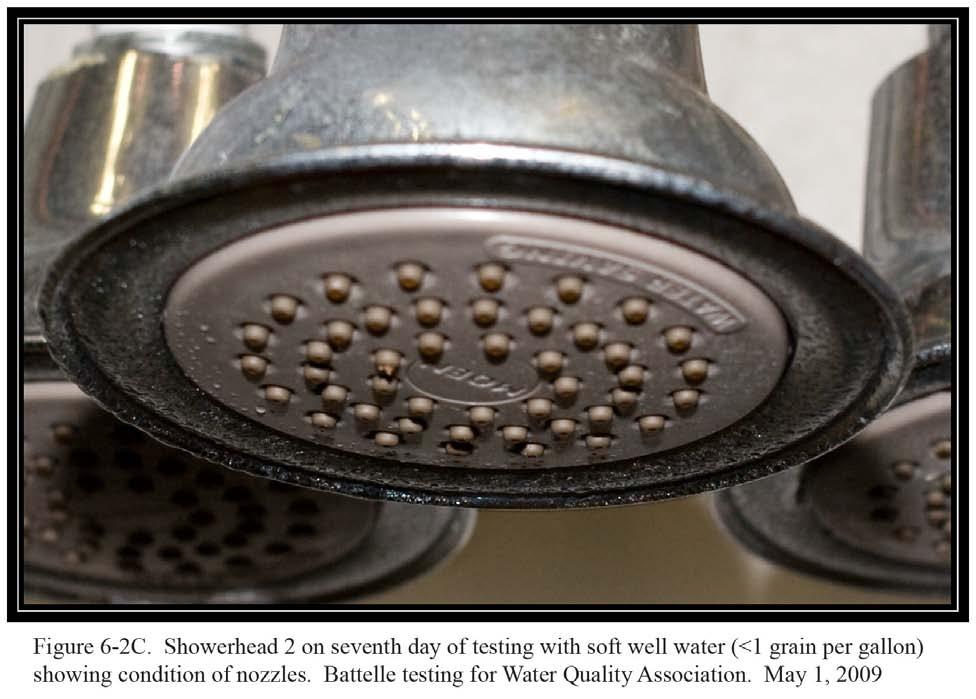
224 210

225 211


226 212


227 213
228 214


229 215

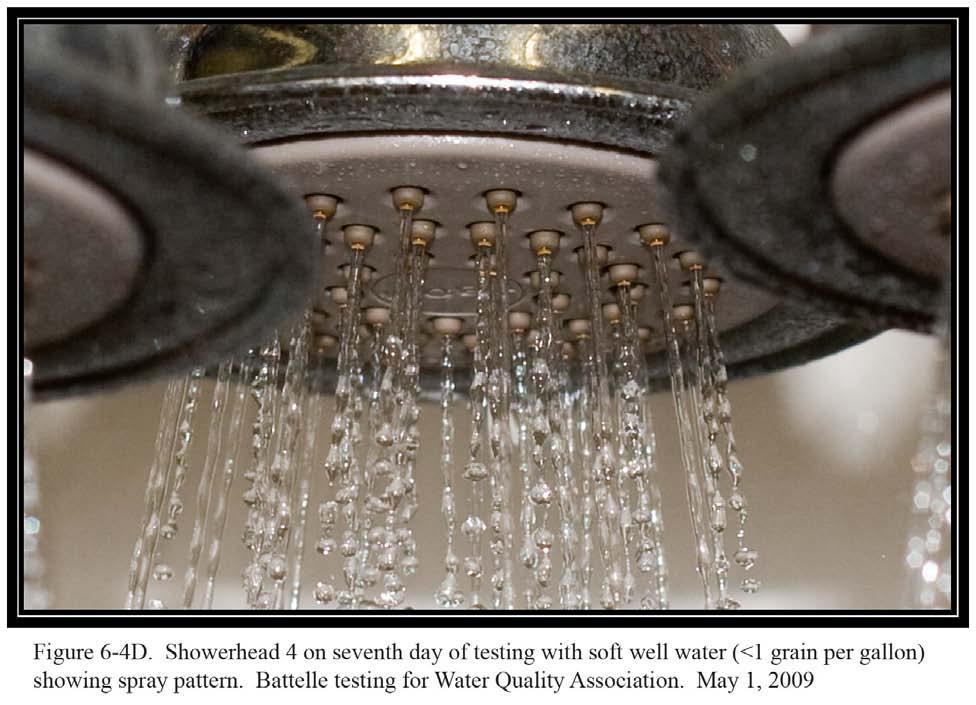
230 216

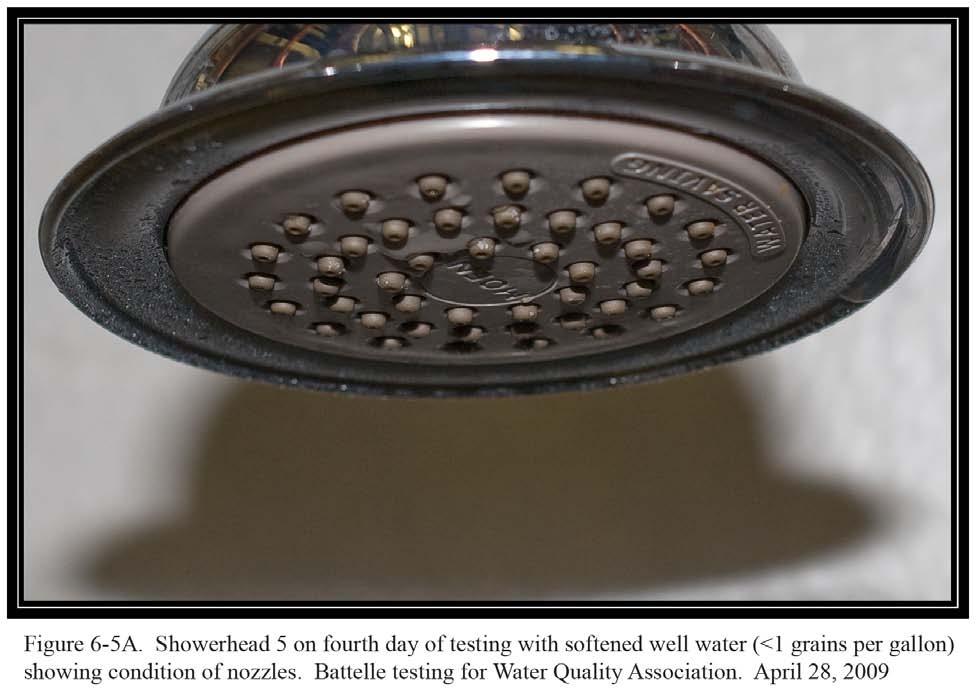
231 217


232 218

233 219


234 220


235 221
236 222


237 223

238 224
239 225


240 226

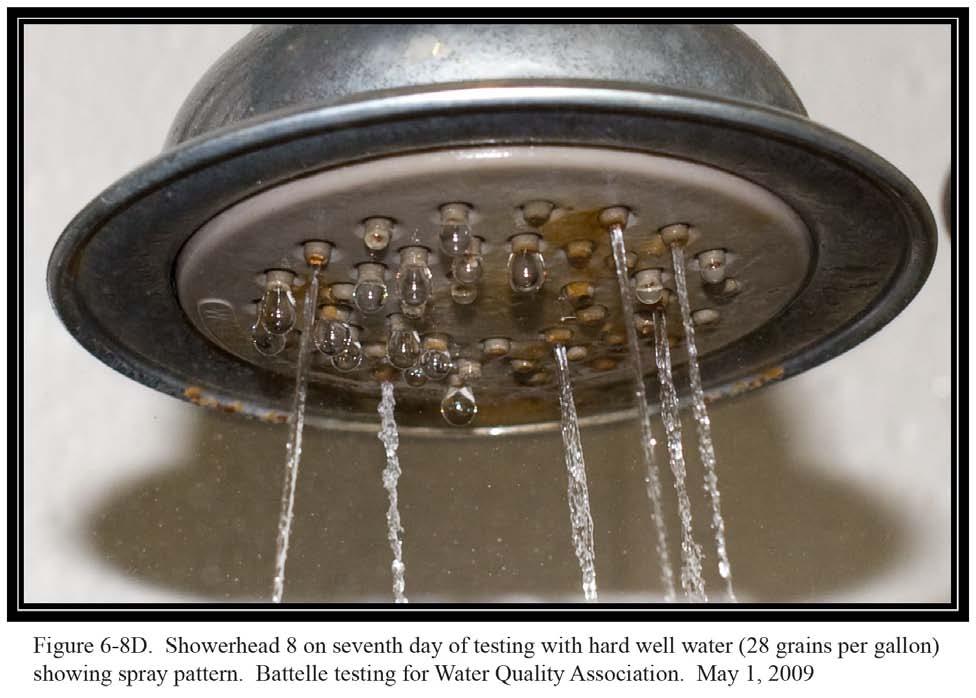
241 227
242 228


243 229

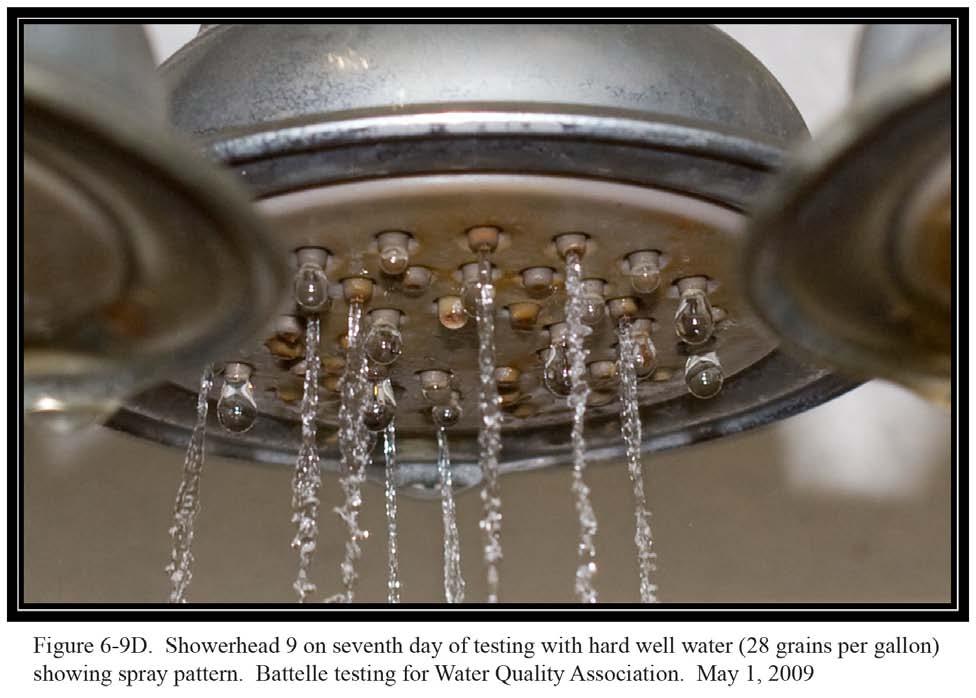
244 230
245 231


246 232

247 233
Softened Water Benefits Study: Energy Savings Detergent Savings. Independent studies demonstrate the link. Executive Summaries
 Executive Summaries Softened Water Benefits Study: Energy Savings Detergent Savings Independent studies demonstrate the link /MarketTheResearch/ Introduction The Energy Savings Study (aka The Battelle
TESTS OF ADSIL COATING
 TESTS OF ADSIL COATING Test B - Long Term Test FSEC-CR-1259-01 July 11, 2001 Prepared for: Bob Suggs Florida Power & Light Company 9250 W. Flagler Street Miami, Florida 33174 Principal Investigator Dr.
123FILTER ELECTRONIC WATER CONDITIONER MODEL: ED2000
 123FILTER ELECTRONIC WATER CONDITIONER MODEL: ED2000 The revolutionary environmental technology that conditions hard water and reduces scale build-up. It is chemical free thus environmental friendly. It
ARTESIAN 220 & 340 Instantaneous Indirect Water Heater By Dunkirk Boilers INSTALLATION AND OPERATING INSTRUCTIONS ENGINEERING MANUAL
 ARTESIAN 220 & 340 Instantaneous Indirect Water Heater By Dunkirk Boilers INSTALLATION AND OPERATING INSTRUCTIONS ENGINEERING MANUAL Manufacturer's Warning To reduce the possibility of injury due to scalding,
Fusion XT. Water Softener Savings Chart EXSTREAM SERIES WATER TREATMENT $50.00 $ % $15.00 $ $86.00 $1, % $68.80 $825.
 Water Softener Savings Chart Monthly Cost* Annual Cost* % SAVED Monthly Savings Annual Savings Plumbing and Appliances Replacement and repairs. $10.00 $120.00 75% $7.50 $90.00 Cooking and Coffee Tea, Sugar
Novel Press Fabric Cleaning Method Increases Productivity in a Sustainable Manner
 Novel Press Fabric Cleaning Method Increases Productivity in a Sustainable Manner Dave Kelso Senior Account Manager DuBois Chemical (david.kelso@duboischemicals.com) John Schwamberger Paper Chemicals Division
EXCALIBUR SOFT-TEC - PRETREATMENT CHEMICAL REMOVAL SYSTEM AND WATER CONDITIONER SCALE CONTROL SYSTEMS
 EXCALIBUR SOFT-TEC - PRETREATMENT CHEMICAL REMOVAL SYSTEM AND WATER CONDITIONER SCALE CONTROL SYSTEMS SOFT-TEC RESIDENTIAL WATER CONDITIONER PROCESS The Soft-Tec scale control system s reliability transforms
Residential Application
 Residential Application Technical Data Sheet Matrix Polyacryl Network Appearance Small light yellow/beige balls Surface Ceramic Template Surface Moisture Content 24 to 28% Density 1,18 to 1,22 Weight 650g/L
GUIDELINES FOR SIZING WATER HEATERS California Conference of Directors of Environmental Health September, 1995
 GUIDELINES FOR SIZING WATER HEATERS California Conference of Directors of Environmental Health September, 1995 I. BACKGROUND A critical factor in preventing foodborne illnesses in a food facility is the
Sizing water heaters to provide sufficient hot water efficiently LEARN THREE METHODS YOU SHOULD BE USING TO DESIGN EFFICIENT SYSTEMS
 LEARN THREE METHODS YOU SHOULD BE USING TO DESIGN EFFICIENT SYSTEMS BY DAVID E. DEBORD, CPD, LEED AP Sizing water heaters to provide sufficient hot water efficiently requires the designer to consider many
Plumbline 1000 Series Timered Softeners Owners Manual Water Softener Models
 Plumbline 1000 Series Timered Softeners Owners Manual Water Softener Models PS1000T PS1500T Table of Contents How to Use Soft Water 3 Product Line Overview 5 System Operation 6 System Maintenance and Install
Brine Generation Study
 DOE/WIPP 00-2000 Brine Generation Study April 2000 Waste Isolation Pilot Plant Carlsbad, New Mexico Processing and final preparation of this report was performed by the Waste Isolation Pilot Plant Management
WATER WISE SURV EY. Santa Barbara City College
 WATER WISE SURV EY FI N AL REPORT Santa Barbara City College August 21, 2013 Prepared By City of Santa Barbara Water Conservation Program WATER WISE SURVEY OF SANTA BARBARA CITY COLLEGE EXECUTIVE SUMMARY
Hot Food Holding Cabinets Test for FWE HLC
 Design & Engineering Services Hot Food Holding Cabinets Test for Report Prepared by: Design & Engineering Services Customer Service Business Unit Southern California Edison January 4, 2011 Acknowledgements
Computing Services Center
 Continuous Commissioning Report for the Computing Services Center Building #516 Submitted to: Utilities Energy Office Physical Plant Department Texas A&M University Prepared by: Energy Systems Laboratory
Final Report Polymer Bead Laundry
 Final Report Polymer Bead Laundry Prepared for: Prepared by: Sothern California Gas Western Cooling Efficiency Center April 2015 i ABSTRACT According to manufacturers estimates, commercial laundries use
Southern California Gas Company Customer Programs Department
 Appliance Test Report SCGAT140220A Revision 0 Issued Date: March 2014 Duke 613Q-G1V Gas Convection Oven Performance Test Per ASTM F1496-13 Southern California Gas Company Customer Programs Department Food
Plumbline 2000 Series Metered Softeners Owners Manual Water Softener Models
 Plumbline 2000 Series Metered Softeners Owners Manual Water Softener Models PS2000M PS2500M PS2700M PS2900M Table of Contents How to Use Soft Water 3 Product Line Overview 5 System Operation 6 System Maintenance
TEMPLATE ASSISTED CRYSTALLIZATION. Presented By Ryan Lessing 11/13/2014
 TEMPLATE ASSISTED CRYSTALLIZATION Presented By Ryan Lessing 11/13/2014 Different Forms of Hardness in Water Calcium and Magnesium Bicarbonate- This is what is referred to as temporary hardness. Once it
Residential Water Conservation Research Brief On-Demand Hot Water Systems
 Overview Water heating is the second highest consumption of energy in the residential sector, accounting for 17 percent of consumed energy for the average Canadian household. Each year, residents allow
Effect Of Setup Thermostat Schedule On Heat Pump Water Heater Energy Consumption, Coefficient Of Performance And Peak Load
 Effect Of Setup Thermostat Schedule On Heat Pump Water Heater Energy Consumption, Coefficient Of Performance And Peak Load Philip Boudreaux, Roderick Jackson, Jeffrey Munk and Anthony Gehl, Oak Ridge National
Demonstration of 2nd Generation Ducted GE "Brillion" Hybrid Water Heater in the PNNL Lab Homes
 Demonstration of 2nd Generation Ducted GE "Brillion" Hybrid Water Heater in the PNNL Lab Homes 2013 ACEEE Hot Water Forum Sarah Widder Research Engineer Pacific Northwest National Laboratory Project Participants
A Feasibility Study of Replacing Manual Dishwashing with a Mechanical Dishwasher at Taco Bell
 A Feasibility Study of Replacing Manual Dishwashing with a Mechanical Dishwasher at Taco Bell Prepared for: John *****, Owner Taco Bell #4788 and Paul Kellermann, Professor English 202C By: Andrew *****
Shop Online Eccotemp.com/products. Store Locator Eccotemp.com/locator. Product Support support.eccotemp.com.
 L5 20 minute automatic safety shutoff timer Battery igniter - no electricity needed Minimum flow rate is approximately 0.4 gallons per minute Up to 18 hours of use on a 20 lb. tank Shower head with On/Off
CONVECTION OVENS FOR FOOD SERVICE APPLICATIONS BLODGETT SHO-E
 Design & Engineering Services CONVECTION OVENS FOR FOOD SERVICE APPLICATIONS BLODGETT SHO-E Report ` Prepared by: Design & Engineering Services Customer Service Business Unit Southern California Edison
Installation, Operation and Maintenance Manual
 Installation, Operation and Maintenance Manual ScaleStop Residential Systems Chemical Free, Salt Free Scale Prevention NSS-744R NSS-844R NSS-948R NSS-1054R NSS-1252R next filtration technologies inc. P.O.
Hot Water Distribution System Losses in a Net-Zero Home
 Hot Water Distribution System Losses in a Net-Zero Home March 22, 2018 ACEEE Hot Water Forum William Healy Tania Ullah National Institute of Standards and Technology Overview of Presentation Purpose: To
Challenges and Methods of Estimating a Conceptual HVAC Design
 Challenges and Methods of Estimating a Conceptual HVAC Design ABSTRACT In any conceptual HVAC design, estimators are faced with the challenge of trying to capture all of the pieces that complete a system.
Basic Equations and Conversion Factors
 Basic Equations and Conversion Factors CYLINDER VOLUME Volume, cubic feet = π (Cylinder Diameter) x (Cylinder Diameter) x (Cylinder Depth) 4 Cylinder Diameter and Cylinder Depth are both expressed in inches.
Installation, Operation and Maintenance Manual
 Installation, Operation and Maintenance Manual ScaleStop Residential Systems Chemical Free, Salt Free Scale Prevention NSS-744R NSS-844R NSS-948R NSS-1054R NSS-1252R 6586 Hypoluxo Road, Suite 362 Lake
J120 STEAM BOOSTER INSTALLATION, OPERATION, AND SERVICE MANUAL J120 STEAM BOOSTER. J120 Steam Booster Manual D
 INSTALLATION, OPERATION, AND SERVICE MANUAL J120 STEAM BOOSTER J120 STEAM BOOSTER J120 Steam Booster Manual REVISION HISTORY Revision Letter Revision Date Made by Applicable ECNs Details A 10-27-04 CBW
BC Hydro Energy Star Appliances
 Impact Report BC Hydro Energy Star Appliances Prepared for: BC Hydro Power Smart Evaluation Prepared by: Table of Contents Table of Contents 1. INTRODUCTION... 1 1.1 BACKGROUND... 1 1.2 ENERGY STAR OVERVIEW...
BNWAT28: Water consumption in new and existing homes
 BNWAT28: Water in new and existing homes Version 1.0 This Briefing Note and referenced information is a public consultation document and will be used to inform Government decisions. The information and
To us it, s more than just water. Made right here for Australian conditions. water softeners
 To us it, s more than just water. Made right here for Australian conditions. water softeners What s your water made of? Almost all of our water contains minerals - sodium, potassium, calcium and magnesium
Basic Equations and Conversion Factors
 Basic Equations and Conversion Factors CYLINDER VOLUME Volume, cubic feet = π (Cylinder Diameter) x (Cylinder Diameter) x (Cylinder Depth) 4 Cylinder Diameter and Cylinder Depth are both expressed in inches.
InterNACHI Home Energy Inspection for th Street
 InterNACHI Home Energy Inspection for 1750 30th Street Estimated Yearly Energy Costs: $1,491 per year Dear Client, This house has been scored on a scale of 1 to 100. A 100 would represent a home with perfect
Hot Water System Performance Testing at PG&E s Applied Technology Services: Mimicking a Full-Service Restaurant in the Laboratory
 Hot Water System Performance Testing at PG&E s Applied Technology Services: Mimicking a Full-Service Restaurant in the Laboratory Amin Delagah Project Engineer Fisher Nickel, a division of Frontier Energy
Impacts of an Energy Star Promotion
 Impacts of an Energy Star Promotion Jack Habart and Joe Kelly, Habart and Associates Consulting Inc. Iris Sulyma and Ken Tiedemann, BC Hydro ABSTRACT BC Hydro s Power Smart group has been encouraging the
Multifamily Buildings: Real World Monitored Data on Hot Water Energy and Water Use
 Multifamily Buildings: Real World Monitored Data on Hot Water Energy and Water Use BuildingEnergy Boston Conference March 8, 2017 Presented by: Andrew Proulx, P.E., LEED AP Neil Donnelly, E.I.T. New Ecology,
Emerging Technology Program
 Emerging Technology Program 1022: Home Energy Management System Utilizing a Smart Thermostat Final Public Project Report Executive Summary May 4, 2015 Technical Contacts Steve Spentzas Principal Engineer
Food Service Technology Center
 Food Service Technology Center IR Energy Habanero HAB-M50 Gas Patio Heater Test Report Application of ASTM Standard Test Method FF2644-07 September 2014 Prepared by: Elan Frantz Trey Young Fisher-Nickel,
PROVIDES TEPID WATER FOR EMERGENCY SHOWER
 PROVIDES TEPID WATER FOR EMERGENCY SHOWER Model EMV FEATURES Heavy Duty Construction Hydrastone cement lining provides tank longevity Copper-silicon alloy tappings cannot rust or corrode High impact composite
Why do I need a water softener?
 Why do I need a water softener? Is something wrong with my water? Dust, particles, smog Air pollution Rain Evaporation Rain Evaporation Most water contains more than water. Almost all of the water found
More resources
 More resources http://waterheatertimer.org/9-ways-to-save-with-water-heater.html http://waterheatertimer.org/figure-volts-amps-watts-for-water-heater.html http://waterheatertimer.org/pdf/fundamentals-of-water-heating.pdf
Potential Outdoor Water Savings of Los Angeles Abstract Introduction
 Potential Outdoor Water Savings of Los Angeles Tsukiko Jerger, Nicole Puma, Andrew Tom, Nargis Walai Section A02 Abstract In Southern California, water is in short supply and in high demand. This is sharply
Nest Learning Thermostat Summer 2012 Savings
 WHITE PAPER Nest Learning Thermostat Summer 2012 Savings Nest Labs, Inc. October 2012! 1 1. Introduction The summer of 2012 was the first cooling season that Nest was available to customers. We wanted
Three Rivers Park District Administration Center Rain Garden
 Three Rivers Park District Administration Center Rain Garden Introduction There are significant changes to the hydrologic regime and nutrient loading following urban and industrial development. The post-development
VARIABLE REFRIGERANT FLOW FOR LODGING
 Design & Engineering Services VARIABLE REFRIGERANT FLOW FOR LODGING APPLICATIONS Report Prepared by: Design & Engineering Services Customer Service Business Unit Southern California Edison June 2012 Acknowledgements
AC40 & AC40BAutomatic Water Softener Operation and Recharging
 Hard water is any water that contains minerals such as calcium, magnesium and iron. Approximately 3/4 of the United States has water that is considered hard. When heated, the minerals in hard water come
ELECTRIC WATER HEATERS
 ELECTRIC WATER HEATERS SAVE MONEY AND ENERGY WITH AN ELECTRIC WATER HEATER Whether you re replacing a furnace or water heater, choosing new appliances, or building a new home, how well you use energy has
Installation, Operation and Maintenance Manual. Model: SSC ScaleSolver Systems. Chemical Free, Salt Free, Scale Prevention
 Installation, Operation and Maintenance Manual Systems Chemical Free, Salt Free, Scale Prevention Model: 1 523 South Fair Oaks Pasadena, CA 91105 (800) 334-5009 LifeSourceWater.com 2013 LifeSource Water
Watch Water USA Green Chemical Technology
 Filtersorb SP3 Installtion, Operation and Maintenance Manual Introduction The Filtersorb SP3 system provides protection from scale formation throughout the plumbing system. The Filtersorb SP3 system can
Saying Mahalo to Solar Savings: A Billing Analysis of Solar Water Heaters in Hawaii
 Saying Mahalo to Solar Savings: A Billing Analysis of Solar Water Heaters in Hawaii Jenny Yaillen, Evergreen Economics Chris Ann Dickerson, CAD Consulting Wendy Takanish and John Cole, Hawaii Public Utilities
Chanson Water USA, INC. Installation Guide for SCF-3000/SCF-6000
 Chanson Water USA, INC. Installation Guide for SCF-3000/SCF-6000 Water Dove Systems will not be ready for full use for 48-72 hours after install. Please plan you installation accordingly. Product Spec
CEE:3371 Principles of Hydraulics and Hydrology Project #2 Flow Measurement with a Weir
 CEE:3371 Principles of Hydraulics and Hydrology Project #2 Flow Measurement with a Weir Problem Statement The Iowa DNR plans to monitor a proposed prairie restoration project in eastern Iowa as an experiment.
Reducing the Carbon Footprint of Existing Domestic Heating: A Non-Disruptive Approach
 EEDAL 2009 16-18 June 2009 Reducing the Footprint of Existing Domestic Heating: A Non-Disruptive Approach Martin O Hara Danfoss Randall Limited Abstract There is insufficient time between today and 2020
Incorporating Aluminum Honeycomb to Increase Efficiency of U-tube Removable Heat Exchanger
 Incorporating Aluminum Honeycomb to Increase Efficiency of U-tube Removable Heat Exchanger Daniel Soto 1 and Daniel Corona 2 California Polytechnic State University, San Luis Obispo, San Luis Obispo, California,
Lesson 25 Analysis Of Complete Vapour Compression Refrigeration Systems
 Lesson 25 Analysis Of Complete Vapour Compression Refrigeration Systems Version 1 ME, IIT Kharagpur 1 The specific objectives of this lecture are to: 1. Importance of complete vapour compression refrigeration
High Capacity Instantaneous Steam Fired Water Heater
 MODEL F High Capacity Instantaneous Steam Fired Water Heater Features Compact High Capacity Design Packaged System Water heater is factory assembled on an all welded steel mounting frame to save time and
Introducing Culligan Twin HE. The smartest way to fix hard water problems.
 High Efficiency appliances: smart High Efficiency water softener: pure genius Introducing Culligan Twin HE. The smartest way to fix hard water problems. Be smart. Choose the softener that uses For high-efficiency
Calculated Energy Savings for Disabling Anti- Sweat Door Heat on Glass Display Case Doors
 Calculated Energy Savings for Disabling Anti- Sweat Door Heat on Glass Display Case Doors ET Project Number: Product Manager: Sachin Andhare Pacific Gas and Electric Company` Prepared By: Danielle Geers
All Types - Automatic, semi-automatic and manual. All Types - Horizontal (front loaders) and Vertical Plane (top loader)
 and Vertical Plane (top loader)") Other variables Technology Mapping Document Country: USA Technology: Sub Category: Domestic top and front loaders Introduction The first stage in the Mapping and Benchmarking process is the definition
Other variables Technology Mapping Document Country: USA Technology: Sub Category: Domestic top and front loaders Introduction The first stage in the Mapping and Benchmarking process is the definition
APPENDIX A. A 3.2 Determine the elevation of the highest. A 3.3 Subtract the sum of loss in static pressure
 APPENDIX A RECOMMENDED RULES FOR SIZING THE WATER SUPPLY SYSTEM Because of the variable conditions encountered, it is impractical to lay down definite detailed rules of procedure for determining the sizes
Why do I need a water softener?
 Why do I need a water softener? Is something wrong with my water? Dust, particles, smog Air pollution Rain Evaporation Rain Evaporation Most water contains more than water. Almost all of the water found
Streamlined Life Cycle Assessment of a Coffee Machine. Gearoid Ryan
 Streamlined Life Cycle Assessment of a Coffee Machine Gearoid Ryan 10122613 Contents Coffee Machine Streamlined Life Cycle Assessment Introduction... 3 Overview... 3 Baseline CED Assessment study... 3
Evacuated Tube Solar Hot Water Systems Are Not Energy Efficient or Cost Effective for Domestic Hot Water Heating in the Northeastern U.S.
 Evacuated Tube Solar Hot Water Systems Are Not Energy Efficient or Cost Effective for Domestic Hot Water Heating in the Northeastern U.S. Climate Carl N. McDaniel¹ and David N. Borton² ¹Environmental Studies
Distribution Restriction Statement
 DEPARTMENT OF THE ARMY U.S. Army Corps of Engineers CEMP-ET Washington, DC 20314-1000 ETL 1110-3-489 Technical Letter No. 1110-3-489 3 April 1998 Engineering and Design DOMESTIC WATER HEATERS FOR BARRACKS
NYC STEM Summer Institute: Climate To Go! Infrared detection of carbon dioxide
 NYC STEM Summer Institute: Climate To Go! Infrared detection of carbon dioxide Standards NGSS PS3A: Definitions of Energy NGSS PS4B: Electromagnetic Radiation NGSS ESS2D: Weather and Climate NGSS ESS3D:
Tepid Water Delivery System
 Provides Tepid Water For Emergency Fixtures Features Heavy Duty Construction Hydrastone cement lining provides tank longevity Copper-silicon alloy tappings cannot rust or corrode High impact composite
SPOTLIGHT ON WATER CONSERVATION
 SPOTLIGHT ON WATER CONSERVATION Water Conservation in the Home The average water use for an American family exceeds 300 gallons per day, with about 70% of that for indoor use. Outdoor use averages about
REGION OF DURHAM EFFICIENT COMMUNITY FINAL REPORT. MAY 2008 Veritec Consulting Inc. Mississauga, Ontario
 REGION OF DURHAM EFFICIENT COMMUNITY FINAL REPORT MAY 2008 Veritec Consulting Inc. Mississauga, Ontario Contact Information Region of Durham Glen Pleasance, Water Efficiency Coordinator Durham Region 905-668-7721
Reduced Order WECC Modeling for Frequency Response and Energy Storage Integration
 Reduced Order WECC Modeling for Frequency Response and Energy Storage Integration Pranathi Bhattacharji, Student Member, IEEE, Ted K. A. Brekken, Senior Member, IEEE School of Electrical Engineering and
With CRYSTALGUARD. post filter technology
 - the permanent solution to scale-related problems. With CRYSTALGUARD post filter technology MW0119SXP Targets existing scale Increases water flow rates Prevents new hard scale forming Whole house protection
This product was manufactured in an ISO 9001:2000 certified facility.
 This product was manufactured in an ISO 9001:2000 certified facility. RainSoft Division of Aquion Water Treatment Products, LLC 2080 East Lunt Avenue Elk Grove Village, Illinois 60007 Main Switchboard:
HOW IT RELATES TO PERFORMANCE IN REFRIGERATED COMPRESSED AIR DRYERS
 ENERGY CONSUMPTION HOW IT RELATES TO PERFORMANCE IN REFRIGERATED COMPRESSED AIR DRYERS Introduction Those in charge of specifying and purchasing equipment for industrial compressed air systems have many
MONARCH SCALEOUT MONARCH WATER
 MONARCH SCALEOUT MONARCH WATER ALTERNATIVE LIMESCALE PREVENTION WITH SOFT WATER BENEFITS With no salt, electricity or regeneration for the effective prevention of limescale 03/13SO MODEL SCALEOUT WATER
What cannot be cleaned in a stencil cleaner? Prepared by Steve Stach
 What cannot be cleaned in a stencil cleaner? Prepared by Steve Stach The stencil cleaner can be one of the most versatile tools on the manufacturing floor. It can be used to clean electronic modules in
The InSinkErator City of Philadelphia. How Food Waste Disposers Can Benefit Municipalities
 The InSinkErator City of Philadelphia P R O J E C T How Food Waste Disposers Can Benefit Municipalities BACKGROUND The InSinkErator City of Philadelphia P R O J E C T How Food Waste Disposers Can Benefit
Rotary Impingement Tank Cleaning Equals Significant Water and Cost Savings
 Rotary Impingement Tank Cleaning Equals Significant Water and Cost Savings Specific information and case studies on the benefits of rotary impingement and cleanin-place (CIP) optimization vs. the standard
Conceptual Design of a Better Heat Pump Compressor for Northern Climates
 Purdue University Purdue e-pubs International Compressor Engineering Conference School of Mechanical Engineering 1976 Conceptual Design of a Better Heat Pump Compressor for Northern Climates D. Squarer
TANKLESS PRODUCT GUIDE CANADA TANKLESS PRODUCT GUIDE. A. O. Smith
 TANKLESS PRODUCT GUIDE CANADA TANKLESS PRODUCT GUIDE A. O. Smith www.hotwater.com A. O. Smith Tankless Advantage ENDLESS HOT WATER * Heating water only as it s being used means you will never run out of
The Revised Method of Test for Residential Water Heating and Its Impact on Incentive Programs
 The Revised Method of Test for Residential Water Heating and Its Impact on Incentive Programs Paul Glanville ACEEE Hot Water Forum Tuesday, February 24 th, 2015 Nashville, TN Overview >How Water Heaters
Scale Stopper Plus Installation & Start-Up Guide
 Clean Water Made Easy www.cleanwaterstore.com Scale Stopper Plus Installation & Start-Up Guide Thank you for purchasing a Clean Water System! With proper installation and a little routine maintenance your
Owners Guide ScaleSolver Residential System
 Owners Guide ScaleSolver Residential System Models SS-5544S - 1 SS-5544E - 1 1/4 www.lifesourcewater.com CA Lic. #787179 - NV Lic. #059578 Table of Contents Our Promise Lifesource Is A Company You Can
The PurePro. Family of Indirect Water Heaters. A smart choice for abundant, rapid hot water heating. pureproproducts.com
 The PurePro Family of Indirect Water Heaters A smart choice for abundant, rapid hot water heating pureproproducts.com PurePro Indirect Water Heaters: The best option for home hot water needs As overall
SMALL MOTOR CONTROLLERS
 Research PERFORMANCE ANALYSIS OF SMALL MOTOR CONTROLLERS October, 1994 Southern Company Services, Inc. Marketing Services Customer Technology Research Prepared by: Jeffrey A. Burleson, P.E. The Southern
Sizing Guide. For the Estimating of Flow Rates and Water Usage
 C O M M E R C I A L Sizing Guide For the Estimating of Flow Rates and Water Usage BIBLIOGRAPHY The majority of the contents within this publication have been extracted from the American Water Works Association
1850 Series TRIPLE TREAT Operation Manual
 1850 Series TRIPLE TREAT Operation Manual BRINE TANK RESIN TANK CARBON TANK System shown with optional tank jackets. Note: 1. Read all instructions carefully before operation. 2. Avoid pinched o-rings
Let s Go Back to the Future!
 Let s Go Back to the Future! Welcome to the 2 nd Hot Water Forum Larry Weingarten and Gary Klein The Water-Energy-Greenhouse Gas Connection A Birdseye View Near Raleigh and Durham, North Carolina December
It Won t Just Meet Your Hot Water Needs IT WILL EXCEED THEM. RH180 HYBRID TANK-TANKLESS WATER HEATER
 It Won t Just Meet Your Hot Water Needs IT WILL EXCEED THEM. RH180 HYBRID TANK-TANKLESS WATER HEATER More of what you want. When you want it. THE RINNAI RH180 HYBRID TANK-TANKLESS WATER HEATER DELIVERS.
TRANSMISSIVITY BEHAVIOR OF SHREDDED SCRAP TIRE DRAINAGE LAYER IN LANDFILL COVER SYSTEM *
 TRANSMISSIVITY BEHAVIOR OF SHREDDED SCRAP TIRE DRAINAGE LAYER IN LANDFILL COVER SYSTEM * Krishna R. Reddy, Aravind Marella and Prasanth Ala University of Illinois at Chicago, Department of Civil and Materials
Model NFF Iron, Manganese, Hydrogen Sulfide Reduction
 Super Filter Model NFF Iron, Manganese, Hydrogen Sulfide Reduction Operating and Maintenance Manual Page 1 of this manual contains operating conditions. 57055 9/07 Enjoy clean, stain-free laundry and dishes...
Application of Air Source Variable Refrigerant Flow in Cold Climates
 PREPARED BY Seventhwave with the assistance of Daikin North America, LLC Masters Building Solutions Application of Air Source Variable Refrigerant Flow in Cold Climates A White Paper March 2015 275-1
Armstrong Cool-Fog Systems
 Armstrong Cool-Fog Systems Armstrong International, Inc. is a leading supplier of hydropneumatic fogging systems used for both humidification and evaporative cooling. Its systems were first developed in
Thick-Film Heater achieves Superior Performance in Thermal Response, Uniformity and Efficiency.
 Thick-Film Heater achieves Superior Performance in Thermal Response, Uniformity and Efficiency. by Mary Ruggiero, P.Eng., PhD and John Stockton, P.Eng Abstract IntegrAL thick-film heaters by Datec Corporation
RenewableEnergy. A Guide to Prepare for a Grain Dryer Energy Audit. Introduction. Fueling and Feeding America Through Renewable Resources
 RE-11-W RenewableEnergy A Guide to Prepare for a Grain Dryer Energy Audit Klein E. Ileleji, Chad Martin, and Gabriel De Melo Lima Miranda Department of Agricultural and Biological Engineering, Purdue University
C-NRPP Quality Assurance Guidance for Radon Test Devices
 C-NRPP Quality Assurance Guidance for Radon Test Devices Table of Contents: 1. Purpose 2. Definitions 3. Quality Assurance Plan 4. Calibration 5. Spikes/Performance Tests 6. Duplicates 7. Blanks 8. Cross-Checks
Installation, Operation and Maintenance Manual
 Installation, Operation and Maintenance Manual H2Flow Anti-Scale System Chemical-Free, Salt-Free Scale Prevention Model CH2F-10 Model CH2F-12 Model CH2F-16 Model CH2F-20 Model CH2F-30 Introduction The
ANNEX 6. Refinery No. 1 New Area. Problems Existing in the Current Condensate Return System of the New Area of Refinery No.1
 ANNEX 6 In FP the project was divided in two phases, but due to financial difficulties, Phase II is still not implemented. Below is what happened in Phase I of the Project, which will be replicated in
WHITE PAPER. ANSI/AHRI Standard for Fan and Coil Evaporators - Benefits and Costs
 Abstract Fan and coil evaporators as used in the industrial refrigeration industry can be certified for performance per ANSI/AHRI Standard 420-2008, Performance Rating of Forced-Circulation Free-Delivery