REGION OF DURHAM EFFICIENT COMMUNITY FINAL REPORT. MAY 2008 Veritec Consulting Inc. Mississauga, Ontario
|
|
|
- Josephine Hancock
- 5 years ago
- Views:
Transcription


1 REGION OF DURHAM EFFICIENT COMMUNITY FINAL REPORT MAY 2008 Veritec Consulting Inc. Mississauga, Ontario
2 Contact Information Region of Durham Glen Pleasance, Water Efficiency Coordinator Durham Region x5391 Veritec Consulting Inc. Bill Gauley, P.Eng., Principal x102
3 TABLE OF CONTENTS 1.0 INTRODUCTION RESEARCH METHODOLOGY DATA ANALYSIS Overall Water Consumption Non Sub metered Households: Sub metered Households: Indoor vs. Outdoor Demands Water Heater Clothes Washer Cold Water Use Clothes Washer Hot Water Use Clothes Washer Total Water Use Clothes Washer Dishwasher: Toilets Water Savings Summary ENERGY DEMANDS Energy Demand; Non-Sub-Metered Homes Energy Consumption Sub-Metered Homes Clothes Washer Energy Demand Clothes Dryer Energy Demand Stove Energy Demand Dishwasher Energy Demand Fridge Energy Demand Actual vs. Projected Savings NATURAL GAS GREENHOUSE GAS SAVINGS COST-EFFECTIVENESS CONCLUSION Appendix A Upgraded Fixtures and Appliances Appendix B Photos of Typical Control and Study Homes
4 LIST OF TABLES Table 1 Average Daily Water Demands Non-Sub-Metered Homes 4 Table 2a Average Indoor Demands Non-Sub-Metered Homes 4 Table 2b Average Outdoor Demands Non-Sub-Metered Homes 4 Table 3 Average Daily Water Demands, Sub-Metered Homes 5 Table 4a Average Indoor Demands Sub-Metered Homes 5 Table 4b Average Outdoor Demands Sub-Metered Homes 5 Table 5 Average Indoor & Outdoor Demands Litres per Day per Home 6 Table 6 Average Hot Water Demands Litres per Day per Home 7 Table 7 Clothes Washer Cold Water Litres per Day per Home 7 Table 8 Clothes Washer Hot Water - Litres per Day per Home 8 Table 9 Total Clothes Washer Water - Litres per Day per Home 8 Table 10 Dishwasher Water Demands - Litres per Day per Home 9 Table 11 Indoor Demands & Savings: Sub-metered homes - liters/day 12 Table 12 Average Energy Demands: Non-Sub-Metered Homes 13 Table 13 Average Energy Demands: Sub-Metered Homes 14 Table 14 Energy Demands: Clothes Washer: Sub-Metered Homes 14 Table 15 Clothes Dryer Energy Use: Sub-Metered Homes 15 Table 16 Stove Energy Use: Sub-Metered Homes 15 Table 17 - Dishwasher Energy Use: Sub-Metered Homes 16 Table 18 Fridge Energy Use: Sub-Metered Homes 16 Table 19 Energy demands & Savings: Sub-metered homes: kwh/home/day 17 Table 20 Energy Demands 17 Table 21 Natural gas demand (winter & summer months), m 3 /day 19 Table 22 Natural gas demand (summer months only), m3/day 19 Table 23 Average CO2 Reductions in Study Homes 20 Table 24 Daily and Annual Savings in Study Homes 21 Table 25 Annual Cost Savings in Study Homes 22
5 EXECUTIVE SUMMARY The Region of Durham, located immediately east of Toronto, is experiencing growing demands for water and energy related to the significant economic development and population growth in the Region. In an effort to manage this growth more efficiently, the Region, in conjunction with Tribute Communities 1, Natural Resources Canada (NRCan), and the Federation of Canadian Municipalities (FCM), completed a project to quantify the potential water, energy, gas, and CO 2 savings that could be achieved if home builders in the Region began including efficient fixtures, appliances, and landscape designs in their new home packages. A total of 175 homes participated in this study. Upgrades included efficient clothes washers, dishwashers, toilets, showerheads, fridges, and landscape packages. Approximately half of the homes received the upgraded package (Study Group), while the other half received the typical fixture and appliance package offered by the builder (Control Group). The main water, gas, and electricity meters for all 175 homes were read semimonthly for one year. Ten homes in each of the Study and Control Groups had sub meters and data loggers installed on fixtures and appliances to segregate electricity, water, and gas demands within the home. The average water, electricity, natural gas, and CO2 savings achieved by the Study homes in this research project were significant. Water Savings: 132 L/day per household (22.3%) Electricity Savings: 2.6 kwh/day per household (13%) Natural Gas Savings: 0.59 m3/day per household (9.1%) CO 2 reduction: 1.19 tonnes / year per household (10.7%) While savings directly related to the use of efficient fixtures and appliances was expected and achieved, a significant portion of the savings identified in this study was related to homeowners practicing efficient water and energy use habits. The annual utility cost savings for the Study homes is projected to be slightly more than $200 per year, and the payback period associated with providing the upgraded package was calculated as only 3.4 years. This study shows that it is both cost effective and environmentally responsible for new home builders to begin including only water efficient fixtures, appliances, and landscape packages in their new home designs the homeowner wins, the Region wins, and, perhaps more importantly, the environment wins. 1
6 1.0 INTRODUCTION The Region of Durham is experiencing the increasing demands for water and energy that are associated with significant economic development and population growth. Linked to this type of growth is a need for costly infrastructure expansion. The Region of Durham has recognized that improving the overall water and energy efficiency of their population will have three significant impacts: It will reduce or defer the need for capital expenditures related to infrastructure expansion, It will help maintain the Region s position as one of Canada s most proactive municipalities regarding water efficiency, and Perhaps most importantly, it will help reduce the Region s environmental footprint. In other words, improving efficiency within the Region is not only considered costeffective and a best management practice, it is also considered environmentally responsible. This research project was initiated by Durham Region in conjunction with Tribute Communities 2, Natural Resources Canada (NRCan), and the Federation of Canadian Municipalities (FCM), to assess the potential to improve efficiency in new homes by offering buyers a high-efficiency upgrade option. The location of this efficient community was within Tribute s Hamlet development at the junction of Audley and Taunton Roads in Ajax Ontario. The upgrade included efficient plumbing fixtures (toilets and showerheads), ENERGY STAR appliances, and drought tolerant landscaping packages. OBJECTIVE: To quantify the water, energy, natural gas, and CO 2 reductions related to the installation of efficiency fixtures and appliances in new homes
 in new homes could have on residential water and energy demands and, therefore, on the environment.")

7 2.0 RESEARCH METHODOLOGY The goal of the project was to evaluate and quantify the impact that installing efficient fixtures and appliances (vs. builder s models) in new homes could have on residential water and energy demands and, therefore, on the environment. A total of 175 homes participated in this study 85 homes in the Control Group and 90 homes in the Study Group 3. The Study Group homes received the upgrade package; the Control Group homes received the builder s typical fixtures and appliances 4. Electricity, water, and gas meters for all 175 homes were read semi monthly for one year. Detailed water and energy demand data was obtained by installing sub meters and data loggers in 10 homes in each of the Study and Control Groups (Sub Metered Homes). Radio frequency (RF) sub meters were used to facilitate easier and more frequent downloading. Water sub meters were installed on: water heater inlet (record total hot water demand), clothes washer hot water supply, clothes washer cold water supply, dishwasher, and front and rear outdoor hose bibbs. Hose Bibb Sub metering Energy sub meters were installed on: fridge, range 5, dishwasher, clothes washer, and clothes dryer. Electrical Sub metering It was important to collect sub metered data as part of this project to better assess savings related to individual fixtures and appliances as the savings identified by ENERGY STAR appliances are currently based on manufacturer supplied data and not on actual field data. 3 The original intention was to have the same number of homes in each group, however, the process of garnering participation is not an exact science. 4 A small percentage of homeowners supplied their own appliances. The effect of a few self supplied appliances on the overall water and energy savings is expected to be minimal. 5 Same model used by both Groups. There is currently no ENERGY STAR qualified range. 2
8 3.0 DATA ANALYSIS Data was collected from October 2006 to August While overall water and energy savings related to the installation of the upgraded fixtures and appliances in this study have been determined by comparing demands in the relatively large number of non submetered Control and Study homes, the savings related to individual fixtures and appliances are based on the detailed data collected only in sub metered homes. 3.1 OVERALL WATER CONSUMPTION Domestic water consumption is influenced both by lifestyle (personal habits, showering frequency/duration, laundry frequency, irrigation practices, etc.) and the technology used (type of toilet, showerhead, clothes washer, etc.). Typically, about 75% of indoor water use is related to just three elements: toilet flushing (31%), laundry (25%), and showers (19%) 6. Unlike toilets and clothes washers, however, shower preference is highly personal and there is no one size fits all when it comes to selecting efficient showerheads. Fortunately, all showerheads used by home builders meet the Ontario building code requirement of having a maximum flow rate of 9.5 litres per minute (Lpm). The Study homes received what would be considered upgraded 9.5 Lpm showerheads (Niagara Conservation s Earth showerhead). Theoretically, a better showerhead would provide a higher level of performance without increasing the flow rate, saving water and energy by reducing the length of time participants spend in the shower. Water and energy use related to showering was not monitored as part of this study. Identifying the real water and energy savings available to new home construction is important in terms of planning future developments and home construction. 6 Aquacraft, Residential End Use Study, household leakage not considered (accessed October 2007). 3
9 3.1.1 NON SUB METERED HOUSEHOLDS: Water demand data was collected via reading each home s main water meter from October 1, 2006 until August 7, Table 1 below identifies the overall average daily water demands, the base (winter) demands, and the summer demands of the non submetered homes. Although the outdoor (or, more precisely, seasonal) water demands in the Study Group are slightly greater than the corresponding demands in the Control Group, the Study Group of homes used significantly less water overall. Table 1 - Average Daily Water Demands Non-Sub-Metered Homes Group Overall Nov. Apr. May - Aug. Outdoor Use (base) (summer) Control Study Savings Table 2a and 2b below include the number of persons per household (based on survey data) and illustrate seasonal water demands in litres per capita per day (Lcd). Table 2a - Average Indoor Demands Non-Sub-Metered Homes Group Indoor Demands pph Lcd (Nov. Apr.) Control Study Savings Table 2b - Average Outdoor Demands Non-Sub-Metered Homes Group Outdoor Demands pph Lcd (May Aug.) Control Study Savings
10 3.1.2 SUB METERED HOUSEHOLDS 7 : Water demand data for the sub metered homes was collected from November 1, 2006 until August 31, Table 3 identifies the overall average daily water demands, the base (winter) demands, and the summer demands of the non sub metered homes. The water demands of the sub metered homes that selected the upgrade package (Study homes) are consistently lower than the demands of the non upgraded homes. Table 3 - Average Daily Water Demands, Sub-Metered Homes Group Overall Nov. Apr. May - Aug. Outdoor Use (base) (summer) Control Study Savings Table 4a and 4b below include the number of persons per household (based on survey data) and illustrate seasonal water demands in litres per capita per day (Lcd). Table 4a - Average Indoor Demands Sub-Metered Homes Group Indoor Demands pph Lcd (Nov. Apr.) Control Study Savings Table 4b - Average Outdoor Demands Sub-Metered Homes Group Outdoor Demands pph Lcd (May Aug.) Control Study Savings Outliers (i.e., data points that are considered erroneous) have been removed 8 Data collection commenced in September 2006, however, the data collection process was not finalized until the beginning of November
11 Table 2b and Table 4b illustrate that the per capita outdoor water demands in the Study areas are similar in both the sub metered and non sub metered homes, whereas the outdoor demands in the non sub metered Control homes are less than half of those in the sub metered homes. The reason for the relatively low outdoor water demands in the non sub metered Control group of homes is not known. 3.2 INDOOR VS. OUTDOOR DEMANDS As identified above, both Study and Control homes have higher water demands during the summer months because of lawn watering, car washing, etc. The Study homes in this project received a landscape package for their front garden consisting of a single drought tolerant tree, several drought tolerant shrubs, as well as several varieties of hardy perennials. The Control homes received the standard builder grade front garden consisting simply of non drought tolerant shrubs. Outdoor water demands are often calculated as the difference between demands during winter and summer months (see Table 1 and Table 3 above). To obtain a more precise value for outdoor water use in the sub metered homes, the front and rear hose bibbs of were metered 9 and logged. Table 5 below compares the outdoor demand in the submetered homes using both of these methodologies. Table 5 - Average Indoor & Outdoor Demands Litres per Day per Home Sub-Metered Homes Nov. Apr. (winter) May Aug. (summer) Calculated Outdoor Demand Metered Outdoor Demand Control Group Study Group As can be seen, the value obtained for outdoor water use was very similar using both of these methodologies. What s more, Study homes used only about 60% as much outdoor water as Control homes. Whether the reduced outdoor water use by the Study homes is related to the difference in landscape packages or to the watering habits of the homes involved or both was not verified as part of this project. 9 The hose bibb meters were installed inside the home, hidden between floor joists as to be out sight. 6
12 3.3 WATER HEATER The data analysis covers the time period of November 1, 2006 to August 31, The total volume of hot water used by the participating sub metered households was measured via a sub meter installed on the inlet to the home s water heater. Hot water demands in the Study homes were expected to be lower than those of the Control homes because of the installation of an efficient clothes washer, premium showerhead, and premium dishwasher. The results of hot water consumption through this period are summarized in Table 6. Hot water accounted for about 36 percentage of total water demand in the Control homes and about 42 percent in the Study homes. Table 6 - Average Hot Water Demands Litres per Day per Home Group Hot Water Demand Savings Percentage Savings Control % Study CLOTHES WASHER COLD WATER USE CLOTHES WASHER The volume of cold water used to wash clothes was recorded in the sub metered homes from November 1, 2006 to August 31, The results for the monitoring period are presented in Table 7 below. Cold water clothes washing demands account for about 20 percent of total indoor water demands in the Control homes and about 15 percent in the Study homes. Table 7 - Clothes Washer Cold Water Litres per Day per Home Cold Water Demand Savings Group Percentage Savings L/d/H L/d/H Control % Study 60 7
13 3.4.2 HOT WATER USE CLOTHES WASHER The volume of hot water used to wash clothes was recorded in the sub metered homes from November 1, 2006 to August 31, The results for the monitoring are presented in Table 8 below. Hot water clothes washer demands account for about 3.1 percent of total indoor water demands in the Control homes and about 2.5 percent in the Study homes. As can be seen by comparing Table 7 and Table 8, participants used far less hot water than cold water to wash clothes. Table 8 - Clothes Washer Hot Water - Litres per Day per Home Hot Water Demand Savings Group Percentage Savings L/d/H L/d/H Control % Study TOTAL WATER USE CLOTHES WASHER The total water demand for the clothes washer is the sum of hot and cold water demands, as presented in Table 9. Table 9 - Total Clothes Washer Water - Litres per Day per Home Total Clothes Percent Group Cold Water Hot Water Savings Washer Savings Control % Study These results are similar to the predicted savings achieved by ENERGY STAR qualified clothes washers 10, i.e., between 35 to 50 percent water savings vs. conventional top loading washers. 10 Office of energy efficiency: accessed October 2007) 8
14 3.5 DISHWASHER: The volume of hot water used by the dishwasher was recorded in the sub metered homes and is illustrated in Table 10 below (note that there is no cold water supply to residential dishwashers). Hot water dishwasher demands account for about 1.3 percent of total indoor water demands in the Control homes and about 3.4 percent in the Study homes. Table 10 - Dishwasher Water Demands - Litres per Day per Home Group Hot Water Savings Percentage Savings Control % Study 13.5 The results show that dishwasher demand was actually greater in the Study homes. Section 4.6 shows that the energy demands related to dishwasher use are also greater in the Study home. The reason for higher dishwasher use in Study homes is not known but may be related to: 1) people with a high level of interest in efficiency, i.e., people in the Study area, eat a greater number of meals at home (vs. at restaurants) than people in the Control area and, therefore, use the dishwasher more often, or 2) people in the Study area are aware that using the dishwasher can be a more efficient way of cleaning dishes than by hand washing and, therefore use the dishwasher more often. 3.6 TOILETS While all new homes constructed in Ontario are required to be fitted with toilets that flush with no more than six liters of water, it is not uncommon for builders to install toilet models that provide marginal performance at best. Toilets that perform poorly can result in people changing their flushing habits in an attempt to improve performance, e.g., they may hold the flush handle longer to increase the flush volume or they may double flush more often. While homes in the Control Group were fitted with typical builder grade toilets, homes in the Study Group were fitted with one high performance six litre per flush toilet 11 and 11 Performance levels determined via the Maximum Performance (MaP) Testing program for toilets. 9
15 one of two types of High Efficiency Toilets (HETs). HETs have an effective flush volume of no more than 4.8 liters 12. These HET toilets are described as follows: 4 litre Pressure Assist: In traditional residential toilets water stored in the toilet tank is released via gravity into the bowl when the user activates the flush handle. Regardless of the water pressure of the water supply to the toilet, all of the energy available to flush the waste is provided by the difference in elevation between the water level in the tank and the water level in the bowl (approximately 0.5 PSI). Pressure assist toilets take advantage of the water supply pressure by storing the water used for flushing in an air tight pressure vessel, e.g., if the water is supplied at 50 PSI the water pressure in the pressure vessel will also be 50 PSI. Because pressure assisted toilets take advantage of the free energy available in the pressurized water supply they are able to flush with less water and still achieve high performance results. The pressure assisted toilet models used in this project flushed with only four liters of water. Pressureassisted toilets were installed in the second floor washrooms of 48 homes. The remaining second floor bathrooms were outfitted with high performance 6 litre toilets 13 that cost about the same as the builder standard toilet. It is hoped that the improved performance of this toilet will yield further water savings and offer the builder insight into the efficacy of installing better quality fixtures. Better performing toilets should reduce customer callbacks and increase buyer satisfaction at little or no additional cost to the builder. A total of 48 four litre pressure assisted toilets were installed and 23 six litre high performance toilets were installed. On average, these toilets use 4.65 liters per flush (Lpf), calculated as follows: (48 units x 4.0 Lpf + 23 units x 6 Lpf) ( ) = 4.65 Lpf Dual Flush: This type of toilet has been popular in Europe for many years and is even mandated in Australia and Singapore. Because it takes less energy (and therefore less water) to flush liquids vs. solids, this type of toilet offers the user a choice between flush volumes: a full six liters to flush solid waste and a reduced three liters to flush liquid waste. Based on a ratio of two reduced flushes for every full flush, the effective flush volume of a 6 L/3 L dual flush toilet is 12 The effective flush volume of a single flush toilet is simply the measured flush volume, and for a dual flush toilet is the mathematical average of two reduced flushes plus one full flush. 13 Performance based on MaP testing scores. 10
16 approximately 4 liters. Dual flush toilets were installed in all first floor powder rooms and in the sole second floor bathrooms of three of the Study homes because it was expected that these washrooms would experience a large percentage of liquid flushes. Previous monitoring studies 14 have determined that residential toilets are flushed an average of approximately five times per day per person. The average occupancy of the non sub metered homes in both the Control and Study Groups was 3.1 persons. This analysis assumes that HETs and 6 L models are flushed equally, thereby providing an average flush volume of litres. An expected water savings of 10.5 liters per home in the Study Group of homes is calculated as follows: Control Group: 3.1 persons x 5 flushes/day x 6 liters per flush = 93 liters per homes per day Study Group: 3.1 persons x 5 flushes/day x litres= 82.5 liters per homes per day Savings: ( ) liters per home per day = 10.5 liters per home per day 3.7 WATER SAVINGS SUMMARY The data analysis for the sub metered homes indicates that participants in the Study area are saving about 66 litres per capita per day indoors (during non irrigation months) and 34 litres per capita per day outdoors (during summer months) 15. In the non sub metered Study homes indoor savings were slightly less at 43 litres per capita per day while outdoor water demands were actually greater at about 39 litres per capita per day. Of course, weather conditions can change significantly from year to year subsequent summers may be much hotter and dryer or much cooler and wetter. As such, the outdoor savings of between litres per capita per day achieved in the Study homes should be viewed as an indication only and not a guarantee of future savings. 14 One example is the AWWA RF Residential End Use Study by Aquacraft. 15 The 34 Lcd savings is calculated based on data collected via sub metering the hose bibbs. 11
17 Water savings achieved in the sub metered homes are summarized in Table 11 below. Table 11 - Indoor Water Demands & Savings: Sub-metered homes - liters/day Overall Demands Hot Water Total Clothes Washer (cold) Clothes Washer (hot) Clothes Washer (combined) Dishwasher (hot) Toilet Control Group Study Group Volumetric Savings Percentage Savings 22.5% 8.8% 40.4% 37.5% 40.7% -50% 11.7% The volume of indoor water savings achieved by the sub metered homes is slightly less than that achieved by the non sub metered group of homes (115 litres vs. 135 litres respectively), however, the per capita savings is greater (66 Lcd vs. 44 Lcd respectively). Of the total 115 liters saved per household per day in the sub metered Study homes, only 51.8 liters (45 percent) can be directly attributed to the installation of the efficient fixtures and appliances. The remaining 63.2 liters may be related to the upgraded showerhead given to the Study Group, the result of an increased awareness of water efficiency by homeowners participating in the Study group, or it may be the result of something else. Information gathered during the homeowner interviews completed at the end of the monitoring period did not clearly indicate the reason behind these additional savings. While it was hoped at the outset of this project that the projected water savings (from the installation of efficient fixtures and appliances) would be verified by the metering and monitoring program, it was not expected that the savings achieved would be far greater than projected. More than half of the water savings achieved in this project appears to be from changes in participant lifestyle and habits vs. improvements in technology. These results are very positive and indicate that the potential to reduce water and energy demands is even greater than we anticipated. 16 equates to 1.3% of total household indoor water consumption 17 equates to 3.4% of total household indoor water consumption 12
18 4.0 ENERGY DEMANDS Modern homes contain a wide variety of electrical appliances, each with an associated electrical demand. As energy costs continue to increase and people become more and more aware of the effect that unchecked energy demands can have on our environment, there is a growing demand for energy efficient fixtures and appliances. One program that was initiated to identify and promote energy efficient fixtures and appliances was the U.S. EPA s ENERGY STAR program. This program is administered by NRCan in Canada. Appliances typically have life spans ranging from 13 years for a dishwasher to 21 years for a freezer 18. As such, the energy savings over the life of the appliance can be significant. This project compared the energy demands in the upgraded Study homes with the energy demands in the Control homes. 4.1 ENERGY DEMAND; NON SUB METERED HOMES Energy consumption in the non sub metered homes was monitored from October 1, 2006 to August 7, The data analysis revealed the Study Group of homes consumed approximately 13% less energy than the Control Group of homes during this period (see Table 12 below), even though there were 2.86 persons per home in the Study Group and only 2.50 persons per home in the Control Group. Table 12 - Average Energy Demands: Non-Sub-Metered Homes Group of Homes Average Energy Demands kwh per household per day Control 19.8 Study 17.2 Savings 2.6 (13.1%) 18 Source: Office of Energy Efficiency, Natural Resources Canada (accessed October2007) at 13
19 4.2 ENERGY CONSUMPTION SUB METERED HOMES Energy consumption in the sub metered homes was also monitored from October 1, 2006 to August 7, Average household energy demands were similar in both the sub metered and non sub metered homes. The data analysis revealed the Study Group of homes consumed approximately 19% less energy than the Control Group of homes (see Table 13). Table 13 - Average Energy Demands: Sub-Metered Homes Group of Homes Average Energy Demands kwh per household per day Control 20.9 Study 17.0 Savings 3.9 (18.7%) 4.3 CLOTHES WASHER ENERGY DEMAND Clothes washer energy demands are presented in Table 14 below. Table 14 - Energy Demands: Clothes Washer: Sub-Metered Homes Group of Homes Average Energy Demands kwh per household per day Control 0.21 Study 0.11 Savings 0.10 (47.6%) The savings agree with predicted savings of between 40 and 50 percent, although the actual cost savings per year (about 36 kwh) related to the reduced energy demands of front loading washers is quite small A software program produced by a major clothes washer manufacturer estimates an energy savings of approximately 46%, or almost exactly what was achieved in this study 14
20 4.4 CLOTHES DRYER ENERGY DEMAND Clothes dryer energy demands are presented in Table 15 below. Table 15 - Clothes Dryer Energy Use: Sub-Metered Homes Group of Homes Average Energy Demands kwh per household per day Control 2.36 Study 1.84 Savings 0.52 (22.0%) Front loading clothes washers have much faster spin rates than top loading machines. As such, clothes are dryer when removed from front loading washers and require less time in the clothes dryer. The energy savings because of the shorter drying times is approximately ten times greater than the energy saved by the clothes washer itself STOVE ENERGY DEMAND At this time there is no such thing as an Energy Star rated stove, as such, the same model stove was installed in both the Study and Control homes. On average, the stoves in the Study homes were used slightly more than the stoves in the Control homes (Table 16 below). The reason for higher energy demands related to stove use in the Study homes is not known but, as was postulated earlier, may be related to people in the Study group eating more meals in their home (vs. restaurants) than people in the Control group of homes. Table 16 - Stove Energy Use: Sub-Metered Homes Group of Homes Average Energy Demands kwh per household per day Control 1.02 Study 1.12 Savings 0.10 ( 9.8%) 20 A software program produced by a major clothes washer manufacturer estimates an energy savings of approximately 22%, which agrees with what was achieved in this study 15
21 4.6 DISHWASHER ENERGY DEMAND Dishwasher energy demands are presented in Table 17 below. Table 17 - Dishwasher Energy Use: Sub-Metered Homes Group of Homes Average Energy Demands kwh per household per day Control 0.29 Study 0.41 Savings 0.12 ( 41%) Energy demands related to dishwasher use are greater in the Study group of homes. As stated earlier, greater dishwasher use and greater stove use in the Study homes indicate that people in the Study group eat in house more often than their counterparts in the Control group. The NRCan website indicates that Canadians have reduced dishwasher use in recent years and now wash an average of approximately 215 loads per year. The dishwasher energy use identified above includes only the motor energy used during washing and the drying energy used during power drying, but does not include energy related to heating the water used by the washer. The energy used to provide hot water to the dishwasher (which is a component of natural gas demands, Section 5.0) may be as much or more than the energy used to operate the pump and dry the dishes. As such, the dishwasher energy demands identified in Table 17 are significantly less than the energy use predicted on the NRCan website. 4.7 FRIDGE ENERGY DEMAND Fridge energy demands are presented in Table 18 below. Table 18 - Fridge Energy Use: Sub-Metered Homes Group of Homes Average Energy Demands kwh per household per day Control 1.53 Study 1.30 Savings 0.23 (15%) While fridges in the Study homes used less energy than the units installed in the Control homes, both groups of homes used slightly more than the 1.21 kwh per day value identified by NRCan for energy efficient fridge models. 16
22 4.8 ACTUAL VS. PROJECTED SAVINGS The following table identifies the average daily energy demands of the sub metered appliances in this study along with an estimate of the expected energy demands based on data from National Resources Canada (NRCan). Table 19 - Energy demand & Savings: Sub-metered homes: kwh/home/day Main Meter Clothes Washer Dryer Dishwasher 21 Fridge Stove Control Group Study Group kwh Savings % Savings 19% 48% 22% -41% 15% -9.8% 22 Standard NRCan - Efficient As can be seen in Table 20, average total energy savings in the sub metered Study homes was 3.9 kwh per day, or 19 percent saving vs. the Control Group. Average energy savings in the non sub metered Study Group was slightly less at 2.6 kwh per day or about 13 percent vs. the Control Group. Table 20 - Energy Demands Group Sub-metered Non-sub-metered Control Group Study Group Savings m Savings Percentage 19% 13% 21 Note that the energy demand data does not seem to correlate with the water demand data for the dishwasher, i.e., the energy demand seems to be only 20 25% as high as it is expected to be. 22 Note that the same model of stove was used in all homes. 23 Based on calculator spreadsheet developed by Maytag Appliances, assumes one load per day Ibid 26 As stated earlier, the energy demand identified by sub metering dishwashers does not include the energy used to heat the water supplied to the washer, whereas the NRCan value does include this energy. 17
23 It is interesting to note that, like the water savings, the total average energy savings achieved in the Study Group is far greater than can be explained via the installation of the efficient appliances. For example, the clothes washer, dryer, and fridge combine for a savings of 0.85 kwh per day, whereas the stove and the dishwasher combine for a negative 0.24 kwh per day. When the savings from all of the appliances are combined the net result is an average savings of 0.61 kwh per day per home far less than the 3.9 kwh per day savings achieved in the sub metered Study homes or the 2.6 kwh per day savings achieved in the non sub metered homes. In fact, the energy savings achieved by the installation of the efficient appliance package accounts for only about percent of the total energy savings achieved by the submetered Study group of homes. The reason for this additional savings has not been confirmed but may be related to a greater use of other efficient appliances and equipment (e.g., microwave, toaster, kettle, computer, lighting, etc.), to a higher level of energy efficiency awareness in the Study group (e.g., they may be more prudent at turning off lights when they leave a room), to a combination of both, or to some other factor(s). 18
24 5.0 NATURAL GAS The primary difference in natural gas demand between the Study and Control groups of homes was expected to be related to a reduction in hot water demand in the Study Group (i.e., less gas used to heat water for clothes and dish washing, and showering). Table 21 - Natural gas demand (winter & summer months), m 3 /day Group Sub-metered Non-sub-metered Control Group Study Group Savings m Savings Percentage 11.9% 9.1% It is estimated that it takes approximately 8.0m 3 of natural gas to heat to heat 1,000 litres of water by 50 o C. The total hot water savings in the Study homes of about 17 litres per day would theoretically save 0.14 m 3 of natural gas per day, whereas the average natural gas savings in the sub metered and non sub metered homes is approximately 0.74 m 3 per day much greater than can be explained via reduced hot water demands alone. To eliminate the effects of increased natural gas use during the winter heating season (i.e., furnace use), an analysis was also completed on natural gas demands during the summer months only (table 22 below). The estimated gas savings related to reduced water heating accounts for almost half the gas savings observed in both the sub metered and non sub metered Study homes during the summer months. Approximately 15 percent of the homes included in this study have natural gas ranges (stoves) it is assumed that the remainder of the natural gas savings comes from reduced use of the range during the hot summer months perhaps by eating out more frequently or via a greater use of the BBQ, though these assumptions have not been verified. Table 22 - Natural gas demand (summer months only), m3/day Group Sub-metered Non-sub-metered Control Group Study Group Savings m Savings Percentage 23.3% 20.8% 19
25 6.0 GREENHOUSE GAS SAVINGS The estimated reduction in CO 2 emissions resulting from reduced energy, and natural gas demands in the Study group of homes is calculated based on the following conversions taken from the U.S. EPA website 27 : Energy Savings: 0.08 tonnes of CO 2 per 100 kwh of energy savings Natural Gas Savings 28 : 0.18 tonnes of CO 2 per 100 m 3 of gas savings The estimated reduction in CO 2 emissions resulting from reduced water demands is based on the assumption that it takes approximately 1.0 kwh of electricity to treat, pump, and distribute 1.0 m 3 of water in a municipal system 29. Water Savings: 0.08 tonnes of CO 2 per 100 m 3 of water saved The estimated reductions in CO 2 emissions achieved in the Study homes are illustrated in Table 23 below: Table 23 - Average CO2 Reductions in Study Homes CO Resource 2 Savings Tonnes per Year Water 48.2 m 3 x 0.08 tonnes of CO 2 per 100 m Electricity 949 kwh x 0.08 tonnes of CO2 per 100 kwh 0.76 Natural Gas 215 m 3 x 0.18 tonnes of CO 2 per 100 m TOTAL 1.19 It has been estimated that the average Canadian produces about 3.7 tonnes of CO 2 per year within their home 30 or roughly 11 tonnes per family of 3 per year. A savings of 1.19 tonnes of CO 2 per household per year equates to a savings of approximately 10.7 percent Based on conversion of 0.36 therms per 1.0m 3 of gas 29 Via communications with City of Toronto and Region of Durham 30 Wikipedia 20
26 7.0 COST-EFFECTIVENESS The average savings achieved by homes in the Study Group are identified in Table 24. Table 24 - Daily and Annual Savings in Study Homes Resource Daily Savings Annual Savings Water Savings 132 L 48.2 m 3 Energy Savings 2.6 kwh 949 kwh Natural Gas Savings 0.59 m m 3 Water and sewer rates vary from municipality to municipality, and some water billing systems include meter or service charges which are not affected by changes in demands. As such, the cost effectiveness calculations presented in this report should be viewed as an indication of savings only, and not a guarantee of savings. Total cost of indoor fixture and appliance upgrades for homes in the Study Group was approximately $735, broken down roughly as follows: Clothes washer upgrade: $318 Dryer upgrade: $160 Refrigerator upgrade: $218 Dishwasher upgrade: $39 Toilet upgrade: minimal Showerhead upgrade: minimal Total cost of outdoor plant upgrade for homes in the Study Group was approximately $100. Utility costs in the Region of Durham are approximately as follows: Water & wastewater: $1.60 per m 3 Electricity: $0.07 per kwh Natural Gas: $0.35 per m 3 Table 25 - Annual Cost Savings in Study Homes Resource Annual Resource Savings Cost per Unit Annual Cost Savings Water Savings 48.2 m 3 $1.60 per m 3 $77.12 Energy Savings 949 kwh $0.07 per kwh $66.43 Natural Gas Savings 215 m 3 $0.35 per m 3 $75.25 Total Average Annual Savings per Study Home $ Payback period $735 one time cost $ savings per year = 3.4 year pay back. 21
27 8.0 CONCLUSION The water, energy, and CO2 savings achieved by the Study homes in this research project are significant. Water Savings: 132 L/day per household (22.3%) Energy Savings: 2.6 kwh/day per household (13%) Natural Gas Savings: 0.59 m3/day per household (9.1%) CO 2 reduction: 1.19 tonnes / year per household (10.7%) These savings were the result of two elements: 1. use of efficient fixtures, appliances, and gardens in the Study homes, and 2. efficient customer habits regarding water and energy use in the Study homes. Since the homeowners that agreed to participate as Study homes were largely selfselected (i.e., they had a choice of whether or not they wished to participate in the program), it would not be surprising if their normal water and energy use habits also reflected a level of efficiency greater than what would be expected by the general public. That said, the water and energy savings identified in both the sub metered and non submetered groups of homes was far greater than could be predicted based on the use of efficient fixtures and appliances alone. These results clearly indicate that municipal efficiency improvement programs should promote both physical changes to fixtures, appliances, gardens, etc., through rebate and give away promotions, as well as habitual changes regarding how these fixtures, appliances, and gardens are used (through education and outreach programs). The calculated payback period associated with upgrading the Study homes is approximately 3.4 years. This payback period is very reasonable, especially when you consider that the efficient fixtures and appliances installed in these homes will last much longer than 3.4 years. After the 3.4 year period the homeowner will start to save more than $200 each year in utility costs. The calculated reduction in CO 2 is about 10.7 percent vs. the average Canadian home. If all new home builders adopted the practice of providing upgraded water efficient fixtures, appliances, and landscapes the CO 2 savings on a national basis would be significant. 22
28 Durham Region is a rapidly growing municipality. Improving the overall water and energy efficiency of the new homes being constructed in the Region will have three significant impacts: It will allow the Region to reduce the size of, or defer the need for, capital expenditures related to infrastructure expansion, It will help maintain the Region s position as one of Canada s most proactive municipalities regarding water efficiency, and It will help reduce the Region s growing environmental footprint. The results of this project help quantify the potential for water, energy, natural gas, and CO 2 reductions related to the installation of efficiency fixtures and appliances in new homes. For example, while many Canadian references and websites identify indoor per capita demands of 250 litres per day or greater, this study has shown that demands of as low as 147 litres per capita per day can be achieved in new homes a demand rate that challenges that of many European countries. What s more, with the potential to incorporate further efficiencies into new homes, such as hot water recirculation systems, rainwater harvesting systems, grey water harvesting systems, etc., this demand could be even further reduced. I would be pleased to answer any questions about this report. Sincerely, Bill Gauley, P.Eng., Principal Veritec Consulting Inc. 23
29 Appendix A Upgraded Fixtures and Appliances Appendix A Upgraded Fixtures and Appliances Water Efficient Toilets Capizzi 4 L per flush pressure assist Foremost Premier 6 litre per flush Caroma Tasman dual flush (6L & 3L) Energy Efficiency Appliances Appliance Manufacture Model Number Colour Energy Size Misc. Energy Star FRT18HS6DW0 White Electric 18cu.ft Top Freezer Yes FRT21P6CSB5 Stainless Electric 21cu.ft Top Freezer Yes Frigidaire Fridge FRT18P6BSB4 Black Electric 18cu.ft Top Freezer Yes FSC23R5DSB5 Stainless Electric 23cu.ft Side by side Yes Stove Dishwasher Frigidaire Frigidaire CFEF312CS2 White Electric 30in Electric burners Yes CFEF372CB2 B / W Electric 30in Electric smooth top Yes CFEF372BC2 Stainless Electric 30in Electric smooth top Yes CFGF366DCB Stainless Gas 30in Open Flame Yes CFGF366CCB B / W Gas 30in Open Flame Yes CFGF337ASE Black Gas 30in Open Flame Yes FDB750RCC0 Stainless Electric 24in Yes GLD3450RDS1 Black Electric 24in Yes GLD3450RDS0 White Electric 24in Yes FDB510LCS White Electric 24in Yes FDB510LCB0 Black Electirc 24in Yes Washer Frigidaire GLTF1240AS0 White Electic Front Loader Yes Dryer Frigidaire GLEQ332CAS2 White Electic Front Loader Yes GLGQ64CAS4 White Gas Front Loader Yes Toilets Caroma Tasman Foremost Premier Capizzi, Turbo Capizzi Eljer Toronto Savoy Bowl: N/A Round Bowl White Tank: N/A 6.0/3.0L Dual Flush Bowl: LL 8207 N/A Round Bowl White Tank: T 8207 N/A 6.0L Gravity Bowl: N/A Elongated Bowl White Tank: 1277 N/A 4.0L Pressure Assist Bowl: N/A Round Bowl White Tank: N/A 6.0L Gravity HET HET Showerhead Niagara N2925N White N/A 2.35GPM Yes Veritec Consulting Inc.


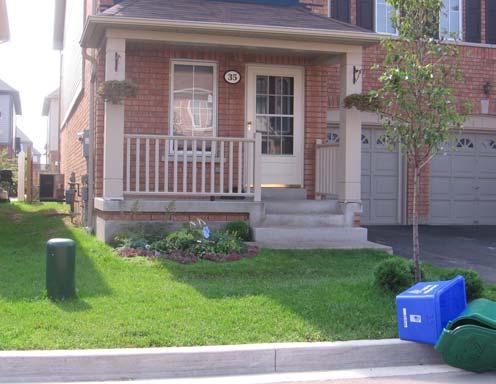
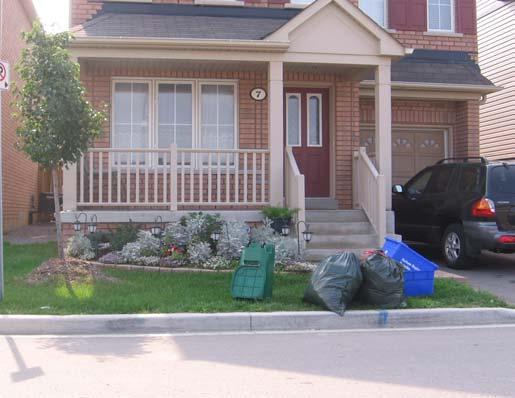
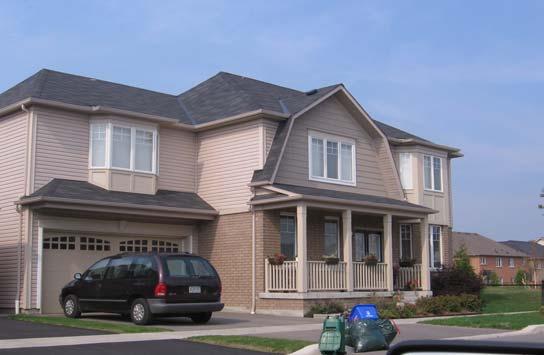
30 Appendix B - Typical Control Homes


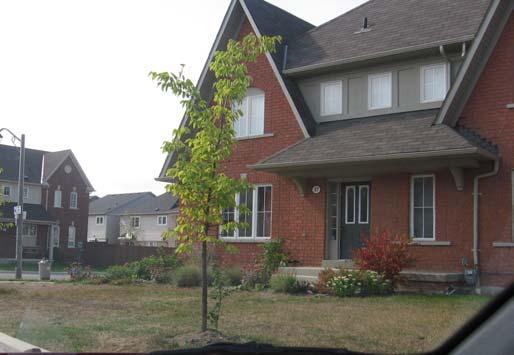
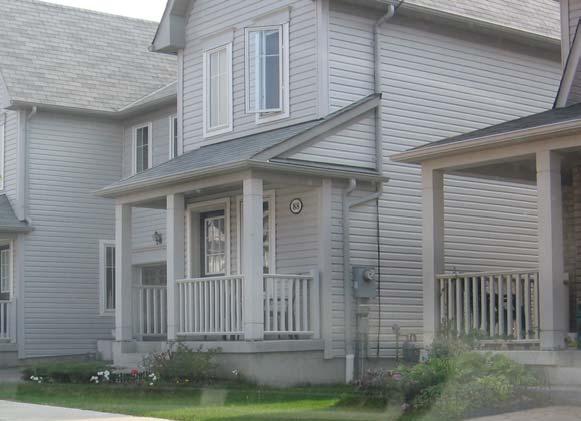
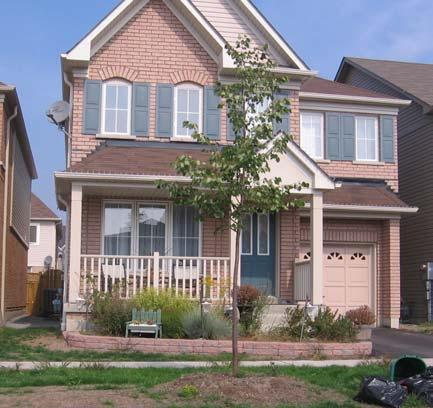
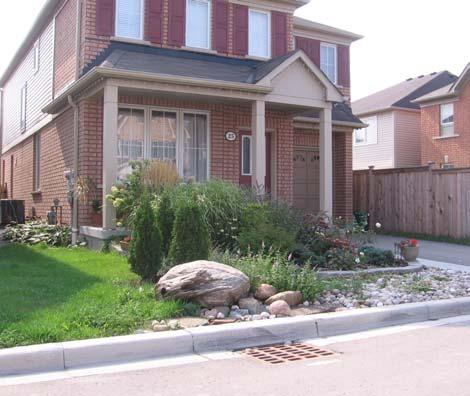
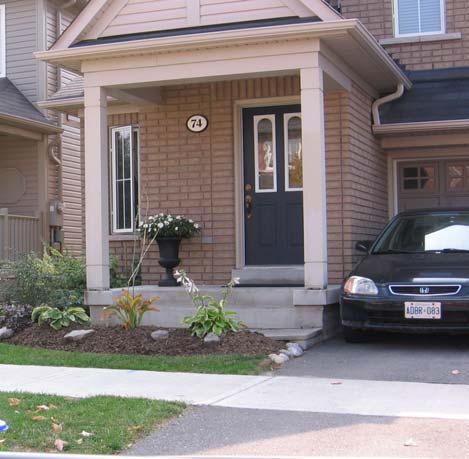
31 Appendix B - Typical Study Homes
2010/2011 GOOD ENERGY REBATE PROGRAM
 2010/2011 GOOD ENERGY REBATE PROGRAM YUKON GOVERNMENT S ENERGY SOLUTIONS CENTRE FINAL REPORT December 9, 2011 TABLE OF CONTENTS TABLE OF CONTENTS...2 1. PROGRAM OVERVIEW...3 2. PROJECT BUDGET...4 3. PROJECT
2006/2007 Washer Rebate. Yukon Government s Energy Solutions Centre and Natural Resources Canada
 2006/2007 Washer Rebate Yukon Government s and Natural Resources Canada Final Report April 19, 2007 PROGRAM OVERVIEW One of the fundamental objectives of the (ESC) is to serve Yukon s energy efficiency
Residential Water Conservation Research Brief On-Demand Hot Water Systems
 Overview Water heating is the second highest consumption of energy in the residential sector, accounting for 17 percent of consumed energy for the average Canadian household. Each year, residents allow
WATER WISE SURV EY. Santa Barbara City College
 WATER WISE SURV EY FI N AL REPORT Santa Barbara City College August 21, 2013 Prepared By City of Santa Barbara Water Conservation Program WATER WISE SURVEY OF SANTA BARBARA CITY COLLEGE EXECUTIVE SUMMARY
House Efficiency Survey Report
 House Efficiency Survey Report Andy Gabler, Val Horstman, and Fred Thielke Renewable Energy Organization Calvin College April 23, 2008 Abstract: The Renewable Energy Organization s House Efficiency team
Waterwise Rainwater Saving Guide
 Heritage Water Tanks Waterwise Rainwater Saving Guide Every drop of rain is precious in Australia. For years, the rural community have successfully been collecting runoff water from the roofs of their
RE Home$avers CO 2. Take Action on Climate Change. Water Conservation. Carbon Dioxide Reduction Edmonton. A Partner in Canada s
 RE Home$avers Water Conservation Take Action on Climate Change RE Carbon Dioxide Reduction Edmonton A Partner in Canada s Supporting Sponsors Technical Support RE Community Business Partners About RE Created
Keep your electricity bill cool this summer
 Keep your electricity bill cool this summer The summer months are notorious not only for high temperatures, but also for high electricity use. There are a number of things you can do to conserve electricity
Top 5 New and Innovative Water-Efficient Products
 Top 5 New and Innovative Water-Efficient Products - 2010 Bill Gauley, P.Eng. Veritec Consulting, Inc. Mississauga, Ontario by John Koeller, P.E. Koeller and Company Yorba Linda, California May 12, 2010
WATER SAVING TIPS SAMPLE. for Your Home
 WATER SAVING TIPS for Your Home SAVING WATER SAVES MONEY We use a lot of water. In fact, every American uses an average of 100 gallons a day, enough to fill two bathtubs! Since you pay for the water you
SPOTLIGHT ON WATER CONSERVATION
 SPOTLIGHT ON WATER CONSERVATION Water Conservation in the Home The average water use for an American family exceeds 300 gallons per day, with about 70% of that for indoor use. Outdoor use averages about
Potential Outdoor Water Savings of Los Angeles Abstract Introduction
 Potential Outdoor Water Savings of Los Angeles Tsukiko Jerger, Nicole Puma, Andrew Tom, Nargis Walai Section A02 Abstract In Southern California, water is in short supply and in high demand. This is sharply
Hot water This guide will help you choose the right hot water system for your home and show you how to reduce your hot water costs.
 Hot water This guide will help you choose the right hot water system for your home and show you how to reduce your hot water costs. Main areas of hot water usage in your home Bathroom Showering and bathing
Estimated weekly domestic hot water (DHW) use
 use") Estimated weekly domestic hot water (DHW) use 5 person household Common uses Number of people (person) (cycles/person/week) Total cycles (cycles/week) Dishwasher 5.0 1.4 7.0 30.4 212.7 30.4 8.9 1.3 Clothes
Estimated weekly domestic hot water (DHW) use 5 person household Common uses Number of people (person) (cycles/person/week) Total cycles (cycles/week) Dishwasher 5.0 1.4 7.0 30.4 212.7 30.4 8.9 1.3 Clothes
Homeowner s Guide: Being Energy Efficient
 Homeowner s Guide: Being Energy Efficient Most people don t know how easy it is to make their homes run on less energy. Drastic reductions in heating, cooling and electricity costs can be accomplished
Do-It-Yourself Home Energy Audit Checklist
 Do-It-Yourself Home Energy Audit Checklist This energy audit checklist is a simple procedure that will allow you to appraise the energy efficiency of your home. By completing the energy audit checklist
Base-Load Electricity Usage - Results from In-home Evaluations
 Base-Load Electricity Usage - Results from In-home Evaluations Anil Parekh, Natural Resources Canada Terry Strack, Strack & Associates Presented at the Conservation & Demand Management in a Sustainable
10 Easy Ways to Save Money & Energy in Your Home
 10 Easy Ways to Save Money & Energy in Your Home by Nick Gromicko, Ben Gromicko, and Kenton Shepard [Internachi.org] Most people don t know how easy it is to make their homes run on less energy, and here
Saving Energy. We promote equality of opportunity in every aspect of our business in line with our objectives.
 Saving Energy We promote equality of opportunity in every aspect of our business in line with our objectives. Wiltshire Rural Housing Association Saving Energy 2015 1 SAVE ENERGY Did you know that the
Understanding Household Electricity Use
 Understanding Household Electricity Use Annual Energy Use in the Home (for an average family of 3 4 people) Heat 50% Hot Water 20% Appliances & Lighting 30% Heat 50% of the annual energy used in an average
InterNACHI Home Energy Inspection for th Street
 InterNACHI Home Energy Inspection for 1750 30th Street Estimated Yearly Energy Costs: $1,491 per year Dear Client, This house has been scored on a scale of 1 to 100. A 100 would represent a home with perfect
How can energy-efficient appliances save you money?
 How can energy-efficient appliances save you money? EnerGuide Your Key to Savings What does the EnerGuide label tell you? When you shop for a major household appliance, look to the EnerGuide label to save
Saying Mahalo to Solar Savings: A Billing Analysis of Solar Water Heaters in Hawaii
 Saying Mahalo to Solar Savings: A Billing Analysis of Solar Water Heaters in Hawaii Jenny Yaillen, Evergreen Economics Chris Ann Dickerson, CAD Consulting Wendy Takanish and John Cole, Hawaii Public Utilities
Estimating Water Use and Savings in Your Home
 Estimating Water Use and Savings in Your Home Bryan R. Swistock, Extension Associate, School of Forest Resources William E. Sharpe, Professor of Forest Hydrology, School of Forest Resources The average
HOME ENERGY DETECTIVES
 HOME ENERGY DETECTIVES Overview: Determine how much energy your home uses each day by taking daily readings of your kilowatt meter. Discover how much power each appliance and technology in your home uses.
Water Demand Management Plan
 ADDENDUM I ARCHITECTURAL GUIDELINES WELGELEGEN RESIDENTIAL DEVELOPMENT June 2011 : Revision 2 Water Demand Management Plan Welgelegen Estate on Remainder of Kraaibosch 195/1 & 279 Compiled by: HilLand
Community Development and Recreation Committee
 STAFF REPORT ACTION REQUIRED Results of the Fire Insurance Grades Study Date: November 20, 2013 To: From: Wards: Reference Number: Community Development and Recreation Committee Fire Chief and General
Ways to Save Water & Money
 26 Ways to Save Water & Money Water with the turn of a handle, we get as much as we want, whenever we want it. So it s easy to forget that water is a carefully prepared product that must be purchased like
Your floor to ceiling guide
 Your floor to ceiling guide Saving energy really doesn t require a lot of your energy. There are some easy things you can do to make a difference in your monthly energy usage and still be comfortable.
Take Control of Your Water Use
 Take Control of Your Water Use Kickstart the Conservation Habit Gwinnett County Department of Water Resources Our Water Cycle Water is continuously recycled through the water cycle Water is not destroyed
WHERE THE WATER IS FLOWING
 WHERE THE WATER IS FLOWING New Trends in Plumbing Technology By Renee Changnon, rchangnon@nrha.org When you think about all of the categories within a home improvement store where technology has had an
LEAK GUIDE HOW TO IDENTIFY COMMON PLUMBING LEAKS
 LEAK GUIDE HOW TO IDENTIFY COMMON PLUMBING LEAKS DO YOU HAVE A LEAK? A home with plumbing leaks can lose over 70,000 gallons of water each year that s enough water to fill a basketball court two feet deep!
Participant has requested a mailed report: YES NO. I would like to begin by asking you a few questions about the building in which you live.
 HOUSEHOLD SURVEY Name of Student Interviewer: Date: Participant No. Address: Participant has requested a mailed report: YES NO PART 1 (Inside Water Use) I would like to begin by asking you a few questions
Simulation of energy and water consumption in Australian housing Dr Zhengen Ren CSIRO Land and Water Flagship, Normanby Road, Clayton VIC3168
 You can change this image to be appropriate for your topic by inserting an image in this space or use the alternate title slide with lines. Note: only one image should be used and do not overlap the title
Shifting Patterns of Water Demand: Socio-Demographic Challenges for Water Managers
 Intro Page Shifting Patterns of Water Demand: Socio-Demographic Challenges for Water Managers Gary Woodard, Ass t. Director NSF STC for Sustainability of Semi-Arid Hydrology and Riparian Areas (SAHRA)
Energy Efficiency Programs in Action
 Cape Light Compact Energy Efficiency Programs in Action Case Study: CYNTHIA HAUN - HYANNIS RESIDENT PROJECT DESCRIPTION Hyannis resident Cynthia Haun successfully reduced her annual electricity use by
Softened Water Benefits Study: Energy Savings Detergent Savings. Independent studies demonstrate the link. Executive Summaries
 Executive Summaries Softened Water Benefits Study: Energy Savings Detergent Savings Independent studies demonstrate the link /MarketTheResearch/ Introduction The Energy Savings Study (aka The Battelle
SMART METERS ANSWER BOOK HOW YOU WHY ONTARIO WHAT ARE GETTING SMART ABOUT CAN START TO PREPARE NOW PAGE 6 TIME-OF-USE PRICES? PAGE 4 IS INTRODUCING
 GETTING SMART ABOUT SMART METERS ANSWER BOOK WHY ONTARIO IS INTRODUCING SMART METERS PAGE 2 WHAT ARE TIME-OF-USE PRICES? PAGE 4 HOW YOU CAN START TO PREPARE NOW PAGE 6 GETTING SMART ABOUT SMART METERS
Impacts of an Energy Star Promotion
 Impacts of an Energy Star Promotion Jack Habart and Joe Kelly, Habart and Associates Consulting Inc. Iris Sulyma and Ken Tiedemann, BC Hydro ABSTRACT BC Hydro s Power Smart group has been encouraging the
25 WAYS TO CONSERVE WATER IN THE HOME AND YARD
 25 WAYS TO CONSERVE WATER IN THE HOME AND YARD 1. Check faucets and pipes for leaks A small drip from a worn faucet washer can waste 20 gallons of water per day. Larger leaks can waste hundreds of gallons.
Data driven insights from the nation s deepest ever customer energy research
 Pecan Street Research Institute Pike Powers Lab and Center for Commercialization Data driven insights from the nation s deepest ever customer energy research Change in peak load 70,000 by customer class
Air conditioners are the biggest source of electric use in the summer. In many homes, it will account for more the ½ of your electric bill.
 Air conditioners are the biggest source of electric use in the summer. In many homes, it will account for more the ½ of your electric bill. If your air conditioner has a thermostat, adjust the setting
WATER-CONSERVING ATTITUDES AND LANDSCAPE CHOICES IN NEW MEXICO
 3rd Quarter 2010 25(3) WATER-CONSERVING ATTITUDES AND LANDSCAPE CHOICES IN NEW MEXICO Brian H. Hurd JEL Classifications: Q25, Q48 Communities throughout the arid western United States and in growing numbers
Generation gap: How baby boomers and millennials stack up in their perceived and actual electricity use. Report. March 2019 BCH19-217
 Generation gap: How baby boomers and millennials stack up in their perceived and actual electricity use Report March 2019 BCH19-217 Entitled, delicate, and coddled these are some of the accusations directed
The energy aefficiency. book. Check inside for ways to get cash back on energy-efficient appliances and services.
 The energy aefficiency book Check inside for ways to get cash back on energy-efficient appliances and services. #1: Switch to CFLs. #15: Change direction with an ENERGY STAR ceiling fan. #2: Shine with
Cold comfort: The rising use (and cost) of air conditioning in B.C. Report. July 2018 BCH18-712
 of air conditioning in B.C. Report. July 2018 BCH18-712") Cold comfort: The rising use (and cost) of air conditioning in B.C. Report July 2018 BCH18-712 Cold comfort: The rising use (and cost) of air conditioning in B.C. With another hot summer upon us, British
Cold comfort: The rising use (and cost) of air conditioning in B.C. Report July 2018 BCH18-712 Cold comfort: The rising use (and cost) of air conditioning in B.C. With another hot summer upon us, British
High-Performance, Coin-Operated Clothes Washer Demonstration and Evaluation
 High-Performance, Coin-Operated Clothes Washer Demonstration and Evaluation Gregory P. Sullivan, Pacific Northwest Division Graham B. Parker, Pacific Northwest Division J. William Currie, Pacific Northwest
Energy and Water Conservation. Workshop for ELSA 3
 Energy and Water Conservation Workshop for ELSA 3 ELSA Net workshop - Level 3 Energy and Water Conservation Content Objectives: Students will learn different ways to conserve water Students will learn
HOUSEHOLD APPLIANCES
 HOUSEHOLD APPLIANCES REGULATORY PROPOSAL PREPARED BY: ENERGY EFFICIENCY BRANCH, BC MINISTRY OF ENERGY AND MINES HTTP://WWW.EMPR.GOV.BC.CA/EEC/STRATEGY/EEA/PAGES/DEFAULT.ASPX JANUARY 2014 PLEASE SUBMIT
BC Hydro Energy Star Appliances
 Impact Report BC Hydro Energy Star Appliances Prepared for: BC Hydro Power Smart Evaluation Prepared by: Table of Contents Table of Contents 1. INTRODUCTION... 1 1.1 BACKGROUND... 1 1.2 ENERGY STAR OVERVIEW...
Energy-saving tips. For apartments and condos. pse.com/multifamilyretrofit. Bellevue, WA Puget Sound Energy. P.O. Box /17
 1232 01/17 Puget Sound Energy P.O. Box 97034 Bellevue, WA 98009-9734 pse.com/multifamilyretrofit Energy-saving tips For apartments and condos In this guide 5 Heating 6 Water heating 7 Insulation 8 Air
Rainwater Harvesting Requirements Living Well Community October 2016/Harvey Harman
 Rainwater Harvesting Requirements Living Well Community October 2016/Harvey Harman Four main reasons Rainwater Harvesting is part of Sustainable Development and Green Building: 1. Resource conservation
Contents. General appliance information
 Contents Small Changes Make a Big Impact 3 Your Energy Costs 4 How to Calculate Your Energy Costs 5 Energy Saving Made Easy 6 Geysers Keep Your Bill Out of Hot Water 7 Lighting Smart 9 Standby Electricity
Would you like to reduce your electricity bill by hundreds of dollars a year? We ve put together a guide to show just how you can do this.
 Would you like to reduce your electricity bill by hundreds of dollars a year? We ve put together a guide to show just how you can do this. Even if you aren t able to make all the changes we suggest, changing
Home Energy Audit. Overview. Objectives. Time Requirements. Materials. Procedure CON EDISON WEB-BASED MIDDLE SCHOOL ACTIVITY
 CON EDISON WEB-BASED MIDDLE SCHOOL ACTIVITY Home Energy Audit Overview In this activity, students will complete a worksheet leading them to a better understanding of their (and their household s) electricity
LORE AcTIVITIES WATER ACTIVITY WORKSHEETS 1. GRAPHING. 2. SURVEY. 3. GRAPHING.
 1. GRAPHING. bath/shower toilet washing hands/face drinking brushing teeth ACIUAL INDIVIDUAL WATER USE bath/shower toilet washing hands/face drinking brushing teeth water you think you will use over the
Cool Savings Program Report
 Cool Savings Program Report Prepared by: Michael Fung Jennifer Wang San Francisco Department of the Environment 1455 Market St. Suite 1200 San Francisco, CA 94103 Technical Contributors: Denis Livchak
Water is a resource shared by all, and as Florida s population increases, so does the need for all of Florida s residents to conserve.
 St. Johns River Water Management District Home Water Use A Family Survey Water is a resource shared by all, and as Florida s population increases, so does the need for all of Florida s residents to conserve.
ENERGY STAR Program Overview
 ENERGY STAR Program Overview Craig D. Zamuda, Ph. D. Office of Policy and International Affairs US Department of Energy IEA Experts Group on Priority Setting and Evaluation -- April 27-28, 2010 1 Overview
Fifteen Years of Dehumidification Results from Heat Pump Water Heaters
 Purdue University Purdue e-pubs International Refrigeration and Air Conditioning Conference School of Mechanical Engineering 2016 Fifteen Years of Dehumidification Results from Heat Pump Water Heaters
Ways to Save. Energy efficiency tips to help you lower your monthly power bill. 1 Ways To Save
 Ways to Save Energy efficiency tips to help you lower your monthly power bill 1 Ways To Save 2 Ways To Save Money Saving Advice Jackson EMC is a good resource to use in your energy planning. We can show
LEAK DETECTION GUIDE
 LEAK DETECTION GUIDE Your Guide to Home Water Conservation CITY OF BELLEVUE UTILITIES WATER & SEWER DEPARTMENTS LEAK DETECTION GUIDE PAGE: 1 WHERE TO START If you receive a high water bill, or think there
WP4.3.3 Water distribution and users behavior Analysis Report Wrocław
 Project no. 4CE439P3 URBAN_WFTP Introduction of Water Footprint (WFTP) Approach in Urban Area to Monitor, Evaluate and Improve the Water Use WP4.3.3 Water distribution and users behavior Analysis Report
Riverdale NetZero Project Summary of Costs and Expected Performance
 Riverdale NetZero Project Summary of Costs and Expected Performance Natural Resources Canada Sustainable Buildings and Communities Edmonton, Ottawa 2009 January 07 Gordon Howell, P.Eng. 2008-2009 Progressively
Survey of Household Energy Use. Summary Report
 Survey of Household Energy Use 2007 Summary Report Natural Resources Canada s Office of Energy Efficiency Leading Canadians to Energy Efficiency at Home, at Work and on the Road To obtain additional copies
A storage solution: The role of off-peak electric heating in reducing fuel poverty
 A storage solution: The role of off-peak electric heating in reducing fuel poverty 02 Executive summary Fuel poverty continues to blight households across the UK. From inner-city suburbs to remote Scottish
BNWAT28: Water consumption in new and existing homes
 BNWAT28: Water in new and existing homes Version 1.0 This Briefing Note and referenced information is a public consultation document and will be used to inform Government decisions. The information and
Can Short Term ARRA Stimulus Funding Achieve Long Term Market Transformation? 1
 Can Short Term ARRA Stimulus Funding Achieve Long Term Market Transformation? 1 Jane Colby, Cadmus Group, Boulder, CO Scott Davis, Cadmus Group, Boulder, CO ABSTRACT The New York Energy $mart SM Products
TIPS ENERGY THE LESS YOU USE, 65 WAYS TO REDUCE HOME ENERGY USE THE MORE YOU SAVE CONSERVATION
 NEXT 1 ENERGY CONSERVATION TIPS THE LESS YOU USE, THE MORE YOU SAVE 65 WAYS TO REDUCE HOME ENERGY USE Conserving energy at home is an easy way to save money and help reduce your environmental footprint.
Solar Heat Pumps Domestic Range
 Solar Heat Pumps Domestic Range Who are Quantum? Quantum are the experts in Heat Pump Water Heating technology. Since 1977 we have been developing our patented technology, our products have been tried
MAKING IT GREEN AND SAVING ENERGY WITH NSP
 MAKING IT GREEN AND SAVING ENERGY WITH NSP Florida Housing Coalition Annual Conference September 2012 NSP PROGRAM BACKGROUND $ 3,296,917 in funding provided by Martin County 23 units of housing purchased
The Energy Center. Energy Efficiency. from the others.
 The Energy Center Center for Environmental Resource Management University of Texas at El Paso P.O. Box 68660 El Paso, Texas 79968 Energy Efficiency This material can be used in different ways, as posters,
Did you know that you pay for water three times? 1 You pay to buy it 2 You pay to heat it 3 You pay to get rid of it
 How to save water Did you know that you pay for water three times? 1 You pay to buy it 2 You pay to heat it 3 You pay to get rid of it How water is used in each area of the home There are many ways to
CHAPTER VI BUILDING PLUMBING
 CHAPTER VI BUILDING PLUMBING 6.1. INTRODUCTION The chapter covers questions related to water demand, distribution and drainage. The basic principles for planning and installing common plumbing systems
Energy Efficiency. Intercept HDDperDay <2e 16 kwhperday
 Energy Efficiency Energy Use of the Eco House Ben Francis Introduction: Three years ago one of the small houses owned by the college was altered with the goal of being more energy efficient. Among the
EnerSmart Programs CONSERVE SAVE PROFIT. Hot Water System. Profit from. hot water. system efficiencies. ... with. help from Union Gas
 EnerSmart Programs TM... with hot water Profit from hot water system efficiencies help from Union Gas TM Reducing hot water use has a double payback reducing saving on water charges and on the cost of
Strategies for Summer Utility Savings. Residential Environmental Program Series May 15, 2013
 Strategies for Summer Utility Savings Residential Environmental Program Series May 15, 2013 Are FC Summers Getting Hotter? 200 Fort Collins Annual Hours 90 F or Above 150 100 50 1970 1980 1990 2000 2010
Urban World Activity. Saving Water
 Saving Water : Do an Audit, Make a Pledge! This activity is all about saving water. Abu Dhabi has one of the highest rates of water consumption in the world, estimated at 550 litres of water per person
LEAK DETECTION GUIDE. Your Guide to Home Water Conservation. City of Norwalk Utilities Water & Sewer Departments
 LEAK DETECTION GUIDE Your Guide to Home Water Conservation City of Norwalk Utilities Water & Sewer Departments WHERE TO START If you receive a high water bill, or think there may be a leak in or around
Retrofitting a Multi-Unit Residential Building To Reduce Purchased Energy by a Factor of 10. Chris Richards
 Retrofitting a Multi-Unit Residential Building To Reduce Purchased Energy by a Factor of 10 Chris Richards MSc Candidate, Mechanical Engineering University of Saskatchewan Saskatchewan Research Council
How to save money on energy at home
 How to save money on energy at home A comprehensive guide with money saving tips on energy use and misuse LITTLE OCMULGEE This handbook was provided to you by: Please call Little Ocmulgee EMC with any
Living the (Solar) Dream Powering your lifestyle with the sun Ron Kube. Photo: Great Canadian Solar
 Dream Powering your lifestyle with the sun Ron Kube. Photo: Great Canadian Solar") Living the (Solar) Dream Powering your lifestyle with the sun Ron Kube Photo: Great Canadian Solar Today's talk ACT I Energy Efficiency (EE) ACT II Solar Energy (SE) ACT III Electric Vehicles (EV) What
Living the (Solar) Dream Powering your lifestyle with the sun Ron Kube Photo: Great Canadian Solar Today's talk ACT I Energy Efficiency (EE) ACT II Solar Energy (SE) ACT III Electric Vehicles (EV) What
Energy Conservation Workshop. SPONSORED BY: Xcel Energy
 Energy Conservation Workshop SPONSORED BY: Xcel Energy Survey What actions are you already taking to save energy in your home? Where does energy go? Why Energy Conservation? You can Use less energy Save
energy use introduction
 energy use 1/6 The use of energy in the home is the largest source of greenhouse gas emissions from Australian households. The average household s energy use is responsible for about eight tonnes of carbon
D8) Saving water and energy on water systems. W.G. van der Schee (1) Abstract. Keywords. 1 Introduction. (1)
 Saving water and energy on water systems. W.G. van der Schee (1) Abstract. Keywords. 1 Introduction. (1)") D8) Saving water and energy on water systems W.G. van der Schee (1) (1) w.g.vd.schee@wolterendros.nl Abstract The last decennia houses were more and more insulated to reduce the energy consumption for
D8) Saving water and energy on water systems W.G. van der Schee (1) (1) w.g.vd.schee@wolterendros.nl Abstract The last decennia houses were more and more insulated to reduce the energy consumption for
Let s Go Back to the Future!
 Let s Go Back to the Future! Welcome to the 2 nd Hot Water Forum Larry Weingarten and Gary Klein The Water-Energy-Greenhouse Gas Connection A Birdseye View Near Raleigh and Durham, North Carolina December
Celebrate Black Energy Awareness Month (BEAM) with the American Association of Blacks in Energy.
 with the American Association of Blacks in Energy.") Celebrate Black Energy Awareness Month (BEAM) with the American Association of Blacks in Energy. Welcome to our special spotlight on the important Black Energy Awareness Month, also known as BEAM. From
Celebrate Black Energy Awareness Month (BEAM) with the American Association of Blacks in Energy. Welcome to our special spotlight on the important Black Energy Awareness Month, also known as BEAM. From
...WHY WAIT? IT S TIME TO SWITCH TO A NORITZ TANKLESS
 ...WHY WAIT? IT S TIME TO SWITCH TO A NORITZ TANKLESS If you answered YES to one or more of these questions, maybe it s time to replace your old tank-type water heater with a new, high-efficiency, tankless
Every Drop Counts: Conserve WATER. Pamela R. Turner, Ph.D. Laurie Cantrell, MHS Winter School - January 22, 2008
 Every Drop Counts: Conserve WATER Pamela R. Turner, Ph.D. Laurie Cantrell, MHS Winter School - January 22, 2008 Fun Facts about Water Human body is 66% water A living tree is about 75% water Almost 80%
The Green Deal Occupancy Assessment
 The Green Deal Occupancy Assessment Outline of the Green Deal Home visit and the Occupancy Assessment 2 Outline of the Green Deal Home Visit Occupancy Assessment 1. Contact the customer in advance of the
managing electricity at home atcoenergysense.com
 managing electricity at home atcoenergysense.com Helping Yellowknifers make wise electricity choices Many of us don t realize the intricate processes behind generating, transmitting and distributing electricity,
TECHNICAL BRIEF BACKGROUND THE BIDGELY SOLUTION. Bidgely Hybrid Model. 100% Appliance Itemization
 TECHNICAL BRIEF 100% Appliance Itemization Technical Brief 100% Appliance Itemization THE GOAL: 100% Energy Breakdown BACKGROUND It is well-established that customer engagement - regardless of industry
Dissecting Rainwater Pump Energy Use in Urban Households
 Dissecting Rainwater Pump Energy Use in Urban Households Tjandraatmadja, G. 1, Pollard, C. 1, Sharma, A. 1 and Gardner, T. 2 1 CSIRO Land and Water, PO Box 56, Highett,Vic 3190 2 CSIRO Land and Water,
How to Use Less Energy & Save Money
 How to Use Less Energy & Save Money Community Energy Learning Series (CELs) February 15 th, 2017 Kieran O Neill MSc. CEA Smart Energy Business Strategist Sault Ste. Marie Innovation Centre CELs Objective
Water Conservation Tips
 Water Conservation Tips Saving water is easy and it starts with you! When you use water efficiently, you save money on your water, gas, and energy bills too. The average household spends as much as $500
Continuous Flow Hot Water
 Continuous Flow Hot Water Experience Our Innovation Experience Our Innovation For 40 years Australians have been enjoying the comfort, convenience and reliability of Rinnai gas appliances. Our innovative
ENERGY CONSUMPTION OF HOUSES AND LIFESTYLE IN COLD CLIMATIC AREA OF JAPAN
 -9 The 5 World Sustainable Building Conference, Tokyo, 7-9 September 5 (SB5Tokyo) ENERGY CONSUMPTION OF HOUSES AND LIFESTYLE IN COLD CLIMATIC AREA OF JAPAN Kahori GENJO Dr.Eng. Shin-ichi MATSUMOTO Dr.Eng
ENERGY & WATER EFFICIENCY: HOME ASSESSMENTS. Jim Riggins Monument, CO
 ENERGY & WATER EFFICIENCY: HOME ASSESSMENTS Jim Riggins Monument, CO Overview Home Energy Efficiency Basics Sample Energy Audit Results The Professional Energy Audit Benefits of Energy Efficiency U.S.
Focused Evaluation of Rainwater Harvesting: A Case Study in Sandakan, Sabah, Malaysia
 Focused Evaluation of Rainwater Harvesting: A Case Study in Sandakan, Sabah, Malaysia A. I. Che-Ani 1, N. Shaari 1, H. Yahaya, M. Jamil 1, N. Mohd-Tawil 1, M.F.M. Zain 1 1 Department of Architecture, Faculty
A. Product data. Unless otherwise indicated, submit the following for each type of product provided under work of this Section:
 This is a guidance document with sample specification language intended to be inserted into project specifications on this subject as appropriate to the agency's environmental goals. Certain provisions,