You have made quite a report. It looks like you've put in a lot of time and have come up with a detailed analysis.
|
|
|
- Oscar Foster
- 6 years ago
- Views:
Transcription
1 Preface This independent equity research is a sample that support my equity analytical skills and therefore is a for a widely-based usage. I claim no rights on this analysis. The company has been chosen due to its high-quality reporting standards and the simplicity of its business model. Those two factors enforce my in-depth understanding of the business and therefore enhance my visibility over the long-run. I have noted in advance where I have used excerpts of information. The reason behind is not to omit an important information that might be vital for a decision-making. Also parts of some sections (especially one for competition and markets) are based predominantly on Assa Abloy s annual reports and their opinion about the market and competitive environment. This must be taken into consideration, since using predominantly one source of information might be misleading. It is important to remark that I have used neither sell side equity reports, nor special (subscription based) industry analyses. In this respect, the analysis can be significantly improved (or spoiled) having those two in hand. This fundamental analysis is not suitable for short-term investing decisions. You will find no added-value if you are such an investor. This analysis is only suitable for long-term investors who base their decisions on fundamentals, not technical analysis. Krasimir Yuriev Yordanov Independent Equity Analyst Date: You have made quite a report. It looks like you've put in a lot of time and have come up with a detailed analysis. Michiel Bootsma, Senior Investment Manager at ING IM Yordanov, Independent Equity Research 1
2 Fundamental Equity Analysis of Assa Abloy AB Content Page 1. Summary 3 2. Company s Snapshot Key Ratios 4 3. Strategy 5 4. Market Presence 5 5. Value chain Products Cost-efficiency Competition Significant risks Management Shareholders Additional Financial Data Recommendation Bibliography My Investment Principles 51 Yordanov, Independent Equity Research 2
3 1. Summary Assa Abloy (Assa) is a Swedish company operating in the security business that produces opening door solutions. It s market capitalization is currently around SEK 77,8 billion. Its business model is simple, in a way that the company does not diversify horizontally. Assa Abloy is strictly focused only on products needed to open, manage, and close doors and entrances. From another hand, the Group is geographically diversified around the globe, giving Assa a competitive edge in terms of market presence and reach to emerging markets. Along with that, part of Group s strategy is also product leadership. There is a major industry shift from mechanical to electromechanical and hi-tech opening door solutions, where Assa Abloy seems to lead the pace. The company is strongly exposed to those fast-growing segments, giving it once again a competitive advantage. Assa Abloy sells through complex distribution channels aiming to reach its end-users, mainly commercial and residential customers. The nature of their business and variety of end-users require opening door companies to be very active in their relationships with the middle-men. Growth is achieved by combination of organic development and acquisitions which have accelerated in the past few years. Therefore, continues restructuring is needed to lower the cost of production and to achieve synergy effects within the Group. Cost-efficiency is the third pillar of their corporate strategy and the one of much attention. Assa Abloy CEO, Johan Molin, has done a good job in positioning the company at good place for further development, but COGS are difficult to manage. Company s profitability has not changed significantly since he took place in 2006, but Johan Molin is the one responsible for accelerating sales through good products positioned on the right markets. One of the biggest risks for the company is losing its current CEO. Competition. World s security market is very fragmented. Opening door solution providers operate mostly on their domestic markets, but Assa Abloy along with 4 major of its competitors, is well geographically diversified. In terms of reach to emerging markets Assa seems to hold the leadership. Company s shareholding structure is well diversified. Largest shareholders have always been strategic one, whereas big part of company structure is in hand of small shareholders. It is meaningful to note there are no large investment banks with major stakes into the company, which might mean two things: 1) either they don t even follow the company (and therefore could be misprices), or 2) they simply consider it as an overpriced investment. Both ways are important to be revealed. Assa Abloy operates in a market that is strongly independenet from government regulations. In my view, that significantly decreases the uncertainty and enhances visibility. Yordanov, Independent Equity Research 3

4 In conclusion, the company is well-positioned for further growth but it reveals signs of overpricing. Its valuation multiples are high which might shows the market has already recognized Assa Abloy s growth potential. Moreover, the acquisitions acceleration suggests that sustaining the same high growth rates in the future might be challenging. 2. Company s Snapshot Key Ratios Yordanov, Independent Equity Research 4

5 3. Strategy Assa Abloy s strategy is continuously adapting. Since the new CEO took place in late 2005 the Group made its strategy more distinctive. Even though the company had responded to the crisis very well with an actual no sales decline, the management came up with a new strategic plan in Company s strategy is divided into 3 core pillars: market presence, product leadership and cost-efficiency. Source: Assa Abloy, Annual Report 2011, page 37 Yordanov, Independent Equity Research 5

 represents their opinion about the industry this way: Globally, the lock market is still fragmented.")
6 4. Market presence 4.1 Security Market Assa Abloy estimates total security market to be worth over EUR 250 billion. The segment in which the Group is active accounts for around 15 percent of the total market. Moreover, the company estimates their market share of 10 percent of that segment in which they are positioned. Assa Abloy (AssaAbloy) represents their opinion about the industry this way: Globally, the lock market is still fragmented. However, the market in each country is relatively consolidated, as companies in the industrialized world are generally still family-owned and leaders on their home markets. They are often well-established and have strong ties with local distributors. In less developed countries, however, established lock standards and brands are less common. (15) Source: Assa Abloy, Annual report 2011, page 14 My calculation shows that their estimations about the market size and shares differ slightly but I can assume those approximations to be reliable. Source: Own estimates 4.2 Assa Abloy market position Company s strategy aims focusing on profitable commercial segment with high proportion of aftermarket sales and increased share of fast-growing electromechanical products. Emerging markets are expected to continue growing significantly faster than mature markets in a foreseeable future, and therefore remain company s main focus. Yordanov, Independent Equity Research 6
7 Assa Abloy is playing a role of market consolidator (more into the acquisition section). Also the company tries to lead the pace of market penetration, especially in emerging markets. Most of Assa s competitors are focused predominantly on their domestic markets (more into the competition section), whereas significant effort of Group strategy is to focus on new market penetration. Most of those geographical expansions come from acquisitions. The natural protection against weak markets (as the Group has shown during the crisis) is through global diversification. As you can see in the Division analysis there is a major shift towards Asia, where actually the growth comes from. Since the crisis came mature markets are weak and both growth in sales and EBIT are coming from Asia. Emerging markets accounts for some 25% of group s sales (which includes East Europe, Asia, South America and Africa). That is compared to 9% seven years ago (2004 th ). Note: The following paragraph with divisional presentation consists information (is an excerpt) directly taken from Assa Abloy s annual report (AssaAbloy). I have decided not to restate it in order not to omit important information. Assa Abloy is divided into three regional and two global divisions. The regional divisions manufacture and sell mechanical and electromechanical locks, cylinders and security doors adapted to the local market s standards and security requirements. The global divisions manufacture and sell electronic access control, identification products and entrance automation on the global market. 1. EMEA - EMEA division manufactures and sells mechanical, electromechanical and electronic locks, cylinders, security doors and fittings in Europe, the Middle East and Africa. 2. Americas - Americas division manufactures and sells mechanical and electromechanical locks, cylinders, security doors and door frames in North and South America. 3. Asia Pacific - Asia Pacific division manufactures and sells mechanical and electromechanical locks, cylinders, high-security doors and hardware in China, Asia, Australia and New Zealand. 4. Global Technologies - Global Technologies is produces electronic security solutions. The division consists of two business units: HID Global whichdeals with secure identification and access control solutions, and ASSA ABLOY Hospitality which operates in electronic lock systems and safes for hotels and cruise ships. Yordanov, Independent Equity Research 7


 Summary Divisional information throughout the years")
8 5. Entrance Systems - Entrance Systems division is a produce entrance automation products, components and service. The product range includes automatic swing, sliding and revolving doors, air curtains, gate automation, garage doors, industrial doors, docking solutions and hangar doors. (38-9) Summary Divisional information throughout the years Yordanov, Independent Equity Research 8

9 Note the CAGR development in the last 3 and 5 years of the corresponding division compared to the Group. As you can see weakness in Europe and Americas and rapid growth in Asia, keep in mind that most of the Entrance Systems divisions sales are coming from mature markets. Assa Abloy estimates the global door market to be worth around EUR 80 billion. Another important market for the company is the entrance automation market. It includes industrial doors, systems for loading docks and garage doors as is estimated at EUR 15 billion, according to the company. Forecast for division development As global markets recover I do expect more growth in EMEA and Americas (approximately 1% per year). As the number of employees decreased since 2006 from 70% to 40% of total, this trend is ought to continue. In the next 10 years this percentage might stabilize to 20% and remain so for the years afterwards. I have weak forecast regarding Asia s development. However, as some warning signs of decreasing growth rate of Chinese economy are current I should be more cautios. As the sales growth has been 25% per annum in Asia Pacific division this might lower to 15-20% for 10 years ahead. Yordanov, Independent Equity Research 9

10 4.3 How is the company selling? The company has been taking significant efforts to unite its sales force so that one sales person to offer all Assa s product range. Also, as the company reports 80% of Group products are double-branded with the local brand endorsed by the Assa Abloy brand. 20% are sold under global brands Yale, HID, Abloy and Mul-T-Lock focusing on emerging markets (look below). Source: Assa Abloy, Annual report 2011, page 17 More about different products in the products section later on. 4.4 Customers Assa Abloy is selling predominantly to commercial customers (75%), making it more or less B2B player. The rest 25% comes from residential market. The commercial segment comprises of institutional and commercial end-customers (referring to schools, hospitals, universities, airports and large office buildings). Installers and locksmiths are two of company s main sources of distribution and installation (you can read more into the value chain section). Yordanov, Independent Equity Research 10


11 The consumer market (25%) differentiates by the fact that private customers need extensive advice and assistance. Most of the sales are coming from replacements and renovations. For the consumer market the company distributes major part of its products in cooperation with door and window manufacturers. Source: Assa Abloy, Annual report 2011, page 15 Assa Abloy has competitive edge from its competitors by the composition of aftermarket- new constriction sales. Assa is well-protected from weak real estate construction market due to its heavy exposure to the aftermarket. This has protected Group sales from decline during the real estate burst. For the future such a structure should stabilize and secure growth, compromising with slower pace. 5. Value chain In today s security market, manufacturers of security product, such as Assa Abloy, mainly reach their endcustomers through a variety of distribution channels. Many of the Group s products are sold in small volumes to a large number of end-customers. Source: Own estimations, Company 5.1 Inputs The company buys materials (discussed in the expenses section), but mostly stainless steel. Therefore, market price development of stainless steel is influencing the business but the correlation is somewhat controversial (As you can also see in the material cost analysis section). In high-cost countries the shift form full production to final assembly continues. Therefore, the company must buy more components (mostly from suppliers from Asia) ready to be assembled. In low-cost countries the company is focusing on full production due to the low costs of production and personnel. Yordanov, Independent Equity Research 11


12 5.2 Distribution channels Source: Assa Abloy, Annual report 2011, page 18-9 Yordanov, Independent Equity Research 12


13 Assa Abloy has a very complex distribution channel structure. Its distribution network is consisted of many parties involved. As the market being still fragmented almost all around the globe the company is using the following distribution channels. I have ordered them by distance and complexity of services to the end-users. From designers and projectors Wholesaling Professional consultants Retailing/ link to residential customers Architects Distributors Security consultants Retailers Door and window Building and lock Security system integrators and Do-It-Yourself manufacturers wholesalers Security installers Locksmiths Hardware and security stores Source: Own estimations 5.3 End-users End-users are mostly commercial customers with 75% of Group sales. The residential market holds some 25%. Source: Assa Abloy, Annual report 2011, page 19 and official webpage Comment. Due to lack of sufficient information about the relationships with their distributors and suppliers I cannot continue deepening the analysis in this section. What we can assume with a high confidence is that Assa Abloy has been doing well in finding best approaches of reaching end-users, has used variety of channels on different markets and therefore possess experience to continue doing so, and also decreasing sales expenses witness the company (referring also to Johan Molin the CEO) has found and is finding better ways to sell cheaper to end-users. Source: Own estimations, Company Yordanov, Independent Equity Research 13

14 This graph shows that even if the selling expenses are decreasing in relation to sales, they are still growing in actual terms but with slower pace. CAGR in nominal values of selling expenses for the last 3 years is some 4%. 6. Products Highlights R&D increases; More engineers employed - 20% cumulative growth since 2007; Global common product platform; Fewer components; products from the last 3 years to exceeded 20% of sales for two consecutive years. 6.1 Product overview, classes and divisions Source: Own estimations, Company Assa Abloy is focusing on maintaining product leadership through implementation of the latest technologies into door opening solutions. As Johan Molin the CEO - says that Assa has strong competitive edge mostly because they respond faster to the changing door opening market conditions towards usage of electromechanical locks and technologies. Their competitors seem to still predominantly focus on mechanical locks more about that in the competition section. Assa Abloy management argues the company will be protected through its innovative products at least in a foreseeable future. It is notable to mention that the number of installed doors in the market fitted with some form of electromechanical solution is estimated at 3 to 5 percent. The company predicts rise to some 20% in the years to come (not verifying when), which should lead to further market development. However, as the company penetrates new emerging markets, which might demand cheaper products, this shift towards expensive electromechanical solutions could be slower than expected. The Entrance automation system is a new separate division since 2011 th. Its Head Juan Vargues has significant insider equity holding valuing to SEK 14,7 million as for the end of 2011 th. Entrance automation division unmerged from electromechanical locks, access control and identification technologies, taking almost half of the division s sales. It contributed also from Assa Abloy s largest acquisition ever Yordanov, Independent Equity Research 14

15 Crawford, which is heavily exposed to industrial door business and exposure to China. Entrance Systems division targets SEK 20 billion of sales until 2015, which accounts to 24% annual growth. I consider this as hardly possible, if not achieved through acquisitions. Forecast for products development Mechanical locks in the next 10 years I do expect mechanical locks to continue decreasing. The rate should sustain at around -5% per year but as Assa continues penetrating emerging markets this slide might slow down. The reason is that more and more customers from emerging markets will be willing to buy but their income will allow relatively cheap products as mechanical locks are. For the next 10 years mechanical locks class should sustain between 25-30% of group sales. Electromechanical locks this product class will accumulate the decrease coming from mechanical locks. I do expect them to sustain the growth levels of some 6-7% per year. Entrance automation in my view this is one of the product classes with brightest prospects. First, the company wouldn t separate it if they didn t expected rapid growth in the years to come. Electromechanical locks and Entrance automations should become the largest products classes in Security doors and hardware moderate growth of 1-2% can be expected for the future as well. 6.2 Products Assa Abloy offers products and services for opening, closing, and managing doors and entrance solution. The company is strictly focusing on door solutions and in this respect is not penetrating other market segments from the security industry. However, note that in actual term all products types are growing, including mechanical locks. The latter is decreasing only in relative terms. Yordanov, Independent Equity Research 15
 2.")
16 Assa Abloy reports the sales by product class. However, there is no further distinction and in this respect I have classified them by type. 1. Old Fashioned door opening solutions (Padlocks & Combination locks, Mechanichal locks and hardware) 2. High-tech door opening solution (Electromechanical & electronic locks, Acces control and identification, mobile keys, Aperio online access management, Hi-O networked access control, Keyless entry & virtual keys, RFID credentials, tags & readers, Smart cards & credentials) 3. Door automatics 4. Security solutions (Security doors and other doors, Hotel locks & security) 5. Door Closers (Door closers, Exit devices and panic devices) Most of the products have life-cycle of 10 to 15 years, according to the company. 6.3 Importance of products leadership Part of Group strategy is product leadership by which to achieve its target for organic growth of 5% per year. This long term shift towards more sophisticated opening door solutions creates higher demand for R&D. As witnessing, R&D costs as percentage of sales increases gradually mainly because of the greater number of engineers employed. Yordanov, Independent Equity Research 16
17 For a second consecutive year the sales of products developed in the past 3 years exceeded 20%. The target is 25% stressing on the importance of R&D to sustain growth rates. Assa Abloy is a great example of a nontechnological company that benefits from technological development. The company is simply implementing latest technological innovations into their business in order to sustain and maintain that product superiority. 7. Cost-efficiency This is the third pillar of Assa Abloy s strategy. To sustain cost-efficiency the Group must restructure constantly to integrate acquired companies and achieve synergy. Also, to accelerate its market development goals to penetrate new markets, and product leadership, the company must continue acquiring into the future as well. This process sustains the need for continues restructuring programs too. That has been the case since There have been more than four restructuring programs aiming 1) closure of production units in highcost markets 2) to lay off employees in high-cost markets, 3) switch from full production to final assemble in high-cost markets, 4) integration and synergy effects from acquired companies, all in order to increase its operating profit margin. Results: Total number of employees has been decreasing in high-cost countries: CAGR for 5 years of -4% in EMEA and CAGR for 5 years of -7% in Americas. This has led to significant decrease in total remuneration costs as percentage of sales mostly because of the production shift in Asia. From another hand, about 49% of the number of employees are still working in high-cost countries (West Europe, North America, and Australia), compared to 34% five years ago. And if the percentage of employees is 49%, the percentage of remuneration spent on those high-cost employees must be significantly higher (I assume some 70%) of total remuneration expenses. This reasoning strengthen the magnitude of this shift from full production to final assemble in mature markets. However, note that final assemble in high-cost countries as percentage of total production remains low. I do assume those two trends will continue in foreseeable future lowering remuneration expenses further down. There is still much room for improvement here taking into account still high percentages: 52% of total purchases of raw materials, components and finished goods in high-cost countries, 49% of employees is still employed there, and respectively at least 70% remuneration expenses goes to those employees in high-cost countries. Yordanov, Independent Equity Research 17


18 Source: Own estimations, Company Forecast for number of employees I do expect number of employees in Asia to reach 60% of total in 10 years from today. Switch from full production to final assembly in high-cost countries has been unsuccessful. As you can see the change in production structure have not changed when it comes to final assembly. It means that this process is yet to be unleashed. The management keep repeating how important that is and how this switch is a major component to achieve better cost-efficiency. However, I don t see positive results yet. From another hand, due to this major shift to Asia Pacific full production in highcost countries decreases. Source: Assa ABloy Operating profit margin keeps at the same level regardless of restructuring programs. It is important to note on the shift in cost structure. As you can see in the following chart operating expenses have decreased, indeed, significantly. This is mostly due to unified sales force and lower administrative expenses. However, note that the lack of operating profit margin development is caused by increased COGS. By looking at the expenses by nature we spot obsolete direct material costs. That is the highest increasing cost among all and most influential in the total cost structure. Yordanov, Independent Equity Research 18
19 More about costs can be read in Availability and price fluctuation of raw materials section. Commentary on Assa Abloy s Stategy First, I do think Assa Abloy has adapting its strategy to respond on current market conditions. As the markets were strong in Europe and North America prior to 2008 the Group benefited since more than 70% of sales have came from there. Back in 2008 th, the company was not that well diversified geographically. When mature markets started weakening, Assa started shifting both production and sales force to Asia. As we can see in the excel file (divisions sheet), Asia division gained importance, but with slight delay. It took one and a half years for the management to shift and start earning from Asia (which really started in 2010 th ). Even with that delay in responding to changed market conditions Assa Abloy s management showed they know how to update company s strategy to meet current demand. That is one important message. Yordanov, Independent Equity Research 19
20 Second, when having the right markets a company needs to offer the right products. As you can see more in the competitors analysis Assa Abloy is leading the pace of innovation and hi-tech opening door solutions. Today, mechanical locks accounts to less than 40% of Group sales. Still most competitors from the security market are strongly dependent on mechanical solutions an industry that is growing at global s GDP. In comparison, electromechanical solutions and entrance automations grow 2-3 times faster. It has been that way for a many years now giving the change to all competitors to start shifting. Assa has been responding to that among the fastest. That is a second strong message from the company and its management. They know their market and focus on products that will be important into the future. Third, cost-efficiency drive but results lag behind. Since the new strategy was adopted in 2009 the company put a strong accent on cutting its costs. Most of geographical changes to increase efficiency have been made in This process actually started back in 2006 when the new CEO renewed restructuring programs. However, I cannot see major change in operating income margins now, compared to the past. Still the company seems to have heavy expenses and those efforts of shifting production to low-cost countries and updating plants in high-cost countries from full production to final assembly do not turn into respective results. And as COGS are still 60-64% of sales, selling and administrative costs have declined significantly. That is a result from united sales force since 2009, which now corresponds to 80% of products sold under Assa brand. Another important cost R&D has been gradually increasing which I consider as a good sign helping company to sustain its product innovative position. In my view, the strongest negative effect on cost-efficiency is the high rate of acquisitions, which all have to be restructured once acquired. Acquisitions are part of Group strategy meaning that never-ending restructurings must be made in order to lower cost in different subsidiaries. And since the acquisitions serve the first two strategic objectives: to gain market presence and to sustain product leadership, it harms the third one -cost-efficiency. 8. Competition 8.1 Security market overview Assa Abloy is decomposing the security market to the following segments. Products supplied by the company accounts to some 15% of the whole EUR 250 billion of security market estimated in terms of size (more about that in the strategy section). However, the company considers security industry to be still fragmented in a global perspective. As Assa Abloy (AssaAbloy) states: Some countries have one strong manufacturer with a large share of the local market. These companies often focus on their domestic market and have relatively limited international operations. (15) Yordanov, Independent Equity Research 20
21 8.2 Direct competitors There are four major competitors that partly operate in Assa Abloy s segment: Ingersoll-Rand, Stanley Black & Decker, Dorma and Kaba. Two of these (Ingersoll-Rand, Stanley Black & Decker) are based in the USA and two (Dorma and Kaba ) in Europe. As we can witness into the analysis later on that these direct competitors are almost predominantly exposed to their domestic markets. However, compared to the market these are the companies having most international presence. Comment: It is worth saying that since Johan Molin took place Assa Abloy is not reporting in-depth analysis of the competitive environment. Therefore, much of the information is since 2005 when the last extensive presentation of the competition has been presented. Also, due to lack of industry analysis availability I have used all publicly available sources. This section can be significantly improved with access to security market researches. I have compared the main characteristics of Assa Abloy with four of its main competitors Ingersoll Rand, Dorma,Keba, and Stanley Black & Decker. Source: Own estimations, Company, Ingersoll Rand, Dorma, Keba, Stanley Black &Decker It is obvious that Assa Abloy is better positioned to meet future demand, especially compared to Ingersoll Rand. Dorma is not a public company and therefore there is insufficient financial information. Yordanov, Independent Equity Research 21
22 First, Assa is better protected from construction market downturns (like the one from be beginning of the crisis). The reason behind is smaller percentage of new construction compared to aftermarket sales for Assa Abloy (33%). Ingersoll Rand account for much higher (53%) and also strongly dependent on the U.S market. The difference is significant giving Assa a competitive edge under weak market scenarios. This has proved during the crisis by the fact Assa had no sales decline at all. Second, and maybe most importantly, Ingersoll Rand rely on 79% of its sales from Mechanical locks (note that this is only fraction of their Security Technologies division which is the peer division-competitor of Assa). Even though Ingersoll Rand is technologically-based company by nature, its update towards electromechanical solutions seems to lag behind. Still mechanical lock market is much larger but as witnessing from the Assa Abloy division analysis it is growing 6-7 times slower than electromechanical locks for the Group. I also witnessed that electromechanical division of Assa Abloy is growth approximately twice the rate of the whole electromechanical market. Third, Assa Abloys is better exposed to different markets, mostly Asia. If Ingersoll Rand is market leader in North America and Assa Abloy in Europe, then Asia is still underpenetrated market by international players. It is still very fragmented as well. Mature markets (North America and Europe) combined account for 76% of Assa sales, whereas the same percentage for Ingersoll Rand is 88%. Where Assa Abloy lags behind First, operating margin of Assa is much lower. Also the security division of Ingersoll Rand has much higher margin that rest of divisions. And even if when climate solutions (not in the periscope of Assa) are their core division the company will not neglect its most profitable Security Technology division since the operating margin is so high. From another hand, operating margin of Americas division for Assa Abloy is also about 20% - the highest among other divisions. In this respect, we may conclude the margins on the American market are slightly higher for all opening door companies operating there. Second, another bad sign of profitability for Assa is the fact Dorma better utilize its operations by generating more revenues per employee. One reason is Assa s high number of employees in Asia which generate less revenue per person, whereas Dorma operates strongly in Germany. It is also its largest market. However, considering those two competitive weaknesses of Assa Abloy we might suggest there is a problem with efficiency and extensive costs. Yordanov, Independent Equity Research 22

23 8.3 Ingersoll Rand overview Ingersoll Rand is the strongest competitor of Assa Abloy on an international level. The company is strongly exposed to the North American market and also it differs from Assa Abloy with its strategy of vertical diversification (compared to Assa which I consider strongly focused on door opening solutions only). Comment. Ingersoll Rand is strong but their core business is not security technologies. Just the opposite, small fraction from residential solutions and security technologies divisions are directly product-related competitors of Assa Abloy. Net revenue of EUR 1,2 billion for Security Technologies (compared to Assa with EUR 4,7 billion in total). Keep in mind that 19% of residential division also directly competes with Assa. That accounts to 0,3 billion more. In total Ingersell Rand sales EUR 1,5 billion (in current exchange rates) compared to EUR 4,7 billion of Assa Abloy. Therefore, to conclude, Assa is three times the size of Ingersell solely in the opening door solutions market. Security Technologies division peer division to Assa Abloy Source: Ingersoll Rand (Rand) Note they are still predominantly on mechanical solutions. That s a bit strange having in mind their technological capacity. Comment. As they have variety of products for home and offices I might expect their strongest strength to be full technologization of homes connecting all electronic devices within a single remote control, including the door opening and security. Moreover, as the markets almost everywhere are fragmented I do expect technological leaders (specialized in electromechanical solutions) to gain shares in the foreseeable future. Old-fashioned mechanical producers will compete with each other in an era of dying market. Competition for mechanical solutions will be too high and which will eat the profits. Most players will not be able to switch into electromechanical solutions since they will not have the sufficient technology to do so. Hundred of thousand local mechanical lock producers will close. Those trends support Assa Abloy s competitive position for the next at least 5-10 years in terms of technological superiority. That must keep competitors at bay and provide Assa with profits in a foreseeable future. Yordanov, Independent Equity Research 23
24 8.4 Dorma overview Dorma is a German premium player that is not yet a public company. Therefore, there is insufficient financial data. Note. This section an excerpt from Dormas (Dorma) official web-site. The purpose is to present briefly the company: With an international workforce of around 6,600 employees, the Group realised sales of million in fiscal year 2010/11 (June 30). The DORMA Group headquartered in Ennepetal, Germany, operates on an international scale with companies in 49 different countries. Dorma is active in the business segments: Door Control, Automatics, Glass fittings and accessories, Security/Time and Access (STA) and Movable Walls. The company sees itself as the trusted global partner for premium access solutions and services. Comment. Dorma business almost completely overlaps with this of Assa. They are strongly exposed in Germany- their domestic market, and pretend to be premium player. The numbers of employees account to only 16% of the workforce of Assa (which is 41070) but the sales are some 20% of ASSA. It means they capitalize workforce better to generate higher revenues. Since the beginning of 2011 th Dorma has a new executive management, including new CEO. Therefore, their results are yet to be revealed but their new strategy aims by 2020, the revenues to rise to 2 billion (accounting for some 10% CAGR until then) and return on sales to double. This would turn their global workforce to over 10,000 people (some 25% of today s Assa Abloy workforce). Forecast on competition I do see that Assa Abloy is currently well protected from competition. It operates strongly on new hi-tech opening door markets like electromechanical solutions and is well protected from downturn in real estate markets. Having those two important reasons I do see next 5 years to be pretty relived from competition which can allow the company to have higher profit margins. 9. Significant Risks These are the most significant risks as the company resents them. I will focus only on those I consider most important (those with Red dots). Competitors are covered in the separate section, more about Brand positioning can be found in the strategy section. Here I will focus only on Acquisitions, Raw materials and Currency risks. Yordanov, Independent Equity Research 24


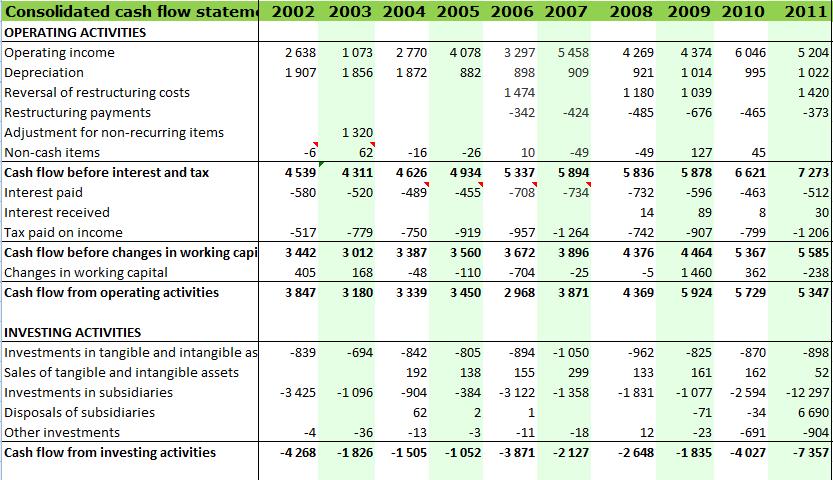
25 , Annual report 2011, page Acquisition of new businesses As we can witness the acquired growth accelerates in the last few years. This increases the risks of integrating those businesses and the overall synergy effect is challenged. The acquired growth in percentage is highest in 2002, 2010, and Note that since the current CEO - Johan Molin took place in 2006 (his first full year) the company started accelerating its acquisitions rates. The average growth rate from the last 3 years is 8% - the highest so far. Current management conveys acquisitions will be part of Group s strategy in the future as well. Therefore, I consider the risk of acquisitions to be Strong. Note that in 2011 solely the Group acquired companies for the value of 33% of its sales. Also, 1/5 th of the Goodwill is generated in Yordanov, Independent Equity Research 25
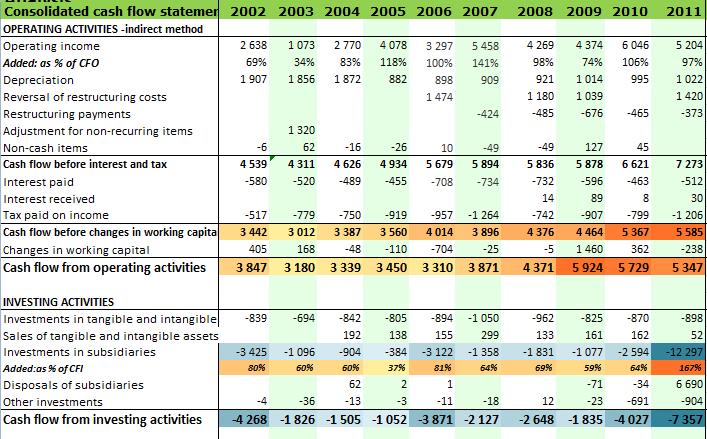
 shows the quantification of the acquisitions")
26 In the following graph we can see the acquisition payments in the Cash flow Statements as well. Red being the Cash flow from investing activities and the fraction of the CFI which is paid for investments in subsidiaries (in orange in the next chart) shows the quantification of the acquisitions throughout the time. By average above 60% of the CFI is spent on investments in subsidiaries, excluding 2011 where this percentage is much higher. Source: Own estimations, Assa ABloy Up-to-date acquisitions seems to well-fit the Group s structure and objectives for market penetration and product leadership. Expenses for acquisitions generate expenses for restructuring since most businesses must be restructured to cost-efficiency or final assembly in high-cost markets. By looking at the chart below we can witness that restructuring payments are small but increasing factor from the total cash outflows. Note the direct correlation between Restructuring payments and the acquired growth in %. Since 2006 we can notice that the higher the acquired growth, the higher the restructuring payments. However, unknowingly why that excludes 2011 th once again. Yordanov, Independent Equity Research 26
 used in production.assa does not enter into financial commodity hedge contracts. The most important metal used is Stainless steel.")
27 9.2 Availability and price fluctuation of raw materials Commodities used as components The Group is exposed to price risk related to purchases of certain commodities (primarily metals) used in production.assa does not enter into financial commodity hedge contracts. The most important metal used is Stainless steel. Yordanov, Independent Equity Research 27
28 July 2012 Fundamental Equity Analysis of Assa Abloy AB Forecast of expenses by nature I do expect restructuring costs to continue increasing mainly due to further acquisitions that are expected. Also due to that remuneration of employees must decrease but not as fast as it has been decreasing. Potentially it might reach 25% in I have no visibility of direct material costs development and therefore will decline forecasting it. 40,000 AKSteel 316 Price development ($) 30,000 20,000 10,000 0 Source: It is important to note that correlation between AKSteel 316 price and direct material costs is weak. There must be other factors which I don t know about to influence the direct material costs. And since the remuneration of employees keep on decreasing (tackled by manufacturing shift to low-cost countries) the material costs keep on increasing as a fraction of both expenses and sales. Component supply is outsourced to external suppliers in low-cost countries. That is an effort to decrease total cost of production but material costs increases due to the fact those components are purchased in a ready-to-use condition, but most importantly at higher price. Source: Assa Abloy, Annual report 2011, page 30 Yordanov, Independent Equity Research 28


29 Inventory efficiency A good sign towards higher efficiency is the faster work in progress utilization. There is a graduate downward trend showing the company progress its processes faster over time. Source: Own estimations Summing all those reasons I consider risk of raw materials and their costs as very high. 9.3 Currency risk Note. The next three paragraphs are excerpts from Assa s annual report (AssaAbloy) and represent their opinion about currency risk: Source: Company, annual report 2011, page 111 Translation exposure is primarily related to earnings in USD and EUR. This type of exposure is not hedged. Currency risk in the form of transaction exposure, i.e. the relative values of exports and imports of goods, is fairly limited in the Group, though it is expected to increase over time. Transaction exposure. Currency risk in the form of transaction exposure, or exports and imports of goods respectively, is relatively limited in the Group. The main principle is to allow currency fluctuations to have an impact on the business as quickly as possible. As a result of this strategy, current currency flows are not normally hedged. A general weakening of the Swedish krona leads to an increase in net debt, but at the same time increases Group equity. At year-end, the largest foreign net assets were denominated in USD and EUR. (65) Yordanov, Independent Equity Research 29
, there is a major shift both in terms of revenues and EBIT coming from emerging markets.")
30 Along with Assa Abloy s market penetration development the currency risk is increasing. As you can further look at the excel file (sheet divisions), there is a major shift both in terms of revenues and EBIT coming from emerging markets. This process will continue increasing the currency risk even further into the future and as company expands geographically the effect will be significant. The exchange rate effect on sales growth is strong. Its significance seems to decrease over time, which contrivers with my assumptions. The mean of y-o-y change in exchange rate effect on sales growth is decreasing over time. However, note 2009 when the contribution was 9% - highest ever. This percentage strongly affects the mean for the last 3 years, deflating significantly its value. However, as the currency risk is not hedged, greater geographical diversification inevitably will increase that risk further. Currency dependence trends The US dollar importance is decreasing over time. These findings are supported by the Americas division weakening (in terms of EBIT and sales) and due to USD sales as percentage of Group sales. 1/4 th is still coming from the US but this fraction gradually tends to decrease. China has been growing with some 40% a year in the past 9 years and therefore their Yuan becomes from major importance. Yordanov, Independent Equity Research 30


 up to 5%.")
31 Sensitivity analysis of currency risk In the worst case scenario if SEK weaken compared to all other currencies the net effect on Income before tax will be 11%. That is hardly likely especially having in mind that in the past 10 years the SEK has been pretty stable compared to both USD and EUR. By looking at the exchange rates graph we spot several years of abnormal changes which tend to smoothen over time However there might be some years when EUR or the USD to influence the Income before tax with (I suppose) up to 5%. More than that is hardly likely. Source: Oanda (Oanda) Source: Own estimations Source: Assa Abloy, annual report 2011, page 111 Yordanov, Independent Equity Research 31

 which is spotted in the Mean-9, 5, and 3.")
32 10. Management The group has been successful in the past 5 years strongly because of Johan Molin the CEO. He took place in December 2005 and his full first year was Prior to him obviously unsuccessful CEO was managing the company for three years from 2003 to As results witness Johan Molin continued the growth prior to 2003 and also protected to company from downside during the crisis. Source: Assa Abloy, Annual report 2011, page 1 Sales growth has been accelerating (mostly due to acquisitions) which is spotted in the Mean-9, 5, and 3. Red flag is the accelerating COGS too (more about that in a separate analysis section). However, he has stabilized the net profit margin between 7 and 11%. Yordanov, Independent Equity Research 32

33 And if net profit margin has been increasing over time, slow synergy effects of acquired subsidiaries has decreased the generating of revenues per assets. There is a negative correlation between the total asset turnover and current year acquired growth. The more company acquires the less revenue is generated as % of assets. That is what has happened in the period and th. Financial leverage has been decreasing correspondingly with the gradual equity increase over time, especially since Johan Molin took place Incentives for the Executive Management Johan Molin has strong stock incentive to increase shareholders value. Note, the last line in the following graph, where his annual remuneration is only some 21% of the equity holding he possesses. He has SEK 126 million in equity holdings where his annual remuneration is some SEK 26,5 million. That incentive program is strongly encouraging. Moreover, his fixed salary is only 44% of total remuneration. To sum, Johan Molin is very well incentivized to continue performing well into the future. Yordanov, Independent Equity Research 33

34 Comment. One of the company key advantages is its great reporting standards (that is the reason why I chose this company in particular). Assa Abloy has been in top 50 of companies with best reporting standards including all financial information and statements in the past few years. It has not been that way prior to that. This honor has been an effect of Johan Molin s policy for transparency and honesty. If the management want to be sincere with its shareholders, that is a great way to do it. I am strongly in favor of such managers and therefore the company. Comment. I must comment on the fact Johan Molin has been a CEO for more than 6 years already. His capabilities of leading the group toward success are obvious. What I am cautious with is whether he will continue being CEO into the future and whether his motivation to continue improving company s value will last for long. After six years (and that is only something we can hope) his internal drive for good performance might decrease. However, there is no sign for that so far. Johan Molin is well positioned, 52 years old, successful CEO of Assa Abloy. In this respect, losing him might be a big risk for the group and for us as potential shareholders. Yordanov, Independent Equity Research 34

35 10.2 Summary of MD&A 10.3 Other Executive Managers Incentives Most of the executive managers have been employed by the group for a long time. The newest managers are Carolina Dybeck Happe CFO in 2012, and Johan Persson Head of Asia Pacific division in All others have been employed for at least 8 years. It s also significant to note that huge incentive stimulus difference between the CEO and other executive managers. As you can see in the summary most of them have at least SEK 2m in equity possession compared to the CEO owning SEK 126 m. Yordanov, Independent Equity Research 35

36 Also notice that the most important divisions and their heads are not incentivized by importance. EMEA, American, and Asia Pacific divisions contribute to the highest fraction of both sales and EBIT. However, their Heads possess relatively small shareholding compared to other executive managers. That is not desirable as long as there are other factors, which I don t know about, reasoning that current incentive structure. Conclusion I do consider the current executive management as one of the key strengths of Assa Abloy. As the CEO has been leading the pace towards innovation, Assa Abloy s shareholders have enjoyed increasing value of equity. We must keep an eye on the new CFO an important role into the company and the expected change (in late 2012) in Chair of Board of Directors. These are two important events. If they don t change something dramatically and if Johan Molin sustain its drive for performance we should expect satisfactory results. Management is the key role into the company. Yordanov, Independent Equity Research 36


37 11. Shareholders 12.1 Share capital Note. These two paragraphs are an excerpt from Assa Abloy s (Abloy) official web-site. ASSA ABLOY s share capital at 31 December 2011 amounted to SEK 368,250,378, distributed among 19,175,323 Series Av shares and 349,075,055 Series B shares. All shares have a par value of SEK 1.00 and provide the holders with equal rights to the company s assets and earnings. Each Series A share carries ten votes and each Series B share one vote. ASSA ABLOY s Series B share has been listed on NASDAQ OMX Stockholm, Large Cap since 8 November The number of shareholders at year-end was Investors outside Sweden accounted for around 64 percent of the share capital and around 44 percent of the votes, and were mainly in the USA and the United Kingdom. Source: Assa Abloy Source: Assa Abloy Yordanov, Independent Equity Research 37
38 Source: Assa Abloy 11.2 Shareholders structure Assa Abloy shareholding structure seems to be favorable. First it is very diverse meaning that in 2011 th top 3 shareholders accounted for only 24% of capital and 48% of votes. Top 10 shareholders account for 39% and 58% respectively. Those findings reveal the fact that Assa Abloy tend to have open policy for new shareholders and no single policy-maker. Second, there is no institutional shareholding from major investment banks. Most importantly there has never been which might mean two things. Either the company is still undervalued (big players are not following it), or simple they don t consider it as a good investment. In my analysis I will not pay much of attention on what others think about the stocks but this is one sign of strongly possible positive/negative characteristic of the company. I tend to favor companies with no institutional shareholding especially from global largest asset managers. If they are not following the company (it might be cause of the Swedish Krone exposure which they d better avoid) the upside potential can be encouraging. Third, most of shareholders are Swedish-based which once again support the reasoning the Assa Abloy might be undiscovered from international asset managers. Therefore if Swedish companies invest (and they know Swedish public companies best) and nobody else is doing it, it can be a kind of insider joker for us. Yordanov, Independent Equity Research 38

39 Forth, the biggest shareholders are Investment AB Latour and Melker Schorling accounting for 42% of voting rights altogether. Note what has happened in 2011 th. Sakl and Investment AB Latour merged and voting rights of Invesmtnet AB Latour stroked by 14% to 30% in total. I consider that as a good sign since both businesses have been long-term investors in Assa meaning they know the business well and they do see potential. They are among the shareholders knowing best what is happening inside the company. They have been with the business for a long time and I do expect them to sustain that major shareholding. Few minor shareholding changes occurred since 2008 (since the crisis). By 3% both of Capital Group Funds and Harris Associates increased their voting rights (accounting for 4 % and 5% capital increase respectively), while Alecta and Oppenheimer Funds decreased their voting rights by the same percentage (both decreased by 4% of capital). Most meaningful is the selling off by Alecta which has always been a long-term investor (presuming they know the company well) but also have been trading 1-2% on year-toyear base. Yordanov, Independent Equity Research 39
 possessed by top 10")

40 Interesting to mention is one fact concerning the liquidity. Between 15 and 20% of shares (as % of total capital structure of Assa Abloy) possessed by top 10 shareholders change hand in a single year. That means that up to 20% of Assa s capital is traded by their largest 10 shareholders. It worth comparing with other companies something I have not done. Yordanov, Independent Equity Research 40

41 12.3 Information about major shareholders Investment AB Latour Note. Parts of this section are an excerpt from Investment AB Latour s (Latour) web-site. Business.Latour is a mixed investment company whose business concept is to invest with a long-term perspective in sound companies that have their own products and that are considered to have a good internationalisation potential. Latour is characterised by a deep respect for the know-how in good companies. The company is e primarily active as members of the board of a company. Shareholding in Assa Abloy. 44% of the Investment AB Latour capital is invested in Assa Abloy in terms of market value. In 2011 th solely Investment AB Latour acquired 13% of the voting rights in Assa reaching 30% in total. Gustaf Douglas holds 80% of the voting rights in Investment AB Latour. He is the ultimate policy maker. Latour buys Assa Abloy shares for the first time in Source: Investment AB Latrour A brief introduction is used from Wikipedia.org (Wikipedia) Gustaf Archibald Siegwart Douglas (born 3 March 1938) is a Swedish businessman and politician, member of the Royal Swedish Academy of Engineering Sciences since Gustaf Douglas has made his fortune from the security business which is his core competence. In its latest annual report Latour presents its merger with Saki briefly this way: (Latour) Merger between Latour and Saki. In 2011 Latour and SäkI merged under the name Latour - a company capable of making major investments. The similarity between Latour s and SäkI s strategies facilitated the merger. They also had similar core holdings and a somewhat similar owner structure. (2) Melker Schorling Note. This is an excerpt from Melker Schorling s (Schorling) official web-site. Melker Schörling AB (MSAB) origins from Melker Schörling's investment background which started by investing into Securitas in MSAB as a holding company was founded in In 2006 the company was listed at Nasdaq OMX Stockholm, Large cap. MSAB is an active holding company which works for Yordanov, Independent Equity Research 41
42 long-term industrial development. Currently, MSAB is a large shareholder in seven publically listed companies, where all of them have a clear strategy and continued strong development potential. Assa accounts to some 13% of Melker Schorling assets. In 1994 the company first acquires shares of Assa. It s biggest holding (57%) is Hexagon. Founded in 1975, Hexagon is a leading global provider of integrated design, measurement and visualisation technologies. Comments regarding major shareholders Even if Latour holds 30% of the voting rights it holds only 10% of the share B of Assa meaning that predominant part of the shareholders hold small fractions of the company. Top 3 shareholders hold only some 24% in 2011 up from 16% in That means the share price is strongly related to the public opinion. Even if Latour and Melker Schorling do not trade (as they have always been long-term investors) they hold only some 15% of Class B shares (which are listed). So, the multiples play significant role for the price development. 61% of the stocks are traded by out of top 10 shareholders giving Assa a very fragmented shareholding structure. Yordanov, Independent Equity Research 42


43 12. Additional Financial Data Yordanov, Independent Equity Research 43

44 Yordanov, Independent Equity Research 44

45 Yordanov, Independent Equity Research 45

46 Yordanov, Independent Equity Research 46
47 Yordanov, Independent Equity Research 47
48 Yordanov, Independent Equity Research 48

49 Yordanov, Independent Equity Research 49

50 Source: Own Estimates, Assa Abloy 13. Recommendation I will make no recommendation for an investment. As stated in the preface section this analysis purpose is to support my equity analysis expertise, not to be an investment recommendation. Moreover, giving one might be misleading without decent valuation. I aim to provide you with the tools needed to make an informed decision, not to recommend one. End Yordanov, Independent Equity Research 50
Annual Report The global leader in door opening solutions
 Annual Report 2011 The global leader in door opening solutions The global leader in door opening solutions Contents Annual Report 2011 Cover photograph: Camille Smith Camille Smith, who works in accounting
Q3 Report Johan Molin President & CEO
 Q3 Report 2011 Johan Molin President & CEO 1 Financial highlights Q3 2011 Good performance in a weak market Continued strong growth in Asia Stable but slow development in mature markets South America slowing
P R E S S R E L E A S E
 P R E S S R E L E A S E from ASSA ABLOY AB (publ) Stockholm 8 November, 1999 no. 16/99 INTERIM REPORT JANUARY-SEPTEMBER 1999 Sales increased by 19% to SEK 7,532 M (6,317) Income before taxes increased
Introduction to ASSA ABLOY
 The ASSA ABLOY Group is the world s leading manufacturer and supplier of locks and associated products, dedicated to satisfying end-user needs for security, safety and convenience. Roadshow Q1 2001 Introduction
Annual Report More and more homes are being equipped with smart door locks for improved safety, security and convenience
 Annual Report 2017 The global leader in door opening solutions More and more homes are being equipped with smart door locks for improved safety, security and convenience Contents Report on operations ASSA
Year-end end report 2000
 The ASSA ABLOY Group is the world s leading manufacturer and supplier of locks and associated products, dedicated to satisfying end-user needs for security, safety and convenience. Year-end end report
Annual Report The global leader in door opening solutions
 Annual Report 2010 The global leader in door opening solutions Contents Online Annual Report ASSA ABLOY s online Annual Report has many user-friendly functions. The texts can be read out loud and the financial
Press release from ASSA ABLOY AB (publ)
") Press release from ASSA ABLOY AB (publ) 5 November, 1998, No. 16 INTERIM REPORT, JANUARY-SEPTEMBER, 1998 Sales increased by 28% to 6317 MSEK (4949) The organic sales growth for comparable units amounted
Press release from ASSA ABLOY AB (publ) 5 November, 1998, No. 16 INTERIM REPORT, JANUARY-SEPTEMBER, 1998 Sales increased by 28% to 6317 MSEK (4949) The organic sales growth for comparable units amounted
Pre-seen case study for Strategic level examinations Papers E3, P3 and F3. For examinations in May 2014 and September 2014
 Pre-seen case study for Strategic level examinations Papers E3, P3 and F3 For examinations in May 2014 and September 2014 PRE-SEEN MATERIAL, PROVIDED IN ADVANCE FOR PREPARATION AND STUDY FOR THE EXAMINATIONS
HORNBACH Baumarkt AG Group Q3/9M 2017/2018
 HORNBACH Baumarkt AG Group Q3/9M 2017/2018 Quarterly Statement as of November 30, 2017 2 HORNBACH BAUMARKT AG GROUP QUARTERLY STATEMENT: 3 RD QUARTER AND 1 ST NINE MONTHS OF 2017/2018 HORNBACH BAUMARKT
Annual Report The global leader in door opening solutions
 The global leader in door opening solutions Contents Cover photograph: The Clarion Hotel Sign in Stockholm uses the latest security solutions from ASSA ABLOY, including doors equipped to identify the user
The ASSA ABLOY Group is the world s leading manufacturer and supplier of locks and associated products, dedicated to satisfying end-user needs for
 The ASSA ABLOY Group is the world s leading manufacturer and supplier of locks and associated products, dedicated to satisfying end-user needs for security, safety and convenience. Nine months report 2000
Steinhoff: is bigger better?
 Dirk van Vlaanderen - Associate Portfolio Manager From its humble beginnings in the 1960s - when German founder, Bruno Steinhoff, began sourcing Eastern European furniture for import to Western Europe
Arun Nayar Senior Vice President, Finance and Treasurer
 Arun Nayar Senior Vice President, Finance and Treasurer November 18, 2010 Forward-Looking Statements / Safe Harbor Certain statements in this presentation are forward-looking statements within the meaning
INVESTOR NEWS /16
 Düsseldorf, 14.12.2016 1/8 INVESTOR NEWS 1-2015/16 METRO GROUP meets sales and earnings targets in financial year 2015/16 EBIT from continuing operations before special items reaches 1,560 million (2014/15:
METRO GROUP continues operational improvement trend in 2014/15
 15 December 2015 1/11 METRO GROUP continues operational improvement trend in 2014/15 EBIT before special items totalling 1,511 million, influenced by the negative impact of exchange rate effects amounting
ASSA ABLOY acquires 63.6 percent of the shares in Cardo and launches a recommended public offer to the remaining shareholders
 This press release is not and must not, directly or indirectly, be distributed or made public in Australia, Canada, Japan, New Zealand or South Africa. The offer is not being made to persons in those jurisdictions
Supplemental Consolidated Financial Data for Fiscal 2011 Third Quarter and Nine Months ended December 31, 2010
 Supplemental Consolidated Financial Data for Fiscal 2011 and, 2010 February 2, 2011 Panasonic Corporation Note: SANYO and its subsidiaries became Panasonic s consolidated subsidiaries in December 2009.
Lowe's Companies Inc (LOW) - Financial and Strategic SWOT Analysis Review
 - Financial and Strategic SWOT Analysis Review") Lowe's Companies Inc (LOW) - Financial and Strategic SWOT Analysis Review Lowe's Companies Inc (LOW) - Financial and Strategic SWOT Analysis Review The Business Research Store is run by Sector Publishing
Lowe's Companies Inc (LOW) - Financial and Strategic SWOT Analysis Review Lowe's Companies Inc (LOW) - Financial and Strategic SWOT Analysis Review The Business Research Store is run by Sector Publishing
DISPOSAL GALERIA KAUFHOF. 15 June 2015
 DISPOSAL GALERIA KAUFHOF 15 June 2015 DISCLAIMER AND NOTES To the extent that statements in this presentation do not relate to historical or current facts, they constitute forward-looking statements. All
An introduction to ASSA ABLOY
 An introduction to ASSA ABLOY The global leader in door opening solutions Jennifer Low, Sales Manager ASSA ABLOY Entrance Systems in Singapore, one of ASSA ABLOY s 47,500 employees around the world. ASSA
Following is a presentation that is to be given at the Macquarie Australia Conference in Sydney today, Wednesday, 2 May 2018.
 2 May 218 The Manager Company Announcements Office Australian Securities Exchange Dear Manager, MACQUARIE CONFERENCE BRIEFING PRESENTATION Following is a presentation that is to be given at the Macquarie
HORNBACH Holding AG & Co. KGaA Group. 1 st QUARTER 2018/19
 HORNBACH Holding AG & Co. KGaA Group 1 st QUARTER 2018/19 Quarterly Statement as of May 31, 2018 2 HORNBACH HOLDING AG & CO. KGaA GROUP STATEMENT ON 1 ST QUARTER OF 2018/19 HORNBACH HOLDING AG & CO. KGaA
CONSUMER BRANDS GROUP
 CONSUMER BRANDS GROUP AARON M. ERTER PRESIDENT CONSUMER BRANDS GROUP Forward Looking Statement The presentations today will contain certain forward looking statements," as defined under U.S. federal securities
HORNBACH Holding AG & Co. KGaA Group. 1 st QUARTER 2017/2018
 HORNBACH Holding AG & Co. KGaA Group 1 st QUARTER 2017/2018 Quarterly Statement as of May 31, 2017 2 HORNBACH HOLDING AG & CO. KGaA GROUP QUARTERLY STATEMENT: 1 ST QUARTER OF 2017/2018 HORNBACH HOLDING
METRO GROUP achieves sales target and confirms EBIT guidance
 19 October 2015 1/5 METRO GROUP achieves sales target and confirms EBIT guidance Like-for-like sales growth of 1.5% in financial year 2014/15 Growth drivers online retail and delivery remain successful
Q order intake and sales
 Q1 order intake and sales Solid order intake: 3.0 billion, up 34% Sales: 3.4 billion, up 7.2% on an organic basis 1 (up 4.1% on a reported basis) All financial objectives confirmed Thales (Euronext Paris:
CREATING TWO INDEPENDENT INTERNATIONAL LEADERS. 30 March 2016
 CREATING TWO INDEPENDENT INTERNATIONAL LEADERS 30 March 2016 To the extent that statements in this presentation do not relate to historical or current facts, they constitute forwardlooking statements.
DataDot Technology Limited ABN Securities Exchange Announcement
 DataDot Technology Limited ABN 54 091 908 726 Securities Exchange Announcement 30 th January 2014 Market Update Growth Strategy Being Implemented Background As enunciated at the AGM in November, the company
2018 HALF-YEAR RESULTS SHAREHOLDER QUICK GUIDE
 2018 HALF-YEAR RESULTS SHAREHOLDER QUICK GUIDE 1 GROUP PERFORMANCE SUMMARY We are pleased to provide shareholders with a summary of Wesfarmers Limited s results for the half-year ended 31 December 2017.
INVESTOR PRESENTATION
 TOUCHCORP LIMITED ASX:TCH WWW.TOUCHCORP.COM INVESTOR PRESENTATION $25.6M CAPITAL RAISING SEPTEMBER 2016 TOUCHCORP LIMITED 1 TOUCH SERVICE OFFERING TOUCHCORP NOW OFFERS ITS CUSTOMERS A COMPLETE OMNI-CHANNEL
Interim Report HORNBACH-BAUMARKT-AG GROUP
 Interim Report HORNBACH-BAUMARKT-AG GROUP 1st QUARTER 2006/2007 (MARCH 1 MAY 31, 2006) HORNBACH-Baumarkt-AG Group Interim Report (IFRS): First Quarter of 2006/2007 (March 1 May 31, 2006) 2 Pleasing business
ACCEPT HAIER NEW ZEALAND INVESTMENT HOLDING COMPANY LIMITED S $1.20 CASH OFFER FOR ALL YOUR SHARES IN FISHER & PAYKEL APPLIANCES HOLDINGS LIMITED.
 ACCEPT HAIER NEW ZEALAND INVESTMENT HOLDING COMPANY LIMITED S $1.20 CASH OFFER FOR ALL YOUR SHARES IN FISHER & PAYKEL APPLIANCES HOLDINGS LIMITED. CERTAIN CASH IN AN UNCERTAIN MARKET REALISE THE VALUE
The NASDAQ 35th Investor Program. November 30,
 R The NASDAQ 35th Investor Program November 30, 2016 1 Forward Looking Statements Certain statements made in this presentation that are not based on historical information are forward-looking statements
For personal use only TOUCHCORP 1H2015 RESULTS PRESENTATION DATED: THURSDAY, 27TH AUGUST 2015
 TOUCHCORP 1H2015 RESULTS PRESENTATION DATED: THURSDAY, 27TH AUGUST 2015 DISCLAIMER The material in this presentation has been prepared by Touchcorp Limited ARBN 603 731 184 (Touchcorp) and is general background
2006 in brief. Important events
 Annual Report 2006 Contents ASSA ABLOY in brief 1 CEO s statement 2 Vision and strategy 6 The Market 8 ASSA ABLOY s products 12 Sustainable development 16 Our employees 18 EMEA division 20 Americas division
Steinhoff International, MARKUS JOOSTE HISTORY AND DEVELOPMENT OF STEINHOFF
 Steinhoff International, MARKUS JOOSTE HISTORY AND DEVELOPMENT OF STEINHOFF WELCOME 2 HISTORY: STEINHOFF INVOLVED IN HOUSEHOLD GOODS TRADING SINCE 1963 1963-1990: Sourcing in the East for the West City:
DrKW Capital Goods Conference
 DrKW Capital Goods Conference 17 March 2004, United Kingdom Halma p.l.c. Stephen O Shea, Group Chief Executive After introducing himself and welcoming his audience of analysts and fund managers, Stephen
Principal Brands UK and Northern Ireland
 Profile UK and Ireland based Building Materials Group Principal activities Builders and Plumbers Merchanting DIY Retailing in Ireland Dry Mortar Manufacturing Annualised turnover over 2.8 billion Market
G4S Investor Presentation John Kenning, Regional CEO, North America. NYC December 2017
 G4S Investor Presentation John Kenning, Regional CEO, North America NYC December 2017 G4S Transformation G4S Today Leading global security company: Secure and Cash Solutions Advantages of global scale
Annual Report The global leader in door opening solutions
 Annual Report 2007 The global leader in door opening solutions Contents Cover photograph: Smart Lock makes it easier to use access control systems. The lock is low in power consumption and runs on batteries,
Almacenes Éxito S.A. Consolidated Financial Results
 Almacenes Éxito S.A. Consolidated Financial Results For the second quarter and six-month period ended June 30, Viva Caucasia Shopping Mall BVC (The Colombian Stock Exchange): ÉXITO ADR Program: ALAXL Medellín,
Investor Briefing. ADT Caps Acquisition. SK Telecom
 ADT Caps Acquisition SK Telecom 208. 5. 8 0 ADT Caps Acquisition Disclaimer This presentation contains forward-looking statements with respect to the results of operations and business of SK Telecom (the
ScS Group Plc Interim Results For The 26 Weeks Ended 24 January 2015 March 2015
 ScS Group Plc Interim Results For The 26 Weeks Ended 24 January 2015 March 2015 October 2014 H1 2015 Highlights Financial Highlights: Like for like sales order intake up 7.8% Flooring up 13.0% Total sales
More the More Merrier A. Kumar.
 More the merrier Aditya Birla Retail, part of the AV Birla Group, is pressing ahead with aggressive expansion plans, rolling out hundreds of outlets of its chain of supermarkets and hypermarkets. A report
FY2017 Consolidated Business Results May 9, 2018 Toshiba Tec Corporation
 FY2017 Consolidated Business Results May 9, 2018 Toshiba Tec Corporation Content 01 Key Messages 02 FY2017 Consolidated Business Results 03 FY2018 Forecast 1 Key Messages Toshiba Tec achieved the highest
FINANCIAL STATEMENTS Stockmann Group 15 February 2017
 FINANCIAL STATEMENTS 2016 Stockmann Group 15 February 2017 YEAR 2016: OPERATING RESULT BACK TO PROFIT Gross margin 53.4% (50.6%) Adjusted operating profit, EUR mill. -20.2 (-28.5) Reported operating profit,
Decorative Architectural Products. Jeff Filley / President Masco Coatings Group
 Decorative Architectural Products Jeff Filley / President Masco Coatings Group Safe Harbor Statement This presentation contains statements that reflect our views about our future performance and constitute
2010 Electrical Products Group Conference
 2010 Electrical Products Group Conference Ed Breen Chairman & Chief Executive Officer May 19, 2010 Forward-Looking Statements / Safe Harbor Certain statements in this presentation are forward-looking
Global Water Pipeline Leak Detection System (LDS) Market: Trends, Opportunities and Forecasts ( )
 Market: Trends, Opportunities and Forecasts ( )") Global Water Pipeline Leak Detection System (LDS) Market: Trends, Opportunities and Forecasts (2015-2020) By Technology Equipment, Inspection Service By Equipment Acoustic, Non Acoustics By Type Continuous
Global Water Pipeline Leak Detection System (LDS) Market: Trends, Opportunities and Forecasts (2015-2020) By Technology Equipment, Inspection Service By Equipment Acoustic, Non Acoustics By Type Continuous
Needham Growth Conference January 10,
 R Needham Growth Conference - 2017 January 10, 2017 1 Forward Looking Statements Certain statements made in this presentation that are not based on historical information are forward-looking statements
Handelsbanken's Mid/Small Cap seminar SVP, Arja Talma June 16, 2014 Stockholm
 Handelsbanken's Mid/Small Cap seminar SVP, Arja Talma June 16, 2014 Stockholm Kesko today Kesko s net sales 9.3bn - K-Group s sales 11.6bn 2,000 stores in eight countries Over 1.3 million customer visits
The NASDAQ 37th Investor Program. December 5,
 R The NASDAQ 37th Investor Program December 5, 2017 1 Forward Looking Statements Certain statements made in this presentation that are not based on historical information are forward-looking statements
2011 Fourth Quarter Results
 2011 Fourth Quarter Results February, 2012 INVESTOR RELATIONS Disclaimer The financial information in this document are consolidated earnings results based on K-IFRS. The previous earnings results have
Electrical Products Group Conference. 21 / May / George Oliver, Chief Executive Officer
 Electrical Products Group Conference 21 / May / 214 George Oliver, Chief Executive Officer Forward-Looking Statements / Safe Harbor This presentation contains a number of forward-looking statements. In
Acquisition Butler Manufacturing Company
 Acquisition Butler Manufacturing Company Presentation to Investors Kirby Adams, CEO & Managing Director 16 February 2004 Acquisition Cost Cash offer of US$22.50 per share Transaction Value US$ Million
NASDAQ OMX 30th Investor Program December 3, 2013
 NASDAQ OMX 30th Investor Program Forward Looking Statements Certain statements made in this presentation that are not based on historical information are forward-looking statements which are made pursuant
Stable sales excluding petrol (at constant exchange rates) Q sales inc. VAT: 22.7bn
 Q sales inc. VAT: 22.7bn") Q1 2009 sales incl. VAT 16 April 2009 Stable sales excluding petrol (at constant exchange rates) Q1 2009 sales inc. VAT: 22.7bn o Q1 2009 sales including VAT: 22.7bn, 1.4% at constant exchange rates o
Q1 2009 sales incl. VAT 16 April 2009 Stable sales excluding petrol (at constant exchange rates) Q1 2009 sales inc. VAT: 22.7bn o Q1 2009 sales including VAT: 22.7bn, 1.4% at constant exchange rates o
Annual General Meeting 2017 Review by the President and CEO. Mikko Helander
 Annual General Meeting 2017 Review by the President and CEO Mikko Helander Group Management Board Mikko Helander Jukka Erlund Johan Friman Terho Kalliokoski Anne Leppälä-Nilsson Matti Mettälä Lauri Peltola
For personal use only
 PROPOSED MERGER OF AFTERPAY AND TOUCHCORP 30 MARCH 2017 INTRODUCTION MERGER IMPLEMENTATION AGREEMENT SIGNED BETWEEN AFTERPAY AND TOUCHCORP ON 30 MARCH 2017 RATIONALE ACCELERATE GROWTH PROFILE OF AFTERPAY
Earnings Presentation Second Quarter September 2012
 Earnings Presentation Second Quarter 2012 September 2012 Key Issues First Half 2012 Cencosud Projects Second Quarter Results Company overview Key metrics (2Q12) Number of stores: 920 Selling space: 3,495,857
Earnings Presentation First Quarter May 2012
 Earnings Presentation First Quarter 2012 May 2012 Company overview Key metrics (LTM 2012 1 ) Number of stores: 906 Selling space: 3,3 million sq 2 Number of customers: 800mm Number of employees: 139,082
I. EXECUTIVE SUMMARY 3 III. MAIN EVENTS IN THE PERIOD 6 IV. RETAIL INDICATORS 7 V. REVENUES BY BUSINESS UNITS 9 VI. CREDIT INDICATORS 11
 I. EXECUTIVE SUMMARY 3 II. CONSOLIDATED INCOME STATEMENT AS OF SEPTEMBER 30, 2010 4 III. MAIN EVENTS IN THE PERIOD 6 IV. RETAIL INDICATORS 7 V. REVENUES BY BUSINESS UNITS 9 VI. CREDIT INDICATORS 11 VII.
HONEYWELL ANNOUNCES PLANNED PORTFOLIO CHANGES
 Contacts: Media Investor Relations Scott Sayres Mark Macaluso (480) 257-5921 (973) 455-2222 scott.sayres@honeywell.com mark.macaluso@honeywell.com HONEYWELL ANNOUNCES PLANNED PORTFOLIO CHANGES Plans to
FY2017 First Six Months Consolidated Business Results
 FY2017 First Six Months Consolidated Business Results November 8, 2017 Content 1. Key Messages 2. FY2017 First Six Months Consolidated Business Results 3. FY2017 Forecast 1 Key Messages Operating income
CanaccordGenuity Growth Conference. August 9,
 R CanaccordGenuity Growth Conference August 9, 2017 1 Forward Looking Statements Certain statements made in this presentation that are not based on historical information are forward-looking statements
Temperature Rises as Products Compete in the Heat. Market. Contact: Tim Page Press Release No: 20. Release date: Immediate Date: 11/11/09
 Press Article www.bsria.co.uk Temperature Rises as Products Compete in the Heat Market Contact: Tim Page Press Release No: 20 Release date: Immediate Date: 11/11/09 BSRIA have recently completed a worldwide
Q4 Report 2013/ June Klas Balkow CEO
 Q4 Report 2013/14 11 June 2014 Klas Balkow CEO Agenda Q4 2013/14 Full year 2013/14 Strategic priorities Events after period-end Q&A 2 High energy and strong position 185 stores in 5 countries omni-channel
Half yearly report to shareholders six months to 31 December 1999
 Half yearly report to shareholders six months to 31 December 1999 Wesfarmers Limited ACN 008 984 049 Interim highlights Operating revenue up 4.3 per cent to $1.6 billion Operating profit after tax before
SEB Seminar. CFO Jukka Erlund Copenhagen
 SEB Seminar CFO 8.1.2015 Copenhagen Kesko today Kesko s net sales 9.2bn - K-Group s sales 11.4bn Net sales Q4/13-Q3/14 9,166m 2,000 stores in eight countries Over 1.3 million customer visits every day
Matas FY/Q4 2016/17 Results
 Matas FY/Q4 2016/17 Results Forward Looking Statements This presentation contains statements relating to the future, including statements regarding Matas A/S future operating results, financial position,
May 24, 2018 Frankfurt/Main. DVFA Analyst Meeting May 2018 HORNBACH Group 2018
 HORNBACH Baumarkt AG DVFA Analyst Meeting May 24, 2018 Frankfurt/Main Page 1 Financial Calendar 2018 HORNBACH Group June 22, 2018 Financial Update: 1st Quarter of 2018/19 as of May 31, 2018 July 5, 2018
ÅF GROUP Q Jonas Wiström, CEO Stefan Johansson, CFO
 ÅF GROUP Q4 2016 Jonas Wiström, CEO Stefan Johansson, CFO 20XX-XX-XX 1 ÅF has assignments around the world 100 ÅF is currently active in 107 countries 11 BN SEK Net Sales Approx. 11 BN SEK 9,000 Employees
Attention ASX Company Announcements Platform. Lodgement of Open Briefing.
 Attention ASX Company Announcements Platform. Lodgement of Open Briefing. Wesfarmers Limited Wesfarmers House 40 The Esplanade Perth Western Australia 6000 Date of Lodgement: 16-May-2003 Title: Open Briefing.
Q1 Report 2014/ September Klas Balkow CEO
 Report 2014/15 10 September 2014 Klas Balkow CEO Agenda 2014/15 Events after period-end Strategic priorities Q&A Store opening in Levanger, Norway, in June 2014 2 High energy and strong position 186 stores
SHAREHOLDER QUICK GUIDE 2016 FULL-YEAR RESULTS
 SHAREHOLDER QUICK GUIDE FULL-YEAR RESULTS FULL-YEAR RESULTS SHAREHOLDER QUICK GUIDE Group performance summary GROUP PERFORMANCE SUMMARY We are pleased to provide shareholders with a summary of Wesfarmers
Update - Home Improvement
 12 August 2014 Update - Home Improvement Woolworths Limited (Woolworths) today provided an update to the market on its Home Improvement business. Key points Update on financial results with losses in FY14
B&M European Value Retail SA Interim Results Presentation 26 weeks to 23 rd September 2017
 B&M European Value Retail SA Interim Results Presentation 26 weeks to 23 rd September 2017 Interim FY18 Group Highlights Group revenues increased by 21.7% to 1,346.4m B&M LFL revenues +7.5%, Q2 LFL +7.7%
Combination to Create a Leading Commercial Real Estate Credit REIT with Approximately $5.5 Billion in Assets and $3.4 Billion in Equity Value
 Colony NorthStar, NorthStar Real Estate Income Trust and NorthStar Real Estate Income II Announce Creation of Colony NorthStar Credit Real Estate, Inc. Combination to Create a Leading Commercial Real Estate
1st Quarter Results & Financial Position, Ended March Shimadzu Corporation
 1st Quarter Results & Financial Position, Ended March 2018 Shimadzu Corporation Statement of Sales were strong, effectively increasing about 8 %, excluding exchange rate effects. Operating income effectively
2017 Half-year Results Supplementary Information
 207 Half-year Results Supplementary Information To be read in conjunction with the 207 Half-year Results Briefing Presentation to be held on Wednesday, 5 February 207 Presentation outline Item Page Group
INVESTOR PRESENTATION SEPTEMBER 2017
 INVESTOR PRESENTATION SEPTEMBER 2017 AGENDA 01 G4S Overview 02 03 H1 17 Results Looking Ahead 04 Q&A 2 G4S TRANSFORMATION G4S TODAY Leading global security company: Secure and Cash Solutions Advantages
FISHER & PAYKEL APPLIANCES HOLDINGS LIMITED
 FISHER & PAYKEL APPLIANCES HOLDINGS LIMITED 5 YEAR STRATEGIC PLAN PRESENTATION 10 September 2012 September 2012 INVESTOR PRESENTATION 1 IMPORTANT DISCLAIMER This presentation includes certain forward-looking
Global Air Conditioner Market Research Report - Global Forecast to 2022
 Report Information More information from: https://www.wiseguyreports.com/reports/817505-global-air-conditioner-market-research-report-globalforecast-to-2022 Global Air Conditioner Market Research Report
BUSINESS. Earning. the
 By Bill Sendelback Flying under the radar has been a successful strategy for Sherwood Industries. Since its start in 1989 as a small wood stove manufacturer, Sherwood has grown into one of North America
Q results and strategic update October 25, Hans Stråberg President and CEO
 Q3 2005 results and strategic update October 25, 2005 Hans Stråberg President and CEO Agenda Electrolux Third Quarter Presentations 14.00 Strategic update and Q3 results Hans Stråberg, CEO Fredrik Rystedt,
Bathroom Newsletter August 2011
 Bathroom Newsletter August 2011 International Market Strategy Topics BRG News Sweden Germany BAUHAUS Starts Online Business HORNBACH First Quarter Results Germany BAYWA Denies Rumours On Possible Acquisition
The 29th Annual Cowen Health Care Conference March 18, Jim Green, President & CEO Analogic Corporation
 The 29th Annual Cowen Health Care Conference March 18, 2009 Jim Green, President & CEO Analogic Corporation 1 Safe Harbor Statement Any statements about future expectations, plans, and prospects for the
How Massmart grew Builders to market-leading behemoth
 How Massmart grew Builders to market-leading behemoth Author: Hilton Tarrant for www.moneyweb.co.za Date: 26th September 2016 A big bet in 2003 has paid off, and then some. In just over a decade, Massmart
Forget about keys! Upgrade your doors to Aperio
 Forget about keys! Upgrade your doors to Aperio Wireless lock technology with online and offline door control. Aperio is a new technology developed to complement new and existing electronic access control
Medical and Graphic Imaging
 (4) Notes Regarding Going Concern Assumptions None. (5) Segment Information [1] Segment Three months to December 31, 2009 (From October 1, 2009 to December 31, 2009) External Medical and Graphic Sensing
Recommendation: HOLD Estimated Fair Value: $45-51*
 Recommendation: HOLD Estimated Fair Value: $45-51* 1. Reasons for the Recommendation After conducting a thorough business and industry analysis, I recommend holding the stock. My estimated fair value for
INVESTOR PRESENTATION DECEMBER 2017
 INVESTOR PRESENTATION DECEMBER 2017 AGENDA 01 G4S Overview 02 03 9M 17 Update Looking Ahead 04 Q&A 2 G4S TRANSFORMATION G4S TODAY Leading global security company: Secure and Cash Solutions Advantages of
Making the world a safer place to travel QUIXOTE CORPORATION
 Making the world a safer place to travel QUIXOTE CORPORATION MISSION ENHANCE THE SAFETY, EFFICIENCY & SECURITY OF TRANSPORTATION SYSTEMS WORLD WIDE. BUSINESS SEGMENTS PROTECT & DIRECT: Provide products
METRO GROUP continues slight sales growth and confirms EBIT guidance
 1/6 METRO GROUP continues slight sales growth and confirms EBIT guidance Like-for-like sales growth of 0.2% in financial year 2015/16 METRO Cash & Carry and Real increase like-for-like sales in Q4; Media-
2016 First Quarter Results
 LOTTE SHOPPING CO., LTD 2016 First Quarter Results May, 2016 INVESTOR RELATIONS Disclaimer The financial information in this document are consolidated earnings results based on K-IFRS. This release includes
Company Presentation. 1H 2014 Results and Performance August 15, 2014
 Company Presentation 1H 2014 Results and Performance August 15, 2014 Disclaimer These presentations and/or other documents have been written and presented by Puregold Price Club, Inc. (PGOLD). PGOLD is
Adding Value to Our Customers Products and Services ANNUAL REPORT 06 FTK
 Adding Value to Our Customers Products and Services 20 ANNUAL REPORT 06 FTK FLOTEK INDUSTRIES IN SUMMARY Flotek Industries, Inc is a diversified global supplier of drilling and production related products
Ben Gordon Chief Executive
 Interim Results 18 th November, 2009 Ben Gordon Chief Executive Performance highlights Group sales +7.9% to 387.3m Group network sales up 13.6% to 549.1m Group underlying profit before tax +11.1% to 10.0m