NORTHWEST OCOEE SECTOR STUDY RENAISSANCE PLANNING GROUP SUBMITTED BY: IN ASSOCIATION WITH
|
|
|
- Matthew Gilmore
- 5 years ago
- Views:
Transcription


1 NORTHWEST OCOEE SECTOR STUDY SUBMITTED TO: SUBMITTED BY: City of Ocoee RENAISSANCE PLANNING GROUP IN ASSOCIATION WITH May 2006
2 NORTHWEST OCOEE SECTOR STUDY Submitted to: City of Ocoee Submitted by: Renaissance Planning Group MAY 2006
3 TABLE OF CONTENTS EXECUTIVE SUMMARY...1 PROJECT CONTEXT...1 PROJECT PURPOSE...2 RECOMMENDED PLAN: A VISION FOR THE NORTHWEST SECTOR...3 CONCLUSION INTRODUCTION NORTHWEST OCOEE REGIONAL CONTEXT MARKET ANALYSIS Residential Development Nonresidential Development NORTHWEST SECTOR VISION SCENARIO EVALUATION Base Scenario Adopted Future Land Use Plan Scenario A Scenario B Scenario C SCENARIO COMPARISON SECTOR-LEVEL RECOMMENDATIONS TRANSPORTATION Key Recommendations Existing Conditions UTILITIES Water System Existing Wastewater System LAND USE AND URBAN DESIGN PLACE-LEVEL RECOMMENDATIONS MIXED-USE CENTER CRAFTSMAN DISTRICT SITE-LEVEL RECOMMENDATIONS BUILDINGS AND FRONTAGES BUILDING RECOMMENDATIONS Building Massing Spatial Enclosure Building Articulation Building Entrance PARKING Organizing Parking Facilities FISCAL IMPACT AND PROJECT PHASING REVENUES TABLE OF CONTENTS
4 8.1.1 Ad Valorem Taxes Impact Fees Revenue Forecasts EXPENSES Future Expenses Detailed Capital Expenses Project Phasing IMPLEMENTATION SUMMARY OF ACTION ITEMS Sector-Level Actions Place-Level Actions Site-Level Actions Financing the Improvements List of Figures Figure 1 Northwest Ocoee Regional Context Figure 2 Scenario A Figure 3 Scenario B Figure 4 Scenario C Figure 5 Crown Point PUD Figure 6 Impact of scenarios on the Northwest Sector with planned road improvements Figure 7 Existing roadway network, Figure 8 Maitland Boulevard Extension Figure 9 Impact of scenarios in the Northwest Sector with recommended improvements Figure 10- Minimum access management standards Figure 11 Walking path Figure 12 Shared use path Figure 13 Multi-modal improvements in the Northwest Sector Figure 14 Proposed water system Figure 15 Proposed wastewater system Figure 16 Paved crosswalks highlight crossing points for pedestrians and serve as a visual indicator for motorists Figure 17 Conceptual main street cross-section Figure 18 Conceptual neighborhood street cross-section Figure 19 Use of hardscaping enhances roadway Figure 20 Quality street trees and landscaping Figure 21 Stormwater may be used as an amenity Figure 22 Conceptual gateway treatment Figure 23 Mixed-use center development standards TABLE OF CONTENTS
5 Figure 24 Conceptual craftsman district development standards Figure 25 Effect of building massing Figure 26 Effect of spatial enclosure Figure 27 Example of well-articulated building Figure 28 Arcade front Figure 29 Shop front Figure 30 Stoop front Figure 31 Dooryard front Figure 32 Common yard front Figure 33 Building entrances oriented to the street reduce walking distances and help create a continuous street wall over time Figure 34 Surface parking infill development over time Figure 35 Project Phasing List of Tables Table 1 - Development Standards for Northwest Ocoee...9 Table 2 Summary of Recommended Capital Projects Table 3 Comparison of socioeconomic data Table 4 Comparison of land use acreage Table 5 Summary of cost estimates Table 6 Access management standards for the Northwest Sector Table 7 Cost summary for water system upgrades Table 8 Average property values Table 9 City of Ocoee impact fee rates Table 10 Population Assumptions, Table 11 Tax Rates for Other Sources Table 12 City of Ocoee Expenses Table 13 Fiscal Impact Summary, Northwest Ocoee, Table 14 Recommended Capital Projects Table 15 Special District Financing Strategies Table 16 Implementation Steps APPENDIX A: NORTHWEST SECTOR MARKET ANALYSIS APPENDIX B: NORTHWEST SECTOR UTILITIES ANALYSIS TABLE OF CONTENTS
6 EXECUTIVE SUMMARY PROJECT CONTEXT Carefully planned growth in Northwest Ocoee has the potential to make a positive economic, cultural and civic impact on the City of Ocoee. However, orderly and well-planned growth that adds value to the City and its residents cannot happen without a substantial public investment and attention to the details of urban form and compatible land uses. That investment includes extension of sewer lines and additional plant capacity, improving transportation facilities, and preparing design standards for the high-growth interchange areas at West Road and SR 429 and Silver Star Road and SR 429. Against that backdrop, the Northwest Ocoee Sector Study builds upon unique conditions of the study area that include the presence of SR 429 (Western Expressway) and its two interchanges, which connects the Sector and the City to the broader Central Florida region; a shift in demographics as a result of higher paying jobs and improving access to regional employment centers, evidenced by the presence of new, upscale residential subdivisions; and the gradual transformation of Lake Apopka into an attractive natural amenity. Those conditions favor the Northwest Sector s emergence as an important gateway to the City of Ocoee with more diverse land uses fitting the area s changing character. As stated above, the Northwest Sector faces a set of challenges that will require a significant public investment. The area s development potential is limited due to the lack of public infrastructure, particularly sewer. An initial investment of $9.4 million to the sewer system is needed to spur quality development in the area, which in turn will generate higher property tax revenues to pay off that initial investment. Finding the right balance between public investment and the rate of return on the investment is an important goal of this study. As illustrated in, the study area is located near several other municipalities, including the cities of Winter Garden to the west, Apopka to the north, and the remainder of the City of Ocoee to the south and east. Lake Apopka, located northwest of the study area, provides a natural boundary to the City. The study area boundaries are: the SR 429/Western Expressway to the north, Silver Star Road to the south, East Crown Point Road and Lake Apopka to the west, and Lakewood Avenue to the east. The area is roughly 4.8 square miles, or 3,300 acres, and comprises roughly one-quarter of the City s land area. The area s current function in a regional context is that of fulfilling the demand for residential, suburban neighborhood-related uses. Should Ocoee desire to dramatically change the destiny of the Northwest Sector, it must carefully examine what changes are feasible and desirable based on an examination of existing and future infrastructure needs and costs, market potential and community input. EXECUTIVE SUMMARY 1 68

7 Northwest Sector Regional Context PROJECT PURPOSE The purpose of the Northwest Ocoee Sector Study is to prepare a market-based assessment of alternative land use scenarios to define an economically viable vision for the area. Ultimately, the goal is to develop a vision for the Northwest Sector that reflects local priorities and sound economic strategy for the City. In support of these goals, the study addressed the following: Determine how much development can occur given the infrastructure needs and associated costs; Determine the financial feasibility of needed public investments based on potential and desired growth in the study area; Satisfy policies in the City s adopted Comprehensive Plan to define and establish an Interchange Impact Area to guide growth that best fits the character of the area; Provide a degree of development certainty for landowners, and an expectation of required public facilities and services that would need to support any change in development intensity; and NORTHWEST OCOEE SECTOR STUDY 2 68
8 Ensure the Northwest Sector develops in a way that is compatible with the rest of the City, yet is differentiated by having its own distinct character. RECOMMENDED PLAN: A VISION FOR THE NORTHWEST SECTOR This study seeks to answer what is the vision for the Northwest Sector of Ocoee? as well as identify supporting implementation policies to support the vision. Northwest Ocoee is already growing, as evidenced by the presence of new, upscale subdivisions near Lake Apopka. The area s re-emerging natural assets, such as Lake Apopka, the presence of the West Orange Trail, the new Ocoee High School, and the availability of vacant tracts of land near the Western Expressway/SR 429 interchanges all lend themselves to the development potential of the area. In sum, the Sector has a multitude of positive attributes that ensure its place in the regional market given current and projected demand for growth. However, for this Sector to be successful in the long term and maintain a competitive advantage in a regional economy, the recommended scenario is for a high-quality, well-disciplined and mixed-use character of development. Furthermore, for this preferred vision to be successful, a commitment by the City to making investments to the area s infrastructure is a critical and necessary first step. The City of Ocoee has a unique opportunity to provide a sustainable vision for development in the area. The recommended plan is based upon close coordination with the City of Ocoee, City residents and detailed technical analysis as to the feasibility of various scenarios in the study area. Described below, the key factors or themes used to develop the plan include infrastructure investments, including an enhanced multimodal roadway network; and design guidelines and identification of mixed-use focal points. Invest in Public Infrastructure Provide Sewer and Water A constraint to development in the Northwest Sector is the lack of public infrastructure, particularly the absence of sanitary sewer. In order to attract significant development, the City will need to invest in the sewer infrastructure of the area. Needed investments include upgrades to the wastewater treatment plant and extending the sewer lines into the sector. In addition, the Northwest Sector needs increased capacity on the water network, water transmission mains to provide enough capacity to serve new development, and a water treatment plant. The initial capital cost to these improvements is projected to be roughly $16 million. However, the benefit to the City resulting from the increased tax base and impact fee revenues will outweigh the cost over time. It is an investment that will pay dividends. EXECUTIVE SUMMARY 3 68
9 Strengthen the Roadway Network As the Northwest Sector develops, the need for a stronger transportation network that provides connectivity among uses and mobility throughout the study area will grow. Transportation constraints already exist: there are few east-west connections serving the area and Clarcona-Ocoee Road is already operating at a failing level of service. Orange County has delayed funding for widening this roadway indefinitely, with no plans for construction through To accommodate anticipated growth and provide improved mobility, the plan makes transportation recommendations that include several roadwidening projects and new local roadway alignments and extensions. Specific recommended improvements include: Widen Ocoee-Apopka Road from two to four lanes throughout the study area to facilitate the efficient north-south traffic flow. Accelerate widening of Clarcona-Ocoee Road from two to four lanes from West Road to Clarke Road. Widen West Road from two to four lanes from SR 429 to Clarcona-Ocoee Road. Realign the Clarcona-Ocoee Road/West Road intersection. Orange County has planned for this project in the past, but funding has always been an issue. However, even if funding for this project materializes, four lanes on Clarcona-Ocoee Road is not expected to be adequate to handle projected traffic by Therefore, realignment of the Clarcona-Ocoee/West Road intersection will be necessary to help redirect traffic and relieve pressure on the road segment. Widen Fullers Cross Road from two to four lanes from Ocoee- Apopka Road to Clarcona-Ocoee Road. Widen Clarcona-Ocoee Road from two to four lanes from Lakewood Avenue to West Road. Realign Fullers Cross Road/Clarcona-Ocoee Road/Lakewood Avenue intersection. Extend Wurst Road by constructing a new two-lane road from Lakewood Avenue to Ocoee-Apopka Road. This will provide an additional east-west roadway connection. A specific alignment has not been determined at this time, but this project would be largely developer-driven. Realign Silver Star Road at the intersections with Bowness Road. Widen Silver Star Road from two to four lanes from East Crown Point Road to realigned Silver Star Road. Build new, two-lane connections from Story Road to Silver Star Road to the south and to Ocoee- Apopka Road to the north. To reduce vehicle conflicts and excessive delays, street networks must avoid concentrating travel to a few roads. The dispersal of vehicle loads allows streets to be narrower and treated at a human scale. The plan recommends an efficient and interconnected street network for automobiles, bicycles and pedestrians throughout the study area. The NORTHWEST OCOEE SECTOR STUDY 4 68
10 function and appearance of a street must be balanced with the built environment to create a pleasant and safe experience for all travelers and adjacent residents or businesses. Establish a Comprehensive Greenway System Carefully planned open space is important for any community and may range from large recreational areas to civic squares. The plan recommends strategically placed recreational facilities, greenways, and neighborhood parks to serve the overall community. Furthermore, the plan recommends the integration of environmental and natural features such as wetlands and vegetation into the greenway system. One benefit of a greenway system is that it can provide a buffer between development of different use or scale. A greenway system is a network of trails and undeveloped lands connected to provide an environmental and recreational asset as well as an alternative transportation system for walking and bicycling. This system should be augmented by creating further connections between existing green lands, providing safe crossings where the greenway crosses the public road system, and encouraging connections to new residential and non-residential development. Where feasible, the greenway system should include paved trails or shared-use paths, and should tie in to the on-road bike lanes and sidewalks to enhance connections. The proposed greenway system must include connections to the West Orange Trail (described below) as well as connections to and between all the Crown Point PUD and Ocoee High School, the planned Lake Apopka trail system, and the central part of the study area where it is likely a new middle school will be located. Provide Connections to the West Orange Trail The West Orange Trail is a tremendous asset for the study area that connects Oakland, Winter Garden, Ocoee, Clarcona, and Apopka together via the 19-mile rail-trail used by pedestrians, cyclists, rollerbladers, and others. The Trail enters the study area to the Northwest of Fullers Cross Road and crosses Ocoee-Apopka and West Road to the north of SR 429 before crossing under SR 429 north of the West Road interchange and continuing to the east. The one limitation of the Trail to this point is that it does not directly serve or connect the majority of Ocoee. This limitation should be remedied as development occurs in Northwest Ocoee. Every effort should be made to encourage developers to support the Trail by providing connections between the Trail and activity centers, between new residential developments and the Trail, and by Trail enhancements through landscaping, lighting, trail furniture, etc. The plan recommends bike lanes on the roads that intersect with the Trail. Desired connections can occur primarily through a newly established system of greenways. Specifically, connections should occur at the Trail s intersection with Ocoee EXECUTIVE SUMMARY 5 68
11 Apopka Road and Ocoee Crown Point Parkway to connect more of the City. Provide Complementary Multimodal Connections The provision of sidewalks, bike lanes, and trails should be encouraged as part of all new development and road improvements. Of particular interest are connections between residential developments and schools, parks, and activity centers. A bike lane is recommended along the length of Ocoee-Apopka Road in the study area. This bike facility will take advantage of the future widening of the road, and will provide a direct connection from Downtown Ocoee to the West Orange Trail. Adopt Form-Based Design Standards The design standards for the Northwest Sector employ several fundamental urban planning and design concepts. These concepts do not necessarily change the mix of land uses currently allowed in Ocoee, but provide guidelines on how permitted land uses should be organized and how they should look. Design standards for the study area should ensure that proposed developments help achieve the overall vision for Northwest Ocoee. Each site plan submitted in the study area should demonstrate an appropriate relationship with surrounding neighborhoods. The design along the edges of the site should be compatible in scale and appearance with adjacent uses. Just as important, however, is that the site be well integrated into surrounding areas and not be designed with barriers to isolate it from nearby developments. This makes it easier for the pedestrian friendly environment created on the site to extend into adjacent areas. Through stringent development reviews, the City can encourage quality, high value development. Questions to ask when reviewing all proposed site plans include: Are the buildings along the edge of the site oriented outward along existing streets? Does the site contain multiple connections to surrounding neighborhoods and adjacent uses? Does the development contain a complimentary mix of land uses (proximity of residential, commercial and employment centers)? The plan recognizes several place-types for the study area (Table 1). A series of form-based place-types provide guidance on what development in the Sector should look like. Each place type has its own set of land uses and development standards. This approach provides more flexibility in permitted land uses and less flexibility in design and character. NORTHWEST OCOEE SECTOR STUDY 6 68
12 Recognize Importance of Focal Points Focal points are important to a community because they provide residents with a sense of place and help to define a place regionally. Formerly known as the Coca-Cola property, the Crown Point PUD is a 370-acre property primarily located north of the Western Expressway adjacent to Lake Apopka, with some land also located south of the expressway at Fullers Cross Road and Ocoee Apopka Road. The location of the property between the Western Beltway and Lake Apopka make it a distinct planning area with the ability to evolve with its own character. A master plan and design standards are in place to guide development of the property, which is to include a mixed-use village center, residential, schools, and parks. The property is being developed in a series of phases, with the City selling off parcels to interested developers over time. Ocoee High School and supporting infrastructure have been constructed, and residential neighborhoods are in various phases of construction. Another focal point is Downtown Ocoee, which is located outside of the study area but is still an influence on development in the southern portion of the Sector. The City of Ocoee s Comprehensive Plan designated two Interchange Impact Areas (IIAs) along the Western Expressway in the Northwest Sector. These IIAs are significant because the Western Expressway is part of a larger system that will eventually evolve into a Beltway around central Florida. As emerging focal points, the City has specified some guidelines as to the type and style of development that can occur in the IIA. Developments of mixed and multi-use projects are to be encouraged, as are developments that will reduce the impact on the transportation network. The Comprehensive Plan discourages developments that include strip commercial centers with significant trip generators such as gas stations and fast food restaurants. The plan builds upon these guidelines and recommends that each IIA adopt a unique character and function. The plan identifies the northern IIA, located at the interchange with West Road, as a mixed-use employment/commercial district intended to provide a regional function due to its location off the interchange. The location near the Crown Point PUD and Western Expressway, and the other assets of the area, give this IIA a unique advantage in determining its destiny. The southern IIA is located in an older, industrial district that is ready for redevelopment. The existing street network and its location as part of old Ocoee lends itself to a unique type of redevelopment. This area is no longer an ideal industrial node, as the market for industrial has evolved and has different needs in terms of parcel sizes and land costs. The area would be well suited for a craftsman district a light industrial-based, mixed-use area serving artisans and crafters as a place to live, create product and sell product. This area would appeal to a wide market area, particularly as West Orange County is growing quickly and this niche would serve a residential market. EXECUTIVE SUMMARY 7 68
13 CONCLUSION As detailed in the main documentation of this plan, the first step the City should commit to is making a public investment in public infrastructure. The costs associated with each investment is detailed in Table 2. A fiscal impact analysis of the plan components revealed that the Northwest Sector has the potential to annually generate between $21 million and $25 million in tax revenue by 2025 from taxes and impact fees, indicating that the investment will yield financial returns for the City. The Northwest Sector provides the City of Ocoee with a unique opportunity to control its destiny and maximize its potential. However, the City must commit to a comprehensive approach to planning for the area, and focus not only on the framework and infrastructure (i.e., water, sewer and transportation) but the urban form and design, as well. Together, instituting these elements will ensure that the City has a viable and fiscally sound vision that will guide future growth in a orderly and responsible manner. NORTHWEST OCOEE SECTOR STUDY 8 68
14 Table 1 - Development Standards for Northwest Ocoee Form-Based Place Type Road Network and Block Perimeter Land Use Policy Recommendations Mixed-Use District (Northern Interchange) Edge: Block perimeter of 2,400 ; 600 maximum block length. Center: Block perimeter of 2,000 ; 500 maximum block length. Streets follow grid pattern and should be designed for slow traffic (25 mph) and include raised curbs, wide sidewalks, bike routes and street trees. Mostly residential at edge. Greater intensity at center, including highdensity residential, professional office, services, hotels, townhomes, shopfronts, churches, and civic. % of Block Area at Center: Commercial 10-35% Professional Office/Services 10-35% Residential 10-35% Ensure the future land use and land development code allows for high density residential in nonresidential zones. Adopt form-based design guidelines to create a high quality node that is unique to Ocoee and promotes mixed use in a sustainable manner. Key features of this district should include high quality architecture; a walkable, grid street network; mixed-use that includes a variety of housing types; and high quality retail development, possibly restricting on building footprints, scale and massing. Develop a mixed-use overlay zone to foster the level and intensity of mixed uses needed for this concept, or re-designate the proposed areas as PUDs. Emphasis on West Orange Trail and greenway connections to promote multi-modal transportation. Civic/Open Space 10% Future land use designations that are consistent with employment/commercial centers include: Residential High Density Residential Non-Residential Commercial, Professional Office/Services, Public Facilities/Institutional, and Recreation/Open Space Craftsman District (Southern Interchange) Edge: Block perimeter of 2,400 ; 600 maximum block length. Center: Block perimeter of 2,000 ; 500 maximum block length. Streets follow grid pattern and should be designed for slow traffic (20-25 mph) and include raised curbs, wide sidewalks, bike routes and street trees. Emphasis on greenway connections to promote multi-modal transportation. Mostly residential at edge. Greater intensity at center, including highdensity residential, live-work units, lofts, services, lightindustrial/manufacturing (designed to be compatible with residential), townhomes, shopfronts, churches and civic. % of Block Area at Center: Light Industrial 25-50% Commercial 15-45% Residential 15-45% Civic/Open Space 10% Adopt form-based design guidelines to create walkable centers and create a place that accomplishes the creation of a Craftsman district at the southern interchange. Key features of this district shall include live/work space, retail sales and manufacturing of specialty items, restaurants and parks. Develop a mixed-use overlay zone to foster the level and intensity of mixed uses needed for this concept, or re-designate the proposed areas as PUDs. Ensure the future land use and land development code allows for high density residential in nonresidential zones. Future land use designations that are consistent with employment/commercial centers include: Residential High Density Residential Non-Residential Light Industrial, Commercial, Professional Office/Services, Public Facilities/Institutional, and Recreation/Open Space EXECUTIVE SUMMARY 9 68
15 Table 1 - Development Standards for Northwest Ocoee Form-Based Place Type Road Network and Block Perimeter Land Use Policy Recommendations High Density Residential Maximum block perimeter of 2,400 Streets follow grid pattern and should be designed for slow traffic (20-25 mph) and include raised curbs, narrow sidewalks, bike routes and street trees. Single family homes, apartments, garden apartments, townhomes and condominiums. Should primarily serve as a transition area for the interchange impact areas to medium density residential. Neighborhood-serving commercial including corner stores, small-scale, sit down restaurants, personal services (beauty parlor, banks, professional office, etc.) and civic uses (e.g., post office). Ensure the future land use and land development code allows for limited commercial and/or office in high-density residential zones. Require a mix of housing types (e.g., apartments, townhomes, live/work lofts, condominiums, etc.) to accommodate a range of housing needs. Future land use designations that are consistent with employment/commercial centers include: Residential 60-90% Residential High Density Residential Civic 10% Commercial/Services 10-30% Non-Residential Commercial, Professional Office/Services, Public Facilities/Institutional, and Recreation/Open Space Low to Medium Density Residential Maximum block perimeter of 3,000 Streets follow grid pattern and should be designed for slow traffic (20-25 mph) and include raised curbs, narrow sidewalks, bike routes and street trees. Single family homes, apartments, garden apartments, townhomes and condominiums. Neighborhood-serving commercial including corner stores, small-scale, sit down restaurants, personal services (beauty parlor, banks, professional office, etc.) and civic uses (e.g., post office). Ensure the future land use and land development code allows for limited commercial and/or office in medium-density residential zones. Future land use designations that are consistent with employment/commercial centers include: Residential Low and Medium Density Residential Residential 80-90% Civic 10% Non-Residential Commercial, Professional Office/Services, Public Facilities/Institutional, and Recreation/Open Space Commercial/Services 0-10% NORTHWEST OCOEE SECTOR STUDY 10 68
16 Table 2 Summary of Recommended Capital Projects Project Type Location Description Cost (Millions $) Identified Funding Transportation Silver Star Road Widen to 4 lanes and realign $9.3 None Transportation Ocoee Apopka Road Widen to 4 lanes $21.9 None Transportation Transportation Fullers Cross Road/ Clarcona Ocoee Road West Road/ Clarcona Ocoee Road Widen to 4 lanes and realign $5.1 Partial County Widen to 4 lanes and realign $12.3 County Transportation Wurst Road Extend as a 2 lane $1.8 Partial Developer Sewer AD Mims Plant Wastewater treatment plant upgrade $5.25 None Sewer Wurst Road to the AD Mims Plant OR along Clarcona-Ocoee Rd. Service provision $ None Water Adjacent to Vignetti Park NW Sector Water Treatment Plant $4.2 None Water 1 Clarcona Ocoee/Lauren Beth Loop. 2 Lake Meadow Loop 3 East Crown Point Loop 4 Wurst Ave Connector Transmission Mains (4) $2.0 None Water Upgrades to existing plants Plant Upgrades $0.2 None Water Upgrades to existing pumps Pump Upgrades $0.2 None Total Capital Costs $ MAY
17 1 INTRODUCTION Carefully planned growth in Northwest Ocoee has the potential to make a positive economic, cultural and civic impact on the City of Ocoee. However, orderly and well-planned growth that adds value to the City and its residents cannot happen without a substantial public investment and attention to the details of urban form and compatible land uses. That investment includes extension of sewer lines and additional plant capacity, improving transportation facilities, and preparing design standards for the high-growth interchange areas at West Road and SR 429 and Silver Star Road and SR 429. Against that backdrop, the Northwest Ocoee Sector Study builds upon unique conditions of the study area that include the presence of SR 429 (Western Expressway) and its two interchanges, which connects the sector and the City to the broader Central Florida region; a shift in demographics as a result of higher paying jobs and improving access to regional employment centers, evidenced by the presence of new, upscale residential subdivisions; and the gradual transformation of Lake Apopka into an attractive natural amenity. Those conditions favor the Northwest Sector s emergence as an important gateway to the City with more diverse land uses fitting the area s changing character. As stated above, the Northwest Sector faces a set of challenges that will require a significant public investment. The area s development potential is limited due to the absence of public infrastructure, particularly sewer. An initial investment of $9.4 million to the sewer system is needed to spur quality development in the area, which in turn will generate higher property tax revenues to pay off that initial investment. Finding the right balance between public investment and the rate of return on the investment is an important goal of this study. master plan for the Northwest Sector of the City of Ocoee. Planning components include: Economic Analysis Assesses the opportunties and constraints of the area in terms of its market potential given the broader regional context of Ocoee and its transportation resources. Transportation Defines the framework for regional accessibility and context for the Sector Plan. The transportation plan component identifies needed roadway improvements and costs for the Sector Plan, including enhanced and new roadways to meet demands of future growth. Other transportation issues that are addressed include access management strategies to preserve capacity and bicycle and pedestrian connections to enhance safety and access. Infrastructure Assesses the proposed infrastructure and public service improvements needed for implementation of the master plan, including funding and phasing of the improvements. Land Use and Design Summarizes the land use recommendations and design criteria for the study area, including proposed greenway systems, designated mixed-use centers, strategies for encouraging unified development, and development standards for recommended land uses. Fiscal Impact Analysis Describes the methodology used to forecast revenues and costs for the study area, and presents the fiscal consequences of the recommended plan. The purpose of the Northwest Ocoee Sector Study is to prepare a market-based assessment of alternative land use scenarios to define an economically viable vision for the area. Ultimately, the goal is to develop a vision for the Northwest Sector that reflects local priorities and sound economic strategy for the City. This report documents the components of the recommended NORTHWEST OCOEE SECTOR STUDY 12 68
18 2 NORTHWEST OCOEE REGIONAL CONTEXT The Northwest Ocoee study area is generally bounded by the SR 429/Western Expressway to the north, SR 438/Silver Star Road to the south, East Crown Point Road and Lake Apopka to the west, and Lakewood Avenue to the east. As illustrated in Figure 1, below, the study area is located near several other municipalities, including the cities of Winter Garden to the west, Apopka to the north, and the remainder of Ocoee to the south and east. Lake Apopka, located northwest of the study area, provides a natural boundary for the study area. As discussed in the sections below, Northwest Ocoee has a variety of characteristics in terms of land use, transportation and economic potential that make it a unique planning challenge for the City. Northwest Ocoee s current function in a regional context is that of fulfilling the demand for residential, suburban neighborhood-related uses. Should the City wish to dramatically change the destiny of the Northwest Sector, it must carefully examine what changes are feasible and desirable based on an analysis of existing and future infrastructure, market potential and community input. Figure 1 Northwest Ocoee Regional Context MAY
19 3 MARKET ANALYSIS The availability of land in Northwest Ocoee and the area s connections to significant transportation resources have given rise to the notion that the City s future land use does not maximize the opportunities in the Northwest Sector, and a more intense land use pattern would be better suited to the area. A rapidly growing population base and transportation facilities providing regional access may justify a more commercial or mixed land use pattern to provide needed services and generate higher property revenues for the City. To explore this notion, a market analysis was conducted to determine the market potential of the Northwest Sector. The full market study is located in the appendix, and is summarized in this section. The market analysis supports the notion of allowing a more intense land use pattern, with an emphasis on more intense residential with supporting non-residential uses. To evaluate the economic potential of Northwest Ocoee, an understanding of the broader economic context must be established. Northwest Ocoee, as well as the City of Ocoee in its entirety, is located within the West Orange Market Area, which encompasses a five-mile radius around the intersection of West Road and SR 429 (Figure 1). The market area also includes portions of the cities of Winter Garden and Apopka, as well as sections of unincorporated Orange County Residential Development The demand for residential development in the West Orange Market Area is strong and well documented. The West Orange Market Area has experienced substantial growth in terms of single-family development since the 1980s. The corridors of Silver Star Road, White Road, Ocoee-Apopka Road and AD Mims Road are examples of places that were formerly home to agricultural based businesses, but are now lined with residential subdivisions. Between 1980 and 1989, the number of housing units in the market area increased by 10,430 units. That represents an average increase of roughly 1,000 units per year. The last decade, 1990 through 2000, housing units in the market area increased by 9,100 units, representing an average increase of roughly 910 units per year. Growth since 1980 represents 63 percent of the market area s total single-family housing stock. In addition, multi-family housing has increased since Between 1980 and 2003, 795 multi-family units have been built, representing nearly 80 percent of the area s total multi-family housing stock. Why has the West Orange study area, including the City of Ocoee, experienced such rapid residential growth? The following factors have influenced this trend: Location near regional employment centers (e.g., Downtown Orlando, Health Central, West Oaks Mall, Theme Parks); Proximity to retail and personal services (e.g., SR 50, West Oaks Mall, Silver Star Road, Winter Garden); Availability of large tracts of land; Cost of land relative to property in other suburbs of Orlando; Regional accessibility (e.g., SR 429, SR 408, SR 50, Florida s Turnpike); and The small-town character and quality of life. Ocoee is not perceived as a big city. Rather, Ocoee is seen as a small-town, suburban residential community appropriate for families. The market analysis concluded that a mix of housing types, with a variety of price points, should be provided in the Northwest Sector. It also concluded that there is a potential for the sector to absorb 3,000 to 4,000 total residential units over the next 14 years Nonresidential Development Non-residential land use is highly competitive in the West Orange Market Area. In Ocoee, nonresidential uses including the West Oaks Mall - have conglomerated along the SR 50 corridor, NORTHWEST OCOEE SECTOR STUDY 14 68
20 with the exception of some smaller, neighborhood-scale retail. Other nodes of nonresidential uses are growing around Ocoee, including Horizons West and Winter Garden. Of the total nonresidential square footage in the market area, industrial has the largest share with 48 percent, followed by retail with 45 percent. Office only comprises eight percent of the total nonresidential square footage. Nearly 70 percent of the existing office square footage was constructed before Nonresidential development in the West Orange study area has been in response to regional trends. For example: While the overall area has been traditionally the source of major nonresidential development because of its proximity to the Orlando urban core and growing residential population, most of the non-residential inventory has been located along the SR 50 corridor, a high traffic regional corridor that connects many smaller municipalities with Downtown Orlando. From a regional perspective, SR 50 is a highly accessible roadway.. Other non-residential development away from the SR 50 corridor has been limited to a collection of relatively small-scale products, designed to be neighborhood-serving facilities. Historically, office development has not been robust in the study area. Just over 1.0 million square feet of office space is designated, and 68 percent of that was constructed prior to Office development has been limited to smaller scale offices that primarily provide personal services. This is because office development in Central Florida has grown up around the Interstate-4 corridor, which does not have an interchange near Ocoee. Significant office locations in Central Florida include Disney/Lake Buena Vista, Downtown Orlando, Altamonte Springs, Maitland and Heathrow/Lake Mary. Other major office attractions include Orlando International Airport and the University of Central Florida. The area has over 6.3 million square feet of designated industrial space. Over 77 percent was constructed prior to Industrial development has been limited because of cost and the size of land available. Industrial brokers suggest that industrial land in Orange and Seminole Counties has become too expensive for new industrial development. The tendency by developers and brokers is to look in Osceola, Polk and Lake Counties. However, there is a surplus of industrial land smaller than 10 acres in Central Florida. Smaller users will tend to compare areas and strongly consider price in their site selection analysis. Industrial development can be divided into two user groups: 1. Small users make up a large percentage of the market s tenants and can be divided in two subgroups small bay and large bay users. Small bay users typically seek spaces of less than 5,000 square feet each, with four to five users in each building, totaling about 20,000 square feet and two acres. These users look for properties that are on a major thoroughfare and have access to a regional or state highway. Large bay users require about 5,000 to 20,000 square feet for each user, with eight to 10 users in each building, totaling about 100,000 to 150,000 square feet and requiring 10 to 12 acres. 2. Large users seek sites between 100 to 150 acres in size that are located on a major thoroughfare and have access to an interstate or limited access/toll facility. The market analysis concluded that the presence of a growing population would result in the need for additional retail facilities. However, much like office demand, retail demand is largely driven by local residential population. Two retail hubs serving the northern and southern parts of the study area are recommended. A town center concept will likely be the most marketable alternative. Due to the significant amount of office space near the study area, there is limited demand for additional office development. There will be some small-scale office demand that is mostly resident driven, but not for large corporate users. The scale and intensity should consider the MAY
21 surrounding regional context and market. Moderate scale office development that will correspond to the surrounding area s residential development should be considered. In sum, the market analysis concluded the following: The continuing population growth within the study area will drastically impact the nonresidential landscape in the market. The addition of large-scale residential projects, coupled with the overall growth in the study area, will prompt the development of some additional retail and service facilities in the area. A location with easy access and visibility, such as the SR 429 interchanges at West Road and Plant Street are logical locations for any significant non-residential development. not only officers local residents a place to shop and work, but it could offer the larger study area a destination venue for both shopping, entertainment and employment. There may be an opportunity to provide some flexibility for some light industrial (flex space) development. While there has not been a strong market for this type of facility in the study area, the construction of the southern segment of the Western Beltway will provide a more convenient access point to the regional and statewide transportation facilities, and thus could create a demand for some light manufacturing industrial development. Special niche markets may be pursued, combining tenants or other users oriented to a limited segment of the industrial market, such as furniture, design and decor, or similar themes. Grocery-anchored centers are typically in the 80,000 to 100,000 square feet range. These types of centers usually include some services (office), typically making up anywhere between 15 to 25 percent of the total square footage in the center. In addition, some out parcels for banks and restaurants are generally associated with such centers. Retail facilities in a main street setting have staged a renaissance in the past few years. Specialty boutiques, cafes and restaurants, in addition to chain stores and restaurants, have been a welcome addition to the retail environment in Central Florida. Office development has not been prevalent in this market. Most of the office facilities are one to two stories, occupied by local companies and small branches of national businesses. Even newer office facilities that have developed near the Health Central Hospital site have been relatively small in scale less than 100,000 square feet. A main street configuration for retail and offices, as well as medium to high density residential, could change the development paradigm in the area. There may be an opportunity to create a collection of retail and services in a centralized location, that NORTHWEST OCOEE SECTOR STUDY 16 68
22 4 NORTHWEST SECTOR VISION Northwest Ocoee is already growing, as evidenced by the new, upscale subdivisions near Lake Apopka. The area s re-emerging natural assets, such as Lake Apopka, the presence of the West Orange Trail, the new Ocoee High School, and the availability of vacant tracts of land near the Western Expressway/SR 429 interchanges all lend themselves to the development potential of the area. In sum, the area has a multitude of positive attributes that ensure its place in the regional market, given current and projected demand for growth. However, for this area to be successful in the long term and maintain a competitive advantage in a regional economy, the recommended scenario is for a high-quality, well-disciplined and mixed-use character of development. Furthermore, for this preferred scenario to be successful, a commitment by the City to making investments to the area s infrastructure is a critical and necessary first step. The vision for the Northwest Sector is for a high- quality, well-disciplined and mixeduse environment that is economically and fiscally sustainable, cognizant of the natural assets present, and mindful of the existing development in the Northwest Sector, Downtown Ocoee, and the remainder of the City. The City of Ocoee has a unique opportunity to provide a sustainable vision for development in the area. The recommended plan is based upon close coordination with the City of Ocoee, City residents and detailed technical analysis as to the feasibility of various scenarios in the study area. Described below, the key factors or themes used to develop the plan include infrastructure investments, including an enhanced multimodal roadway network; and design guidelines and identification of mixed-use focal points. This vision was articulated through a process of scenario development and evaluation and input from residents and stakeholders. It was determined early on that Northwest Ocoee s vision should be fiscally sustainable and consistent with the findings of the market study. Beyond just the square footage or number of dwelling units, the vision must be defined through design and policy. The framework for the vision is the transportation network. This network is supported by a combination of land uses that maximize the area s potential. To explore the sustainability of potential visions, alternative scenarios were developed and evaluated. This section presents an overview of the scenarios and the outcomes of each. Several features were taken into account when preparing the alternative scenarios. In order to keep the scenarios realistic, strong consideration was given to the existing transportation network and existing land uses in the sector, particularly existing residential uses. Also taken into account were the market study results and the demand for development in the sector, particularly for nonresidential uses, i.e., square footage of nonresidential space per dwelling unit. The consultant team, working with City staff, initially created several development scenarios that attempted to maximize the various assets and markets at play in the study area. This initial set was presented to the public, and was refined based on public comment. The new scenarios were reviewed, evaluated and refined further until three final alternative development scenarios remained. The final scenarios, which were narrowed down based on the market constraints and land use compatibility concerns, were evaluated and are described in the sections below. A noteworthy feature present in all scenarios is a new mixed land use category, commercial/light industrial, located in the Interchange Impact Areas (IIAs). The IIAs are defined in the City s comprehensive plan and are characterized by their location at the intersections with the Western Expressway. The commercial/light industrial land use category describes a dense, mixed-use environment with a focus on commercial, office/services, very light industrial, and limited residential uses. The purpose of this new category is to differentiate the IIA areas and recognize them as special planning areas with unique needs as a result of their interchange location, but to also ensure they evolve beyond traditional highway commercial to support or enhance community character. MAY
23 4.1 SCENARIO EVALUATION Base Scenario Adopted Future Land Use Plan The City s future land use plan for the Northwest Sector has a horizon year of 2020 and contains a high proportion of single-family residential land use. Nearly 70 percent of the land is designated low density residential and four percent of land is designated for medium and high density residential. The remaining 26 percent of the sector is designated for nonresidential uses. According to the City s comprehensive plan, low density residential is less than four dwelling units per acre. Detached single-family housing, patio homes, zero lot-line houses and other forms of detached or semi-detached housing characterize this land use category. Medium and high density residential provide a slightly higher density, with four to eight dwelling units per acre for medium density and eight to 16 dwelling units per acre for high density. Apartments, assisted living facilities and more intense housing types characterize the medium and high-density residential land use. The future land use designations used in the Northwest Sector are a response to growing residential demand at a regional scale. This was confirmed by the market analysis, which found that single-family residential in the West Orange Market Area is a rapidly growing area sector Scenario A Scenario A (Figure 2) maintained the residential orientation of the Northwest Sector established by the future land use plan but increased housing densities by introducing a higher proportion of medium-density residential. Like the future land use plan, there was enough non-residential land set aside to ensure convenience oriented retail and services in the study area for residents plus additional industrial uses and a mixed use center. In terms of residential land use, the primary difference between Scenario A and the adopted future land use map is that the amount and intensity of single family residential is increased. The amount of low density residential is scaled NORTHWEST OCOEE SECTOR STUDY back, making room for additional medium density residential. No land is designated for high density residential in this scenario. In terms of nonresidential land use, a key difference between Scenario A and the future land use is the introduction of a commercial/light industrial land use designation. The purpose of this designation is to allow for a different style and character of nonresidential development to occur in Northwest Ocoee that will differentiate it from other commercial or employment centers in the remainder of the City. Scenario A also introduces the concept of mixed-use to the Northwest Sector. All scenarios contain a relatively high proportion of institutional land use due to the presence of schools and other public lands. The projected population of the scenario growth will require the need for more schools and government services, which is discussed in greater detail in later sections of this report Scenario B Like Scenario A, Scenario B (Figure 3) maintains the residential focus of the Northwest Sector established in the City s future land use plan. The key difference is the introduction of higher intensity employment uses above and beyond what is needed to serve the neighborhoods. This scenario recognizes the future potential of the interchange impact areas as being economic focal points for the City. In terms of residential land use, the primary difference between Scenario B and Scenario A and the future land use map is the amount of low density residential is decreased in favor of medium density residential. In terms of nonresidential land use, Scenario B includes an overall increase in the amount of land designated for nonresidential use. As in Scenario A, Scenario B relies heavily on the commercial/light industrial land use designation to differentiate the character of development from other areas of the City and region. Scenario B also earmarks several areas for mixed-use development in the northern portion of the study area, which is compatible with the trend that will be established with the Ocoee Crown Point PUD
24 4.1.4 Scenario C Scenario C (Figure 4) attempts to bring together the first two scenarios by increasing the amount of residential and nonresidential land uses. The result is increased densities and intensities in the Northwest Sector. Scenario C further scales back the amount of low-density residential land use, in favor of increasing medium density and high density residential. 4.2 SCENARIO COMPARISON Table 3 and Table 4 present the socioeconomic and land use characteristics of the base and three alternative scenarios. A significant finding of the scenario evaluation was the nominal difference in the impacts; none of the scenarios can be singled out as optimal from a numeric standpoint. Therefore, development will be contingent upon market forces to dictate which combination of land uses is optimal. It is important to note, however, that the scenarios present different versions of the maximum development likely to occur. Therefore, because of the market realities described by the market analysis, we do not anticipate any development to occur in excess of what is projected in the three scenarios. Table 3 Comparison of socioeconomic data FLU A B C Population 10,600 24,200 23,200 25,900 Dwelling Units 3,700 8,700 8,400 10,000 Single-Family 3,110 6,300 5,800 5,200 Multi-Family 590 2,400 2,600 4,800 Employment 3,600 6,000 7,000 6,800 As a result, the remainder of the study relied on the scenarios as guidelines, allowing some flexibility in the development patterns. The selection of a preferred scenario was made through feedback with the public, the Planning and Zoning Commission, and the City Commission. Scenario B was preferred because it maintained a residential focus consistent with the character of the existing and adopted future land use and with other areas of the City. Table 4 Comparison of land use acreage Residential Low Residential Medium Residential High FLU A B C 1,670 1,320 1, Commercial Commercial/ Light Industrial Light Industrial Office Mixed-Use Institutional Total Acreage 2,300 2,300 2, These data describe the total acreage anticipated for each land use category in the Northwest Sector for Scenarios A, B, and C. It is assumed that development densities and intensities increased beyond what is currently permitted to allow for this amount of development to occur. These data apply to the build-out conditions of the future land use and each scenario as it applies to the Northwest Sector study area. Build-out is projected to occur in MAY

25 Figure 2

26

27 Figure 4

28 5 SECTOR-LEVEL RECOMMENDATIONS This section describes the recommended Northwest Sector plan, focusing on the different land use types and design components that form the building blocks of the plan. The plan recognizes that the study area will be a largely residential area with nodes of commercial-based mixed-use development. The proposed transportation system and design elements, which includes a greenway system, provides organizational structure that ties together the sector. anchored by the civic presence of the high school and is tied together by the natural environment. Figure 5 Crown Point PUD The recommended plan for the Northwest Sector of Ocoee creates a regional identity for the sector and establishes strategies to achieve the vision. Northwest Ocoee is already growing, as evidenced by the presence of new, upscale subdivisions near Lake Apopka. The area s natural and built assets, such as the lake, the presence of the West Orange Trail, the new Ocoee High School, and the availability of vacant tracts of land near the Western Expressway/SR 429 interchanges influence the development potential and patterns of the area. The sector has a multitude of positive attributes that ensure its place in the regional market, given current and projected demand for growth. However, for this sector to be successful in the long term and maintain a competitive advantage in a regional economy, the recommended plan seeks to facilitate high quality, well-disciplined and mixed-use development. The plan is projected to accommodate a population of 25,000 with 8,700 dwelling units, and employment of 6,000. Key features of the plan include the establishment of several unique mixed-use focal points. Design and development standards for these focal points are provided in this section. Some of these focal points were emerging before the study began. One is the Crown Point PUD (Figure 5). Formerly known as the Coca-Cola property, this 370-acre development is located northwest of the Western Expressway and southeast of Lake Apopka. The location of the property between the beltway and the lake make it a distinct planning area Source: City of Ocoee Crown Point PUD Master Plan The Sector Plan guides emerging focal points, such as the IIAs. These areas are significant because the Western Expressway is part of a larger system that will eventually evolve into a beltway around Central Florida. As emerging focal points, the City s comprehensive plan has specified general guidelines as to the type and style of development that is expected in these areas. The Sector Plan builds upon these guidelines and recommends that each IIA adopt a unique character and function. The northern IIA, located at the interchange of West Road, is intended to provide a regional function, i.e., drawing people in from outside of Ocoee, due to its location at the interchange. The southern IIA is located in an older, industrial district ready for redevelopment. The existing street network and its location on the western end of old Ocoee lend themselves to a unique type of redevelopment. This area is no longer an ideal industrial node, as the market for industrial has evolved and has different needs in terms of parcel sizes and land costs. The area would be better suited as a craftsman district a light industrial-based, mixed-use area that serves artisans and crafters as a place to live, create products and sell products. As an area that would primarily serve homeowners that are MAY
29 remodeling or redecorating their homes, this area could potentially appeal to a wide market area, particularly the fast-growing residential market in West Orange County. Implementation of the Northwest Ocoee Sector Plan will occur on three levels: sector-, placeand site-levels. Sector-level recommendations include those that impact the study area framework such as transportation and utilities, and the common design themes. Place-level recommendations focus on defining or bringing together specific place-types, or districts (e.g., IIAs). Site-level recommendations deal with the design and functionality of individual sites within the larger framework of places and sectors. Specifically, these recommendations deal with building and site layout criteria. 5.1 TRANSPORTATION Transportation is the key organizing influence in the development of the Northwest Sector for the following reasons: The presence of two interchanges with the Western Expressway/SR 429. These interchanges present a valuable economic opportunity to the City and the sector, and the transportation impacts of development in these nodes can have a sizeable impact if not planned and managed ahead of time. Good north-south connectivity. The Northwest Sector has a strong north-south transportation network, with such roads as the Western Expressway, East Crown Point Road, Ocoee-Apopka Road, and Lakewood Avenue connecting the sector to the City and region. Ability to pro-actively design an improved network. The relative low amount of development in the Northwest Sector provides an important opportunity to the City to increase the network with better eastwest connectivity and ensure sufficient capacity for future development. Proximity to larger, regional system. The presence of the Western Expressway provides the sector with an important connection to a larger, regional system that NORTHWEST OCOEE SECTOR STUDY spans Central Florida. As this system continues to expand, development in West Central Florida will continue to grow, and the Northwest Sector is well positioned to receive that growth. This section summarizes the development, evaluation and implementation of the transportation component of the Northwest Sector plan. This process included identifying necessary transportation projects, forecasting traffic volumes and potential congestion areas, and developing planning-level implementation costs for the recommended projects. Other important issues that are considered include project implementation timeframe, connections to regional trail facilities, and coordination with the remainder of the City and Orange County Key Recommendations To reduce vehicle conflicts and excessive delays, a street network that avoids concentrating travel to a few roads is recommended to disperse vehicle volumes and allow for more narrow streets and human scale design. The Sector Plan recommends an efficient and interconnected street network for automobiles, bicycles and pedestrians throughout the study area. This needs to occur on two levels: the primary street network (arterial roadways) and the secondary street network (connectors, local roadways). The function and appearance of a street must be balanced with the built environment to create a pleasant and safe experience for all travelers and adjacent residents or businesses. As the Northwest Sector develops, the need for a stronger transportation network that provides connectivity among uses and mobility throughout the study area will grow. Transportation constraints already exist. There are few eastwest connections serving the area, and Clarcona- Ocoee Road is already operating at a failing level of service. Orange County has delayed funding for widening this roadway indefinitely, with no plans for construction through The Existing plus Committed (E+C) network model is a regional model that accounts for traffic flow throughout the metro Orlando region, not just the Northwest Sector of Ocoee. Using E+C network and accounting for the future land development in the land use scenarios, traffic volumes were 24 68
 standard for the roadway, per the City s Comprehensive Plan.")
30 projected for the year As a result, almost all of the major north-south and east-west roadways in the study area are projected to operate near or above capacity by Capacity is based on the adopted Level of Service (LOS) standard for the roadway, per the City s Comprehensive Plan. It is important to note that the development patterns of the land use scenario are not alone in causing the congestion. Rather, the congestion is a result of the cumulative future development in and around Ocoee and the neighboring Cities of Winter Garden and Apopka, Lake County, and parts of unincorporated Orange County. However, following this process helps to determine where congestion is projected to occur in the future absent any other roadway improvements. Figure 6 presents the major roads in the study area, color-coded to indicate the projected level of congestion on each segment. Green segments indicate no congestion, orange indicates moderate congestion, and red indicates severe congestion. Roads with severe congestion have a traffic volume projected to exceed the road s capacity by more than 20 percent. In such cases, operational or demand management strategies alone are unlikely to solve the problem; widening or otherwise providing new roadway capacity is often required. will make recommendations based on the northsouth demand throughout the corridor as a whole. Second, Ocoee Crown Point Parkway was coded into the model before its development and therefore does not accurately match the actual route as indicated on the parcel background. This discrepancy is aesthetic only and does not influence the model results. To accommodate anticipated growth and provide improved mobility to maintain an acceptable level of service, the plan recommends transportation improvements that include several road-widening projects and new local roadway alignments and extensions. Recommended improvements and preliminary cost estimates are described in Table 5. Figure 6 Impact of scenarios on the Northwest Sector with planned road improvements 2025 Existing + Committed Network Congestion None Moderate Severe 4 Lanes The transportation analysis depicted in Figure 6 demonstrates that there is a significant demand for additional roadway capacity throughout the study area. Specifically, the north-south movement through the length of the study area, Silver Star Road, and the connections from Fullers Cross Road and Clarcona-Ocoee Road to SR 429 are projected to operate at or above capacity in Potential improvements will be directed towards addressing these issues and improving connectivity throughout the study area in general. Two notes should be made regarding the results in the map in Figure 6. First, it must be recognized that the model is designed for use over a three county area, of which the study area is only one small portion. While the model clearly shows that there is significant north-south demand through the study area, the allocation of trips to East Crown Point Road and Lakeview Avenue is questionable given the available capacity on Clarcona-Ocoee Road. This analysis MAY
31 5.1.2 Existing Conditions Residents of Northwest Ocoee have a variety of transportation options connecting them to the retail and employment centers throughout the region. The SR 429/Western Expressway commences in Apopka, and it proceeds south through Ocoee, and terminates south of Ocoee at County Road 535 in Osceola County. The Western Expressway is being extended through Osceola County to connect with Interstate-4. This section is currently under construction and will be completed in Figure 7 Existing roadway network, 2005 Silver Star Road/State Route 438 is an east west arterial roadway that commences at Ocoee Apopka Road and continues east towards Downtown Orlando. The remaining Northwest Sector boundaries, East Crown Point Road and Lakewood Avenue, are collector streets. Other major roads located in the City of Ocoee in close proximity to the Northwest Sector include: Florida s Turnpike (SR 91) - connects to the Western Expressway and links Central Florida to Southern Florida; access to Ocoee is provided by an interchange with SR 50. West Colonial Drive (SR 50) - a principal arterial running from Florida's west coast to the east coast; The portion of West Colonial Drive in Ocoee is characterized by high intensity strip commercial and highway interchanges The East-West Expressway (SR 408) - western terminus is at SR 50 and Clarke Road in Ocoee. This expressway provides an express route between Ocoee and Downtown Orlando and destinations east (e.g., University of Central Florida). NORTHWEST OCOEE SECTOR STUDY 26 68
32 Table 5 Summary of cost estimates ROADWAY ACTION ESTIMATED COST (Millions) IDENTIFIED FUNDING Silver Star Road Ocoee Apopka Road Fullers Cross Road/ Clarcona Ocoee Road West Road/ Clarcona Ocoee Road Wurst Road Realign Silver Star Road at the intersection with Bowness Road. Widen Silver Star Road from two to four lanes from East Crown Point Road to the realigned Silver Star Road. Build new two-lane connections from Story Road to Silver Star Road to the south and to Ocoee-Apopka Road to the north. Widen Ocoee-Apopka Road from two to four lanes throughout the study area to facilitate efficient north-south traffic flow. Widen Fullers Cross Road from two to four lanes from Ocoee-Apopka Road to Clarcona-Ocoee Road. Widen Clarcona-Ocoee Road from two to four lanes from Lakewood Avenue to West Road. Realign Fullers Cross Road/ Clarcona-Ocoee Road/ Lakewood Avenue intersection. Accelerate widening of Clarcona-Ocoee Road from two to four lanes from West Road to Clarke Road. Widen West Road from two to four lanes from SR 429 to Clarcona-Ocoee Road. Realign the Clarcona-Ocoee Road/West Road intersection. Orange County has planned for this project in the past, but funding is not currently available. However, even if funding for this project materializes, four lanes on Clarcona-Ocoee Road is not expected to be adequate to handle projected traffic by 2025, Therefore, realignment of the Clarcona-Ocoee/West Road intersection will be necessary to help redirect traffic and relieve pressure on the road segment. Extend Wurst Road by constructing a new two-lane road from Lakewood Avenue to Ocoee-Apopka Road. This will provide an additional east-west roadway connection to maintain adequate level of service. A specific alignment has not been determined at this time, and this project will be largely developer driven. $9.3 None $21.9 None $5.1 Partial County $12.3 County $1.8 Partial Developer Total $50.4 MAY

33 Planned and Committed Transportation Projects Currently, there are no transportation projects committed, i.e., funded to occur in the next five years, in the Northwest Sector. Several projects, however, are already needed and have been planned. These projects include: Widening Clarcona-Ocoee Road between Fullers Cross and Adair Street from two to four lanes. This project has already undergone preliminary engineering, and is awaiting commitments for construction funding; Constructing Crown Point Parkway between Ocoee Apopka Road to Fullers Cross; and Widening West Road from Clarcona-Ocoee Road to Ocoee-Apopka Road from two to four lanes. is the Maitland Boulevard Extension, which will provide an additional connection to northwest Ocoee towards the north and east into Maitland and Altamonte Springs. There is also a project to add ramps to the SR 408 at Good Homes Road, and the creation of a southbound access to Florida s Turnpike. Figure 9 Impact of scenarios in the Northwest Sector with recommended improvements 2025 Improved Network Congestion None Moderate Severe 4 Lanes Figure 8 Maitland Boulevard Extension Source: Orlando-Orange County Expressway Authority, 2005 Outside of the study area, there are projects that may affect mobility in the Northwest Sector. Most notably, the Expressway Authority has added the Western Program to its five-year work plan. The program involves three projects: the Wekiva Parkway, Maitland Boulevard Extension/Apopka Bypass (Figure 8), and the State Road 46 Bypass. Phase 1 of the Program NORTHWEST OCOEE SECTOR STUDY Access Management One of the most cost-effective ways to improve traffic flow is to use access management to increase capacity rather than constructing new lanes or new roads. Access management can also be used as an intermediate strategy to improve road conditions while waiting for road improvements to be funded and constructed. Strict access management standards should be enforced for new development along the major arterials in the study area, specifically Ocoee- Apopka Road, Clarcona-Ocoee Road, Fullers 28 68

34 Cross Road, and West Road. Access management includes driveway spacing, signal spacing, and access control. The City s Land Development Code requires a minimum driveway spacing of 500 feet for arterial roads. There is no City requirement on full-access median spacing; the least restrictive state standard (applied to roads such as SR 50) provides comparable guidance by requiring a minimum of 660 feet between full-access median openings, although local conditions may increase this to a minimum of 800 feet based on land uses, transportation infrastructure, etc. The state guidelines also require 1,320 feet between traffic signals. By following these minimum standards, delay caused by turning and crossing vehicles is reduced and safety is increased through reduced vehicle conflicts. locations and number of median openings, driveways, and signals will depend on the location and type of future developments, the map provides a concept of the minimum possible spacing based on existing development and the minimum standards. Figure 10- Minimum access management standards For all new development and redevelopment, shared or cross access should be encouraged. Shared access means that neighboring developments share the driveway used to access the respective developments, reducing the number of points where turning vehicles can create conflicts. Cross access is appropriate for commercial areas, and allows autos to travel between building parking lots without accessing the main roadway. Where practical, additional local streets should be constructed with new developments to provide new connections between the arterials and both new developments and existing streets to further remove traffic from and disperse onto the arterial roads. Table 6 Access management standards for the Northwest Sector ACCESS MANAGEMENT MECHANISM Traffic Signals Full Median Opening Driveway Spacing STANDARDS 1,320 feet feet feet Table 6, above, demonstrates how the access management standards could be applied throughout the study area. While the exact Complementary Strategies The following sections address complementary transportation strategies to support the recommended land use scenario and improved roadway network West Orange Trail Connections The West Orange Trail connects Oakland, Winter Garden, Ocoee, Clarcona, and Apopka together via the 19-mile rail-trail used by MAY


35 pedestrians, cyclists, in-line skaters, and others. The Trail enters the study area to the northwest of Fullers Cross Road and crosses Ocoee-Apopka and West Road to the north of SR 429 before crossing under SR 429 north of the West Road interchange and continuing to the east. This multi-use trail provides a tremendous opportunity to encourage pedestrian and cycling access to the activity center that is developing around the SR 429 and West Road interchange. Every effort should be made to encourage developers to support the Trail by providing connections between the Trail and the activity center, between new residential developments and the Trail, and by enhancing the Trail through landscaping, lighting, trail furniture, etc. Bike lanes are also recommended on the roads that intersect with the Trail Greenway System A combination of parks, wetlands, and protected lands throughout the study area creates the potential for a comprehensive greenway system. A greenway system is a system of trails and undeveloped lands that are connected together to provide an environmental and recreational asset, as well as an alternative transportation system. This system should be augmented by creating further connections between existing green lands, providing safe crossings where the greenway crosses the public road system, and encouraging connections to new residential and non-residential development. The recommended connections that can be made to link the established areas north of Downtown with parks and schools, the future SR 429/West Road activity center, Lake Apopka, and Ocoee High. The greenway system should include trails or paved paths where appropriate and will be tied into the on-road bike lanes and sidewalks where green connections do not exist. Greenways can range in form from narrow urban trail corridors to winding river corridors to very wide, wilderness-like landscape linkages. All corridors have certain basic characteristics in common. However, the diversity of greenway types and forms, combined with geographic differences, means that different kinds of greenways should function in different ways, both ecologically and socially. For the Northwest Sector, two types of greenways are proposed walking paths and shared use paths. Walking paths have a single paved path for walking and jogging. Walking paths may be integrated with sidewalks to provide connections between urban areas and neighborhoods or open space. Figure 11 Walking path Shared-use paths include paved bicycle and walking paths. In an urban setting, the bicycle and walking paths may transition into a formal sidewalk and bike lanes. Figure 12 Shared use path Other Pedestrian and Cycling Connections The provision of sidewalks, bike lanes, and trails should be encouraged as part of all new development and road improvements. Of particular interest are connections between residential developments and schools, parks, and activity centers Public Transportation Currently, Ocoee is served by a transit hub at the West Oaks Mall. Lynx Route 27 is the only route serving the study area, making stops on Wurst Road, Adair Street, Clarcona-Ocoee Road, Lakewood Avenue, Bluford Avenue, NORTHWEST OCOEE SECTOR STUDY 30 68

36 Ocoee-Apopka Road, Palm Road, and East Crown Point Road. Although no changes are recommended at this time, the City should approach Lynx as the study area develops to discuss how public transportation can better serve the growing area. This would be especially beneficial for corridors that are projected to operate at six-lane capacities but will not feasibly be widened beyond four-lanes in the future, such as Clarcona-Ocoee Road. Figure 13 Multi-modal improvements in the Northwest Sector 2025 Improved Network Complementary improvements West Orange Trail Bike lane Greenway MAY
37 5.2 UTILITIES The analysis of the City of Ocoee s water and wastewater systems was based on the growth scenarios developed through early phases of the study and described in Section 4. The generation of demand rates was determined from the projected populations for each scenario using the Traffic Analysis Zone (TAZ) information and typical estimated values for water and wastewater usage. A population of 55,000 was estimated for 2025 within the Utility Services Boundary (USB). Additional information was obtained by use of the City s water and wastewater operating reports, interviews with City staff, permit reviews and the City s current Comprehensive Plan. The Northwest Sector study area is divided by the USB, which is the dividing line between the City of Ocoee and Orange County service areas. This essentially separates the City from serving the northern portion of the study area. From discussions with Orange County, it is understood that the County currently has infrastructure in place or has plans to provide service to their portion of the Northwest Sector. Currently, the County has a 20-inch water main and a 16-inch water main along Ocoee-Apopka Road to provide water services. The County also has a 12-inch force main along Ocoee-Apopka Road with plans to extend it further south with an eight-inch force main for provision of wastewater service. For the Northwest Sector Study, it was assumed that the water and wastewater demands from the County s service area will remain with the County and was not included in the water or wastewater demands for the City. It should be noted, however, that the County has indicated that they are willing to provide water and wastewater service to the City s portion of the Northwest Sector, contingent on an amendment of the city-county service agreement, and if the new developments that occur would be willing to accept reclaimed water from the County. NORTHWEST OCOEE SECTOR STUDY Water System Proposed Transmission Mains The City s existing pipeline network was reviewed to determine where new transmission mains may be required to service the Northwest Sector within the USB. The City s hydraulic model was used to size the proposed transmission mains. Northwest Ocoee is currently served by a 12-inch loop that runs north-south along Ocoee Apopka Road, east-west on Fullers Cross Road and north-south on North Lakewood Road. To serve the northeast side of the Sector, two loops are proposed. Loop 1 is a 12-inch loop that connects to the existing 12-inch transmission main at N. Lakewood Avenue and Fullers Cross Road. The line then runs north along N. Lakewood Avenue, turns east on Clarcona Ocoee Road and finally turns south on Lauren Beth Avenue where it ties in to the existing 14-inch transmission main at the intersection of Nicole Boulevard and Lauren Beth Avenue. Loop 2 will serve the proposed development north of Lake Meadow. The proposed loop is an eight-inch transmission main that ties into Loop 1 at Clarcona-Ocoee Road and Lauren Beth Avenue, runs north on Clarcona-Ocoee Road, and turns south at N. Clarke Road where it ties into the existing 12-inch transmission main at N. Clarke Road and Majestic Elm Boulevard. Loop 3, an eight-inch main running north south along East Crown Point Road that ties into the existing 12-inch line at the corner of Ocoee- Apopka Road and Fullers Cross Road is also proposed. This line is necessary to serve the area between the Western Expressway and East Crown Point Road. Due to the small growth potential for this area, this proposed route should be further examined once developments are proposed Water Demands Water demands for the Northwest Sector were estimated for 2025 from TAZ data developed during the initial phases of the study. The total water demand for each TAZ in the Sector was estimated based on the land use scenarios, and demand for each TAZ was determined by the estimated flow rates for water consumption by the various use types and the scenarios (100 gpd 32 68
38 for single and multi-family; 25 gpd for commercial, industrial and service). The demands generated in each TAZ were allocated to the nodes in the pipe network that are in proximity to the respective boundaries. The nodal demand allocations are included in the appendix. Of the three growth scenarios, there was no significant variation in the TAZ area water demands. Based on assumptions made and modeling criteria, the City s potable water system will not have adequate capacity in the year Heightened development intensity in the Northwest Sector under all growth scenarios will have a significant impact, especially on the Jamela Plant. In addition, the higher elevation of the Jamela Plant requires that operational protocols at all three water treatment plants balance the flows. The elevated tank at the Jamela Plant is slated for demolition and there is no storage infrastructure within the distribution system. It is recommended that the City begin planning for the construction of a new water treatment plant to take the place of the Jamela Plant, which will be approaching the end of its service life. In addition, the well capacity at the Jamela site can not be increased. The results of this study show that expansion into the Northwest Sector will require increased capacity from the potable water system. From water demand records obtained from the City, the average daily flow for the year 2004 was 4.6 MGD. Using a maximum day factor of 1.87, the maximum day demand was 4.6 X 1.87=8.6 MGD. Applying a peak hour factor of 3.0, the peak hour demand equals 4.6 X 3.0=13.8 MGD. The total firm capacity of the existing system is 13.9 MGD. Therefore, the system is already at capacity. In order for the system to operate according to the criteria used in the model and handle increased future water demands, the system capacity must be increased. A preliminary cost estimate for a new water treatment facility sized to meet the future demands is approximately $4,150,000. The following initial recommendations are made to be able to meet the needs of the potable water system in 2025: The City should begin the process to construct a new water treatment plant and take the Jamela Plant out of service. A proposed location for the new plant is a City-owned property north of 10 th Avenue and east of North Lakewood Drive. Model runs result in a nominal firm capacity of the new plant of 8,500 gpm (about 12.3 MGD). The City should consider constructing the plant in the near future (within five years) to take advantage of current construction costs. Upgraded facilities that are being installed at the Jamela Plant may be used at the new water plant or at other facilities in the City. Continue with current plans to install variable frequency drives (VFDs) at all three plants, initially at Jamela. This is estimated to cost $115,000. Install controls including telemetry and a programmable logic controller to allow the plans to communicate and balance flows under all demand conditions. The estimated cost for all three plants is $150,000. As developments are proposed, the City should re-evaluate the water system and add the proposed loops as necessary. The recommended improvements to the potable water system are summarized below: Table 7 Cost summary for water system upgrades RECOMMENDATION ESTIMATED COST New water treatment plant $4,150,000 Proposed transmission mains: --- Loop 1 12 water main $800,000 Loop 2 8 water main $635,000 Loop 3 8 water main $610,000 Loop 4 12 water main $252,000 Addition of VDFs to pumps $115,000 Addition of telemetry and logic $150,000 TOTAL $6,712,000 MAY
39 5.2.2 Existing Wastewater System The portion of the Northwest Sector that is within the City s service area boundary does not have a significant amount of sanitary sewer infrastructure. The current wastewater system in this Sector consists of a small gravity sewer system and an eight-inch force main along with three lift stations. These components are located in the southern portion of the Sector and there is no other wastewater infrastructure in the area. Most of the area is either undeveloped or is able to have their wastewater needs served by septic systems. The City s current wastewater system includes an eight-inch force main that runs along Palm Drive and connects to a 12-inch force main at Ocoee- Apopka Road. The 12-inch force main flows south to lift station #8 on SR 50. As a result, the wastewater is moved to the east along SR 50 before being re-pumped to the AD Mims Wastewater Treatment Plant. To avoid excessive re-pumping of the new flows from the Northwest Sector, the preferred route for all wastewater generated in the study area should be accomplished by re-routing the existing and new flows along an easterly path and thereby creating additional capacity in the system downstream of the Northwest Sector. This routing will be the design basis for the remainder of the wastewater service analysis. This also assumes that the City will provide wastewater service to the Northwest Sector within the USB Wastewater Transmission Service Options Three options have been developed for provision of wastewater service to the Northwest Sector. In all three options, the collection system will remain mostly the same. All cost estimates listed include both transmission and distribution system relevant to the individual option. Option 1 Orange County provides wastewater service From discussions with Orange County, the County has an existing 12-inch force main running along Ocoee-Apopka Road, with plans to extend it further to the south with an eight-inch force main for wastewater services. The County has indicated that they would be willing to provide NORTHWEST OCOEE SECTOR STUDY wastewater treatment to the City s portion of the Northwest Sector, provided that the City agrees to relinquish the area, the service agreement is modified, and any new developments would be willing to accept reclaimed water. The estimated cost for the option is $3 million. Should the City reach an agreement with the County to serve the area, an estimated loss in impact fees along could be $13 million (estimate based on the study s estimated growth through 2025 and the City s current wastewater connection rate, which is assumed to be collected by the County). The City may also lose out on potential revenue by not serving the area. Option 2 Wurst Road to AD Mims Plant This option assumes a 12-inch force main will run from lift station B, go south on Ocoee-Apopka Road, then go west on the planned expansion of Wurst Road, and continue on the existing Wurst Road to the AD Mims wastewater treatment plant. The main benefit of this option is that it provides the most direct path to the plant, and could be timed with the Wurst Road extension project. The estimated cost for this option is $3.8 million. Option 3 Clarcona-Ocoee Road This option will expand wastewater service outside of the study area to serve two proposed developments along Clarcona-Ocoee Road, just north of Lake Meadow. The main benefit of this option is that wastewater services can be extended along Clarcona-Ocoee Road from Lauren Beth Road to North Avenue to serve the new developments and provide service to the neighborhoods along this route. This option would also require a third master pump station to pump wastewater via a 16-inch force main from Lauren Beth Road to the plant. The estimated cost for this option is $4.9 million Wastewater Treatment Plant The City currently operates the three million gallon per day AD Mims Wastewater Treatment Plant with a current average daily flow of 1.61 MGD. According to the Comprehensive Plan, a 1.5 MGD plant expansion is scheduled to occur prior to Using the projected 2025 wastewater flows from this study, an estimated increase of MGD to the current plant 34 68
40 capacity is necessary. This additional capacity is consistent with the estimates already in the Comprehensive Plan, which accounted for higher growth in the Northwest Sector. Typical construction costs to build this type of facility for the additional 1.5 MGD proposed in the Comprehensive Plan will cost between $3.75 and $5.25 million. The City or Orange County will need to develop wastewater collection and transmission infrastructure to sustain the planned growth in the Northwest Sector. In all options for the transmission systems, the collection system is nearly identical, except for Option 3, which includes growth outside of the service area. Option 3 allows the most flexibility in the development for the area north of Lake Meadow as well as the Northwest Sector. The AD Mims Wastewater Treatment Plant is already scheduled for an expansion by 2010 that will sustain the planned growth in the Northwest Sector. MAY
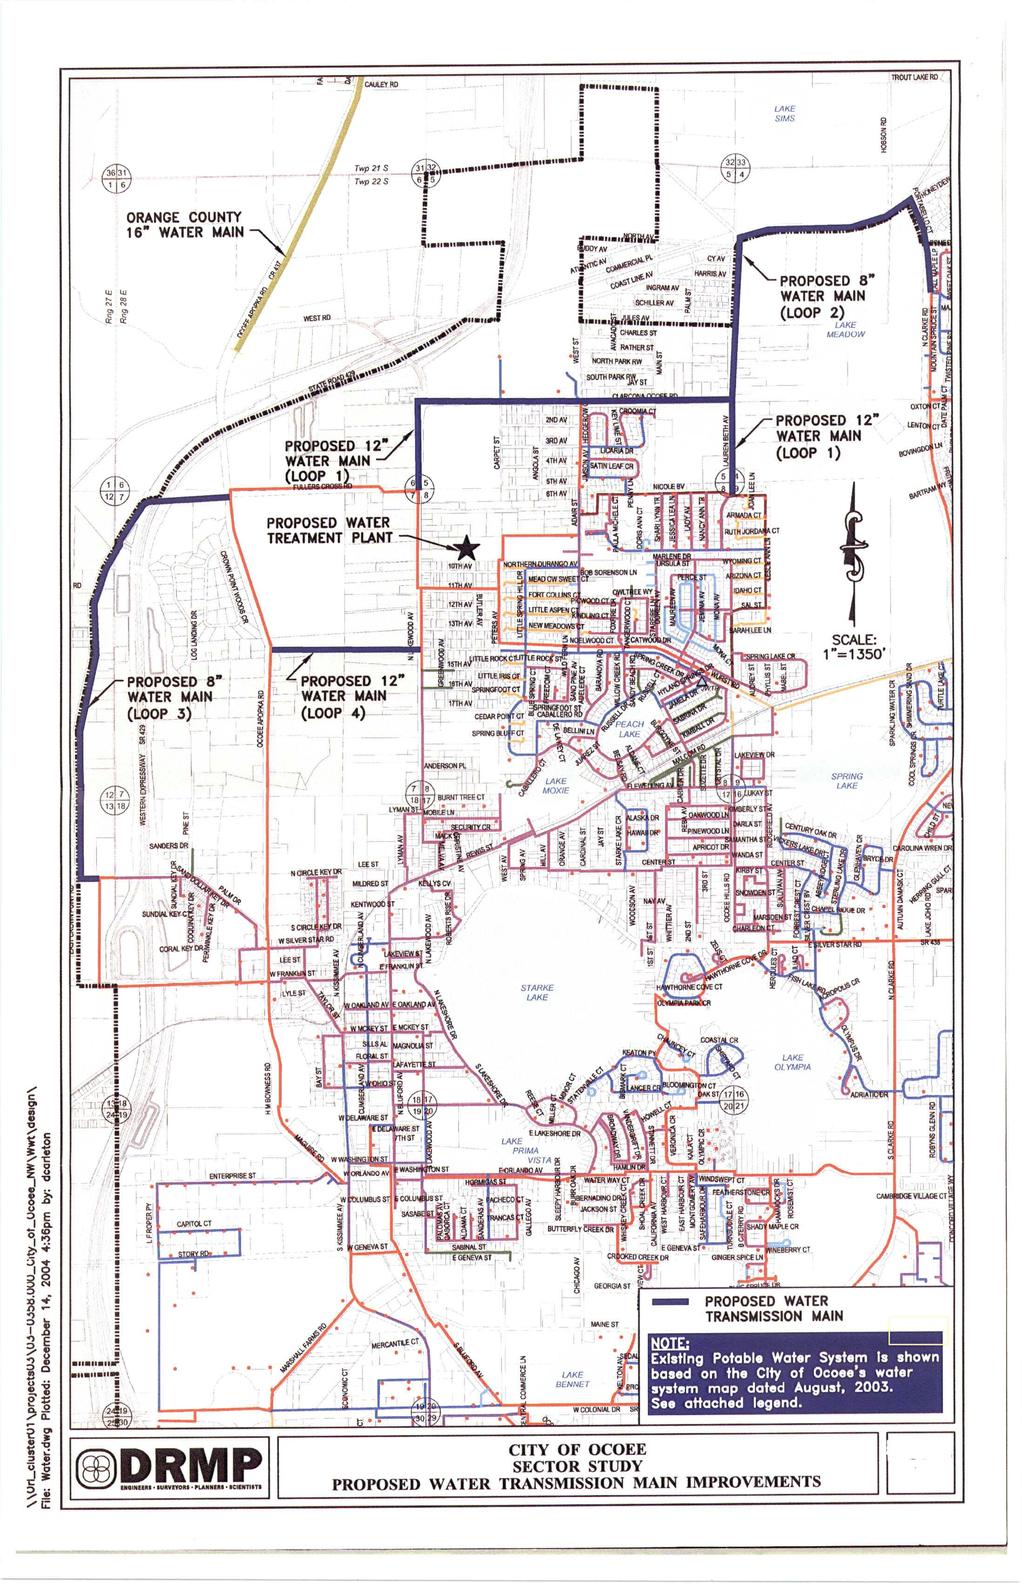
41 Figure 14

42 Figure 15
43 5.3 LAND USE AND URBAN DESIGN Several design concepts emerged as necessary components to the planning framework of the area. These concepts are introduced below and described in further detail in this section. 1. Streets Streets provide the framework for the Sector, and a well-designed, interconnected street system is critical to the success of high quality development. 2. Connections within Developments and to Adjacent Properties Improved internal circulation is a fundamental element of both the multi-modal and park once environment, where citizens can comfortably walk between buildings and are not required to drive for any trip other than arrival and departure from an activity center. 3. Landscape Landscape design should aesthetically complement and enhance the character of buildings, roads and the pedestrian streetscape. Landscape, by drawing natural elements into the built environment, buffers harsh elements in order to maintain pedestrian-friendly and visually appealing streets. 4. Open Space Carefully planned open space is necessary for the richness of mixeduse centers and the vitality of the public realm. 5. Stormwater Planning for stormwater detention at the sector-level is essential for maintaining an ecological balance. The use of shared stormwater detention systems for multiple sites is recommended to maximize the development potential of a site. 6. Gateways The objective of a gateway is to announce that one is entering a special area. If properly designed, a gateway placed at the entrance to a special area, can result in slowing a driver s speed thereby creating a safer pedestrian environment. Design Concept #1 Streets Streets and corridors provide the framework for the sector and place. Effective street design is critical to the success of high quality development. Streets must provide an efficient and interconnected network for vehicles, bicycles and pedestrians. Street function and appearance must be balanced with the built environment and create a pleasant and safe experience for all travelers and residents that have homes and/or businesses facing the streets. To ensure a lively and functional street setting, street networks must avoid concentrating travel on a few large roads. A more diverse roadway fabric provides multiple routes of access and evenly distributes activity to create a more energized urban environment. The dispersal of vehicle loads allows streets to be narrower and therefore treated at a human scale. Streetscape elements provide a softened appearance and enhance the quality and appearance for pedestrians. On-street parking and street trees help define a comfortable pedestrian realm buffered from vehicular traffic. Narrow road widths naturally reduce travel speeds and give greater spatial enclosure to the street environment. Enclosure allows the streetscape to be experienced as an urban room, a space that attracts pedestrians and jumpstarts activity. Pedestrian Crossings Pedestrian crossings are a critical element of the pedestrian network. Safe and convenient crosswalks make a sidewalk system usable and appealing, encouraging pedestrian activity. Crosswalks should be clearly marked and located carefully in relation to vehicular traffic. To ensure safety and usability, crossing distances should not exceed 50 feet. Bulb-outs and median refuge islands should be used to reduce crossing distances for pedestrians. Marked crosswalks (specially paved or painted) indicate the appropriate route across traffic for pedestrians, assist the visually impaired, and serve as a reminder to motorists. Crosswalks should be aligned with the path of the sidewalk to ensure accessibility. Intersections and crossing areas with heavy traffic or wide crossing distances require crossing signals to aid pedestrians and motorists. NORTHWEST OCOEE SECTOR STUDY 38 68


44 Figure 16 Paved crosswalks highlight crossing points for pedestrians and serve as a visual indicator for motorists street s spatial enclosure. Neighborhood streets have curb and gutter drainage. Figure 18 Conceptual neighborhood street cross-section Main Street A main street provides low-speed access to highdensity mixed-use commercial and residential areas. A main street may serve as a focal point to a mixed-use center. Narrow street widths create spatial enclosure and sidewalk bulb-outs and allow short pedestrian crossing distances. Planting strips are replaced with planting wells. In Northwest Ocoee, main streets should be central features of the focal points that will develop over time. These focal points include the IIA North, IIA South and the Crown Point PUD. Figure 17 Conceptual main street cross-section In the study area, neighborhood streets should make up the grid of streets in the IIAs, as well as other mixed-use development proposals for the Sector. Neighborhood streets should connect to form a grid, instead of making dead-ends or culde-sacs. This will facilitate a more orderly and attractive development pattern, and serve as the basis for the block sizes and scale. Design Concept #2 Connections within Developments and to Adjacent Properties Improved internal pedestrian circulation is a fundamental element of both the multi-modal and park once environment, where citizens can comfortably walk between buildings and are not required to use the car for any trip other than arrival and departure from an activity center. New developments should be required to feature walkways among all buildings, public open spaces and parking areas. Additionally, there should be direct linkages to neighboring land uses without requiring use of the primary street Neighborhood Street A neighborhood street is a local, low-speed thoroughfare connecting residential and mixeduse areas. Neighborhood streets have an urban cross section that includes sidewalks, street trees in planting strips, and on-street parking. Small building setbacks, such as dooryard or stoop fronts, contribute to the New development should also provide street connections for vehicles in all major directions to and from a site. They should also connect the development to existing neighborhoods, as well as anticipated neighboring development with street dedications or interim stub-outs. The future developer of the adjacent property must then connect to the stub-out, and maintain a permeable street network. As development intensifies, street connections will evolve into a complete street system, providing a high level of mobility and adding to the value of the served properties. The stub-out locations should be consistent with appropriate block lengths. MAY


45 Design Concept #3 Landscape Landscape design should aesthetically complement and enhance the character of buildings, roads and the pedestrian streetscape. Landscape, by drawing natural elements into the built environment, buffers harsh elements in order to maintain pedestrian-friendly and visually appealing streets. Different landscape strategies are dependent on building scale, density, thoroughfare type and land use. Trees and plantings also have important environmental benefits, protecting air quality and water run-off and providing shading to buildings, cars and pedestrians. An essential element of a vibrant attractive streetscape is landscaping. Landscape treatments are used to buffer vehicular traffic from pedestrian movement while providing a visually appealing and physically comfortable environment. Planting strips and trees help to distance paved sidewalks from the street, visually screen passing vehicles, and make the sidewalk a more intimate space. Street trees can help to create walkable streets in both highdensity centers and residential neighborhoods. Landscape buffers may also screen parking lots and conceal building equipment. Landscaping can also be used to integrate roadways with the surrounding areas. Tree and planting screens protect adjacent buildings, properties and open land from high speed traffic. Roadway landscape treatments help ease the transition between center and edge conditions with landscaping taking a more formal appearance at gateway locations. Medians, which break down large road widths, also contribute to this transition. When formulating a landscaping plan, landscaping elements should not inhibit the walkability of the area. For example, care should be taken with the width and spacing of buffers so they do not impede pedestrians and force people to walk longer distances. Public safety should also be a consideration. Dense shrubs or too many large trees can result in pedestrians feeling unsafe, particularly at night. Hardscaping (bricks, pavers) should be used to highlight important public spaces and signal significant roadway elements such as bus stops and crosswalks. Figure 19 Use of hardscaping enhances roadway Street Trees Quality street trees area valuable element in a community and can significantly contribute to the visual and environmental character of neighborhoods and commercial thoroughfares. Mature street trees help soften the landscape in urban areas, and tree-lined streets serve to enhance the ambiance of a neighborhood. In addition, studies have shown that trees increase property values for both residential and commercial areas. Figure 20 Quality street trees and landscaping Other benefits of including street trees as part of new development or redevelopment in the Northwest Sector include: NORTHWEST OCOEE SECTOR STUDY 40 68

46 Pedestrian Amenity Street trees should always be placed in a linear fashion between the roadway curb and the sidewalk. This placement serves to buffer the pedestrian from moving traffic, provides protection from the Florida sun, and, over time creates the spatial enclosure that fosters pedestrian activity. Traffic Calming Street trees are effective in limiting sight distances on roadways and therefore are a valuable tool for slowing traffic to speeds appropriate to neighborhood settings. Environmental Street trees provide practical and aesthetic environmental benefit to the study area by providing a natural habitat for birds and other wildlife, and providing needed green space to buffer roadways from development. Since street trees require significantly less irrigation than other forms of roadside landscape, valuable water resources are also conserved. Design Concept #4 Open Space Carefully planned open space is necessary for the richness of mixed-use centers and the vitality of the public realm. Open space is a broad classification for public spaces ranging from community recreational areas to civic squares. The scale, enclosure and density of surround conditions inform the properties of the open space: formal/informal, active/passive, and open/contained. Formal civic spaces should be located in the center areas, serving the area of highest intensity, while recreational facilities, greenways and neighborhood parks should be strategically placed to serve the mixed-use communities surrounding the core. Many qualities contribute to the appeal of open spaces. Often, environmental and natural features are integrated into open space planning. Wetlands, critical slopes, drainage swales and vegetation should be conserved as open public space wherever possible. In urban settings, water retention systems can be rethought and formalized as landscape elements that punctuate design. Attractive civic spaces in the center, such as canals, ponds and fountains promote gathering, interaction and comfort. Moveable seating, tables and elements that are multi-functional (e.g., planters that are at seat height) allow people to congregate and personally define open spaces. Shade trees, greens and cooling fountains help create a comfortable setting. Design Concept #5 Stormwater Planning for stormwater detention is essential for maintaining an ecological balance. Stormwater detention prevents flooding and helps decrease the amount of sediment and other pollutants that flow into other bodies of water. Stormwater ponds should not disturb wetlands, as they serve as natural stormwater retention areas. The use of shared stormwater detention systems for multiple sites is recommended. Figure 21 Stormwater may be used as an amenity Stormwater ponds and swales should be developed as aesthetic amenities, with regard for the surrounding landscape and buildings. In urban settings, ponds may become formal pools with retaining walls, integrated into the dense urban fabric as attractive public elements. Open space ponds should incorporate gradual side slopes and landscaped vegetation to create a natural setting. Gradual slopes reduce erosion and operate as safety features, eliminating the need for fencing. Stormwater ponds that must be enclosed should be located in the rear yard or not visible from the roadway. The reuse of stormwater for site irrigation is encouraged. MAY

47 Design Concept #6 Gateways The objective of a gateway is to announce that one is entering a special area. A gateway can be a single memorable icon or it can be comprised of several vertical and horizontal elements. If properly designed, a gateway placed at the entrance to a special area, such as Northwest Ocoee s Craftsman District (as described in the next section), can result in slowing a driver s speed thereby creating a safer pedestrian environment. Figure 22 Conceptual gateway treatment In Northwest Ocoee, it will be important to place gateways at important nodes of activity. Gateway features may include specialty lighting with banner opportunities, mast arm signal poles and special pavement treatments at crosswalks and intersections. The intersection curb/sidewalk area should be designed with a 20-foot radius curb and gutter and provide a safe haven for pedestrians to wait before crossing the roadway. The sidewalk materials can be specialty pavers or stamped concrete. Crosswalks should be clearly marked. Corridors that have multiple lanes should provide a safe pedestrian refuge area in the median. Countdown crosswalk signals are also encouraged. NORTHWEST OCOEE SECTOR STUDY 42 68
48 6 PLACE-LEVEL RECOMMENDATIONS The recommended plan breaks down the Northwest Sector by place-type, which refers to specialized districts or subareas within the Sector. Each place type has distinctive design and organizational characteristics. Each place type has its own set of land use and development standards. The plan designates multiple centers for development within the study area. In order to establish development standards for each of the land use designations, these land uses have been categorized according to their type of place within the Sector. This section will describe each place type and identify the land use designations that will implement the development concept. 6.1 MIXED-USE CENTER The mixed-use center is located at the IIA North, and reflects the market demand for mixed use commercial and employment uses at the interchange with West Road and the Western Expressway. The mixed-use center would accommodate larger scale commercial uses, as well as office and residential development. Implementation of the center would involve adoption of design guidelines to create walkable centers and continue to require street and/or sidewalk connections to adjacent uses. Because of the varying parcel sizes and individual ownerships at this interchange, an essential component of this design concept is to ensure that development occurs in a unified and orderly fashion. Public infrastructure, such as parking, stormwater and open space, should not be site-specific. It is not anticipated or expected that the mixeduse center will be built as a single development, under a single owner or developer, or that all the components of the center will be built at the same time. However, it is expected that once this area begins to develop, it will do so rapidly. Therefore, a game plan should be in place to guide and inform development in this area. Ultimately, all of the diverse components of the place should work and function as an integrated and complete mixed-use center. This functionality can be ensured in the following manner: 1. A small-area plan for the IIA should be developed to calculate the maximum amount of community infrastructure needed - parking, open space, stormwater retention and internal roadways. The plan should also identify easements for the needed community infrastructure. Development site plans for properties within the Master Plan area must recognize and preserve these easements and organize buildings and other site features appropriately to the easements. The value of the easement may be credited to the fees paid by the development for community infrastructure. If an easement does not allow for the adequate use of the property, the designated financing entity is required to purchase the entire property for fair market value. This approach ensures that block sizes and building placement furthers the goals of the master plan. 2. If adequate public facilities are available to meet the demand of the development, the development pays a community infrastructure fee to the designated financing authority according to the fee schedule set forth in the infrastructure financing plan, as set forth in a master plan to be created for the IIA. 3. If there are not adequate public facilities available to meet the demand, then the development has the option of: a. Building the needed community infrastructure in a common location accessible to all development as designated in the master plan; or b. Providing needed infrastructure on site. In either case, the development is exempt from paying the community infrastructure fee for the on- or off-site infrastructure provided. If a development provides on-site infrastructure, then that infrastructure can be developed in later phases so long as the public facilities are available for the demand generated by the new development. The development is responsible for paying infrastructure fees according to the fee schedule and the added demand. MAY
49 FIGURE 23 INTERCHANGE IMPACT AREA NORTH MIXED-USE CENTER MIXED USE CENTER DEVELOPMENT STANDARDS DESIGN ELEMENT CENTER EDGE BLOCK SIZE 3,600 perimeter (1,000 X 800 ) May vary STREET TYPES Avenue, Main Main, Neighborhood FRONTAGE TYPES Shop, stoop, dooryard Shop, stoop, dooryard LOT F.A.R minimum 0.35 minimum BUILDING HEIGHT 5 stories maximum 3 stories maximum PARKING On-street, internal surface On-street and surface LAND USE Employment-based uses including office, medical, light industrial, light manufacturing and retail % of block area at center: Mixed-Use: 25-75% Commercial 20-40% Residential 10-20% Industrial 0-20% Civic and Open Space 10% RESIDENTIAL DENSITIES High Medium to high Employment-based uses including office, medical, light industrial, light manufacturing and retail MIXED USE CENTER DEVELOPMENT REFERENCES MIXED USE STREETSCAPES FRONTAGE TYPES AND STANDARDS SHOP FRONT Ground floor height 14 Minimum Build-to line 0-10 Sidewalks 8-12 On-street parking Planting wells with shade trees Awnings and cantilevered signage STOOP FRONT Elevated Ground Floor Entry 5 maximum Ground floor height 10 minimum Build-to line 5-10 Sidewalks 5-7 Planting strips with shade trees 4-6 On-street parking DOORYARD FRONT Elevated ground floor entry 5 maximum Ground floor height 10 minimum Build-to line 5-10 Sidewalks 5-7 Planting strips with shade trees 4-6 On-street parking OTHER KEY DESIGN FEATURES Interconnected, multimodal street network Unified development Context-sensitive street design Features include interconnected system of streets (main streets, neighborhood streets, boulevards, etc.) that include provisions for pedestrians and bicyclists. All components of individual sites should work and function as an integrated place. This includes design features such as streetscapes and facades, as well as common infrastructure (e.g., parking, stormwater and open space). In addition, individual developments shall promote a park once environment. New or upgraded roadways shall be sensitive to the street function and existing or planned land uses.
50 6.2 CRAFTSMAN DISTRICT The City s IIA South is located at the interchange of the Western Expressway and Palm Drive. An older, industrial section of the City, the area is a prime candidate for redevelopment. However, with the demand and shovel-ready land available at IIA North, it is unlikely that IIA South will redevelop on its own. Therefore, the City will need to step in and facilitate a redevelopment process to ensure the long term vitality of the area. Similar to the master plan recommended for IIA North, the City will need to develop a master plan for IIA South. This master plan will be different in that it will be focused on a theme to promote the area. The concept of a craftsman district has the potential to revitalize the area. A craftsman district is envisioned as a vibrant, urban place anchored by light industrial uses, combined with traditional mixed-use. Light industrial uses include the manufacturing and retailing of craft goods examples include masonry (e.g., manufacturing of pavers, custom fireplaces), carpentry (e.g., furniture- and cabinet-making), blacksmith (e.g., iron fixtures for home and garden). This concept could be particularly successful given the residential demand in West Central Florida and the rampant construction of housing units in Ocoee and surrounding communities. The craftsman district may contain live-work lofts. These units are designed for those who want to create their craft and sell their craft in the first floor of their home. This is a common concept in mixed-use districts, where retail is located on the first floor and residential is located on upper stories. To make this district particularly vibrant, other types of smaller-scale retail and employment uses should be integrated. These uses include restaurants and cafes, gift shops, small grocers, personal services, and civic uses. MAY
51 FIGURE 25 INTERCHANGE IMPACT AREA SOUTH CRAFTSMAN DISTRICT MIXED USE CENTER DEVELOPMENT STANDARDS DESIGN ELEMENT CENTER EDGE BLOCK SIZE 3,600 perimeter (1,000 X 800 ) May vary STREET TYPES Boulevard, Avenue, Main Main, Neighborhood FRONTAGE TYPES Arcade, shop, stoop, dooryard Shop, stoop, dooryard LOT F.A.R minimum BUILDING HEIGHT 5 stories maximum 3 stories maximum PARKING On-street, internal surface On-street and surface MIXED USE CENTER DEVELOPMENT REFERENCES FRONTAGE TYPES AND STANDARDS EXAMPLES LAND USE Commercial/light industrial-based uses including light manufacturing and retail, small-scale office and services, restaurants and cafes, public marketplace, and high density residential. % of block area at center: Commercial 20-40% Light Industrial 10-50% Residential 10-20% Civic and Open Space 10% Commercial/light industrial-based uses including light manufacturing, retail, services, restaurants and cafes, and high density residential. ARCADE FRONT Ground floor height 14 minimum Build-to line 0 Sidewalks 8 Arcade (covered sidewalks) On-street parking Planting wells with shade trees SHOP FRONT Ground floor height 14 Minimum Build-to line 0-10 Sidewalks 8-12 On-street parking Planting wells with shade trees Awnings and cantilevered signage RESIDENTIAL DENSITIES High Medium to high DOORYARD FRONT Elevated ground floor entry 5 maximum Ground floor height 10 minimum Build-to line 5-10 Sidewalks 5-7 Planting strips with shade trees 4-6 On-street parking STOOP FRONT Elevated Ground Floor Entry 5 maximum Ground floor height 10 minimum Build-to line 5-10 Sidewalks 5-7 Planting strips with shade trees 4-6 On-street parking OTHER KEY DESIGN FEATURES Interconnected, multimodal street network Unified development Context-sensitive street design Features include interconnected system of streets (main streets, neighborhood streets, boulevards, etc.) that include provisions for pedestrians and bicyclists. All components of individual sites should work and function as an integrated place. This includes design features such as streetscapes and facades, as well as common infrastructure (e.g., parking, stormwater and open space). In addition, individual developments shall promote a park once environment. New or upgraded roadways shall be sensitive to the street function and existing or planned land uses.
52 7 SITE-LEVEL RECOMMENDATIONS Each site plan submitted in the study area should illustrate an appropriate relationship with surrounding neighborhoods. The design along the edges of a site should be compatible in scale and appearance with adjacent uses. Just as important, however, is that the site be well integrated into surrounding areas and not be designed with barriers to isolate it from nearby developments. This makes it easier for the pedestrian-friendly environment created on the site to extend into adjacent areas. Questions to ask when reviewing the proposed site plans include: Are the buildings along the edge of the site oriented outward along existing streets? Does the site contain multiple connections to surrounding neighborhoods and adjacent uses? Does the development contain a complementary mix of land uses (proximity of residential, commercial and employment centers)? Does this development application further the vision of the Northwest Sector plan? Through stringent development review standards, Ocoee can encourage quality, high value development. The following section identifies several physical design elements typically addressed during the review process and recommends a new design review framework. 7.1 BUILDINGS AND FRONTAGES Building frontages are the interface between the public street and the building interior. Treatment of building fronts should reflect the use of the interior space. Retail frontage (storefront) is intended to draw the public into the interior, yet allows the residents to observe and engage with neighbors and passer-bys. The ground level should always be given the most careful consideration. Ground floor heights, façade articulation, setbacks and entry design have a critical impact on the overall street environment. The typical progression from street to building includes vehicular traffic, on-street parking, landscaping elements and street trees, sidewalk, and building entry. The dimensions and relationships between elements vary depending upon building types and uses, vehicle traffic, and pedestrian traffic. Buildings in the core of a center should abut the right-of-way to create a significant street presence. Arcade fronts and shop fronts create a shared space between the sidewalk and building. This overlap provides a gradual transition from the busy flow of the street to the building s interior. Minimum ground floor heights ensure that the civic nature of the streetscape is maintained. Stoop and dooryard entries are set further back from the street, free from busy vehicular traffic. 7.2 BUILDING RECOMMENDATIONS Much of the current development pattern in Ocoee and elsewhere is oriented towards the automobile. By simply reconfiguring a site, building placement can reduce walking distances for customers and make streets more useful for pedestrians, transit users and cyclists. Buildings should be sited to complement the existing built environment while recognizing the characteristics of the specific project site. Building orientation should balance the combined impacts to building occupants, pedestrians, and open space users. Building entries should border main streets and public thoroughfares to foster vibrant, walkable streetscapes and allow for clear pedestrian access and circulation. Parking and building service equipment should be placed at the rear of the building lot, visually removed from the streetscape. Overall, the master plan recommends encouraging walking by minimizing travel distances, providing direct access to buildings, and creating a pedestrian-friendly streetscape Building Massing Building massing describes the physical form of a building or group of buildings. In order to maintain a comfortable feeling of scale, building massing must be carefully considered in building design. Massing should be compatible with surrounding buildings to create a streetscape MAY


53 that maintains a consistent scale while allowing unique articulation between buildings. Figure 26 Effect of spatial enclosure Figure 25 Effect of building massing A single, uniform building mass should be avoided. Variations in height and horizontal divisions may be used to create façade articulation. Visual aspects of larger buildings must be detailed to maintain a sense of human scale, particularly at the pedestrian level. Varying window treatments and façade materials helps break the mass of a building. Façade elements should highlight primary entrances and different building uses. Roof equipment should be screened from view using setbacks and parapets Spatial Enclosure Spatial enclosure refers to the degree that the edge of the street is defined. Commercial streets typically lack enclosure when parking lots dominate the streetscape. Residential streets lack enclosure when trees fail to make up for large setbacks and empty spaces between residences. Maximum setbacks, or build-to lines, should be established in commercial areas and visually fillin spaces between sidewalks and buildings. Ideally, maximum setbacks should be established so that the building height to street width ratio is no less than 3:1, thereby creating a feeling of spatial enclosure that dignifies the street as public space, calms traffic, and creates a pedestrian amenity Building Articulation Interest-creating features should be used on ground floor facades of buildings. A minimum of 75 percent of new or reconstructed first floor walls should contain interest-creating features. Highly articulated storefronts and homes add interest and variety to the pedestrian experience. Detailed building facades generally provide unique visual sequences that focus pedestrian attention on the setting rather than the walk itself. Many studies conducted throughout the country have documented how redundant environmental forms and sequences have the ability to extend the pedestrian s perception of time and space. Figure 27 Example of well-articulated building In multiple-story buildings, floors should have distinctive changes in exterior material, texture, ornamentation and color. First floor articulation is especially important for mixed-use buildings. Façade treatment should reflect different interior uses, combining larger degrees of transparency NORTHWEST OCOEE SECTOR STUDY 48 68


54 for retail space and smaller openings for residential use. Typically, the first one or two stories of multiple-story buildings are articulated as an architectural base meant to complement human scale and movement. Covered walkways, coupled with the increased floor height of the base, tie the building to the pedestrian realm. Prominent façade treatments at ground level help to highlight public entrances. Upper stories may be slightly set back from the base and treated with different materials and colors, a particularly useful model for mixed-use development Building Entrance Building entry treatment is dependent on use. Retail, office and residential entries have different purposes and priorities. Retail space should have a ground floor entry fronting the public thoroughfare and visible to pedestrians. The entrance should incorporate transparent areas that integrate the interior space with street activity. Signage may be incorporated into the building façade or covered walkway. Often, offices require interiors that are more private than commercial buildings. Office entries should also front public thoroughfares to ensure visibility. Residential entries, when part of a dense area, are set to the side or rear of the building. Often, significant entries are located along the street edge, but side and rear options handle routine traffic. In less dense areas, single-family residence entries are set back from the street right-of-way. Covered porches and stoops are suggested to make visual and spatial connections between the house and street. Arcade Front (Retail and Mixed-Use) An arcade is a series of arches or piers often used to support an overhead covering to create a partially enclosed, protected walkway. Arcade fronts draw the building to the edge of the right-of-way, integrating the sidewalk with the built space. The shared arcade space provides shade and weather protection. Ground floor retail functions can expand into the arcade space. The covered space is an ideal setting for outdoor café and restaurant seating. Figure 28 Arcade front Shop Front (Retail and Mixed-Use) A shop front is intended to promote retail activity. Building façades should be at or near the edge of the right-of-way. Minimum ground floor heights ensure a civic presence at street level. A ground floor façade often has large openings to draw attention inward. Awnings and signage may cantilever over the right-of-way. Figure 29 Shop front Stoop Front (Retail and Mixed-Use) A stoop front provides a comfortable interface between the public streetscape and residential units. Elevating the entrance above sidewalk grade helps minimize building setback. The MAY


55 stoop should be oriented towards the street to encourage interaction between residents, neighbors and passersby. These mix well with shop fronts. Figure 30 Stoop front or unfenced and should be visually continuous in landscaping with adjacent yards. With the deep setback as a buffer, common yards are suitable for higher speed thoroughfares. Figure 32 Common yard front Dooryard Front (Residential and Mixed- Use) A dooryard front includes a paved or landscaped surface between the right-of-way and front façade line and provides gradual transition from sidewalk to building. The large transitional space and elevated entrance allow the building to negotiate significant elevation changes. The open surface can be enclosed as a porch or retained as outdoor space. Figure 31 Dooryard front 7.3 PARKING Over one-half of the built environment in urbanizing areas is devoted to automobile storage. This trend makes multi-modal development patterns very difficult to achieve. Minimum parking standards often do not allow for sharing between adjacent complimentary uses. The proper supply, placement and design of parking are key elements in creating an environment conducive to pedestrians, bicyclists and transit users as well as those traveling by car. Standard requirements can lead to an oversupply of parking spaces and open expanses of asphalt. Better management and design strategies can help integrate parking into high-density areas and reduce the demand for parking spaces. Reducing minimum off-street parking requirements and setting average-use standards instead of peak-use standards can help spur development. Allowing developers to count onstreet parking towards their requirements helps alleviate off-street parking needs. Shared parking allows activities and functions with different peak hours to use the same spaces, significantly cutting down the spaces needed. Common Yard (Residential Use) A common yard front uses a substantial building setback. The front yard created may be fenced NORTHWEST OCOEE SECTOR STUDY Structured parking is appropriate in high-density areas. Garages reduce the total amount of paved area and can fit well into an urban area, maintaining scale and façade articulation. Wrapping structured parking around the perimeter with liner buildings allows a seamless 50 68


56 integration into the urban setting and maximizes the property revenue potential. Large lots with surface parking should be designated in relation to the established block size of the surrounding street grid and parking aisle widths should be consistent with standard street right-of-way requirements. These considerations prepare the site for future infill development, in which surface parking areas are converted into a mix of buildings, garages and streets. Incentives are often needed to offset the high construction cost of parking garages Organizing Parking Facilities Parking adjacent to sidewalks and surrounding buildings gives the automobile precedence over transit or non-motorized modes of travel. Shifting parking to the sides of buildings reduces the walking distance from the sidewalk and helps to create an interesting street wall. Parking quantity is unchanged, but in a new layout. Parking should ultimately be discouraged between buildings and the primary street. Commercial establishments may require parking directly accessible from the street. This can be accomplished by rotating the building 90 degrees to allow for sidewalk frontage and visible parking Planning for Future Development Low-density retail development is often characterized by wide, uninterrupted expanses of asphalt. Parking design and site layout often limit opportunities for future development and increased density. Well-planned parking strategies, however, can prepare a site for future growth. Arranging surface parking in accordance with standard block size and orientation allows site development to occur gradually, lot-by-lot and block-by-block. Selective aisles should be designed consistently with standard right-of-way dimensions, creating a framework for future road development. By planning for future streets and blocks, parking lots can be gradually integrated with the surrounding fabric. Piece by piece, paved open lots may be transformed into higher-density centers. Figure 34 Surface parking infill development over time Figure 33 Building entrances oriented to the street reduce walking distances and help create a continuous street wall over time. MAY
57 8 FISCAL IMPACT AND PROJECT PHASING Major development has not occurred in Northwest Ocoee because the area lacks the necessary connections to the City s central sewer system. For any significant nonresidential development to take place, the City needs to spend $9.4 million to connect the area to the sewer system. This amount includes the capital costs for installing sewer lines in the study area and for upgrading the AD Mims Wastewater Treatment Plant, which services the entire City. The purpose of this chapter is to describe the fiscal impact analysis that was conducted for the Northwest Ocoee Sector Study. The results of the analysis assisted in the development of a phasing plan for development in the area. As sewer is extended and development begins to take place, other capital needs will arise, namely upgrades to the water system and capacity and operation improvements to the transportation network. 8.1 REVENUES The majority of revenues for the City come from property taxes and impact fees. Revenue data for the 2001/02 fiscal year was collected from the City and Orange County, including current millage values and rates, impact fee rates and franchise fee rates Ad Valorem Taxes Average assessments of existing property by land use category were estimated from property appraiser s data (Table 8). For example, commercial retail property was found to have an average assessed value of $62 per square foot. To forecast total assessed values, the average property values were multiplied by forecasts of the total square feet of non-residential space and total residential dwelling units. Total assessed values were then multiplied by the City s ad valorem tax rates (4.570) to estimate future ad valorem revenues. Table 8 Average property values Land Use Average Value Commercial $62 Per square foot Office $52 Per square foot Civic $40 Per square foot Industrial $30 Per square foot Multi-Family $67,000 Per unit Single-Family $108,000 Average unit Source: Orange County Property Appraiser Impact Fees The City provided impact fee rates for transportation, utilities, police and fire by land use category (Table 9). The figures shown in the table (the City approved a new impact fee schedule in 2005) reflect the City s impact fee rates per dwelling unit for residential uses and per 1,000 square foot for non residential uses as a basis for estimating future revenues. Forecasts of nonresidential square feet and dwelling units were multiplied by the City s new impact fee rates to estimate total impact fee revenues by the horizon year. Land Use Table 9 City of Ocoee impact fee rates Police/ Fire/ Rec Water Sewer Transportation Commercial $830 $689 $2,044 $11,395 Office ,635 7,642 Civic Institutional ,635 3,651 Industrial 830 1,034 3,066 2,242 Multi Family 2,697 1,379 4,089 2,548 Single Family 2,697 1,379 4,089 4,223 Source: City of Ocoee NORTHWEST OCOEE SECTOR STUDY 52 68
58 8.1.3 Revenue Forecasts To project future revenues, future non-residential building areas and dwelling units as well as future population were estimated for the Northwest Sector study area (Table 10) and multiplied by the average assessed values and assessment rates, impact fees, franchise fee revenues and other revenues (Table 11). Tax rates were assumed to remain at their current levels over a 20-year planning period. population, resulting in a per capita rate. These per capita rates were then multiplied by the future population of the study area to forecast future expenses. Capital expenses for major infrastructure improvements will fluctuate based on the improvements needed. As a result, capital cost estimates were derived from the transportation, water and wastewater plans for the Northwest Sector. Table 11 Tax Rates for Other Sources Table 10 Population Assumptions, Year Citywide Population NW Sector Population ,785 14, ,299 18, ,814 22, ,026 25,787 Source: Renaissance Planning Group, 2005 Tax Per Capita Rate Total Revenue* Franchise tax $58.62 $1,451,170 Utility tax $71.45 $1,768,773 Licenses and permits $54.99 $1,361,376 Intergovernmental revenue $ $6,759,186 Charges for services $8.04 $198,957 Fines & forfeitures $9.61 $237,821 Misc. revenue $9.12 $225,726 Since a dollar today is worth more than a dollar tomorrow, future revenues were discounted to 2004 dollars. The discount rate represents the opportunity cost, or lost revenue that could have been generated had the dollars been invested each year. The discount rate used in this analysis was derived from historical interest rate data that showed annual trends between two and seven percent. A conservative estimate of three percent was used. This total was then compared with the present value of future expenditures to determine the affordability of the recommended plan. 8.2 EXPENSES Detailed operating and capital expense information was collected from the City. Expenses were grouped by major expenditure categories (Table 12). To determine a per capita rate for operating expenses and minor capital expense, existing expenses by expense category were divided by the City s 2000 Transfers $ $2,861,926 Stormwater fund $46.67 $1,155,219 Solid waste fund $66.74 $1,652,202 Water/wastewater fund $ $5,789,948 Source: Orange County Property Appraiser *Based on future citywide population of 104, Future Expenses As noted above, future expenses were estimated by multiplying population forecasts for the recommended scenario by the per person rate for each expenditure category. As with revenue projections, growth was assumed over 20 years. Future expenses, like future revenues, were discounted to reflect the time value of money. A conservative discount rate of three percent was applied to future expenses. MAY
59 Table 12 City of Ocoee Expenses Expense Category Per Capita Total** General Government*, Planning, building $272 $6,724 Law enforcement, fire control $323 $7,997 Stormwater $37 $906 Water/ wastewater $201 $4,964 Solid waste $63 $1,558 Public works, fleet maintenance, engineering $16 $389 Streets/traffic ROW, maintenance $49 $1,206 Parks and recreation $58 $1,445 * General Government includes legislative, city manager, community relations, city clerk, finance, information systems, human resources, legal, general government, facilities maintenance, communications ** Based on future citywide population of 104,026 Source: City of Ocoee Finance Department Detailed Capital Expenses As noted above, facility specific capital costs were estimated for transportation, water and wastewater infrastructure. The final step was phasing the needed improvements over the 20- year build-out period. A discount rate of three percent was applied to bring the cost of each proposed improvement back to current dollars. Table 13 presents the fiscal impacts of the recommended plan. The revenues column presents study area revenues by time increments over the 20-year planning horizon. The expense columns presents study area operating and capital expenses by service type (roads, water and sewer) for the corresponding time increments over the 20-year planning horizon. During the planning horizon, the study area will generate enough revenue to pay for the anticipated capital and operating expenses. The capital expenses include all facilities listed in Table 14. An important first step will be to obtain funding for an initial capital investment in the sewer infrastructure. No significant commercial property development can occur until the City makes this investment. Although over the 20- year horizon the improvements will pay for themselves, the challenge today is financing the $9.4 million in today s dollars needed for the wastewater treatment plant upgrade and the sewer provision into the study area. Three options, described below, are available for making this investment: 1. Water and Sewer Impact Fees: Connecting a large amount of customers over a period of time will allow for the collection of significant connection/impact fees. The City may have some funds stored away already from collecting these fees from previous connections that will allow an initial investment to be made. As new development occurs, additional fees would be collected to help pay off the bond issue or other loan. 2. The Florida Department of Environmental Protection (FDEP) helps to fund domestic wastewater projects through the State Revolving Loan Fund, the State Financially Disadvantaged Small Community Grant, and the State Bond Loan programs. The State Revolving Loan Fund is administered by the Department of Environmental Protection through the Water Facilities Funding Program. It makes low-interest loans available for construction, rehabilitation, and replacement of facilities needed to collect, treat, dispose of, or reuse municipal wastewater. It is a revolving fund because loan repayments are used to make additional loans. Over the past 10 years, domestic wastewater treatment facilities received close to one billion dollars through the state revolving loan fund. Many domestic wastewater projects throughout the state received a significant portion of these monies. 3. General obligation bond by city or special district. Alternatives for establishing a special district exist (these alternatives are described in Table 15). NORTHWEST OCOEE SECTOR STUDY 54 68
60 Table 13 Fiscal Impact Summary, Northwest Ocoee, Expenses Capital Time Period Revenues Operating Roads Water/Sewer Total Total Surplus $ 74,319,097 $ 60,856,914 $ 2,456,905 $ 4,200,000 $ 6,656,905 $ 67,513,820 $ 6,805, $ 68,537,140 $ 58,525,578 $ 12,747,479 $ 3,467,723 $ 16,215,203 $ 74,740,781 $ (6,203,641) $ 71,542,629 $ 62,531,856 $ 5,597,531 $ 1,579,279 $ 7,176,810 $ 69,708,666 $ 1,833, $ 57,955,127 $ 51,409,118 $ 790,988 $ 7,535,733 $ 8,326,721 $ 59,735,839 $ (1,780,712) Total $ 272,353,993 $ 233,323,467 $ 21,592,904 $ 16,782,735 $ 38,375,639 $ 271,699,106 $ 654,887 Note : Table 13 reflects the projected revenues generated by the North West Sector over the development horizon and the capital and operating expenses needed to support the development. MAY
61 Table 14 Recommended Capital Projects Project Type Location Description Transportation Silver Star Road Widen to 4 lanes and realign Cost (Millions of 2005 Dollars) Identified Funding $9.3 None Transportation Ocoee Apopka Road Widen to 4 lanes $21.9 Partial Developer Transportation Fullers Cross Road/ Clarcona Ocoee Road Widen to 4 lanes and realign $5.1 Partial County Transportation West Road/ Clarcona Ocoee Road Widen to 4 lanes and realign $12.3 County Transportation Wurst Road Extend as a 2 lane $1.8 Partial Developer Sewer AD Mims Plant Wastewater treatment plant upgrade $5.25 None Sewer Wurst Road to the AD Mims Plant OR along Clarcona-Ocoee Rd. Service provision $ None Water Adjacent to Vignetti Park NW Sector Water Treatment Plant $4.2 None Water Water Water 1 Clarcona Ocoee/Lauren Beth Loop. 2 Lake Meadow Loop 3 East Crown Point Loop 4 Wurst Ave Connector Upgrades to existing plants Upgrades to existing pumps Transmission Mains (4) $2.0 None Plant Upgrades $0.2 None Pump Upgrades $0.2 None Total Capital Costs $ Total Costs to City $ NORTHWEST OCOEE SECTOR STUDY 56 68
62 Table 15 Special District Financing Strategies TOOL DESCRIPTION WHERE APPLICABLE Community Development District (CDD) Community Redevelopment Area (CRA) Municipal Services Taxing Unit (MSTU) Infrastructure Financing District FDEP Revolving Loan Fund CDDs are a local unit of special-purpose government created for the delivery of urban community development services. A CDD could be developed by a group of businesses to more quickly effect infrastructure improvements, such as sidewalks or sewer, supplementing limited public funds. CDDs can be characterized in the following manner: Serves to provide infrastructure necessary to meet the increased demand placed upon the locality as a result of the development within the CDD district Serves to issue bonds to finance CDD improvements Serves to generate monies to pay for improvements through special ad valorem taxes or assessments on property within the CDD district A CRA is a public entity created by a city to implement the community redevelopment activities outlined under Florida s Community Redevelopment Act. The CRA is established by the local government and functions within that local government. CRAs typically use tax increment financing (TIF) to leverage public funds to promote private sector activity. An MSTU can be effectuated through interlocal agreement between the county and its municipalities; however, the county is ultimately responsible for administering the MSTU funds. The affected municipalities must agree to the millage assessment and no local government can exceed the 10-millage maximum established by state law. These units are commonly used to fund fire protection, law enforcement, beach erosion control, recreation service and facilities, water, alternative water supplies, streets, sidewalks, street lighting, garbage and trash collection and disposal, waste and sewage collection and disposal, drainage, indigent health care services, mental health care services, and other essential facilities and municipal services from funds derived from service charges, special assessments, or taxes within such unit only. Approval of an MSTU is subject to the consent by ordinance of the governing body of the affected municipality. A special district established for the sole purpose of financing infrastructure improvements in a designated district. Infrastructure financing districts are given bonding authority. The FDEP helps to fund domestic wastewater projects through the State Revolving Loan Fund and makes low-interest loans available for construction, rehabilitation, and replacement of facilities needed to collect, treat, dispose of, or reuse municipal wastewater. It is a revolving fund because loan repayments are used to make additional loans. IIA North IIA South IIA North and IIA South Northwest Sector sewer and water system upgrades Northwest Sector sewer and water system upgrades MAY 2006
63 8.3 Project Phasing Phasing strategies were prepared for transportation and utilities and are presented in Figure 35. The recommended phasing plan is a guide that can be modified as necessary to respond to the projects that may be proposed by the private sector. Also, the City should coordinate its planned actions with the work of other City departments and governmental agencies and be ready to refine its schedule to be responsive to the activities of others. The City should set a high priority on an improvement when it can be consistent with the vision of the plan. However, there will be times when the City faces multiple choices as where to best use its limited resources. When this occurs, the City should consider the project in the context of the following criteria: Timing Does the project under consideration have to be completed prior to other projects being initiated? Would project or staff costs be reduced if the project were to go ahead in conjunction with another project? Visibility Is the project visible to the public? Will the project build upon momentum being generated by sector-wide development? Financing Does the project share development and or operational costs with other entities (e.g., private investor or governmental agency)? Private Investment Does this project leverage or cause the investment of private funds? Location Does this project occur in one of the Sector s designated focal points? NORTHWEST OCOEE SECTOR STUDY 58 68
64 Figure 35 Project Phasing MAY
65 9 IMPLEMENTATION The purpose of this section is to provide a general strategy for the implementation of the Northwest Sector Plan. Implementation will require a planned and coordinated effort involving the community as a whole, property owners, and City staff and officials. Implementation success will depend a great deal on the private sector s willingness and ability to implement the projects recommended in this plan. 9.1 SUMMARY OF ACTION ITEMS Sector-Level Actions Utilities 1. Expand water and wastewater services into the Northwest Sector. Improvements to these systems and expansion/upgrades in the Northwest Sector shall occur when it is most advantageous for the City and for private development. For example, when an opportunity arises for a sewer line to be extended in conjunction with a road improvement project, this opportunity should be taken. 2. Choose an option for wastewater service. Three options are presented in Section Expand sewer system and perform upgrades as needed. 4. Begin the process of constructing a new water treatment plant and take the Jamela Plant out of service. City should construct the new plant within five years to take advantage of current construction costs. Upgraded facilities that are being installed at the Jamela Plant may be used at the new water plant or at other citywide facilities. 5. Continue with current plans to install variable frequency drives at all three plants, initially at Jamela. Install controls including telemetry and a programmable logic controller to allow the plants to communicate and balance flows under all demand conditions 6. As developments are proposed, the City should re-evaluate the water system and add the proposed loops as necessary Transportation 7. Phase in the recommended network improvements to the City s capital improvement program. The recommended transportation improvements will mostly occur when the market is ready. Because many of these projects are dependent upon development-contributions for right-of-way acquisition and construction, the subsequent improvement can not occur until the private development is ready to occur. The exception lies in the county roadways that are already operating over capacity, such as Clarcona-Ocoee Road. The City should continue to coordinate with the County on ensuring that project s inclusion on the County s CIP. 8. Work with Orange County and MetroPlan Orlando on additional capacity needs for Clarcona-Ocoee Road and enhancement projects that provide connections to the West Orange Trail. 9. Implement access management standards. Access management standards can be implemented through amending the City s land development code. Standards requiring shared access should also be included in this amendment. 10. Adopt a multi-modal approach to transportation planning in the Northwest Sector and amend the Land Development Code to support bicycle and pedestrian connections. 11. Implement a system of greenways and connections to the West Orange Trail. The City should require developers to contribute to the greenway system (Figure 13) and provide connections to the West Orange Trail. Land Use and Urban Design 12. Use the recommended scenarios to serve as a guide in land use/development approval decisions. NORTHWEST OCOEE SECTOR STUDY 60 68
66 13. Coordinate with Orange County on implementation as it relates to the JPA. 14. Comprehensive Plan Amendment. A comprehensive plan amendment may be necessary to ensure the desired development pattern proposed for the Northwest Sector is allowed to take place. The Comprehensive Plan serves as the basis for the land development code. 15. Land Development Code Amendments. To implement the design concepts described in Sections 5 through 7, the City may require developments to go through a PUD approval process. However, successful plan implementation will ultimately require a more systematic approach that considers the Sector as a whole, not on a parcel-by-parcel basis. Successful plan implementation requires that land development regulations, incentives, design standards and capital investment programs are all closely integrated in response to the adopted master plan. The optimal manner in which this integration can be achieved is the adoption of formbased zoning districts that can be applied to areas in the Northwest Sector. A formbased code is different from a traditional code in that it envisions and encourages a physical outcome based on the community s vision and expectations. The building blocks of form-based codes are the place-types. The benefit of a form-based code over traditional Euclidian zoning is that the focus is on the physical form of development, rather than the use. This is advantageous because when places are designed properly, the transportation impacts are minimized and the property values are maximized. For development in this area achieve the vision, developers need to have a clear picture of the expectations and community desires. Coupled with a specialized development review process, development in Northwest Ocoee can occur in accordance with the plan. 16. Require quality open space and recreational facilities in subdivisions. Require developers of residential subdivisions to develop shared, on-site active recreational facilities such as pools, playgrounds and ball fields. When funds are contributed by developers in lieu of recreation facilities, the City should use the funds solely for recreation land acquisition and/or the development of new or expanded recreation facilities. These funds should be placed in a separate account and not used for the maintenance of existing facilities. New land development codes should contain Conservation Subdivision Design or Open Space Design regulations that should be applied to areas with high amounts of wetlands or environmentally sensitive lands. Place-Level Actions Interchange Impact Areas North and South 17. Small-area plans for the IIA North and IIA South areas should be developed to calculate the maximum amount of community infrastructure needed - parking, open space, stormwater retention and internal roadways. The plan should also identify easements for the needed community infrastructure. Development site plans for properties within the Master Plan area must recognize and preserve these easements and organize buildings and other site features appropriately to the easements. The value of the easement may be credited to the fees paid by the development for community infrastructure. If an easement does not allow for the adequate use of the property, the designated financing entity is required to purchase the all or some of the property for fair market value. This approach ensures that block sizes and building placement furthers the goals of the sector plan. If adequate public facilities are available to meet the demand of the development, the development pays a community infrastructure fee to the designated financing authority according to the fee schedule set forth in the infrastructure financing plan, as set forth in a master plan to be created for the IIA area. MAY 2006
67 If there are not adequate public facilities available to meet the demand, then the development has the option of: Building the needed community infrastructure in a common location accessible to all development as designated in the master plan; or Providing needed infrastructure on site. In either case, the development is exempt from paying the community infrastructure fee for the on- or off-site infrastructure provided. If a development provides on-site infrastructure, then that infrastructure can be developed in later phases so long as the public facilities are available for the demand generated by the new development. The development is responsible for paying infrastructure fees according to the fee schedule and the added demand. 18. Marketing Strategy. A coordinated marketing strategy for each focal point, particularly the Craftsman District, should be devised to attract appropriate development and visitation. The City should consider teaming with the Chamber of Commerce, or the CRA (if applicable) to oversee redevelopment. A designated coordinator should promote the IIA South area to residents, tourists, shoppers and investors. In addition, a recognizable theme or brand should be devised for the IIA South area. The identity should be authentic and reflect the nature and purpose of the area. The coordinator should also be responsible for developing creative and coordinated marketing materials and signage. Site-Level Actions 19. Establish specialized site plan review procedures for developments in the Northwest Sector. Each site plan submitted in the study area should illustrate an appropriate relationship with surrounding neighborhoods. The design along the edges of a site should be compatible in scale and appearance with adjacent uses. Just as important, however, is that the site be well integrated into surrounding areas and not be designed with barriers to isolate it from nearby developments. Questions to ask when reviewing the proposed site plans include: Are the buildings along the edge of the site oriented outward along existing streets? Does the site contain multiple connections to surrounding neighborhoods and adjacent uses? Does the development contain a complementary mix of land uses (proximity of residential, commercial and employment centers)? Does this development application further the vision of the Northwest Sector plan? 9.2 Financing the Improvements The capital improvements recommended in this plan are ambitious, and will require a concerted effort on the part of the City of Ocoee. A variety of funding mechanisms are available and should be evaluated for their use. Financing tools that could be used to provide needed funding are listed below. 1. Traditional revenue sources (property taxes, impact fees) both current and new 2. Department of Environmental Protection (DEP) financing from the revolving loan fund for water and wastewater infrastructure. 3. General obligation issued by the City or a special district). Special districts may include special district for infrastructure financing, community development district, community redevelopment areas and municipal taxing service units. NORTHWEST OCOEE SECTOR STUDY 62 68
68 Table 16 Implementation Steps LEVEL ACTION RESPONSIBILITY PRIORITIZATION Sector Establish the vision for the area through a sector plan. N/A Completed Sector Identify a preferred funding strategy and make the initial capital investments in sewer/wastewater infrastructure. City Short Term (initial investment) Sector Choose an option for wastewater service. City Short Term Sector Comprehensive Plan Amendment and Land Development Code Amendments City Short Term Sector Require quality open space in subdivisions. City, Property Owners Short Term Sector Implement access management standards. City Short Term Sector Work with MetroPlan Orlando to obtain transportation funding. City, MetroPlan Short Term/ Ongoing Sector Phase in the recommended roadway network improvements to the City s capital improvement program. City Short Term/ Ongoing Sector Begin process of constructing a new water treatment plant. City, Financing Entity Mid-term Sector Continue to expand sewer system and perform upgrades as needed. City; Financing Entity Ongoing Sector Continue with current plans to install variable frequency drives. Install controls including telemetry and a programmable logic controller. City Ongoing MAY 2006
69 Table 16 Implementation Steps LEVEL ACTION RESPONSIBILITY PRIORITIZATION Sector Implement a system of greenways and connections to the West Orange Trail. City, Property Owners Ongoing Sector Coordinate with Orange County on implementation as it relates to the JPA. City, Orange County Ongoing Sector As developments are proposed, reevaluate the water system and add the proposed loops as necessary. City Ongoing/ Longterm Place Develop a place-level master plan for the IIA North. City, Property Owners Short Term Place Develop a place-level master plan for the IIA South. City, Property Owners Mid-Term Place Adopt a form-based land development code to implement master plans. City Short Term or Mid Term (upon completion of the master plans) Place Develop a marketing strategy. City, Special District Mid-Term Site Establish a specialized development review process for applications in the Northwest Sector to ensure a unified, holistic development pattern. City Short Term, Ongoing NORTHWEST OCOEE SECTOR STUDY 64 68


70 Northwest Ocoee Sector Market Assessment Prepared for: August 31, 2004
71 TABLE OF CONTENTS Page INTRODUCTION 2 SUMMARY OF FINDINGS 4 Central Florida Region - Overview 4 Summary Findings West Orange Study Area and Primary Study Area 4 Residential Demand Forecast 6 Non-residential Demand Forecast 8 Implications for the Primary Study Area 8 Scenario Recommendation 10 WEST ORANGE STUDY AREA AND PRIMARY STUDY AREA (NORTHWEST OCOEE AREA) 11 Residential Development 12 Primary Study Area Implications 14 Non-residential Growth & Employment Centers 16 Proposed/Planned/Recently Approved Non-residential Facilities 17 Calculation of Resident Retail Demand 19 Calculation of Industrial Demand 20 Primary Study Implications 21 Development Scenario Recommendation 23 CENTRAL FLORIDA CASE STUDIES 24 Northeast Oviedo Area 24 Waterford Lakes/Avalon Park Area 26 REGIONAL OVERVIEW 30 Orlando and Lakeland-Winter Haven Metropolitan Areas 30 Households Trends 31 Housing Unit Structures 32 Regional Employment 36 Northwest Ocoee Sector Market Assessment Real Estate Research Consultants, Inc. 1
 and Renaissance Planning Group to perform a market assessment and identify and test development concepts with the planning team for properties collectively referred to as the Northwest Ocoee")
72 INTRODUCTION The City of Ocoee Planning Department retained Real Estate Research Consultants, Inc. (RERC) and Renaissance Planning Group to perform a market assessment and identify and test development concepts with the planning team for properties collectively referred to as the Northwest Ocoee Primary Study Area (herein referred to as Primary Study Area ). The Primary Study Area is about 3,300 acres, encompasses an area near the intersection of SR 429 and Ocoee - Apopka Road, just east of Lake Apopka, west of Adair Street, north of Plant Street and Franklin Street, and south of McCormick Road. The northern boundary of the Primary Study Area is approximately four miles south of US 441 in Apopka, while the southern boundary is about 1.5 miles north of SR 50. Please refer to Map 1 for the general location of the above-mentioned Primary Study Area. Map 1 Northwest Ocoee Primary Study Area Location Note: The study area boundaries are not exact and are for illustrative purposes only. The main objective of the market analysis is to ascertain the demand for land uses that might be appropriate for development within the Primary Study Area and to quantify the potential scale and timing of these uses. Working with the client, Renaissance Planning Group conceived three development scenarios. The table that follows identifies the land use based scenarios that reflect these three possibilities of development. Each scenario reflects varying levels of development intensity identifying square footage by land use type by the year Residential Focused Has a more residential concentration, rather than focusing on employment use. This scenario has the highest population and dwelling unit projection, but is more reflective of recent trends. The residential-focused scenario is most similar to the City s current future land use map. Northwest Ocoee Sector Market Assessment Real Estate Research Consultants, Inc. 2
73 2. Employment Focused Has a more even distribution between residential and employment use. 3. Balanced Has a more employment use focus, including industrial, office, and retail uses. This scenario has the highest employment projection reflected in developable square footage. Alternative Development Scenarios - Year 2020 Residential- Focused Source: Renaissance Planning Group; City of Ocoee, TAZ Data Employment- Focused Balanced Residential Single Family Units 5,424 4,985 5,104 Multi Family Units ,059 Total Units 6,276 5,947 6,163 Non-Residential Retail SF 1,063,111 1,062,139 1,062,139 Services SF 115, , ,140 Industrial SF 1,668,183 2,275,858 2,419,143 Total SF 2,847,012 3,985,137 4,128,422 The objective of identifying development scenarios is to illustrate potential opportunities for achieving development of the Primary Study Area. The work here responds to particular opportunities identified in cooperation with the client, property owners and the entire planning team. The market study will evaluate the three scenarios and recommend which one is the most appropriate for the Primary Study Area. Below are the tasks undertaken to perform the market analysis for the Primary Study Area: Analyze growth trends in West Orange County, as it applies to the City of Ocoee as a whole and to the Primary Study Area. Determine how the Primary Study Area would impact the existing growth trends. Identify land uses which offer potential for development of the Primary Study Area being evaluated, given the links to adjacent neighborhoods and neighboring cities of Winter Garden, Apopka, and unincorporated Orange County. These land uses include residential, retail, and miscellaneous commercial, which includes light/flex industrial, light manufacturing and office. Prepare ranges of potential market demand for the appropriate land uses for the next ten to fifteen years; demand to be expressed in square footage, units, etc. Address the likely sources of demand (e.g., residents, employees, tourists, etc.). Identify the competitive environment for appropriate land uses, considering existing, planned, and proposed projects in the relevant market area; Prepare market conclusions and demand estimates of development potential for appropriate uses, considering sources of demand and competitive position. Recommend the most market supportable development scenario. Northwest Ocoee Sector Market Assessment Real Estate Research Consultants, Inc. 3
74 SUMMARY OF FINDINGS Central Florida Region - Overview Central Florida has been experiencing increasingly strong levels of growth in the past three decades as detailed in the Regional Overview section. In 1970, the population in the fourcounty Orlando MSA and Winter Haven MSA (Polk County) was approximately 752,000. The 2003 population estimate was 2,341,000, and the 2020 forecast projects the population for the two Metro Areas will increase to 3,192,000. Correspondingly, housing units also grew at a tremendous pace. In 1970, the five-county total was approximately 263,000. The 2000 Census count estimated the figure to be 910,000 while the 2020 forecast figure is approximately 1,400,000 housing units. The transformation of Central Florida from a predominately agricultural area to a residential community has had ramifications on the types of land uses that have been approved and developed; their scale and density/intensity and their location have significantly changed the landscape of the entire region. Amongst the five counties in the region, Orange County has been quicker to develop due to its superior transportation access, major employment and activity centers and municipalities. The western portion of the County has been catching up with an assortment of residential communities and supporting commercial facilities. This growth has coincided with the expanding highway access and transportation facilities constructed in the 1990s that linked the western area of Orange County closer to the Orlando downtown core and regional activity/employment centers. Mirroring the residential development growth in the recent past, the counties within the Central Florida region have experienced a healthy growth in supporting non-residential development. The following is a summary of the tax rolls for the five counties in the region: Retail 165,000,000 square feet of retail development. Office 85,000,000 square feet of office development. Industrial 196,000,000 square feet of industrial development. Summary Findings West Orange Study Area and Primary Study Area After profiling the Central Florida region, which appears at the end of this report, RERC focused on the Primary Study Area and the west side of Orange County, herein referred to as the West Orange Study Area. Focusing on the West Orange Study Area, which comprises a five-mile radius around the intersection of West Road and SR 429 (Map 2), RERC was able to gain insight on possible development trends that could be anticipated in the Primary Study Area (Map 1). RERC reviewed the tax roll data prepared by the Orange County Property Appraiser, as well as supporting residential market reports, to provide insight on the type and amount of growth occurring within the Primary Study Area. In addition, RERC also interviewed local developers and County and City planning staff to verify some of the data researched. Northwest Ocoee Sector Market Assessment Real Estate Research Consultants, Inc. 4
75 West Orange Study Area Residential Development The larger West Orange Study Area has enjoyed fervent growth in terms of single-family development. Many subdivisions now line the Silver Star Road, White Road, Ocoee Apopka Road, and AD Mims Road corridors, areas that once were home to agricultural based businesses. The following is a summary of the data outlining the single-family residential growth that occurred in the study area: Single-family Development - An addition of 10,430 housing units between 1980 and This represents an annual addition of over 1,000 housing units. The last decade, saw an addition of 9,100 housing units within the West Orange Study Area. This represents an annual addition of approximately 910 housing units. In addition to the single-family residential units referenced above, the West Orange Study Area also experienced an influx of multi-family residential units (typically represented by apartment complexes in the range of units per project). Multi-family Development -Between 1980 and 1990, the study area added four large multi-family residential projects. This total represents an addition of one multi-family residential project roughly every other year. The last decade saw an increase of the previous time period s growth pattern, adding seven large multi-family residential projects between 1990 and This total represents an addition of approximately one to two multi-family residential projects within the study area every other year. Primary Study Area Residential Development In order to prepare the market-based assessment of alternative land use scenarios for the Primary Study Area, the planning team discussed development scenarios with the City of Ocoee planning staff. Renaissance Planning Group ran land use models to estimate the population, dwelling units, and employment within the specific traffic analysis zones (Zdata) within the Primary Study Area. RERC reviewed the traffic analysis zone data prepared by RPG which projected population and employment totals out to the year The following table is a summary of the 2020 Z-data residential development scenarios: Primary Study Area Residential Development Scenarios Year 2020 Residential- Focused Employment- Focused Balanced Population Single Family Population 15,525 14,201 14,543 Multi-Family Population 2,180 2,420 2,666 Total Population 17,705 16,621 17,209 Residential Units Single-Family Dwelling Units 5,424 4,985 5,104 Multi-Family Dwelling Units ,059 Total Dwelling Units 6,276 5,947 6,163 Source: Renaissance Planning Group, TAZ 2020 Data Northwest Ocoee Sector Market Assessment Real Estate Research Consultants, Inc. 5
76 To complement the Z-data above, RERC estimated the average household income for the area by isolating a three-mile radius from the intersection of SR 429 and West Road which is close to the mid-point of the study area. The estimates from CLARITAS are based on 1999 household income data collected from the 2000 Census. Within the Primary Study Area, household income points to a relatively healthy average with household income of about $63,000 in 2003 and approximately $90,000 in Though the average household income for this area is in line with Orange County s average household income, it should be recognized that there is some household income diversity. There are portions of this Primary Study Area that are comprised of older development areas along with the newer residential developments. The population, dwelling unit, and average household income figures were utilized to calculate the maximum supportable retail and office demand for the Primary Study Area, which were used to help in selecting the most appropriate development scenario. Average household income is an important variable used in the demand models. Household income is critical in determining the amount of retail and office/services square footage that can be supported. Ultimately, the success of retail and service business establishments is dependent on the effective/disposable buying income of households within a neighborhood. It is typical that approximately 3,000 3,500 households are needed to support 150,000 to 200,000 square foot community shopping centers. Residential Demand Forecast An analysis of the traffic analysis zone land use data which factored in the historical, current, and projected levels of population growth within the Primary Study Area and the Central Florida region concluded that there should be ample demand for multiple largescale residential projects within the Primary Study Area. A mix of housing types, with a variety of price points, should be provided. We believe there is a potential to absorb 3,000 to 4,000 total residential units in the next 15 years. The figures below represent both singlefamily residential units and multi-family residential units. PRIMARY STUDY AREA 2000 and 2020 DEVELOPMENT SCENARIOS CHANGE Population Residential- Focused Employment- Focused Balanced Residential- Focused Employment- Focused Balanced SF POP 6,883 15,525 14,201 14,543 8,642 7,318 7,660 MF POP 807 2,180 2,420 2,666 1,373 1,613 1,859 TOTAL POP 7,690 17,705 16,621 17,209 10,015 8,931 9,519 Residential Units SF DU 2,298 5,424 4,985 5,104 3,126 2,687 2,806 MF DU , TOTAL DU 2,746 6,276 5,947 6,163 3,530 3,201 3,417 Source: Renaissance Planning Group; City of Ocoee, Traffic Analysis Zone Data Northwest Ocoee Sector Market Assessment Real Estate Research Consultants, Inc. 6
77 Non-Residential Development A review of the West Orange Study Area s non-residential development revealed that while the overall area has been traditionally the source of major non-residential development because of its proximity to the urban core in Orlando and growing residential population, most of the non-residential inventory has been located along the SR 50 corridor. Other nonresidential development away from the SR 50 corridor has been limited to a collection of relatively small-scale products, designed to be neighborhood-serving facilities. A review of the tax records for the West Orange Study Area was performed and is summarized below. The following table illustrates the growth of non-residential uses within the West Orange Study Area. West Orange Study Area Historical Non-Residential Development Square Feet By Year Land Use Pre Total Retail 1,416,400 1,699,635 2,024, ,703 5,867,934 Office 352, , , ,324 1,074,746 Industrial 2,897,634 2,002, , ,615 6,323,360 Source: Orange County Property Appraiser Tax Roll 2003; Microbase, Inc. About 53% of the total retail inventory was constructed prior to Approximately 35% of the total retail development within the study area was constructed between 1990 and Between 2000 and 2003, approximately 12% of the total retail development in the area was constructed. Office development has not been robust in the study area historically. In total, just over 1.0 million square feet of office space is designated as office space. Sixty-eight percent of the office inventory was constructed prior to Approximately 20% of the total office space was constructed in the 1990 s. Between 2000 and 2003, an estimated 12% of the area s total office space was added into the to area s market. The area has over 6.3 million square feet of industrial designated space. Just over 77% of the inventory was constructed before About 14% of the total was added in the 1990s, while approximately 9% was added between 2000 and Approximately 56% of the total non-residential space that was constructed prior to 1990 was designated as industrial space. Retail space comprised of 36% of the total, while office space represented about 8% of the total non-residential inventory in the West Orange study area in the same time period. In the 1990s, retail development dominated the addition of non-residential space, with approximately 65% of the total. Industrial space represented 28% of the total, while office space lagged with an estimated 7% of the total non-residential space constructed. Northwest Ocoee Sector Market Assessment Real Estate Research Consultants, Inc. 7
78 Between 2000 and 2003, retail space again made up over a majority of constructed non-residential space. Approximately 52% of the total was designated as retail space, while industrial space was 39% and office trailed with about 9% of the total. Non-Residential Demand Forecast RERC used proprietary models to calculate potential commercial (retail and services) square footage demand for the Primary Study Area. We also analyzed the industrial market reviewing the total inventory, absorption rates, and occupancy rates. The following table is a summary of the results: Primary Study Area Non-Residential Demand Estimates Residential- Focused Employment- Focused Balanced Retail SF 337, , ,300 Service/Office SF 277, , ,000 Industrial SF 500, ,000 1,000,000 Source: RERC Proprietary Retail and Services Demand Model; Trends Industrial Development The table above illustrates the net demand for retail, services, and industrial for the estimated population and households for the three scenarios. The figures provide us with a general estimate of supportable demand for retail, services, and industrial space for each development scenario. Implications for the Primary Study Area The Central Florida region has been thriving in terms of growth. This is especially true in the last full decade and it appears that this decade will even build on the previous time period s growth. Much like the larger region, the West Orange Study Area has been experiencing robust growth and it is anticipated that this strong growth will continue. Our analysis of the region as a whole and the local market and the potential for the NW Ocoee properties has the following summary conclusions: Residential After reviewing the demographic and actual development trends within the West Orange Study Area, as well as testing some conceptual programs with the client group and the planning team, we concluded the following residential development scenarios could be supported by the Primary Study Area in the City of Ocoee: Primary Study Area Residential Development Scenarios Residential- Focused Employment- Focused Balanced Single-Family Dwelling Units 5,424 4,985 5,104 Multi-Family Dwelling Units ,059 Total Dwelling Units 6,276 5,947 6,163 Northwest Ocoee Sector Market Assessment Real Estate Research Consultants, Inc. 8
79 Non-Residential Demand for non-residential product is also going to keep on growing as more consumers arrive with the anticipated residential growth in the area. After factoring in the demand of current and projected population and households within the Primary Study Area, coupled with testing the development scenarios with the client and the planning team, we concluded the following non-residential development scenarios could be the maximum total demand within the Primary Study Area: Primary Study Area Non-Residential Development Scenarios Residential- Focused Employment- Focused Balanced Retail Square Feet 675, , ,000 Service/Office Square Feet 277, , ,000 Industrial Square Feet 500, ,000 1,000,000 Source: RERC Proprietary Retail and Services Demand Model; Trends Industrial Development As reflected in the table above, with the presence of a growing population we see a need for additional retail facilities. However, much like the office demand, we foresee the retail demand to be largely locally resident driven. We foresee a mix of approximately two retail hubs serving the northern and southern parts of the Primary Study Area. The scale and intensity should consider the characteristics of the subject property s surroundings. A town center concept will most likely be developed in the mid to long-term, with grocery anchored retail center in the near term. Due to the significant amount of existing office space near the Primary Study Area, we believe that there is limited demand for office use within the Primary Study Area. There will be some demand as illustrated in the demand model that is mostly resident driven but certainly not for large corporate users. The scale and intensity should be considerate to the surrounding landscape and marketplace. Moderate scale office development that will correspond to the surrounding area s residential development should be considered. Similarities of Primary Study Area to Case Study Areas Northeast Oviedo Much like the Primary Study Area, the Northeast Oviedo area is also experiencing fast paced growth. New homes are being built in the units per year range. Following the influx of the new residents and housing units in the area, commercial development has been growing. Several neighborhood retail and service facilities have been developed, ranging from 70,000 to 120,000 square feet per neighborhood center. The neighborhood centers are typically in the form of a grocery-anchored center, with ancillary retail and services. Waterford Lakes/Avalon Park Similar to what could occur in the Primary Study Area, the Waterford Lakes/Avalon Park area has already been experiencing fast growth in terms of the number of residents and housing units built. The projections estimate that this area could absorb approximately Northwest Ocoee Sector Market Assessment Real Estate Research Consultants, Inc. 9
80 1,000 housing units per year in the next five years or so. Non-residential/commercial space will also continue to get built as more residents move into the area. However, most of the commercial support will be in the form of neighborhood/community serving facilities such as grocery anchored shopping centers due to the presence of nearby regional shopping facilities. Further details comparing the Primary Study Area to the two Case Study Areas mentioned above can be found in the Case Studies Section of this document. Scenario Recommendation After arriving at acceptable ranges of estimated population, households, and average household income, as well analyzing the current supply and historical trends of nonresidential development within the West Orange Study Area, we feel that the most market supportable scenario is the Residential-Focused scenario. This scenario provides the highest amount of residential units, with a good mix of single-family and multi-family residential. In addition, the non-residential component is more realistic and would be more than sufficient to satisfy local resident demand for retail and services, as well as subregional demand for industrial space, such as flex space or light manufacturing. Special niche markets may be pursued, which could combine tenants or uses oriented to a limited segment of the industrial market, such as furniture, design and décor, or similar type themes. In summary, the following is the Residential-Focused scenario, according to Renaissance Planning Group and the City of Ocoee: Primary Study Area Recommended Development Scenario Residential-Focused Residential Single Family Residential Units 5,424 Single Family Residential Units 852 Total Residential Units 6,276 Non-Residential Retail Square Feet 1,063,111 Service/Office Square Feet 115,718 Industrial Square Feet 1,668,183 Total Non-residential Square Feet 2,847,012 Source: Renaissance Planning Group; City of Ocoee Northwest Ocoee Sector Market Assessment Real Estate Research Consultants, Inc. 10
81 WEST ORANGE STUDY AREA AND PRIMARY STUDY AREA - OVERVIEW West Orange Study Area The demand for development activity within a specific area is mainly derived from the rapid growth of an area. Such growth is in existence in the area of West Orange County. We have profiled an area that is approximately a five-mile radius from the intersection of West Road and SR 429 (Western Beltway). Profiling the area that immediately is around the NW Ocoee Primary Study Area allows us to put the current development, as well as future development, in context. Please refer to Map 2 West Orange Study Area for the general boundaries. Map 2 West Orange Study Area Note: Study area map boundaries are not exact and are for illustrative purposes only. This section provides additional documentation of the aforementioned growth (population and housing), the character and scale of the growth, employment centers and major developments in the area. This section also covers West Orange County s competitive position, discussing its location, access, physical features, and amenities. Lastly, this section is concluded with the development scenarios for the Primary Study Area (Northwest Ocoee Study Area). Northwest Ocoee Sector Market Assessment Real Estate Research Consultants, Inc. 11
82 Residential Development RERC reviewed the residential data from the property appraiser tax rolls for the West Orange Study Area, which provides us with concrete and undisputable evidence of the growth discussed in this report. The data are separated into single-family and multi-family development. While the tax roll data were primarily relied on for the single-family development, we complemented the tax roll data with survey data provided by Charles Wayne, Inc. in their Residential Market Reports for the multi-family section of this report. In addition to the data sources above, RERC also spoke with City and County planning staff, as well as developers for further verification. Single-Family Residential The following table summarizes a review of property tax records that illustrate the number of single-family residential units within the West Orange Study Area in specific time periods: West Orange Study Area Historical Single Family Residential Development Pre Units Units Northwest Ocoee Sector Market Assessment Real Estate Research Consultants, Inc Units Units Single-family 13,131 10,430 9,100 2,871 Source: Orange County Property Appraiser; Microbase, Inc. The table above reflects the following: An addition of 10,430 housing units between 1980 and This represents an annual addition of approximately 1,000 housing units. The last decade saw an addition of 9,100 housing units within the West Orange study area. This represents an annual addition of approximately 900 housing units. For the past three years since 2000, approximately 2,900 single-family units were added within the West Orange Study Area. This represents an annual addition of approximately 725 housing units, which is a conservative estimate since some of the residential closings that occurred in late 2003 were not yet recorded at the time the data was obtained. RERC profiled almost twenty large single-family residential projects that are actively marketing, selling, and building within the West Orange study area. The profile provides us insight on the single-family residential market in terms of types of housing, price points, amenities offered, and estimated absorption. The following is a summary of the profiled projects: The profiled projects are approved for almost 2,300 residential units. Approximately 800 units have been built, which leaves about 1,500 units that have yet to be constructed. The number of units per project ranges between 45 and 450 units. Annual average absorption within these projects varies, from less than 20 to approximately 50 units. There are twelve projects that were begun in the 4 th quarter
83 The size of the single residential units ranges between 1,300 to almost 4,000 square feet. However, the majority of the units are between 1,500 and 3,000 square feet. The size of these units typically represents a three to four bedroom floor plan, which might include an office or a den for the larger units. Amenities in these large-scale single-family residential projects vary from one project to another. However, there are some similarities, which include lakes, parks, swimming pools, tot lots, and sometimes clubhouses. Selling prices range within these projects range from $110,000 to $350,000. However, a majority of the units typically sell between $150,000 and $250,000. Premiums for lot locations (lake, park, conservation area) are extra. Multi-Family Residential Development In addition to the single-family residential units referenced above, the West Orange Study Area also experienced an influx of multi-family residential units. While there are some duplexes or other small-scale multi-family products, apartment complexes in the range of units per project represent most multi-family products. The following table illustrates the number of multi-family property tax records within the West Orange Study Area: West Orange Study Area Historical Multi-family Residential Development Pre 1980 Records Records Records Records Total Source: Orange County Property Appraiser; Microbase, Inc. Most of the apartment complexes serve the growing population of people with retail and service oriented jobs along the major thoroughfares such Interstate 4, Florida s Turnpike, SR 50, US 192 and US 27, as well as near the attractions area with its vast number of hotels, retail stores, and restaurants. Like the single-family residential subdivisions, the apartment complexes can be found along and near SR 50 as well as other major thoroughfares within the West Orange Study Area. The table above reflects the following: Between 1980 and 1989, the study area added 736 multi-family residential records. This total represents an annual addition of 73 multi-family residential projects. Most of these products are small-scale multi-family projects such as duplexes and triplexes. The decade saw a decline of the previous time period s growth pattern, adding just 49 multi-family residential projects. This total represents an annual addition of approximately five multi-family residential projects within the West Orange Study Area. However, this total represents a mix of small-scale and large-scale multi family projects such as apartment complexes that typically house units, but are only recorded as one parcel/record. Northwest Ocoee Sector Market Assessment Real Estate Research Consultants, Inc. 13
84 We profiled eight relatively new, large multi-family residential projects that are actively marketing, leasing, and building within the West Orange Study Area. The profile provides us insight on the multi-family residential market in terms of types of housing, monthly rental rates, amenities offered, and estimated occupancy. The following is a summary of the profiled projects: The profiled multi-family residential projects total almost 2,400 units. As mentioned earlier, the complexes typically range between 200 and 400 units. The units range between Efficiencies to 3 bedroom units. However, a majority of the leasable units are one to two-bedrooms. Sizes of these units range from 500 square feet (Efficiencies) to approximately 1,200 square feet (3-bedroom). These units are generally housed in two to three story structures. Monthly rental rates are between $500 to approximately $1,100. The lower end of the range is associated with the Efficiency units, while the higher end of the range is associated with 3 bedroom units, with view premiums. The majority of the rental units are priced between $600 to $900 per month. Average occupancy with the profiled projects is approximately 92%. The lowest occupancy is at 80%, while the highest is at 100%. We expect that occupancy levels with multi-family residential projects in this area to be normally within the 80-90% range. Amenities include swimming pools, basketball courts, volleyball courts, and children s playground, community clubhouse with computer rooms, car wash areas, fitness facilities, and BBQ areas. Parking is mostly limited to surface parking. Primary Study Area Implications The population boom in the State of Florida and in the Central Florida region has been axiomatic in the last 20 years. Growth within the State, as well as the region, will most likely continue to grow over the next 20 years. The population growth is manifested by the historically high pace of residential construction and is represented by the numerous subdivisions and apartment complexes. The scale of residential growth within the numerous subdivisions and apartment complexes is summarized below: The majority of the single-family residential projects that have been approved have fewer than 500 units per project. Typically, densities within these projects range from two to four dwelling units per acre, which is very suburban in character and scale. Most of the multi-family residential product that has been developed in the recent past has been in the form of apartments within mid to large size complexes, generally between 200 and 400 units. These apartments are frequently in the form of two to three story buildings, typically developed on a minimum of twenty acres. However, in the last couple of years there seems to be a shift in the market because of low interest rates. It appears that because of greater demand for town houses and low to mid-rise condominiums this type of housing is being added to the residential inventory. Northwest Ocoee Sector Market Assessment Real Estate Research Consultants, Inc. 14
85 As mentioned, the West Orange Study Area has experienced significant growth in the last 20 years. However, most of the growth in the West Orange Study Area has been pronounced in the last ten years. Within the West Orange Study Area, there have been 9,100 single-family units added between 1990 and In addition, almost 40 multi-family residential projects were also constructed in the last decade. The historical trend of growth in the West Orange Study Area will most likely continue. As more infrastructure (roads, water and sewer connection lines) are provided in the future by the counties, municipalities, and other governmental agencies, more growth is expected to occur in the study area, as well as the Central Florida region as a whole. Factoring in the historical, current, and projected levels of growth within the West Orange Study Area, as well as the region as a whole, we concluded that there is ample demand for multiple mid to large-scale residential projects within the Primary Study Area. A mix of housing types should be provided, including higher density products such as town homes. Any of the three residential development scenarios as shown in the table below, would be deemed appropriate and marketable. However, the Residential-Focused scenario offers the most residential units and least non-residential, while providing a good balance between single family and multi-family residential housing type. Primary Study Area Residential Development Scenarios Years 2000 and TRAFFIC ANALYSIS ZONE DATA PRIMARY STUDY AREA CHANGE Residential- Focused Employment- Focused Balanced Residential- Focused Employment- Focused Balanced SF POP 6,883 15,525 14,201 14,543 8,642 7,318 7,660 MF POP 807 2,180 2,420 2,666 1,373 1,613 1,859 TOTAL POP 7,690 17,705 16,621 17,209 10,015 8,931 9,519 SF DU 2,298 5,424 4,985 5,104 3,126 2,687 2,806 MF DU , TOTAL DU 2,746 6,276 5,947 6,163 3,530 3,201 3,417 Source: Renaissance Planning Group; City of Ocoee, 2020 Z-Data Northwest Ocoee Sector Market Assessment Real Estate Research Consultants, Inc. 15
86 Non-Residential Growth and Employment Centers A review of the West Orange Study Area s non-residential development revealed that while the overall area has been traditionally the source of major non-residential development because of its proximity to the Orlando urban core and growing residential population, most of the non-residential inventory has been located along the SR 50 corridor. Other nonresidential development away from the SR 50 corridor has been limited to a collection of relatively small-scale products, designed to be neighborhood-serving facilities. The following table illustrates the growth of non-residential uses, retail, office and industrial space, within the West Orange Study Area. West Orange Study Area Non-Residential Development Square Feet By Year Land Use Pre Total Retail 1,416,400 1,699,635 2,024, ,703 5,867,934 Office 352, , , ,324 1,074,746 Industrial 2,897,634 2,002, , ,615 6,323,360 Source: Orange County Property Appraiser Tax Roll; Microbase, Inc. About 53% of the total retail inventory was constructed prior to Approximately 35% of the total retail development within the study area was constructed between 1990 and Between 2000 and 2003, approximately 12% of the total retail development in the area was constructed. Office development has not been robust in the study area historically. In total, just over 1.0 million square feet of office space is designated as office space. 68% of the office inventory was constructed prior to Approximately 20% of the total office space was constructed in the 1990 s. Between 2000 and 2003, an estimated 12% of the area s total office space was added into the to area s market. The area has over 6.3 million square feet of designated industrial space. Just over 77% of the inventory was constructed before About 14% of the total was added in the 1990s, while approximately 9% was added between 2000 and Approximately 56% of the total non-residential space that was constructed prior to 1990 was designated as industrial space. Retail space comprised of 36% of the total, while office space represented about 8% of the total non-residential inventory in the West Orange study area in the same time period. In the 1990s, retail development dominated the addition of non-residential space, with approximately 65% of the total. Industrial space represented 28% of the total, while office space lagged with an estimated 7% of the total non-residential space constructed. Between 2000 and 2003, retail space again made up over a majority of constructed non-residential space. Approximately 52% of the total was designated as retail space, while industrial space was 39% and office trailed with about 9% of the total. Northwest Ocoee Sector Market Assessment Real Estate Research Consultants, Inc. 16
87 Proposed/Planned/Recently Approved Non-Residential Facilities In addition to the non-residential space that has already been constructed, RERC also reviewed recent approvals, major plans and proposals that could affect the demand and supply for the Primary Study Area. These plans and proposals are in different stages, with some being highly speculative and some are in the process of completing a Specific Area Plan (SAP) to arrive at a preliminary development program. The following are the highlights of our review: The biggest collection of proposed commercial development is within the Horizon West Town Center Village. The Town Center will be located in Southwest Orange County, south of the Primary Study Area. The most current preliminary development program for the Town Center is for the following uses: o Commercial/Retail = 2,090,000 square feet o Office = 5,679,000 square feet o Light industrial/flex = 384,000 square feet There is a proposal for 1.3 million square feet outdoor mall in Winter Garden called Winter Garden Mall at Fowler Groves. Conversations with the City of Winter Garden planning staff revealed that the proposal would not likely get a final approval for about two years. Given the amount of non-residential square footage that is proposed in the projects referenced above, the competition from these planned projects could certainly limit nonresidential opportunities in the Primary Study Area. Non-Residential Demand Analysis RERC used its own proprietary models to calculate potential commercial (retail and services) square footage demand based on the estimated residential population and households within the Primary Study Area. We also estimated potential industrial demand within the Primary Study Area using our in-house database and conversations with industrial brokers. Calculation of Resident Personal Services Demand (Office Space) Based on our experience and observed market trends, personal service, business services, and most office space demand are typically generated by resident population and other nearby businesses in a manner not unlike retail demand. Population is the underlying factor which creates the estimated demand for most service components. Much of the business activity that demands office space is summarized in regular publications, which report employment and number of establishments such as County Business Patterns by the U.S. Census Bureau. The primary components of office demand are included in the employment categories of finance, insurance, and real estate (FIRE); medical services; legal services; and business services. However, for the purposes of this analysis we isolated certain office user groups that we deemed most likely to locate within the Primary Study Area FIRE, Personal Services, Medical Services, and Social Services. The most recent compilations of these data for counties are in the 2000 edition of County Business Patterns. The data presented Northwest Ocoee Sector Market Assessment Real Estate Research Consultants, Inc. 17
88 for each business category is compared to overall county population figures for 2000 to determine the per capita demand factors, which are also expressed in terms of square feet of demand. The services demand model does not address where the office or business establishment is located within the county. Similar to retail space, some tenants prefer to be located together in multi-tenant buildings, while others prefer freestanding locations. Some office development has very localized, neighborhood orientation, while some are concentrated in office parks with access to regional roadway systems. In the RERC model, population estimates for a Primary Study Area were used to determine the office and services demand generated by a specific population group. The summary of the results is below: Primary Study Area Office/Services Square Footage Demand Residential- Employment- Focused Focused Balanced Finance, Ins., & Real Est. 147, , ,000 Personal Services 20,000 19,000 20,000 Medical Services 89,000 83,000 86,000 Social Services 21,000 20,000 20,000 Total Square Footage 277, , ,000 Source: RERC proprietary services demand model The above estimates and projections include total demand for services-driven office space by the resident population. We believe these assumptions are very conservative in nature. The spending patterns of the resident population will not be limited to service establishments within the immediate market area, but there is a very good chance that local demand for many personal and professional services could be captured in businesses proximate the nearby neighborhood. Such services as those provided at banks, beauty parlors, real estate offices, video stores, photo labs, child care centers, medical/professional offices and miscellaneous personal service establishments are best located in proximity to residents who provide their support. The table above, as mentioned, included total demand for services-driven office space within the Primary Study Area. For the most part, the Primary Study Area will most likely be within the 1-5 mile radius. Within the 5 -mile radius, there are a few office/service type facilities. Some of the existing office space is functionally obsolete and does not meet the demands of the contemporary marketplace. Most of the existing office space is located along the major thoroughfares within and near the West Orange County Study Area SR 50, Hiawassee Road, and Silver Star Road. This office space is made up of small, one to two-story office buildings, with some residential conversions. These offices are occupied by small business users and are not occupied by large corporate headquarters. The newer office/service facilities in the West Orange Study Area are located near the Health Central Hospital, along SR 50. As expected, most of the office space in this location is oriented towards medical professionals, which provide auxiliary support to the hospital and their patients. There is approximately 1,075,000 square feet of office space within the five-mile West Orange Study Area. Any new office/service development that would locate within the West Orange Study Area will most likely be locally driven, to provide resident-based services, such as medical offices, law firms and accountants, personal services, and social services. With the huge Northwest Ocoee Sector Market Assessment 18 Real Estate Research Consultants, Inc.
89 amount of office space near the Primary Study Area, we believe that there is limited demand for office use within the Primary Study Area, that is mostly resident driven and certainly not for large corporate users. The scale and intensity should be considerate to the surrounding landscape and marketplace. Thus we expect moderate-scale development of one to three-story buildings, to be phased to correspond to the surrounding area s residential development. Calculation of Resident Retail Demand The results of RERC s model are divided into categories within Convenience Goods and Shopper Goods. Convenience goods establishments include food stores and supermarkets; beer, wine, and liquor stores; drug stores, and pharmacies; convenience stores and gasoline; and cosmetic, health and beauty stores. Supporting Retail are drawn from this category primarily and are in contrast to shopper goods establishments, which include department stores; discount stores; furniture and home furnishings stores; appliances, electronics, and computer stores; building materials, hardware and garden supplies; apparel and accessory stores; and miscellaneous retail stores. Convenience goods establishments might be considered as supporting retail. Another way to describe the establishments that offer either convenience goods or shopper goods is by the size of these stores and size of their market area. In general, retail establishments that usually sell convenience goods can be found in community and neighborhood retail centers (less than 150,000 SF) and have a smaller market area (approximately 1-2 miles). Conversely, retail centers that provide primarily shopper goods are generally bigger (more than 150,000 SF) and have a larger market area (1-10 miles). The retail demand model calculates the estimated total potential retail demand supported by the population. It does not calculate where the trade area s population will most likely do their shopping. For the purposes of this study, we have assumed that all the retail demand generated from the study area stays within the market. In reality, some demand is expected to leak from the area to other neighboring retail centers. For the purposes of this analysis, we felt that the existing supply of shopper goods facilities located nearby, along SR 50, will most likely satisfy future resident demand from the Primary Study Area. According to the tax records, there are a total of approximately 5.9 million square feet of retail space within the West Orange Study Area, consisting of large centers such as the West Oaks Mall, Best Buys, Home Depot, Lowe s, and Wal-Mart. Unlike existing office space inventory, many of the retail facilities along the SR 50 corridor and surrounding major thoroughfares are new and expansive, providing a wide array of retail choices to the local residents. Thus, the results below highlight the potential demand of the anticipated population within the Primary Study Area for only convenience goods and restaurants. The following table presents a quantitative summary of the projected square foot demand for retail space for each development scenario s population and household estimates. They are based upon the RERC model, which calculates space demand based upon market area population, households, average household income, and spending patterns. Northwest Ocoee Sector Market Assessment Real Estate Research Consultants, Inc. 19
90 Primary Study Area Retail Square Footage Demand Residential- Employment- Focused Focused Balanced Convenience Goods SF 232, , ,300 Restaurant SF 105,000 99, ,000 Total Square Footage 337, , ,300 Source: RERC proprietary retail demand model The spending patterns of the resident population will not be limited to service and retail establishments within the immediate market area, but there is a very good chance that local demand for convenience items and many personal services could be captured in businesses within the nearby neighborhoods. With the presence of a growing population we see a need for additional retail facilities. However, much like the office demand, we foresee the retail demand to be largely locally resident driven. We foresee a mix of approximately two retail hubs serving the northern and southern parts of the Primary Study Area. The scale and intensity should consider the characteristics of the subject property s surroundings. A town center concept will most likely be developed in the mid to long-term, with a grocery-anchored retail center in the near term. Calculation of Industrial Demand RERC has maintained a database of retail, office, and industrial space for almost 20 years. The Primary Study Area is within the West Orange submarket. This sub-market has about 1.3 million square feet of space, or about 1.6 percent of the region s total. Supply has increased about 300,000 square feet over the past 10 years. Over the past three years, 200,000 square feet of space was added to the market, or 15 percent of the entire submarket s inventory of space. Annual occupancy averaged 92 percent in 2003, down from 96 percent in Occupancy decreased significantly, mainly due to the large increase in new inventory. Net absorption was 82,000 square feet in Annual absorption has ranged between 0 square feet in 1998 to almost 82,000 in The lack of absorption in the West Orange sub-market can be traced to cost and the size of land available. It has been suggested by industrial brokers that industrial land in Orange and Seminole Counties are becoming too expensive for new industrial development. The tendency by developers and brokers is to look in Osceola, Polk, and Lake Counties. Regarding the size of available industrial land, there seems to be a surplus of industrial land that is smaller than 10 acres in Central Florida. Smaller users will tend to compare areas and strongly consider price in their site selection analysis. Large users (major distribution) and developers typically select sites that are between 100 to 150 acres in size, are located on a major thoroughfare, and have access to either an interstate or turnpike facility. Smaller users, while not requiring as large a property, also tend to look for properties that are on a major thoroughfare and have access to a regional/state highway. These small bay users make up a large percentage of the market s Northwest Ocoee Sector Market Assessment Real Estate Research Consultants, Inc. 20
91 tenants. They typically prefer spaces of less than 5,000 square feet each, with 4-5 users in each building, totaling about 20,000 square feet, and about 2 acres. An extension of the small bay users are the large bay users, which take up larger spaces as the term suggests. Typically, the large bay users require between 5,000-20,000 square feet for each user, with 8-10 users in each building, totaling about 100, ,000 square feet, requiring about acres. Given these market trends, as well as factoring the size of potentially available industrial land, we recommend a flexible two-pronged approach to creating an industrial component within the Primary Study Area. The first part of the approach considers small and large bay users as the primary tenant. At least acres could be allocated to these users. The advantage to having the space for such users is their ability to move in and absorb the product in the near term. The second part of the approach is to hold the remaining industrial land (100+ acres) for large distribution users. However, should a large distribution user become difficult to attract, the remainder of the industrial property can be designed to accommodate a group of smaller industrial buildings for the smaller users. The acreage above could accommodate a wide range of industrial buildings, ranging in size between 500,000 square feet (Residential-Focused) to about 1,000,000 square feet (Balanced). Primary Study Area Implications The continuing population growth within the Primary Study Area will drastically impact the non-residential landscape in this market. The addition of large-scale residential projects, coupled with the overall growth in the Primary Study Area, will prompt the development of some additional retail and service facilities in the area. A location with easy access and visibility, such as the SR 429 interchanges at West Road and Plant Street are logical locations for any significant non-residential development. The scale of non-residential growth in the recent past within the numerous retail and service facilities the Primary Study Area is summarized below: Grocery anchored centers are typically in the 80, ,000 square feet range. These types of centers usually include some services (office), typically making up anywhere between 15-25% of the total square footage in the center. In addition, some out parcels for banks and restaurants are generally associated with such centers. Retail facilities in a Main Street setting have staged a renaissance in the past few years. Specialty boutiques, cafes and restaurants, in addition to chain stores and restaurants have been a welcome addition to the retail environment in Central Florida. Office development has not been prevalent in this market. Most of the office facilities are one to two stores, occupied by local companies and small branches of national businesses. Even newer office facilities that have developed near the Health Central Hospital site have been relatively small in scale less than 100,000 square feet. A Main Street configuration for retail and offices, as well as medium to high density residential, could change the development paradigm in this area. We believe that there is an opportunity to create a collection of retail and services in a centralized location, that not only offers local residents a place to shop and work, but it also could offer the larger study area a destination venue for both shopping, entertainment and employment. Northwest Ocoee Sector Market Assessment Real Estate Research Consultants, Inc. 21

92 In addition to the retail and service facilities, we also see an opportunity to provide some flexibility for some light industrial (flex space) development within the Primary Study Area. While there has not been a strong market for this type of facility in the West Orange Study Area, the construction of the southern segment of the Western Beltway will provide a more convenient access point to the regional and statewide transportation facilities, and thus could create a demand for some light manufacturing industrial (flex space) development. Special niche markets may be pursued, combining tenants or users oriented to a limited segment of the industrial market, such as furniture, design and décor, or similar themes. The following map depicts the location of major employment centers. The employment centers represent the collection of significant office, retail, hotel, and industrial space in the Orlando Metro area. Map 3 Major Employment Centers Emerging or future major employment centers Established major employment centers The map above depicts the proximity of the NW Ocoee Primary Study Area to major employment centers in the Orlando area. The map illustrates a potential, locational opportunity for a growth in the Ocoee employment center. This opportunity will arise from the on-going population growth and corresponding residential construction in the area. Northwest Ocoee Sector Market Assessment Real Estate Research Consultants, Inc. 22


 and light manufacturing space.")

93 Development Scenario Recommendation After factoring in the demand of current and projected population and households within the Primary Study Area, coupled with testing the development program with the client group and the planning team it was, concluded that the following non-residential development alternatives could be developed in the next 15 years: Base Single Family Units 5,424 Multi Family Units 852 Total Units 6,276 Retail SF 1,063,111 Services SF 115,718 Industrial SF 1,668,183 Total SF 2,847,012 This scenario provides the highest amount of residential units, with a good mix of singlefamily and multi-family residential. In addition, the non-residential development component is more realistic and would be more than sufficient to satisfy local resident demand for retail and services product, as well as sub-regional demand for industrial (flex space) and light manufacturing space. Examples of Housing Types Single- family Multi-family for rent Multi-family for sale Examples of Non-residential Building Types Retail with 2 nd floor office Light Industrial/Flex Office Offices Northwest Ocoee Sector Market Assessment Real Estate Research Consultants, Inc. 23
.")
94 CASE STUDIES - CENTRAL FLORIDA At the request of the client, RERC isolated two high-growth areas in the Central Florida region and used them as case studies. The two identified case study areas point to the experience of areas comparable to the NW Ocoee Sector area (Primary Study Area). The case studies identify prevailing land uses that have developed in the recent past and how the development landscape is projected in the future. The following criteria were used to select the case study areas: Fast-paced growing area population, households, and commercial support; Proximity to toll road facility; Traditionally an agricultural based area or a small city/town, but has since been converted into a suburban enclave in Metro Orlando; and Proximity to a regional or super regional shopping center a shopping mall or lifestyle center. Availability of large tracts of vacant land With the criteria above, RERC determined that following areas would be appropriate as case studies: 1. The Northeast Oviedo area in northeast Seminole County 2. The Waterford Lakes/Avalon Park area in east Orange County Northeast Oviedo Area The illustrative map shown below identifies the location of the Northeast Oviedo case study area east Seminole County. Map 4 Northeast Oviedo Area Note: Case study area map is not exact and is for illustrative purposes only. Northwest Ocoee Sector Market Assessment Real Estate Research Consultants, Inc. 24
95 Socio-economic Profile The table below outlines the rapid growth in the Northeast Oviedo area. The population is estimated to grow at an average annual rate of 3.5% from 2003 to Commensurate with the population growth, the number of households is also estimated to grow at an average annual rate of 3.1%, while average household income is projected to grow at 4.6% annually within the same time period. Northeast Oviedo Area Socio-economic Profile 1990 to Population 12,707 24,940 26,977 31,996 Households 4,388 8,407 9,021 10,517 Avg. HH Income $43,442 $68,374 $80,727 $101,277 In addition to the U.S. Census based estimates and projections above, we also reviewed the pace of housing construction within this area and spoke with the City of Oviedo planning staff about the projected growth in this general area. According to our observations and conversations, we believe that there could be an addition of 150 to 200 residential units per year in the near future. This is based on historical trends, as well as the recent development applications and approvals that staff has seen. Residential Development The City of Oviedo has been historically known as a small rural city. As reflected in the table shown above, strong population growth has occurred in the last ten years and will most likely continue in the next ten years as more residential developments are built within the area and population continues to locate in suburban settings. According to our conversations with City of Oviedo and Seminole County officials, there has been strong interest in residential development along with developers of retail and office space. In the City of Oviedo alone, the latest estimates indicate that as many as 800-2,000 residential units could be approved and under construction within the next three years. These figures are relatively consistent with the projected household growth estimates shown above. The latest figures for Seminole County also suggest some increasing growth in the residential market. In 2000, there were 2,467 single-family residential construction starts. This figure fell slightly to 2,225 units for Multi-family development was about 45% of the residential construction in 2000, with 1,952 units, and approximately 45% in 2001, with 1,870 units. Non-Residential Development There are approximately 671,000 square feet of various retail facilities within the Northeast Oviedo area. However, many of these facilities are freestanding establishments or older strip retail centers. Approximately 370,000 square feet or 55% of the total retail space Northwest Ocoee Sector Market Assessment Real Estate Research Consultants, Inc. 25

96 above was constructed since These retail facilities include grocery stores, pharmacies, restaurants, and general merchandise stores that provide a neighborhood and community scale shopping environment. While not part of the Northeast Oviedo area, the Oviedo Marketplace is less than one mile away and provides the larger community with a regional shopping center venue. The Oviedo Marketplace is approximately 969,000 square feet and is located north of the Red Bug Lake Road exit for the Central Florida Greeneway (SR 417) toll road. The mall was built in 1998 and includes anchors such as Dillard s, Sears, and Regal Cinemas. In addition to the mall, there are also numerous big box retail facilities near the SR 417 interchange area such as Home Depot, Target, Wal-Mart, K-mart, and Lowe s, as well as an array of restaurants and freestanding shops. A large percentage of these big box retail stores, restaurants, and freestanding shops were constructed in the last six to seven years, corresponding with the influx of new housing and population in the Northeast Oviedo area. Much like the Primary Study Area, the Northeast Oviedo area is also experiencing fast paced growth. New homes are being built in the units per year range. Following the influx of the new residents and housing units in the area, commercial development has been growing. Several neighborhood retail and service facilities have been developed, ranging from 70,000 to 120,000 square feet per neighborhood center. The neighborhood centers are typically in the form of a grocery-anchored center, with ancillary retail and services. Waterford Lakes/Avalon Park Area The illustrative map shown below identifies the location of the Waterford Lakes/Avalon Park case study area in east Orange County. Map 5 Waterford Lakes/Avalon Park Area Note: Case study area map is not exact and is for illustrative purposes only. Northwest Ocoee Sector Market Assessment Real Estate Research Consultants, Inc. 26
97 Socio-economic Profile As shown in the table below, since 1990, Orange County s population has grown at an average annual rate of 2.8 percent a year. Within the same time period, the City of Orlando s population growth was less than 0.75 percent a year. The Waterford Lakes/Avalon Park area s population growth has been tremendous since 1990, at an average annual rate of 17.4 percent per year. The number of households in the County has grown at an annual average of 2.7 percent in the last decade. Again, the City s growth fell below the County s average at 1.3 percent. The number of households in the Waterford Lakes/Avalon Park area grew at 19 percent per year since Waterford Lakes/Avalon Park Area Socio-economic Profile Orange Co Orlando Waterford Lakes/ Avalon Park Area 1990 Population 677, ,693 5,617 Households 254,852 65,703 1,631 Avg. Household Income $37,908 $33,099 $37, Population 913, ,250 32,672 Households 341,712 75,512 11,008 Avg. Household Income $61,135 $49,003 $57, Projected Population 996, ,350 42,013 Households 372,814 79,049 14,333 Avg. Household Income $72,910 $56,210 $66,892 Source: US Census Bureau; Claritas Inc.; Real Estate Research Consultants, Inc. RERC also compared the average household income for the Waterford Lakes/Avalon Park area. The average household income grew at a healthy rate within Orange County in the last decade, at 4.4 percent annually or an average of $2,100 per year. The City of Orlando s average household income also grew at a solid rate, with a 3.7 percent average annual growth or approximately $1,400 per year. For the Waterford Lakes/Avalon Park Area the average annual growth was at 4.1 percent or about $1,850 per year. Looking at the five-year projected figures for the year 2006, it is suggested that population growth could slow down to 1.8 percent annually for Orange County. Population growth at the City is estimated to remain relatively the same at 0.8 percent. Mirroring the decrease in the population growth rate of the County s, the Waterford Lakes/Avalon Park area s growth rate is also estimated to decrease to approximately 5.2 percent, mainly because this area would have a substantial number of households to begin with, and thus the increase would not be as pronounced as it was during the last decade ( ). Northwest Ocoee Sector Market Assessment Real Estate Research Consultants, Inc. 27
98 Commensurate with the slowdown of population growth, the growth in the number of households could also potentially slow down in the next five years: 1.8 percent annually for the County, 1 percent for the City, and 5.4 percent for the Waterford Lakes/Avalon Park area. Although the average household income growth rate is projected to decrease slightly in the next five years, it would still continue to grow at a strong rate overall. Within the County, it is estimated that the average annual growth for the next five years could be at 3.6 percent per year, 2.8 percent for the City, and 3 percent for the Waterford Lakes/Avalon Park Area. Residential Development In regards to the number of households estimated to be built within the Waterford Lakes/Avalon Park Area, RERC relied on a set of approved and pending residential projects supplied by Orange County Planning. However, the residential data initially provided by the Planning staff does not provide us with a sense of timing when these projects would start construction and reach complete build-out. Further discussions with the County revealed that build-out for the Waterford Lakes/Avalon Park Area s residential projects could be achieved in six years by After reviewing the residential growth that occurred in the last ten years within the Alafaya Trail corridor, we concluded that there were approximately 900 households absorbed annually. The average annual absorption of household s figure of 900 households is greater than the figures provided by the U.S. Census Bureau and Claritas because these sources of information did not have the benefit of updated development information, such as data from the Orange County Property Appraiser and the County planning department. In the final analysis, we feel more confident with local data provided to us by the aforementioned sources. With this baseline information at hand, RERC worked with the County planning staff to arrive at a reasonable rate of absorption for the Waterford Lakes/Avalon Park Area. In the final analysis, we found that there was potential to absorb approximately 1,000 to 1,100 residential units per year between 2000 and Non-Residential Development RERC has been maintaining a proprietary database of retail, office, and industrial properties in the Central Florida region since the mid 1980 s. The Waterford Lakes/Avalon Park Area is within the Union Park retail sub-market (RERC database). At Year End 2002, there was a total of approximately 2.7 million square feet of retail space surveyed within the Union Park sub-market. Of the 2.7 million square feet of retail space, about 92 percent (2.4 million square feet) was occupied. One of the most important findings with our database analysis is the rate of absorption and construction within the Union Park sub-market. Since 1990, the Union Park sub-market has added a total of approximately 2 million square feet. Occupancy rates have also increased dramatically. In 1990, the occupancy rate for the Union Park sub-market was estimated at 67 percent. As mentioned above, at Year End 2002, occupancy for this sub-market was at 92 percent. Clearly, the construction, absorption, and occupancy rates document the development potential and vitality of retail properties in the East Orange County area. The RERC database allows us to profile the type of retail centers that exist within the Union Park sub-market. For the most part, most retail centers within this sub-market are Northwest Ocoee Sector Market Assessment Real Estate Research Consultants, Inc. 28
99 community and neighborhood shopping centers usually anchored by grocery stores and/or discount stores. Exceptions to this rule include regional shopping centers such as the Waterford Lakes Town Center; and major Big Box facilities such as Lowe s Home Improvement, BJ s Wholesale Club, and Home Depot. The presence of these large t retail facilities has an impact on the development potential of retail facilities within the Waterford Lakes Area. Clearly, certain goods and services offered in these Regional Centers would most likely not be duplicated within the Waterford Lakes/Avalon Park area. The following table attempts to depict the characteristics of these retail centers. Retail Centers Year Built Square Feet Waterford Lakes Town Center ,000,000 Wal-Mart Supercenter ,500 BJ's Wholesale Club ,000 Lowe's Home Improvement ,600 Home Depot ,700 Total (Square Feet) 1,544,800 Similar to what could occur in the Primary Study Area, the Waterford Lakes/Avalon Park area has already been experiencing fast growth in terms of the number of residents and housing units built. The projections estimate that this area could absorb approximately 1,000 housing units per year in the next five years or so. Non-residential/commercial space will also continue to get built as more residents move into the area. However, most of the commercial support will be in the form of neighborhood/community serving facilities such as grocery anchored shopping centers due to the presence of nearby regional shopping facilities. Northwest Ocoee Sector Market Assessment Real Estate Research Consultants, Inc. 29
100 . REGIONAL OVERVIEW Orlando and Lakeland - Winter Haven Metropolitan Areas The Orlando Metropolitan Statistical Area (MSA) is comprised of four counties; Orange, Osceola, Seminole and Lake and is situated in the east central portion of the State. Currently, the 2003 population estimate is 1,829,219, and the 2020 forecast projects the Metro Area s population will increase to 2,555,220. In seventeen years the area is expected to increase by 726,001 new residents. The total geographical land area of the four counties is 3,501 square miles or the equivalent of 522 persons per square mile, and in 2020 the number of persons per square mile is projected to be 730. Although, the Lakeland-Winter Haven MSA is a single-county (Polk County) Metropolitan Statistical Area, Polk s projected population growth and close proximity to the Orlando MSA necessitates its inclusion into this five-county regional overview. The inclusion of the Lakeland-Winter Haven MSA in the regional analysis increases the 2003 population estimate by over a half-million people to 2,341,148 and the 2020 forecast bumps the population to 3,191,870, a 36.3% increase. It may be surprising to note that the 2003 population estimate for the five-county region is greater than the total population of 17 states, including the states of New Mexico, Utah and Nevada. The table below reflects the historical, current and projected population growth of the five-county region. Population Growth County Source: US Census; BEBR 2003 % of Region Lake 69, , , , , , , % Orange 344, , , , ,165 1,136,886 1,361, % Osceola 25,267 49, , , , , , % Seminole 83, , , , , , , % Orlando MSA 522, ,774 1,224,844 1,644,561 1,829,219 2,118,839 2,555, % Lakeland-Winter Haven MSA 228, , , , , , , % Total 5 - County Region 751,090 1,126,426 1,630,226 2,128,485 2,341,148 2,681,589 3,191, % Historical Overview In 1971, the Orlando Metro Area became world-renowned when Walt Disney opened and continued developing the first of many phases of his 29,000-acre Magic Kingdom known as Disney World. Today, the Orlando Metro Area is the world s premier tourist destination, and the continuing popularity and expansion of Disney World has brought considerable change to the once predominately agricultural area, known for orange groves, indoor foliage and ranching. The thirty plus years since 1970 have seen the five -county region s population increase by more than 1.5 million residents, tripling the region s population of The 2020 forecast for the future indicates steady increases in population, household formations and employment. Northwest Ocoee Sector Market Assessment Real Estate Research Consultants, Inc. 30
101 The Orlando Metro Area is the third most populated MSA in the State of Florida, ranking just behind the four-county, Tampa-St. Petersburg MSA and the single county, Miami-Dade MSA, respectively. The Lakeland-Winter Haven MSA ranks ninth in the State, sandwiched between the Daytona Beach MSA (8 th place) and the Melbourne-Titusville-Palm Bay MSA (10 th place). Nationwide, Orlando ranks 28 th and Lakeland-Winter Haven ranks 84 th out of 298 Metropolitan Statistical Areas. The four counties in the Orlando MSA are inextricably linked through the metro area s major road network, international airports, commuting patterns, educational facilities, major employment centers, retail centers, and sporting and cultural facilities. Each of the four counties is simultaneously, co-dependent and independent. As the Lakeland-Winter Haven MSA continues to grow, it has become less of a fringe county to the Orlando MSA. Household Trends The demand for new residential construction is primarily a function of population growth, household formations and changes in household size. As the population increases, so does the need for housing. The availability of adequate housing in the region is an integral factor influencing the region s economic growth. It is critical to have a sufficient housing inventory that is also affordable to meet the demands of the increase in population. The following table reflects the increase in households since 1970 and the projected increase in Households Trends and Forecast County * 2020 * Lake County 27,979 41,650 63,616 88, , , ,690 Orange County 116, , , , , , ,691 Osceola County 10,289 18,615 39,150 60,977 76,080 92, ,108 Seminole County 28,410 63, , , , , ,018 Orlando MSA 183, , , , , ,536 1,038,507 Lakeland-Winter Haven MSA 79, , , , , , ,381 Total 5 - County Region 263, , , , ,097 1,072,636 1,304,888 * Based on University of Florida, BEBR Medium Population Projection and Persons Per Household Projected Increase in Households County Numeric Increase % Households Change % Annual Increase Numeric Increase Households % Change % Annual Increase Lake County 21, % 2.7% 52, % 2.4% Orange County 68, % 2.4% 165, % 2.2% Osceola County 16, % 2.8% 44, % 2.7% Seminole County 25, % 2.2% 63, % 2.1% Orlando MSA 132, % 2.5% 323, % 2.2% Lakeland-Winter Haven MSA 19, % 1.3% 61, % 1.6% Total 5 - County Region 154, % 2.2% 386, % 2.1% Northwest Ocoee Sector Market Assessment Real Estate Research Consultants, Inc. 31
102 The increase in the number of household formations is directly impacted by the continuing decline in the number of persons per household. The number of one-person households continues to increase and the number of households with several children per household continues to decline. These two factors contribute greatly to the decline in the average person per household (PPH) figure. As indicated in the table below, the average person per household figure has declined from almost 3.0 PPH to 2.55 PPH. The following table shows the historical and projected descent in the average person per household figure. Average Number of Persons Per Household County * 2020* Lake County Orange County Osceola County Seminole County Orlando MSA N/A N/A N/A N/A Lakeland-Winter Haven MSA Total 5 - County Region * Projected estimates Occupied housing units, are typically separated into two categories: family households and non-family households. As can be seen in the following table, the majority of households in the 1980 to 2000 Decennial Censuses were family households. However, non-family households have continued to increase and since 1980 have grown from 25.7% of total households to 31.4% in the region. Even though there are no projections for family and non-family households, it is not unreasonable to assume that the ratio of family households to non-family households will continue. Family and Non-Family Households % Family % Non- Family % Family % Non- Family % Family County % Non- Family Lake County 75.2% 24.8% 72.7% 27.3% 70.7% 29.3% Orange County 71.4% 28.6% 67.1% 32.9% 65.5% 34.5% Osceola County 74.5% 25.5% 74.3% 25.7% 73.9% 26.1% Seminole County 78.0% 22.0% 71.9% 28.1% 69.7% 30.3% Orlando MSA 73.6% 26.4% 69.6% 30.4% 68.0% 32.0% Lakeland-Winter Haven MSA 76.1% 23.9% 74.1% 25.9% 70.7% 29.3% Total 5 - County Region 74.3% 25.7% 70.7% 29.3% 68.6% 31.4% Housing Unit Structures 1970 to 2000 The number of households reflects the number of occupied housing units and is a barometer of population growth. The inventory of dwelling units reflects housing structures, which typically includes single family, multi-family and mobile homes. The U.S. Census Bureau collects monthly building permits from the local municipalities and counties. Ultimately, the number of residential permits issued and the construction value of residential permits represent the good or bad of the national and the local economy. Northwest Ocoee Sector Market Assessment Real Estate Research Consultants, Inc. 32
103 The distribution of housing unit types varies from county to county within the region. The following table illustrating data from the Decennial Censuses of 1980 to 2000 shows the increase in the supply of single-family detached housing units: Single Family Housing Units County Numeric Change Percent Annual Change 2000 Numeric Change Percent Annual Change Lake County 32,380 38,346 5, % 59,006 20, % Orange County 126, ,426 29, % 209,853 53, % Osceola County 16,059 25,155 9, % 43,368 18, % Seminole County 50,276 73,630 23, % 95,809 22, % Orlando MSA 225, ,557 68, % 408, , % Lakeland- Winter Haven MSA 90,611 99,825 9, % 120,928 21, % Total 5-County Region 316, ,382 77, % 528, , % Of all housing types, the majority of the population prefers single-family detached homes. Household income and mortgage interest rates play a significant role in homeownership. Fortunately, even with the relatively slower economy, household income in the 5-county region has increased, and in the past year, mortgage interest rates have been lower than anytime in the previous 30 years. Recently, mortgage interest rates dropped to a low of 5.5% for a 30-year mortgage. Current conditions have been favorable for homeownership, which has in turn increased the demand for single-family housing. Coupled with the demand for single-family housing, the following table reflects the tremendous increase in multi-family dwelling units in the most recent twenty-year period (1980 to 2000). In the Orlando MSA, the ten-year period between 1990 and 2000 reflected an increase of approximately 42,484 multi-family units, which is an increase of almost 26%. In comparison, for the same time period the number of single-family dwelling units increased 39%. Multi-Family Housing Units County Numeric Change %Annual Change 2000 Numeric Change %Annual Change Lake County 4,473 10,014 5, % 12,595 2, % Orange County 47, ,642 56, % 131,071 27, % Osceola County 3,947 12,953 9, % 17,449 4, % Seminole County 14,933 38,046 23, % 46,024 7, % Orlando MSA 70, ,655 94, % 207,139 42, % Lakeland- Winter Haven MSA 16,396 30,546 14, % 37,179 6, % Total 5-County Region 86, , , % 244,318 49, % Northwest Ocoee Sector Market Assessment Real Estate Research Consultants, Inc. 33
104 Because of the affordability of mobile homes, this type of residential structure has traditionally had a significant presence in the region. Mobile homes have historically been very popular for vacation or seasonal use and for retirement. As shown in the following table, Lake and Polk counties have historically had a significant number of mobile homes and continue to see a demand for this type of residential structure. The following table consists primarily of mobile homes or trailers, but includes an insignificant number of other types of residential dwelling units (boats or recreational vehicles) as well. Mobile Homes and Other Housing Units County Numeric Change 1980 Percent Annual Numeric Change Change Percent Annual Change Lake County 13,658 27,347 13, % 31,229 3, % Orange County 10,825 22,618 11, % 20,425-2, % Osceola County 3,819 9,851 6, % 11,476 1, % Seminole County 2,945 6,169 3, % 5, % Orlando MSA 31,247 65,985 34, % 68,376 2, % Lakeland- Winter Haven MSA 27,866 55,854 27, % 68,269 12, % Total 5-County Region 59, ,839 62, % 136,645 14, % The following table reflects the total number of single family, multi-family and mobile home housing units for Decennial Census years 1970 to 2000: Total Housing Units County Lake County 28,044 50,511 75, ,830 Orange County 116, , , ,349 Osceola County 10,300 23,825 47,959 72,293 Seminole County 28,415 68, , ,079 Orlando MSA 183, , , ,551 Lakeland-Winter Haven MSA 79, , , ,376 Total 5-County Region 263, , , ,927 Regional Housing Inventory 2003 To 2020 The regional housing supply has managed to keep pace with the increase in households. Every new household formation needs shelter and in 2003, it is estimated that in the Orlando MSA there were 756,653 single-family, multi-family and mobile home dwelling units. In the Lakeland-Winter Haven MSA there were 241,924 housing units. By the year 2020, it is forecasted that there will be a total of 1,461,391 housing units in the 5-county region reflecting an increase in total housing units of 46%. Northwest Ocoee Sector Market Assessment Real Estate Research Consultants, Inc. 34
105 The following table shows the 2003 estimate and projected percent annual increase in total housing units within the five-county region. Estimated and Projected Housing Units County 2003** Average Annual % Change 2010*** Average Annual % Change 2020*** Average Annual % Change Lake County 117, % 145, % 182, % Orange County 393, % 480, % 585, % Osceola County 87, % 109, % 142, % Seminole County 159, % 189, % 228, % Orlando MSA 756, % 926, % 1,135, % Lakeland-Winter Haven MSA 241, % 271, % 322, % Total 5-County Region 998, % 1,201, % 1,461, % ** Estimate based on Y-T-D Building permits *** - Projections based on BEBR Medium population projections and PPH projections Residential Building Permit Activity As mentioned earlier, the U.S. Census Bureau collects residential building permit data from municipal and county governments on a monthly basis. As can be seen from the following table, since 1999 there have been a total of 124,113 permits issued in the Orlando MSA and 147,388 in the five-county region. For this same five-year period, single-family residential building permits represented 69% of permits issued and 31% were for multifamily units. While the total number of single-family permits issued remains strong, the total number of multi-family permits has declined each year since 1999, reflecting a slower economy and shift toward some ownership in response to record low interest rates. Overall, the total number of permits issued continues to represent a significant increase in new housing. Total Residential Building Permits County * 5-Year Total Lake County 4,146 5,231 3,719 4,413 3,930 21,439 Orange County 15,500 10,239 10,738 13,667 9,618 59,762 Osceola County 4,717 5,035 4,767 5,313 4,216 24,048 Seminole County 5,230 4,419 4,095 2,815 2,305 18,864 Orlando MSA 29,593 24,924 23,319 26,208 20, ,113 Lakeland-Winter Haven MSA 3,879 4,746 4,521 4,992 5,137 23,275 Total 5-County Region 33,472 29,670 27,840 31,200 25, ,388 * Projected estimates Northwest Ocoee Sector Market Assessment Real Estate Research Consultants, Inc. 35
106 Single-Family Residential Building Permits County * 5-Year Total Lake County 3,485 3,698 3,521 3,691 3,617 18,012 Orange County 6,965 6,174 7,393 8,091 7,461 36,084 Osceola County 3,042 3,061 3,561 3,541 3,398 16,603 Seminole County 2,876 2,467 2,225 1,983 2,189 11,740 Orlando MSA 16,368 15,400 16,700 17,306 16,665 82,439 Lakeland-Winter Haven MSA 2,967 3,520 3,839 4,442 4,611 19,379 Total 5-County Region 19,335 18,920 20,539 21,748 21, ,818 * Projected estimates Multi-Family Residential Building Permits County * 5-Year Total Lake County 661 1, ,427 Orange County 8,535 4,065 3,345 5,576 2,157 23,678 Osceola County 1,675 1,974 1,206 1, ,445 Seminole County 2,354 1,952 1, ,124 Orlando MSA 13,225 9,524 6,619 8,902 3,404 41,674 Lakeland-Winter Haven MSA 912 1, ,896 Total 5-County Region 14,137 10,750 7,301 9,452 3,930 45,570 * Year to date, through November In order of rank by total number of single-family permits issued, Orange County out-paced the remaining four counties in the region with 35.4%; Polk County was second with 19% and Lake County third with 17.7%. A detailed breakdown of county share is shown in the table below. Multifamily markets are dominated by Orange, Seminole, and Osceola Counties. Building Permits Issued 5 Year Total ( ) Single-Family Multi-Family Total County % of Region % of Region % of Region Lake County 17.7% 7.5% 14.5% Orange County 35.4% 52.0% 40.5% Osceola County 16.3% 16.3% 16.3% Seminole County 11.5% 15.6% 12.8% Orlando MSA 81.0% 91.5% 84.2% Lakeland-Winter Haven MSA 19.0% 8.5% 15.8% Total 5-County Region 100.0% 100.0% 100.0% Regional Employment Businesses draw their employees largely from the counties within the five-county region and beyond. Total historical annual employment from 1970 to 2002 and projections for 2010 and 2020 are shown in the table below. Northwest Ocoee Sector Market Assessment Real Estate Research Consultants, Inc. 36
107 Total Employment by Place of Residence * 2020* 2002 % of Region Lake County 29,400 46,320 58,830 85,500 88, , , % Orange County 171, , , , , ,600 1,101, % Osceola County 8,390 19,580 43,760 64,140 68,390 84, , % Seminole County 23,450 61, , , , , , % Orlando MSA 232, , ,520 1,069,880 1,120,740 1,333,440 1,631, % Lakeland-Winter Haven MSA 97, , , , , , , % Total 5-County Region 330, , ,940 1,304,330 1,363,370 1,608,010 1,949, % Source: Woods and Poole Economics * Projected estimates The previous table shows only a nominal increase in total employment between the years 2000 and This small increase is due to a significant increase in unemployment within this time period. The average annual unemployment rate in the Orlando MSA in 2000 was 2.6%; two years later, in 2002, the unemployment rate had climbed to 5.3%. The Lakeland- Winter Haven MSA s unemployment rate in 2000 was 4.7% and jumped to 6% in The October 2003 local area unemployment statistics shows that the Orlando MSA unemployment rate has started its descent at 4.7%, whereas the Lakeland-Winter Haven MSA remained at 6%. Detailed tables showing employment growth by major industry sector are in the Appendix. Major Employment Centers Major employment centers throughout the region tend to be located along the important transportation corridors, such as the Interstate 4 corridor, Florida s Turnpike, U.S. 27, the Orlando Central Business District and within several major sub-market areas, which includes: Maitland Center, Lake Mary/Heathrow International Business Center, Orlando Central Park, University of Central Florida, Walt Disney World and Poinciana to name just a few. The major sub-markets and corridors are located along or in close proximity to major, regional transportation facilities. A few of the major employers, which are dispersed throughout the region, are listed below: Employer Employment Walt Disney World 53,000 Florida Hospital 12,808 Universal Orlando 12,000 Orlando Regional Healthcare 12,000 Publix Supermarkets 8,500 Central Florida Investments 5,000 Darden Restaurants 4,675 Lockheed Martin Missile & Fire Control 4,500 Wal-Mart 3,700 IMC Phosphate 2,200 Northwest Ocoee Sector Market Assessment Real Estate Research Consultants, Inc. 37
108
109
110
111
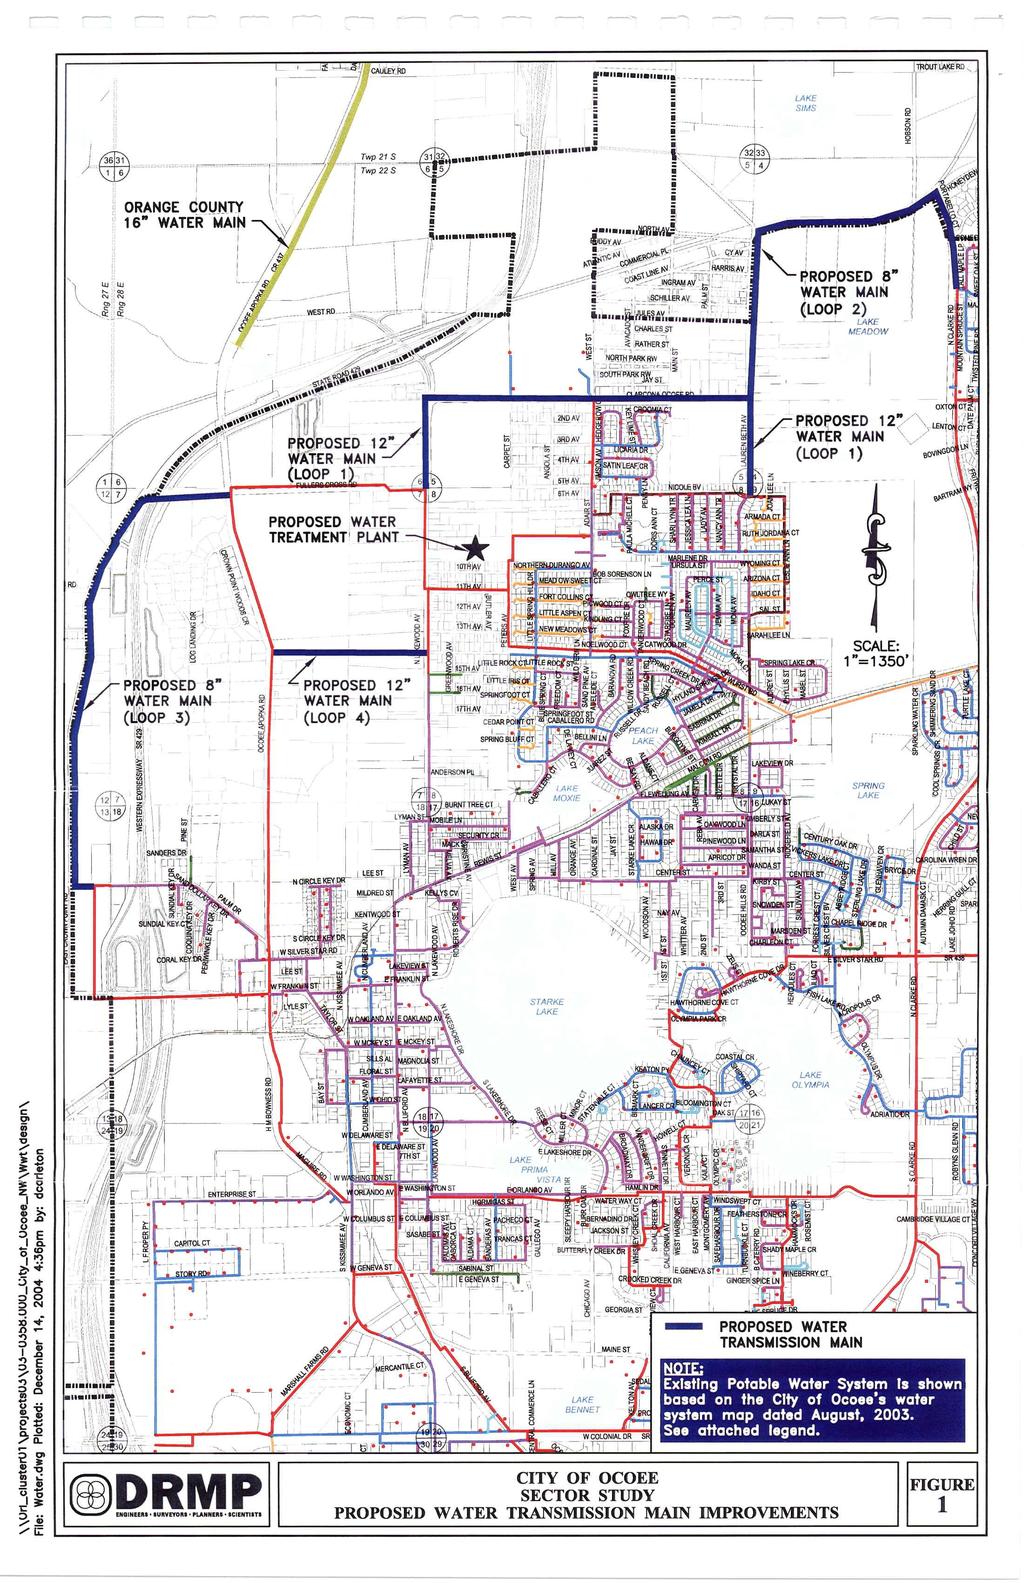
112
113
114
115
116
117
118
119
120
121
122
123
124
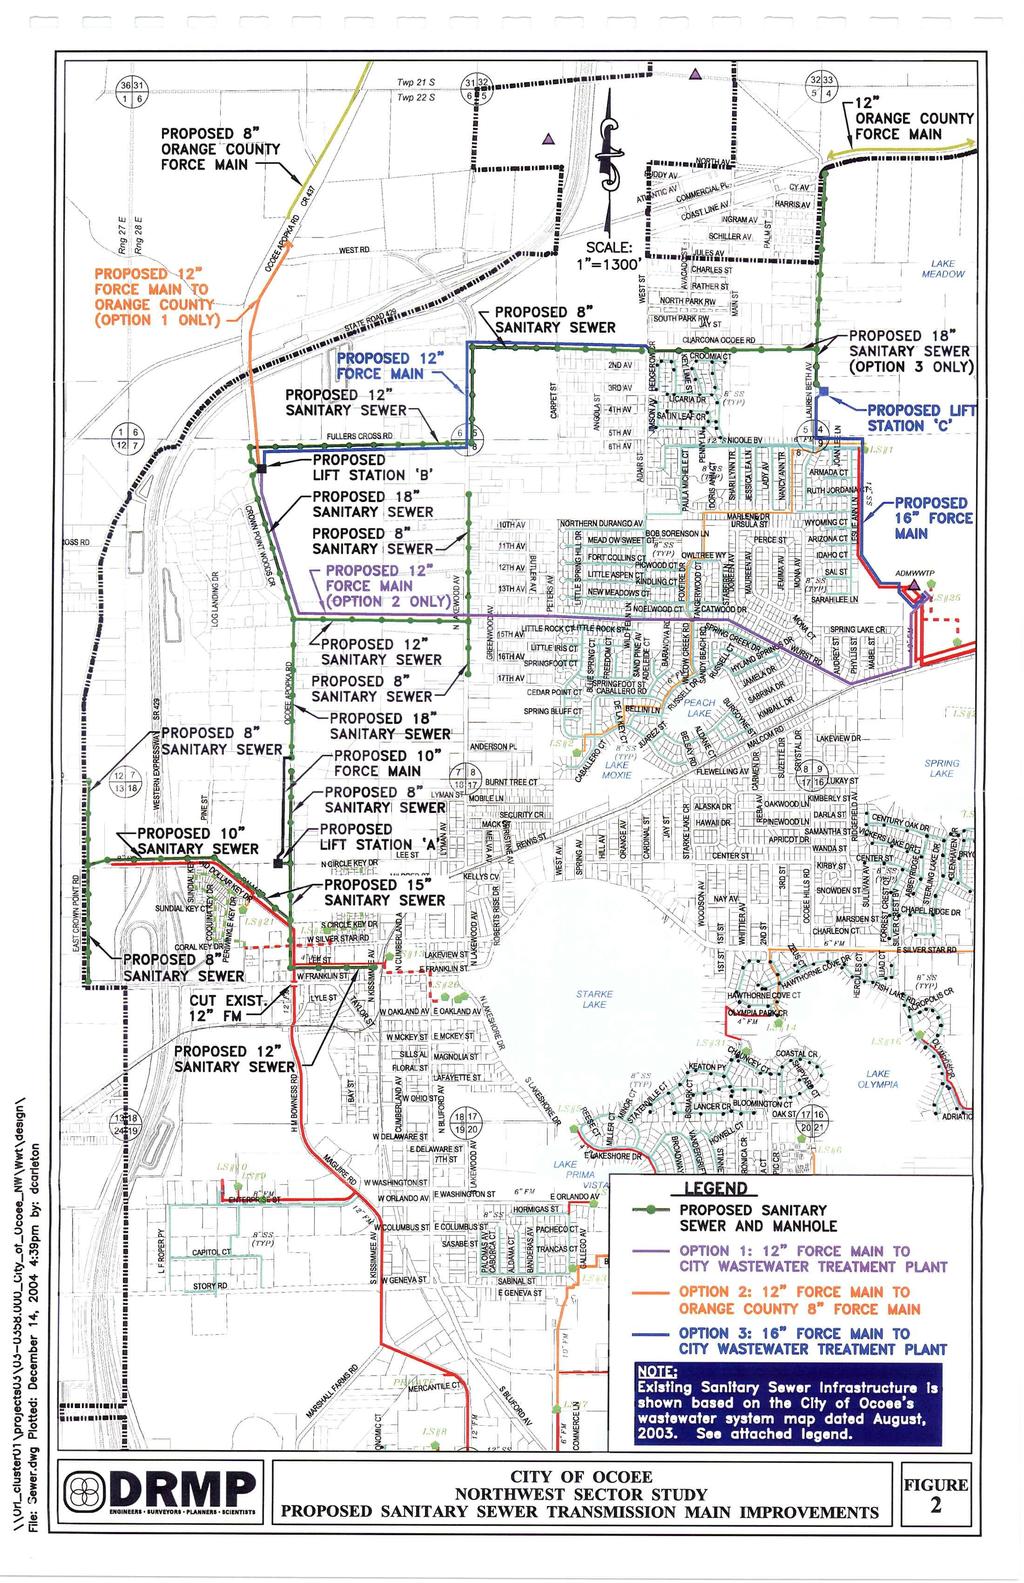
125
The transportation system in a community is an
 7 TRANSPORTATION The transportation system in a community is an important factor contributing to the quality of life of the residents. Without a sound transportation system to bring both goods and patrons
Gold Line Bus Rapid Transit Transit Oriented Development (BRTOD) Helmo Station Area Plan
 Helmo Station Area Plan") Appendix F Gold Line Bus Rapid Transit Transit Oriented Development (BRTOD) Helmo Station Area Plan Introduction and Purpose of the Plan The Gold Line Bus Rapid Transit facility is an eleven-mile dedicated
Appendix F Gold Line Bus Rapid Transit Transit Oriented Development (BRTOD) Helmo Station Area Plan Introduction and Purpose of the Plan The Gold Line Bus Rapid Transit facility is an eleven-mile dedicated
CHAPTER 3 VISION, GOALS, & PLANNING PRINCIPLES. City of Greensburg Comprehensive Plan. Introduction. Vision Statement. Growth Management Goals.
 CHAPTER 3 VISION, GOALS, & PLANNING PRINCIPLES Introduction The Greensburg Comprehensive Plan is intended as a working community document. A combination of long and short-term goals, this document is intended
Appendix C: Interim Mixed-Use Evaluation Criteria
 Appendix C: Interim Mixed-Use Evaluation Criteria C-1 Appendix C: Interim Mixed-Use Evaluation Criteria PURPOSE: The implementation of numerous policies contained within the Master Plan hinges on the creation
Executive Summary. NY 7 / NY 2 Corridor
 Executive Summary NY 7 / NY 2 Corridor Transportation and Land Use Study December 2005 Prepared for: Town of Colonie Capital District Transportation Committee Prepared by: Introduction: Land use decisions
ELMVALE ACRES SHOPPING CENTRE MASTER PLAN
 ELMVALE ACRES SHOPPING CENTRE MASTER PLAN Contents 1.0 INTRODUCTION... 2 2.0 LOCATION... 2 3.0 EXISTING CONTEXT... 2 4.0 VISION & GUIDING PRINCIPLES... 2 5.0 LAND USE AND BUILT FORM... 4 5.1 St. Laurent
This Review Is Divided Into Two Phases:
 Semiahmoo Town Centre Review The purpose of this review: To review the Semiahmoo Town Centre Concept Plan, originally approved in 1993, to ensure that this centre will continue to serve the needs of South
Silver Line CPAM UPDATE. Transportation and Land Use Committee October 14, 2016
 Silver Line CPAM UPDATE Transportation and Land Use Committee October 14, 2016 Purpose Recap Project History and Map Changes Provide Overview of CPAM Components Discuss Transportation Impacts Discuss Fiscal
Hockessin Community Redevelopment Plan
 Hockessin Community Redevelopment Plan 3.1 Introduction The Community Redevelopment Plan for the Village of Hockessin is the result of the people s vision for a distinct village center that serves as the
FUTURE LAND USE ELEMENT
 FUTURE LAND USE ELEMENT GOAL I: To create and sustain a great place to live, play, and prosper Objective 1: The City of Ocala shall incorporate the principles and strategies of the Ocala 2035 Vision into
Secrest Short Cut and Monroe Expressway Small Area Plan AUGUST 29, 2018
 Secrest Short Cut and Monroe Expressway Small Area Plan AUGUST 29, 2018 Background and Process Monroe Expressway will be open by the end of 2018 Union County and Indian Trail identified a need to revisit
Chapter 1.0 Introduction
 Chapter 1.0 Introduction 1.1 Background The North Metro commuter rail line is part of the RTD FasTracks regional transit system expansion program to build more than 100 miles of rail transit throughout
Port Lavaca Future Land Use
 Port Lavaca Future Land Use Introduction The City of Port Lavaca is beginning to see sustained growth, after many years of relative stable population. New single family homes, apartments, and businesses
CHARLES PUTMAN CHARLES PUTMAN AND ASSOCIATES, INC
 MEMORANDUM CHARLES PUTMAN & ASSOCIATES, INC. LAND DEVELOPMENT CONSULTANTS PLANNING ZONING PERMITTING 4722 NW Boca Raton Boulevard, Suite C-106 Boca Raton, Florida 33431 Phone: 561/994-6411 FAX: 561/994-0447
LAND USE OVERVIEW WHAT YOU WILL FIND IN THIS CHAPTER
 LAND USE WHAT YOU WILL FIND IN THIS CHAPTER Information about the City s expected population and employment growth. Description and capacity of existing and future land use designations. Policies that
CITY OF COLWICH COMPREHENSIVE PLAN LAND USE LAND USE 1
 LAND USE LAND USE 1 WHAT YOU WILL FIND IN THIS CHAPTER: Discussion of today s conditions and tomorrow s projections Discussion of challenges and opportunities Discussion of the environmental quality goals,
4.1.3 LAND USE CATEGORIES
 4.1.3 LAND USE CATEGORIES a. City Center District The City Center District incorporates the existing character and mix of uses in downtown Belmont to encourage redevelopment and new development in keeping
Midtown Greenway Land Use and Development Plan Executive Summary
 Midtown Greenway Land Use and Development Plan Executive Summary Introduction The Midtown Greenway Land Use and Development Plan sets policy direction for land use and development in the Midtown Greenway
6 Growth Management Challenges and Opportunities
 6 Growth Management Challenges and Opportunities The Town has established a goal of attaining a 50% participation rate with respect to employment opportunities versus residential population. The Town s
Complete Neighbourhood Guidelines Review Tool
 Complete Neighbourhood Guidelines Review Tool Prepared By: City of Regina Planning Department October 2014 Page 1 of 14 Community Development Review Checklist for Secondary Plans and Concept Plans The
DRAFT PLAN PRESENTATION
 DRAFT PLAN PRESENTATION 1.23.2018 AGENDA Process Project Schedule Results from Visioning Workshop Draft Plan Highlights Concept Plans Feedback Next Steps PROJECT SCHEDULE KICK-OFF WORKSHOP August 29 th
A. WHAT IS A GENERAL PLAN?
 I. Introduction A. WHAT IS A GENERAL PLAN? A general plan is the planning guideline for the future of a city. It contains goals and policies which regulate urban development, the protection of the natural
CHAPTER 7: Transportation, Mobility and Circulation
 AGLE AREA COMMUNITY Plan CHAPTER 7 CHAPTER 7: Transportation, Mobility and Circulation Transportation, Mobility and Circulation The purpose of the Transportation, Mobility and Circulation Chapter is to
Cumberland Region Tomorrow is a private, non-profit, citizen based regional organization working with Greater Nashville Regional Council
 Cumberland Region Tomorrow is a private, non-profit, citizen based regional organization working with Greater Nashville Regional Council and others in the public and private sectors, dedicated to planning
Planning Districts INTRODUCTION
 INTRODUCTION To facilitate detailed examination of development prospects for all areas of the community, Delano has been divided into 14 planning districts. The location of these planning districts is
Chapter 6: Community Character
 Chapter 6: Community Character The term "community character" covers a broad spectrum of concerns. First and foremost, community character is a visual concept. In Long Grove, however, community character
IMPLEMENTATION STRATEGIES. In This Chapter. Goals & Strategies 182 Project List 183 Future Land Use 186 CHAPTER 11 IMPLEMENTATION STRATEGIES
 In This Chapter Goals & Strategies 182 Project List 183 Future Land Use 186 11 IMPLEMENTATION STRATEGIES NORTH AUGUSTA, SC 2017 COMPREHENSIVE PLAN 179 Individual commitment to a group effort that is what
C. Westerly Creek Village & The Montview Corridor
 C. Westerly Creek Village & The VISION Community Vision When the goals of the city are achieved Westerly Creek Village, a distinctive community defined by Montview Boulevard and Westerly Creek, is a strong
Metro. Activity Center Design Guidelines. Recommendations For Developing Focused, Mixed-Use Commercial/Residential Centers
 Metro Activity Center Design Guidelines Recommendations For Developing Focused, Mixed-Use Commercial/Residential Centers Metro Activity Centers What is a MAC? Legacy, the adopted guide for the future growth
1.0 Purpose of a Secondary Plan for the Masonville Transit Village
 Report to Planning and Environment Committee To: Chair and Members Planning & Environment Committee From: John M. Fleming Managing Director, Planning and City Planner Subject: Masonville Transit Village
Transportation. Strategies for Action
 Transportation A major priority for the Overlake Neighborhood is to develop a multimodal transportation system. To achieve this system, a balance has to be found among travel, circulation and access needs;
Official Plan Review
 Official Plan Review Summary Report - The Built Environment August 2014 Part 1: Introduction Planning for a healthy, prosperous and sustainable community is an important goal for our municipality. From
SPRINGHILL LAKE TRANSIT VILLAGE
 Greenbelt Metro Area Sector Plan - Subarea Design Policies and Guidelines - Springhill Lake Transit Village 113 SPRINGHILL LAKE TRANSIT VILLAGE Residential Neighborhood and Village Center CONCEPT Springhill
A. Background Summary of Existing Challenges and Potential Possibilities. 1. Summary of Existing Assets and Potential Opportunities
 A. Background 1 A Main Street Master Plan Study was performed and completed in October of 2007. The study was initiated to review current land uses and development patterns along Main Street, from Parrish
2040 LUP is a part of the Comprehensive Plan and carries the same legal authority. Economic Challenges
 1.1. Guiding Anchorage s Growth Where will new residents settle over the next two decades? Where will people work, shop, and play? Will there be enough room to grow? How will Anchorage look? Will growth
Draft Memorandum #1: Goals and Vision for Revitalization
 Keizer Revitalization Plan Draft Memorandum #1: Goals and Vision for Revitalization Submitted to: City of Keizer April 12, 2018 (revised) Prepared By: Angelo Planning Group and Otak, Inc. Project No. 17482.A
Table of Contents. Elm Avenue Improvement Plan City of Waco, Texas. Introduction 1. Existing Context 1 Figure 1 2.
 Table of Contents Introduction 1 Existing Context 1 Figure 1 2 Plan Guidelines 3 Future Urban Form 4 The West-End 4 Main Street 6 The East-End 7 Figure 2 9 Public Improvement Recommendations 7 General
Citizen Comment Staff Response Staff Recommended Revision Planning Committee
 Citizen Comment Staff Response Staff Recommended Revision Planning Committee Area No. 1: Owner desires retail land uses. Area No. 1a: Owner of two small parcels adjacent to Area No. 1 desires retail land
THAT the attached Terms of Reference for the Thornhill Centre Street Study be approved.
 COMMITTEE OF THE WHOLE AUGUST 18, 2003 THORNHILL CENTRE STREET STUDY PLANNING FILE: 15.92 Recommendation The Commissioner of Planning recommends: THAT the attached Terms of Reference for the Thornhill
Additional information about land use types is given in Chapter 5. Design guidelines for Centers and Neighborhoods are given in Chapter 7.
 4. Place Types Introduction In Albemarle County s Development Areas, the Neighborhood is the fundamental unit of community planning. The County s Neighborhood Model, an adopted part of the Comprehensive
Status Update (2006 vs. Now) Citizen s Advisory Committee February Plan for Prosperity
 Citizen s Advisory Committee February Plan for Prosperity") Status Update (2006 vs. Now) Citizen s Advisory Committee February 2018 Plan for Prosperity 2000 2017 2000 2017 Gardnerville Population 6,000 5,760 5746 5,500 5,000 5,067 5,550 5,165 5,394 5,412 5,250
Status Update (2006 vs. Now) Citizen s Advisory Committee February 2018 Plan for Prosperity 2000 2017 2000 2017 Gardnerville Population 6,000 5,760 5746 5,500 5,000 5,067 5,550 5,165 5,394 5,412 5,250
APPENDIX C SPECIAL PLANNING AREAS
 SPECIAL PLANNING AREAS There are five Special Planning Areas (SPAs) on the Land Use Diagram (Figure LU-2). The SPAs are areas with significant new growth potential that require more detailed subsequent
CHAPTER 2: FUTURE LAND USE CONCEPTS
 CHAPTER 2: FUTURE LAND USE CONCEPTS INTRODUCTION The future land use concepts presented in this chapter are an expression of community support for a viable and vital US 50 Corridor. Land use recommendations
Corridor Vision. 1Pursue Minnehaha-Hiawatha Community Works Project. Mission of Hennepin County Community Works Program
 1Pursue Minnehaha-Hiawatha Community Works Project Minnehaha-Hiawatha Community Works is a project within the Hennepin Community Works (HCW) program. The mission of the HCW program is to enhance how the
CHAPTER 1. Ms. Guajardo s Class - Central Elementary CH 1 1
 INTRODUCTION CHAPTER 1 Ms. Guajardo s Class - Central Elementary CH 1 1 1.1 SETTING South Centre City is a linear corridor south of Downtown Escondido paralleling Centre City Parkway and South Escondido
Strategic Growth Area #1 Northampton Boulevard Corridor Area
 Strategic Growth Area #1 Northampton Boulevard Corridor Area Description Strategic Growth Area #1 has established itself as a major employment center in Southside Hampton Roads. Opportunities exist to
LAND USE ELEMENT. Purpose. General Goals & Policies
 LAND USE ELEMENT Purpose This Land Use Element contains the goals and policies necessary to support the City s responsibility for managing land resources and guiding development through implementing regulations,
9 th Street Sub Area Plan
 9 th Street Sub Area Plan In the 1990 s, when the Township prepared the last Master Plan, the 9 th Street corridor was studied as part of a larger 9 th Street Focus Area that included the West Main Street
Policies and Code Intent Sections Related to Town Center
 Policies and Code Intent Sections Related to Town Center The Town Center Vision is scattered throughout the Comprehensive Plan, development code and the 1994 Town Center Plan. What follows are sections
3.1 community vision. 3.3 required plan elements
 Chapter 3 Community Form 3.1 community vision 3.2 Parks & landscaping concepts 3.3 required plan elements D R A F T 20 Community Form Chapter 3 3.0 Community form 3.1 community vision The Specific Plan
MALL REVITALIZATION CASE STUDIES
 MALL REVITALIZATION CASE STUDIES DECEMBER 9, 2012 MALL REVITALIZATION OVERVIEW Introduction Sample Case Studies prepared for Lacey Woodland District Steering Committee as it considers strategies to revitalize
Definitions. Average Daily Traffic Demand (ADT): The actual number or projected number of cars that pass a point in a 24-hour period.
: The actual number or projected number of cars that pass a point in a 24-hour period.") Definitions Access Management: A combination of physical techniques and transportation policies used to control the flow of traffic between roads and the surrounding lands. Alternative City Form Scenarios:
Definitions Access Management: A combination of physical techniques and transportation policies used to control the flow of traffic between roads and the surrounding lands. Alternative City Form Scenarios:
hermitage town center
 hermitage town center A Community Vision prepared by Strada for The City of Hermitage and The Mercer County Regional Planning Commission January 2007 table of contents introduction 3 design principles
The Corporation of the Town of Milton
 Report To: From: Council Barbara Koopmans, Commissioner, Planning and Development Date: May 7, 2018 Report No: Subject: Making it Possible Positioning the Town s Strategy for Growth and Economic Development
A P P E N D I X B - O P P O R T U N I T Y S I T E S
 A P P E N D I X B - O P P O R T U N I T Y S I T E S OPPORTUNITY SITES As listed in the Land Use Element, the City has identified 15 Opportunity Sites expected to be the focus of change and revitalization
ARLINGTON COUNTY, VIRGINIA
 ARLINGTON COUNTY, VIRGINIA County Board Agenda Item Meeting October 15, 2005 DATE: September 28, 2005 SUBJECT: Request to Advertise the adoption of the 2005 Clarendon Sector Plan C. M. RECOMMENDATION:
Today Land & People. Northeast Nampa Gateway District. Employment. Land Use Characteristics. Demographics. Current Zoning
 Today Land & People Employment Major employers include Saint Alphonsus, the College of Western Idaho, the Auto Mall, Sorrento Lactalis and Walmart. 3,004 jobs in 2010 (COMPASS-CIM 2040 TAZ data) 4,345
13 THORNHILL YONGE STREET STUDY IMPLEMENTATION CITY OF VAUGHAN OPA 669 AND TOWN OF MARKHAM OPA 154
 13 THORNHILL YONGE STREET STUDY IMPLEMENTATION CITY OF VAUGHAN OPA 669 AND TOWN OF MARKHAM OPA 154 The Planning and Economic Development Committee recommends the adoption of the recommendations contained
Corridors. Re-vitalize our Corridors and Gateways
 Corridors Re-vitalize our Corridors and Gateways Artist s rendering from the 287 Strategic Plan, 2015 Corridors are the major throughways of Loveland but they also provide important commercial, community
Chapter 4. Linking Land Use with Transportation. Chapter 4
 Chapter 4 Linking Land Use with Transportation Chapter 4 59 Chapter 4 Linking Land Use with Transportation Community Design and Transportation Program Introduction Since the 1950s, the predominant development
CHAPTER 7: VISION AND ACTION STATEMENTS. Noble 2025 Vision Statement
 CHAPTER 7: VISION AND ACTION STATEMENTS This chapter presents the vision, policy and action statements that transform the comprehensive planning study, an analysis of Noble s past, future trends and community
KANATA CENTRUM 255 KANATA AVENUE OFFICIAL PLAN AMENDMENT ZONING BY-LAW AMENDMENT
 KANATA CENTRUM 255 KANATA AVENUE OFFICIAL PLAN AMENDMENT ZONING BY-LAW AMENDMENT JUNE 2015 PREPARED BY: FOTENN Consultants Inc. 223 Mcleod Street Ottawa, ON K2P OZ8 (613) 730-5709 PREPARED FOR: Kanata
City of Farmington. Downtown Plan. Amendment to the 1998 Master Plan Adopted October 11, 2004
 City of Farmington Amendment to the 1998 Master Plan Adopted October 11, 2004 Introduction Planning Background 1 Scope and Components of the Plan Amendment 2 Concept Introduction 3 Plan Concepts 3 Conceptual
3.0 PROJECT DESCRIPTION
 3.0 PROJECT DESCRIPTION 3.1 BACKGROUND Under California law (Government Code Section 65300 et seq.), every city and county is required to have a general plan. The general plan is to be comprehensive and
Joint Meeting City Council and the Plan Commission. September 1st, 2015
 Joint Meeting City Council and the Plan Commission September 1st, 2015 1 The City Plan Commission shall recommend a City Plan for the physical development of the City Article IX Section 2 of the City of
POCKET COMMUNITY PLAN
 POCKET COMMUNITY PLAN Part Three : COMMUNITY PLAN AREAS AND SPECIAL STUDY AREAS CONTENTS Community Location... 3-P-3 Community Vision... 3-P-4 Community Profile... 3-P-4 Community Issues... 3-P-6 Land
Developer s Program. The Station at East 54
 Developer s Program The Station at East 54 Existing Conditions The Station at East 54 is proposed for a 1.12 acre site at the northeast corner of Hamilton Road and Prestwick Road, tucked between the East
1.0 Introduction. Purpose and Basis for Updating the TMP. Introduction 1
 1.0 Introduction The Town of Castle Rock is situated between the metropolitan areas of Denver and Colorado Springs, amidst a unique terrain of rolling hills, mesas, ravines, and waterways. Like many Front
DEVELOPMENT FRAMEWORK POST 2030 LAND USE PLAN INTRODUCTION
 INTRODUCTION Oak Grove s Comprehensive Plan identifies a future Metropolitan Urban Service Area (MUSA). The Metropolitan Council does not anticipate extending utilities to this area prior to 2030. The
To ensure that resources will be available to provide a consistent level of public services to the community.
 Future Land Use Plan The land use plan is one of the most prominent chapters in the Stillwater Comprehensive Plan. It provides a visual representation of what the community is expected to look like in
VILLAGE OF CLEMMONS PLANNING BOARD DRAFT STAFF REPORT
 VILLAGE OF CLEMMONS PLANNING BOARD DRAFT STAFF REPORT PETITION INFORMATION Docket # C-226 Staff Megan Ledbetter Petitioner(s) JBJH Properties, LLC Owner(s) JBJH Properties, LLC Subject Property 5892-49-1766
Issues Requiring Future Study
 Issues Requiring Future Study Transportation planning is an ongoing process that tends to identify new issues as it finds solutions for others. Some issues are so complex that a solution to one problem
12/9/2013. HOLLYWOOD/PINES CORRIDOR PROJECT AMPO 2013 Annual Conference October 24, Our Perspective. Broward.
 HOLLYWOOD/PINES CORRIDOR PROJECT AMPO 2013 Annual Conference October 24, 2013 Our Perspective Broward Fort Lauderdale 1 Broward Metropolitan Planning Organization Fort Lauderdale Fort Lauderdale Skyline
2. Form and Character. 2.1 Introduction. 2.2 The Downtown Addition Plan. 2.1 Introduction
 2.1 Introduction 2.1 Introduction This section of the Specific Plan describes and illustrates the desired form, character and uses of the Downtown Addition and explains the underlying design principles.
Pine Island Road Corridor Master Plan
 RECOMMENDED DEVELOPMENT PLAN Figure 9: Del Prado Village District Conceptual Framework The Conceptual Framework (Figure 8) for development of the Pine Island Corridor is to encourage mixed-use development
DRAFT. 10% Common Open Space
 % OF CHARLOTTE IS CATEGORIZED AS A. LAND USES : Placeholder map displaying location of Place Type GOALS: Accommodate XX% of future growth. Provide a concentration of primarily commercial and civic activity
CITY OF PUYALLUP. Background. Development Services
 CITY OF PUYALLUP Development Services 333 South Meridian Puyallup WA 98371 To: City Council From: Katie Baker, AICP, Planning Division Re: South Hill Neighborhood Plan Adoption Date: (Meeting date: February
LAND USE MEADOWS PLANNING AREA
 LAND USE MEADOWS PLANNING AREA I. Profile of Meadows Planning Area A. Location Meadows Planning Area is delineated by I-5 on the north, the Nisqually Bluffs representing the growth boundary on the east,
VIRGINIA / LAKE HIGHLAND TRANSPORTATION AND LAND USE STUDY
 VIRGINIA / LAKE HIGHLAND TRANSPORTATION AND LAND USE STUDY COMMUNITY MEETING #2 - PRESENTATION OVERVIEW 1 INTRODUCTION 2 CONTEXT STUDIES 3 VISION FRAMEWORK 4 DEVELOPMENT SCENARIOS 2 1 INTRODUCTION Project
BROOKHILL NEIGHBORHOOD MODEL ZONING MAP AMENDMENT PREFACE TO APPLICATION
 BROOKHILL NEIGHBORHOOD MODEL ZONING MAP AMENDMENT PREFACE TO APPLICATION June 15, 2015 Revised: August 1, 2016 I. VISION Brookhill is a proposed community based upon the principles of Albemarle County
12 AMENDMENT NO. 149, TOWN OF MARKHAM HIGHWAY 404 NORTH SECONDARY PLAN
 12 AMENDMENT NO. 149, TOWN OF MARKHAM HIGHWAY 404 NORTH SECONDARY PLAN The Planning and Economic Development Committee recommends the adoption of the recommendation contained in the following report August
ROAD CLOSURE AND LAND USE AMENDMENT SILVER SPRINGS (WARD 1) NORTHEAST OF NOSEHILL DRIVE NW AND SILVER SPRINGS ROAD NW BYLAWS 2C2018 AND 29D2018
 NORTHEAST OF NOSEHILL DRIVE NW AND SILVER SPRINGS ROAD NW BYLAWS 2C2018 AND 29D2018") Page 1 of 19 EXECUTIVE SUMMARY This application proposes redesignating two parcels in the community of Silver Springs from Special Purpose Future Urban Development (S-FUD) District and undesignated road
Page 1 of 19 EXECUTIVE SUMMARY This application proposes redesignating two parcels in the community of Silver Springs from Special Purpose Future Urban Development (S-FUD) District and undesignated road
City of Woodinville Planning Commission Study Session. Development Regulations 101: An Overview of Specific Regulatory Items To Help You in 2012
 City of Woodinville Planning Commission Study Session Development Regulations 101: An Overview of Specific Regulatory Items To Help You in 2012 Development Regulations 101 Overview of the Different Zones
Derry Green Corporate Business Park
 Town of Milton Derry Green Corporate Business Park Urban Design Guidelines BMI/Pace - June 2010 Draft 3 Prepared by: Brook McIlroy Planning + Urban Design / Pace Architects Suite 300-51 Camden Street Toronto,
John M. Fleming Managing Director, Planning and City Planner. Old East Village Dundas Street Corridor Secondary Plan Draft Terms of Reference
 Report to Planning and Environment Committee To: From: Subject: Chair and Members Planning & Environment Committee John M. Fleming Managing Director, Planning and City Planner Old East Village Dundas Street
Visioning Statement and Guiding Principles
 Visioning Statement and Guiding Principles Planning for the Future The General Plan The General Plan represents Woodland's shared vision of the future and defines a path to lead the community toward its
3. ELEMENTS OF THE METRO VISION 2035 PLAN
 3. ELEMENTS OF THE METRO VISION 2035 PLAN What is Metro Vision and why does it matter? For more than 50 years, DRCOG has championed a regional perspective on key issues facing the metropolitan area and
Selected Area Study. Vision Plan Draft
 East Polk County Selected Area Study Draft 10.30.08 Contents Guiding Principles...4 Context Conclusions...5 Current Context...8 Scenarios...9 Scenario: Status Quo...10 Scenario: Connected & Directed Growth...12
Land Use Amendment in Southwood (Ward 11) at and Elbow Drive SW, LOC
 at and Elbow Drive SW, LOC") 2018 November 15 Page 1 of 10 EXECUTIVE SUMMARY This land use amendment application was submitted by Rick Balbi Architect on 2017 August 31 on behalf of Sable Developments Ltd, and with authorization from
2018 November 15 Page 1 of 10 EXECUTIVE SUMMARY This land use amendment application was submitted by Rick Balbi Architect on 2017 August 31 on behalf of Sable Developments Ltd, and with authorization from
CONTENTS 2.0 A FRAMEWORK FOR SUSTAINABLE GROWTH 2.1 MANAGING SUSTAINABLE GROWTH THE VISION TO GOALS AND OBJECTIVES 2.3 MARKHAM STRUCTURE
 2 A Framework for Sustainable Growth 2.0 A FRAMEWORK FOR SUSTAINABLE GROWTH CONTENTS 2.1 MANAGING SUSTAINABLE GROWTH THE VISION TO 2031 2.2 GOALS AND OBJECTIVES 2.2.1 Protecting the Natural Environment
Horizon 2035 Land Use and Transportation Element
 CITY OF SUNNYVALE Horizon 2035 Land Use and Transportation Element City Council Study Session March 7, 2017 Overview General Plan Context Mixed Use Villages Transportation Mode & Parking General Plan Policy
ORANGE COUNTY IMPLEMENTING THE FOUR C s
 ORANGE COUNTY IMPLEMENTING THE FOUR C s East Central Florida Corridor Task Force O R A N G E COUN TY P LA N N I N G DIVISION C O M M U N I T Y, E N V I R O N M E N T A L A N D D E V E L O P M E N T S E
Welcome. Comprehensive Plan & Transportation Plan Open House November 7, 2012
 Welcome Comprehensive Plan & Transportation Plan Open House November 7, 2012 Agenda Proposed future land use plan Comprehensive Plan strategies Traffic forecasts Future traffic operations Possible future
Welcome. Walk Around. Talk to Us. Write Down Your Comments
 Welcome This is an information meeting introducing the applications for proposed redevelopment of the Yorkdale Shopping Centre site at 3401 Dufferin Street and 1 Yorkdale Road over the next 20+ years,
Small Area Plan. South Gateway
 Small Area Plan Adopted May 12, 2008 South Gateway Purpose. The South Gateway Small Area Plan defines the City s expectations for the future of the southern entrance to the City at Interstate 85 and Highway
Urban Planning and Land Use
 Urban Planning and Land Use 701 North 7 th Street, Room 423 Phone: (913) 573-5750 Kansas City, Kansas 66101 Fax: (913) 573-5796 Email: planninginfo@wycokck.org www.wycokck.org/planning To: From: City Planning
V. Vision and Guiding Principles
 V. Vision and Guiding Principles The Master Plan for the Powers Ferry Corridor seeks a foundation in the desires of the community. At times, various elements of the community offered opposing viewpoints,
SYRINGA VALLEY SPECIFIC PLAN NARRATIVE
 SYRINGA VALLEY SPECIFIC PLAN NARRATIVE Introduction With this application, Pleasant Valley South LLC ( Pleasant Valley ) seeks the City of Boise s approval of a new Specific Plan Ordinance to be added
INDEPENDENCE BOULEVARD AREA PLAN
 INDEPENDENCE BOULEVARD AREA PLAN Public Meeting October 28, 2008 Tonight s Agenda Introduction 4:00 4:05 Tom Warshauer Presentation 4:05 5:00 Blake Drury Group Exercises 5:00 5:50 All Wrap Up & Next Steps
S A C R A M E N T O C O U N T Y JACKSON HIGHWAY & GRANT LINE EAST VISIONING STUDY
 JACKSON HIGHWAY & GRANT LINE EAST S A C R A M E N T O C O U N T Y P L A N N I N G D E P A R T M E N T SUMMARY AND WORKBOOK November 19, 2008 History of the Visioning Study Sacramento County has two growth