2012 Population by Race
|
|
|
- Byron Melton
- 5 years ago
- Views:
Transcription
1
2
3 Trends Annual Rate (in percent) Area State USA 0 Population Households Families Owner HHs Median HH Income Population by Age Percent Household Income 2012 Population by Race $50K - $74K 18.3% $35K - $49K 9.8% $25K - $34K 4.4% $15K - $24K 4.5% $75K - $99K 11.3% <$15K 4.8% Percent $200K+ 14.2% $100K - $149K 21.7% $150K - $199K 11.0% White Black Am. Ind. Asian Pacific Other Two+
4
5 Trends Annual Rate (in percent) Area State USA 0 Population Households Families Owner HHs Median HH Income Population by Age Percent Household Income 2012 Population by Race $50K - $74K 17.9% $35K - $49K 10.2% $25K - $34K 6.6% $15K - $24K 5.1% <$15K 6.5% Percent $75K - $99K 12.0% $200K+ 13.3% $100K - $149K 18.6% $150K - $199K 9.8% 5 0 White Black Am. Ind. Asian Pacific Other Two+
6
7 Trends Annual Rate (in percent) Area State USA 0 Population Households Families Owner HHs Median HH Income Population by Age Percent Household Income 2012 Population by Race $50K - $74K 18.7% $35K - $49K 12.0% $25K - $34K 8.2% $15K - $24K 7.2% <$15K 9.6% Percent $75K - $99K 12.0% $100K - $149K 15.5% $200K+ 9.7% $150K - $199K 7.2% White Black Am. Ind. Asian Pacific Other Two+
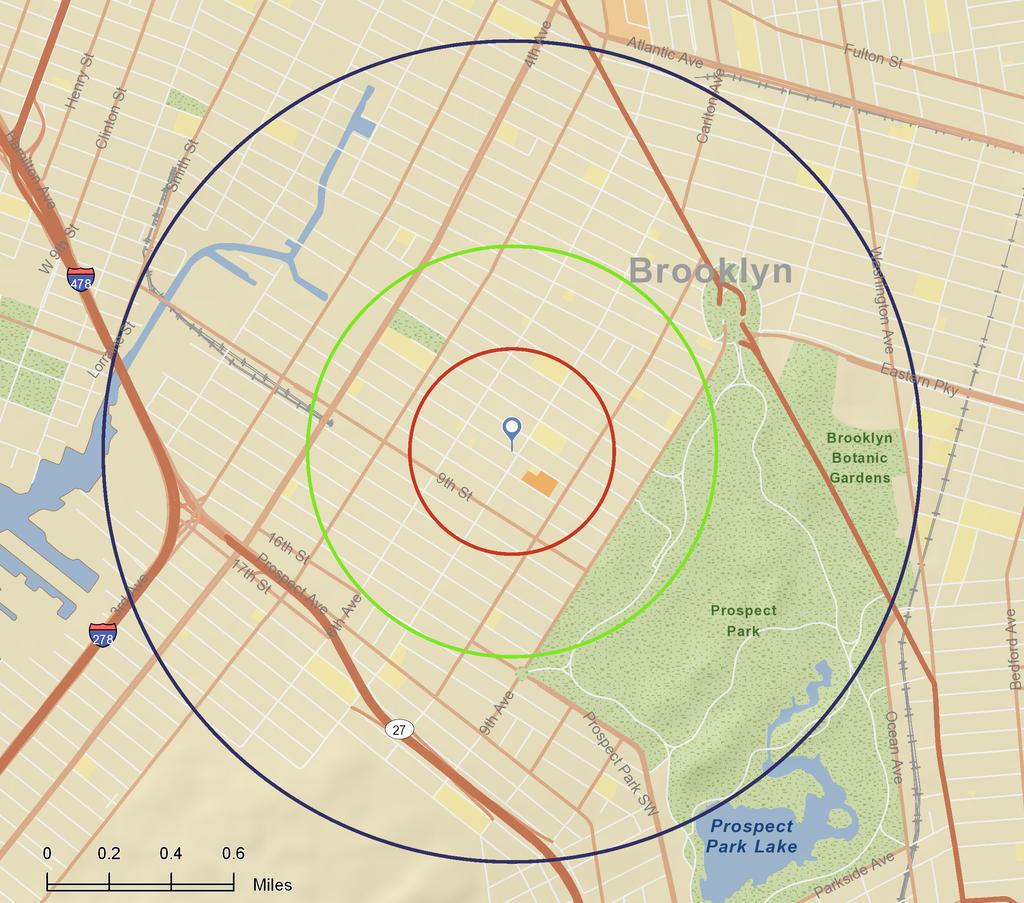
8 Lifestyle Report Ranked by Households Prepared by JGSC Group Park Slope - 7th Avenue Latitude: th St, Brooklyn, NY, Longitude: Ring: 0.25 miles radius Top Tapestry Segments Laptops and Lattes (82.8%) Trendsetters (13.4%) Metro Renters (3.8%) Percent of Households by Tapestry Segment Top Tapestry Segments: Laptops and Lattes The most eligible and unencumbered market of Community Tapestry, Laptops and Lattes residents are affluent, single, and still renting. They are highly educated, professional, and partial to city life, preferring major metropolitan areas such as New York, Los Angeles, San Francisco, Boston, and Chicago. The median household income is $100,428; the median age is 38.4 years. Technologically savvy, this is the top market for owning an ipod, as well as a laptop or notebook PC; they use the Internet daily, especially to shop. Their favorite department store, by far, is Banana Republic. Leisure activities include going to movies, rock concerts, shows, museums, and nightclubs. These residents exercise regularly and take vitamins. They enjoy yoga, jogging, skiing, reading, watching foreign films on DVD, dining out, and traveling abroad. They embrace liberal philosophies and work for environmental causes. Trendsetters These neighborhoods are located primarily on the West Coast. On the cutting edge of urban style, Trendsetters residents are young, diverse, mobile, educated professionals with substantive jobs. The median age is 35.5 years. More than half of the households are single-person or shared. Most still rent, preferring upscale, multiunit dwellings in older city districts. The median household income is $64,002. Residents are spenders; they shop in stores, online, and via the phone. They own the latest laptop computers, cell phones, and MP3 players, and use the Internet daily. Exercise includes playing tennis, volleyball, baseball, and golf as well as ice skating, snorkeling, and yoga. Leisure activities include traveling, attending rock concerts, and reading biographies. Residents also enjoy syndicated TV shows such as Access Hollywood and Seinfeld Esri 3/22/2013 Page 1 of 2
9 Lifestyle Report Ranked by Households Prepared by JGSC Group Park Slope - 7th Avenue Latitude: th St, Brooklyn, NY, Longitude: Ring: 0.25 miles radius Source: Esri Metro Renters Metro Renters residents are young (approximately 30 percent are in their 20s), well-educated singles beginning their professional careers in some of the largest U.S. cities such as New York City, Chicago, and Los Angeles. The median age is 33.8 years; the median household income is $57,662. As the name Metro Renters implies, most residents are renting apartments in high-rise buildings, living alone or with a roommate. Their interests include traveling, reading two or more daily newspapers, listening to classical music and public radio programs, and surfing the Internet. For exercise, they work out regularly at clubs, play tennis and volleyball, practice yoga, ski, and jog. They enjoy dancing, attending rock concerts, going to museums or the movies, and throwing Frisbees. Painting and drawing are favorite hobbies. Politically, this market is liberal Esri 3/22/2013 Page 2 of 2
10 Lifestyle Report Ranked by Households Prepared by JGSC Group Park Slope - 7th Avenue Latitude: th St, Brooklyn, NY, Longitude: Ring: 0.5 miles radius Top Tapestry Segments Laptops and Lattes (65.8%) Trendsetters (31.0%) Metro Renters (1.2%) High Rise Renters (1.0%) Urban Melting Pot (1.0%) Percent of Households by Tapestry Segment Top Tapestry Segments: Laptops and Lattes The most eligible and unencumbered market of Community Tapestry, Laptops and Lattes residents are affluent, single, and still renting. They are highly educated, professional, and partial to city life, preferring major metropolitan areas such as New York, Los Angeles, San Francisco, Boston, and Chicago. The median household income is $100,428; the median age is 38.4 years. Technologically savvy, this is the top market for owning an ipod, as well as a laptop or notebook PC; they use the Internet daily, especially to shop. Their favorite department store, by far, is Banana Republic. Leisure activities include going to movies, rock concerts, shows, museums, and nightclubs. These residents exercise regularly and take vitamins. They enjoy yoga, jogging, skiing, reading, watching foreign films on DVD, dining out, and traveling abroad. They embrace liberal philosophies and work for environmental causes. Trendsetters These neighborhoods are located primarily on the West Coast. On the cutting edge of urban style, Trendsetters residents are young, diverse, mobile, educated professionals with substantive jobs. The median age is 35.5 years. More than half of the households are single-person or shared. Most still rent, preferring upscale, multiunit dwellings in older city districts. The median household income is $64,002. Residents are spenders; they shop in stores, online, and via the phone. They own the latest laptop computers, cell phones, and MP3 players, and use the Internet daily. Exercise includes playing tennis, volleyball, baseball, and golf as well as ice skating, snorkeling, and yoga. Leisure activities include traveling, attending rock concerts, and reading biographies. Residents also enjoy syndicated TV shows such as Access Hollywood and Seinfeld Esri 3/22/2013 Page 1 of 2
11 Lifestyle Report Ranked by Households Prepared by JGSC Group Park Slope - 7th Avenue Latitude: th St, Brooklyn, NY, Longitude: Ring: 0.5 miles radius Source: Esri Metro Renters Metro Renters residents are young (approximately 30 percent are in their 20s), well-educated singles beginning their professional careers in some of the largest U.S. cities such as New York City, Chicago, and Los Angeles. The median age is 33.8 years; the median household income is $57,662. As the name Metro Renters implies, most residents are renting apartments in high-rise buildings, living alone or with a roommate. Their interests include traveling, reading two or more daily newspapers, listening to classical music and public radio programs, and surfing the Internet. For exercise, they work out regularly at clubs, play tennis and volleyball, practice yoga, ski, and jog. They enjoy dancing, attending rock concerts, going to museums or the movies, and throwing Frisbees. Painting and drawing are favorite hobbies. Politically, this market is liberal. High Rise Renters This segment has the highest percentage of renters among all the Community Tapestry segments; more than nine in ten households are renters in these densely populated neighborhoods. Over 40 percent of the households are in buildings with 50 or more units. High Rise Renters communities are located almost entirely in the Northeast; 86 percent of the households are in New York. Residents represent a diverse mix of cultures; many speak a language other than English. The median age is 30.1 years. Household types are mainly single parent and single person. Part-time work is just as common as full time. Residents do aerobics and play soccer. They enjoy dancing; attending basketball and football games; watching movies on DVD; and listening to all-news, urban, and Hispanic radio. They watch a variety of news programs and are avid viewers of daytime TV. Urban Melting Pot The ethnically rich Urban Melting Pot neighborhoods are made up of recently settled immigrants; more than half of whom were born abroad. Half of the foreign-born residents immigrated to the United States in the last 10 years. Most rent apartments in high-density, urban canyons of large cities, primarily in New York and California. Approximately half of the housing units were built before The median age is 36.4 years, and the median household income is $42,129. These fashion- and cost-conscious residents love to shop, from upscale retailers to warehouse/club stores. Leisure activities include going to the beach, visiting theme parks and museums, playing football, ice skating, and using Rollerblades. Distance does not deter these residents from contacting family living outside the United States. They keep in touch with phone calls and overseas travel Esri 3/22/2013 Page 2 of 2
12 Lifestyle Report Ranked by Households Prepared by JGSC Group Park Slope - 7th Avenue Latitude: th St, Brooklyn, NY, Longitude: Ring: 1 mile radius Top Tapestry Segments Trendsetters (43.6%) Laptops and Lattes (37.8%) International Marketplace (11.1%) Urban Melting Pot (2.9%) High Rise Renters (2.7%) Urban Chic (0.7%) Metro Renters (0.5%) City Lights (0.3%) NeWest Residents (0.2%) Retirement Communities (0.1%) Other segments: (0.1%) Percent of Households by Tapestry Segment Top Tapestry Segments: Trendsetters These neighborhoods are located primarily on the West Coast. On the cutting edge of urban style, Trendsetters residents are young, diverse, mobile, educated professionals with substantive jobs. The median age is 35.5 years. More than half of the households are single-person or shared. Most still rent, preferring upscale, multiunit dwellings in older city districts. The median household income is $64,002. Residents are spenders; they shop in stores, online, and via the phone. They own the latest laptop computers, cell phones, and MP3 players, and use the Internet daily. Exercise includes playing tennis, volleyball, baseball, and golf as well as ice skating, snorkeling, and yoga. Leisure activities include traveling, attending rock concerts, and reading biographies. Residents also enjoy syndicated TV shows such as Access Hollywood and Seinfeld. Laptops and Lattes The most eligible and unencumbered market of Community Tapestry, Laptops and Lattes residents are affluent, single, and still renting. They are highly educated, professional, and partial to city life, preferring major metropolitan areas such as New York, Los Angeles, San Francisco, Boston, and Chicago. The median household income is $100,428; the median age is 38.4 years. Technologically savvy, this is the top market for owning an ipod, as well as a laptop or notebook PC; they use the Internet daily, especially to shop. Their favorite department store, by far, is Banana Republic. Leisure activities include going to movies, rock concerts, shows, museums, and nightclubs. These residents exercise regularly and take vitamins. They enjoy yoga, jogging, skiing, reading, watching foreign films on DVD, dining out, and traveling abroad. They embrace liberal philosophies and work for environmental causes Esri 3/22/2013 Page 1 of 3
13 Lifestyle Report Ranked by Households Prepared by JGSC Group Park Slope - 7th Avenue Latitude: th St, Brooklyn, NY, Longitude: Ring: 1 mile radius Source: Esri International Marketplace Located primarily in cities in coastal gateway states, International Marketplace neighborhoods are developing, urban markets with a rich blend of cultures and household types. Approximately 70 percent of households are occupied by families. Married couples with children and single parents with children represent 44 percent of households. A typical family rents an apartment in an older, multiunit structure. Most of the households are located in California and northeastern states. The median age is 30.3 years, and the median household income is $47,207. Top purchases include groceries and children's clothing. Residents shop at stores such as Marshalls and Costco, but for convenience, they stop at 7-Eleven or other similar convenience stores. They are loyal listeners of Hispanic radio programs and prefer to watch movies and sports on TV. Urban Melting Pot The ethnically rich Urban Melting Pot neighborhoods are made up of recently settled immigrants; more than half of whom were born abroad. Half of the foreign-born residents immigrated to the United States in the last 10 years. Most rent apartments in high-density, urban canyons of large cities, primarily in New York and California. Approximately half of the housing units were built before The median age is 36.4 years, and the median household income is $42,129. These fashion- and cost-conscious residents love to shop, from upscale retailers to warehouse/club stores. Leisure activities include going to the beach, visiting theme parks and museums, playing football, ice skating, and using Rollerblades. Distance does not deter these residents from contacting family living outside the United States. They keep in touch with phone calls and overseas travel. High Rise Renters This segment has the highest percentage of renters among all the Community Tapestry segments; more than nine in ten households are renters in these densely populated neighborhoods. Over 40 percent of the households are in buildings with 50 or more units. High Rise Renters communities are located almost entirely in the Northeast; 86 percent of the households are in New York. Residents represent a diverse mix of cultures; many speak a language other than English. The median age is 30.1 years. Household types are mainly single parent and single person. Part-time work is just as common as full time. Residents do aerobics and play soccer. They enjoy dancing; attending basketball and football games; watching movies on DVD; and listening to all-news, urban, and Hispanic radio. They watch a variety of news programs and are avid viewers of daytime TV. Urban Chic Urban Chic residents are well-educated professionals living an urban, exclusive lifestyle. Most own expensive single-family homes with a median value of $659,997. Married-couple families and singles comprise most of these households. The median age is 42 years. Urban Chic residents travel extensively, visit museums, attend dance performances, play golf, and go hiking. They use the Internet frequently to trade or track investments or to shop, buying concert and sports tickets, clothes, flowers, and books. They appreciate a good cup of coffee while reading a book or newspaper and prefer to listen to classical music, alltalk, or public radio programs. Civic minded, residents are likely to volunteer in their communities Esri 3/22/2013 Page 2 of 3
14 Lifestyle Report Ranked by Households Prepared by JGSC Group Park Slope - 7th Avenue Latitude: th St, Brooklyn, NY, Longitude: Ring: 1 mile radius Source: Esri Metro Renters Metro Renters residents are young (approximately 30 percent are in their 20s), well-educated singles beginning their professional careers in some of the largest U.S. cities such as New York City, Chicago, and Los Angeles. The median age is 33.8 years; the median household income is $57,662. As the name Metro Renters implies, most residents are renting apartments in high-rise buildings, living alone or with a roommate. Their interests include traveling, reading two or more daily newspapers, listening to classical music and public radio programs, and surfing the Internet. For exercise, they work out regularly at clubs, play tennis and volleyball, practice yoga, ski, and jog. They enjoy dancing, attending rock concerts, going to museums or the movies, and throwing Frisbees. Painting and drawing are favorite hobbies. Politically, this market is liberal. City Lights City Lights neighborhoods are diverse, situated primarily in the Northeast. This dense, urban market is a mixture of housing, household types, and cultures, sharing the same city sidewalks. Housing types include single-family homes, townhomes, and apartments. Thirty-five percent of households are apartments in buildings with two to four units, almost four times the national level. Approximately two-thirds of the housing units were built before Households include both families and singles. The median age of 37.8 years is slightly older than the U.S. median. City Lights residents are more likely to spend for household furnishings than home maintenance. They shop at a variety of stores, especially Macy's, Disney Store, Gap, and BJ's Wholesale Club. They favor overseas travel. Being conservative investors, they own U.S. savings bonds. NeWest Residents Most NeWest Residents members rent apartments in mid- or high-rise buildings, primarily in major cities in the West and South. California has the largest concentration of these households, followed by Texas. Families dominate this market. Children reside in 54 percent of the households, either in married-couple or single-parent families. Approximately half of the population is foreign-born. This young market has a median age of 25.4 years. Most of the employed residents work in service and skilled labor occupations. These residents lead a strongly family-oriented lifestyle. Budget constraints restrict their purchases to essentials such as baby food, equipment, and products as well as children's clothing. For fun, families go to the movies, visit theme parks, and play soccer. They like to watch sports on TV, especially wrestling and soccer, and listen to Hispanic radio. Retirement Communities Retirement Communities neighborhoods are found mostly in cities scattered across the United States. The majority of households are multiunit dwellings. Congregate housing, which commonly includes meals and other services in the rent, is a trait of this segment dominated by singles who live alone. This educated, older market has a median age of 51.4 years. One-third of residents are aged 65 years or older. Although the median household income is a modest $48,045, the median net worth is $170,490. Good health is a priority; residents visit their doctors regularly, diet and exercise, purchase low-sodium food, and take vitamins. They spend their leisure time working crossword puzzles, playing bingo, gardening indoors, canoeing, gambling, and taking adult education classes. They like to spend time with their grandchildren and spoil them with toys. Home remodeling projects are usually in the works. Source: Esri 2011 Esri 3/22/2013 Page 3 of 3
15 2010 Retail MarketPlace Profile Prepared by JGSC Group Park Slope - 7th Avenue Latitude: th St, Brooklyn, NY, Longitude: Ring: 0.25 miles radius Summary Demographics 2010 Population 12, Households 5, Median Disposable Income $63, Per Capita Income $48,522 Industry Summary Demand Supply Leakage/Surplus Number of (Retail Potential) (Retail Sales) Retail Gap Factor Businesses Total Retail Trade and Food & Drink (NAICS 44-45, 722) $218,372,102 $53,006,035 $165,366, Total Retail Trade (NAICS 44-45) $184,493,427 $38,337,918 $146,155, Total Food & Drink (NAICS 722) $33,878,675 $14,668,117 $19,210, Demand Supply Leakage/Surplus Number of Industry Group (Retail Potential) (Retail Sales) Retail Gap Factor Businesses Motor Vehicle & Parts Dealers (NAICS 441) $42,849,061 $2,039,319 $40,809, Automobile Dealers (NAICS 4411) $36,837,425 $0 $36,837, Other Motor Vehicle Dealers (NAICS 4412) $2,651,282 $0 $2,651, Auto Parts, Accessories, and Tire Stores (NAICS 4413) $3,360,354 $2,039,319 $1,321, Furniture & Home Furnishings Stores (NAICS 442) $7,453,125 $1,687,168 $5,765, Furniture Stores (NAICS 4421) $4,366,463 $462,987 $3,903, Home Furnishings Stores (NAICS 4422) $3,086,662 $1,224,181 $1,862, Electronics & Appliance Stores (NAICS 443/NAICS 4431) $6,879,303 $618,808 $6,260, Bldg Materials, Garden Equip. & Supply Stores (NAICS 444) $6,951,763 $1,214,754 $5,737, Building Material and Supplies Dealers (NAICS 4441) $6,887,099 $1,214,754 $5,672, Lawn and Garden Equipment and Supplies Stores (NAICS 4442) $64,664 $0 $64, Food & Beverage Stores (NAICS 445) $40,814,826 $12,457,324 $28,357, Grocery Stores (NAICS 4451) $32,903,706 $8,282,273 $24,621, Specialty Food Stores (NAICS 4452) $4,716,532 $1,774,017 $2,942, Beer, Wine, and Liquor Stores (NAICS 4453) $3,194,588 $2,401,034 $793, Health & Personal Care Stores (NAICS 446/NAICS 4461) $9,456,593 $6,455,338 $3,001, Gasoline Stations (NAICS 447/4471) $24,681,539 $0 $24,681, Clothing and Clothing Accessories Stores (NAICS 448) $11,453,684 $2,875,902 $8,577, Clothing Stores (NAICS 4481) $9,053,995 $1,848,537 $7,205, Shoe Stores (NAICS 4482) $1,240,818 $861,709 $379, Jewelry, Luggage, and Leather Goods Stores (NAICS 4483) $1,158,871 $165,656 $993, Sporting Goods, Hobby, Book, and Music Stores (NAICS 451) $1,935,306 $3,124,763 $-1,189, Sporting Goods/Hobby/Musical Instrument Stores (NAICS 4511) $1,376,637 $272,802 $1,103, Book, Periodical, and Music Stores (NAICS 4512) $558,669 $2,851,961 $-2,293, Data Note: Supply (retail sales) estimates sales to consumers by establishments. Sales to businesses are excluded. Demand (retail potential) estimates the expected amount spent by consumers at retail establishments. Supply and demand estimates are in current dollars. The Leakage/Surplus Factor presents a snapshot of retail opportunity. This is a measure of the relationship between supply and demand that ranges from +100 (total leakage) to -100 (total surplus). A positive value represents 'leakage' of retail opportunity outside the trade area. A negative value represents a surplus of retail sales, a market where customers are drawn in from outside the trade area. The Retail Gap represents the difference between Retail Potential and Retail Sales. Esri uses the North American Industry Classification System (NAICS) to classify businesses by their primary type of economic activity. Retail establishments are classified into 27 industry groups in the Retail Trade sector, as well as four industry groups within the Food Services & Drinking Establishments subsector. Sources: Esri and Infogroup 2011 Esri 3/22/2013 Page 1 of 3
16 2010 Retail MarketPlace Profile Prepared by JGSC Group Park Slope - 7th Avenue Latitude: th St, Brooklyn, NY, Longitude: Ring: 0.25 miles radius Demand Supply Leakage/Surplus Number of Industry Group (Retail Potential) (Retail Sales) Retail Gap Factor Businesses General Merchandise Stores (NAICS 452) $14,330,549 $4,203,673 $10,126, Department Stores Excluding Leased Depts.(NAICS 4521) $3,515,770 $53,496 $3,462, Other General Merchandise Stores (NAICS 4529) $10,814,779 $4,150,177 $6,664, Miscellaneous Store Retailers (NAICS 453) $4,524,923 $3,660,869 $864, Florists (NAICS 4531) $478,646 $281,674 $196, Office Supplies, Stationery, and Gift Stores (NAICS 4532) $1,346,401 $463,708 $882, Used Merchandise Stores (NAICS 4533) $210,334 $47,554 $162, Other Miscellaneous Store Retailers (NAICS 4539) $2,489,542 $2,867,933 $-378, Nonstore Retailers (NAICS 454) $13,162,755 $0 $13,162, Electronic Shopping and Mail-Order Houses (NAICS 4541) $9,448,777 $0 $9,448, Vending Machine Operators (NAICS 4542) $431,764 $0 $431, Direct Selling Establishments (NAICS 4543) $3,282,214 $0 $3,282, Food Services & Drinking Places (NAICS 722) $33,878,675 $14,668,117 $19,210, Full-Service Restaurants (NAICS 7221) $17,017,631 $9,821,827 $7,195, Limited-Service Eating Places (NAICS 7222) $12,499,232 $4,387,305 $8,111, Special Food Services (NAICS 7223) $3,811,908 $81,350 $3,730, Drinking Places - Alcoholic Beverages (NAICS 7224) $549,904 $377,635 $172, Motor Vehicle & Parts Dealers Leakage/Surplus Factor by Industry Subsector Furniture & Home Furnishings Stores Electronics & Appliance Stores Bldg Materials, Garden Equip. & Supply Stores NAICS Industry Subsector Food & Beverage Stores Health & Personal Care Stores Gasoline Stations Clothing and Clothing Accessories Stores Sporting Goods, Hobby, Book, and Music Stores General Merchandise Stores Miscellaneous Store Retailers Nonstore Retailers Food Services & Drinking Places < Surplus Leakage > Sources: Esri and Infogroup 2011 Esri 3/22/2013 Page 2 of 3
17 2010 Retail MarketPlace Profile Prepared by JGSC Group Park Slope - 7th Avenue Latitude: th St, Brooklyn, NY, Longitude: Ring: 0.25 miles radius Automobile Dealers Other Motor Vehicle Dealers Auto Parts, Accessories, and Tire Stores Furniture Stores Home Furnishings Stores Electronics & Appliance Stores Building Material and Supplies Dealers Lawn and Garden Equipment and Supplies Stores Grocery Stores Specialty Food Stores Beer, Wine, and Liquor Stores Health & Personal Care Stores Leakage/Surplus Factor by Industry Group NAICS Industry Group Gasoline Stations Clothing Stores Shoe Stores Jewelry, Luggage, and Leather Goods Stores Sporting Goods/Hobby/Musical Instrument Stores Book, Periodical, and Music Stores Department Stores (Excluding Leased Depts.) Other General Merchandise Stores Florists Office Supplies, Stationery, and Gift Stores Used Merchandise Stores Other Miscellaneous Store Retailers Electronic Shopping and Mail-Order Houses Vending Machine Operators Direct Selling Establishments Full-Service Restaurants Limited-Service Eating Places Special Food Services Drinking Places (Alcoholic Beverages) < Surplus Leakage > Sources: Esri and Infogroup 2011 Esri 3/22/2013 Page 3 of 3
18 2010 Retail MarketPlace Profile Prepared by JGSC Group Park Slope - 7th Avenue Latitude: th St, Brooklyn, NY, Longitude: Ring: 0.5 miles radius Summary Demographics 2010 Population 39, Households 17, Median Disposable Income $59, Per Capita Income $47,681 Industry Summary Demand Supply Leakage/Surplus Number of (Retail Potential) (Retail Sales) Retail Gap Factor Businesses Total Retail Trade and Food & Drink (NAICS 44-45, 722) $678,068,467 $175,256,828 $502,811, Total Retail Trade (NAICS 44-45) $573,018,882 $122,103,397 $450,915, Total Food & Drink (NAICS 722) $105,049,585 $53,153,431 $51,896, Demand Supply Leakage/Surplus Number of Industry Group (Retail Potential) (Retail Sales) Retail Gap Factor Businesses Motor Vehicle & Parts Dealers (NAICS 441) $133,097,202 $2,139,967 $130,957, Automobile Dealers (NAICS 4411) $114,371,465 $0 $114,371, Other Motor Vehicle Dealers (NAICS 4412) $8,277,696 $0 $8,277, Auto Parts, Accessories, and Tire Stores (NAICS 4413) $10,448,041 $2,139,967 $8,308, Furniture & Home Furnishings Stores (NAICS 442) $22,931,406 $4,401,278 $18,530, Furniture Stores (NAICS 4421) $13,398,802 $2,973,067 $10,425, Home Furnishings Stores (NAICS 4422) $9,532,604 $1,428,211 $8,104, Electronics & Appliance Stores (NAICS 443/NAICS 4431) $21,330,762 $2,563,631 $18,767, Bldg Materials, Garden Equip. & Supply Stores (NAICS 444) $21,476,938 $1,722,111 $19,754, Building Material and Supplies Dealers (NAICS 4441) $21,277,641 $1,560,791 $19,716, Lawn and Garden Equipment and Supplies Stores (NAICS 4442) $199,297 $161,320 $37, Food & Beverage Stores (NAICS 445) $127,298,578 $55,469,333 $71,829, Grocery Stores (NAICS 4451) $102,639,532 $39,299,681 $63,339, Specialty Food Stores (NAICS 4452) $14,727,368 $4,288,334 $10,439, Beer, Wine, and Liquor Stores (NAICS 4453) $9,931,678 $11,881,318 $-1,949, Health & Personal Care Stores (NAICS 446/NAICS 4461) $29,374,642 $24,038,235 $5,336, Gasoline Stations (NAICS 447/4471) $76,703,197 $785,963 $75,917, Clothing and Clothing Accessories Stores (NAICS 448) $35,455,577 $9,558,195 $25,897, Clothing Stores (NAICS 4481) $28,041,859 $6,807,031 $21,234, Shoe Stores (NAICS 4482) $3,862,857 $1,616,201 $2,246, Jewelry, Luggage, and Leather Goods Stores (NAICS 4483) $3,550,861 $1,134,963 $2,415, Sporting Goods, Hobby, Book, and Music Stores (NAICS 451) $6,015,330 $5,138,508 $876, Sporting Goods/Hobby/Musical Instrument Stores (NAICS 4511) $4,272,908 $1,590,111 $2,682, Book, Periodical, and Music Stores (NAICS 4512) $1,742,422 $3,548,397 $-1,805, Data Note: Supply (retail sales) estimates sales to consumers by establishments. Sales to businesses are excluded. Demand (retail potential) estimates the expected amount spent by consumers at retail establishments. Supply and demand estimates are in current dollars. The Leakage/Surplus Factor presents a snapshot of retail opportunity. This is a measure of the relationship between supply and demand that ranges from +100 (total leakage) to -100 (total surplus). A positive value represents 'leakage' of retail opportunity outside the trade area. A negative value represents a surplus of retail sales, a market where customers are drawn in from outside the trade area. The Retail Gap represents the difference between Retail Potential and Retail Sales. Esri uses the North American Industry Classification System (NAICS) to classify businesses by their primary type of economic activity. Retail establishments are classified into 27 industry groups in the Retail Trade sector, as well as four industry groups within the Food Services & Drinking Establishments subsector. Sources: Esri and Infogroup 2011 Esri 3/22/2013 Page 1 of 3
19 2010 Retail MarketPlace Profile Prepared by JGSC Group Park Slope - 7th Avenue Latitude: th St, Brooklyn, NY, Longitude: Ring: 0.5 miles radius Demand Supply Leakage/Surplus Number of Industry Group (Retail Potential) (Retail Sales) Retail Gap Factor Businesses General Merchandise Stores (NAICS 452) $44,576,449 $6,591,669 $37,984, Department Stores Excluding Leased Depts.(NAICS 4521) $10,927,529 $84,227 $10,843, Other General Merchandise Stores (NAICS 4529) $33,648,920 $6,507,442 $27,141, Miscellaneous Store Retailers (NAICS 453) $14,037,003 $8,609,488 $5,427, Florists (NAICS 4531) $1,474,344 $730,111 $744, Office Supplies, Stationery, and Gift Stores (NAICS 4532) $4,185,482 $1,117,856 $3,067, Used Merchandise Stores (NAICS 4533) $647,643 $223,290 $424, Other Miscellaneous Store Retailers (NAICS 4539) $7,729,534 $6,538,231 $1,191, Nonstore Retailers (NAICS 454) $40,721,798 $1,085,019 $39,636, Electronic Shopping and Mail-Order Houses (NAICS 4541) $29,342,373 $0 $29,342, Vending Machine Operators (NAICS 4542) $1,346,417 $0 $1,346, Direct Selling Establishments (NAICS 4543) $10,033,008 $1,085,019 $8,947, Food Services & Drinking Places (NAICS 722) $105,049,585 $53,153,431 $51,896, Full-Service Restaurants (NAICS 7221) $52,714,291 $32,735,640 $19,978, Limited-Service Eating Places (NAICS 7222) $38,806,403 $17,826,978 $20,979, Special Food Services (NAICS 7223) $11,832,907 $1,480,045 $10,352, Drinking Places - Alcoholic Beverages (NAICS 7224) $1,695,984 $1,110,768 $585, Motor Vehicle & Parts Dealers Leakage/Surplus Factor by Industry Subsector Furniture & Home Furnishings Stores Electronics & Appliance Stores Bldg Materials, Garden Equip. & Supply Stores NAICS Industry Subsector Food & Beverage Stores Health & Personal Care Stores Gasoline Stations Clothing and Clothing Accessories Stores Sporting Goods, Hobby, Book, and Music Stores General Merchandise Stores Miscellaneous Store Retailers Nonstore Retailers Food Services & Drinking Places < Surplus Leakage > Sources: Esri and Infogroup 2011 Esri 3/22/2013 Page 2 of 3
20 2010 Retail MarketPlace Profile Prepared by JGSC Group Park Slope - 7th Avenue Latitude: th St, Brooklyn, NY, Longitude: Ring: 0.5 miles radius Automobile Dealers Other Motor Vehicle Dealers Auto Parts, Accessories, and Tire Stores Furniture Stores Home Furnishings Stores Electronics & Appliance Stores Building Material and Supplies Dealers Lawn and Garden Equipment and Supplies Stores Grocery Stores Specialty Food Stores Beer, Wine, and Liquor Stores Health & Personal Care Stores Leakage/Surplus Factor by Industry Group NAICS Industry Group Gasoline Stations Clothing Stores Shoe Stores Jewelry, Luggage, and Leather Goods Stores Sporting Goods/Hobby/Musical Instrument Stores Book, Periodical, and Music Stores Department Stores (Excluding Leased Depts.) Other General Merchandise Stores Florists Office Supplies, Stationery, and Gift Stores Used Merchandise Stores Other Miscellaneous Store Retailers Electronic Shopping and Mail-Order Houses Vending Machine Operators Direct Selling Establishments Full-Service Restaurants Limited-Service Eating Places Special Food Services Drinking Places (Alcoholic Beverages) < Surplus Leakage > Sources: Esri and Infogroup 2011 Esri 3/22/2013 Page 3 of 3
21 2010 Retail MarketPlace Profile Prepared by JGSC Group Park Slope - 7th Avenue Latitude: th St, Brooklyn, NY, Longitude: Ring: 1 mile radius Summary Demographics 2010 Population 107, Households 47, Median Disposable Income $51, Per Capita Income $39,386 Industry Summary Demand Supply Leakage/Surplus Number of (Retail Potential) (Retail Sales) Retail Gap Factor Businesses Total Retail Trade and Food & Drink (NAICS 44-45, 722) $1,539,130,947 $591,199,664 $947,931, ,078 Total Retail Trade (NAICS 44-45) $1,301,201,653 $461,069,928 $840,131, Total Food & Drink (NAICS 722) $237,929,294 $130,129,736 $107,799, Demand Supply Leakage/Surplus Number of Industry Group (Retail Potential) (Retail Sales) Retail Gap Factor Businesses Motor Vehicle & Parts Dealers (NAICS 441) $301,158,978 $39,922,903 $261,236, Automobile Dealers (NAICS 4411) $258,773,069 $12,749,227 $246,023, Other Motor Vehicle Dealers (NAICS 4412) $18,613,796 $16,855,874 $1,757, Auto Parts, Accessories, and Tire Stores (NAICS 4413) $23,772,113 $10,317,802 $13,454, Furniture & Home Furnishings Stores (NAICS 442) $50,911,490 $19,939,829 $30,971, Furniture Stores (NAICS 4421) $29,611,293 $6,703,072 $22,908, Home Furnishings Stores (NAICS 4422) $21,300,197 $13,236,757 $8,063, Electronics & Appliance Stores (NAICS 443/NAICS 4431) $48,136,649 $10,756,186 $37,380, Bldg Materials, Garden Equip. & Supply Stores (NAICS 444) $47,843,623 $41,652,843 $6,190, Building Material and Supplies Dealers (NAICS 4441) $47,400,526 $41,330,203 $6,070, Lawn and Garden Equipment and Supplies Stores (NAICS 4442) $443,097 $322,640 $120, Food & Beverage Stores (NAICS 445) $292,256,166 $161,394,517 $130,861, Grocery Stores (NAICS 4451) $235,847,091 $122,776,405 $113,070, Specialty Food Stores (NAICS 4452) $33,900,875 $13,973,690 $19,927, Beer, Wine, and Liquor Stores (NAICS 4453) $22,508,200 $24,644,422 $-2,136, Health & Personal Care Stores (NAICS 446/NAICS 4461) $66,823,448 $39,126,127 $27,697, Gasoline Stations (NAICS 447/4471) $175,024,858 $37,867,831 $137,157, Clothing and Clothing Accessories Stores (NAICS 448) $80,154,580 $25,099,510 $55,055, Clothing Stores (NAICS 4481) $63,502,848 $18,042,884 $45,459, Shoe Stores (NAICS 4482) $8,835,006 $2,874,343 $5,960, Jewelry, Luggage, and Leather Goods Stores (NAICS 4483) $7,816,726 $4,182,283 $3,634, Sporting Goods, Hobby, Book, and Music Stores (NAICS 451) $13,631,109 $11,260,430 $2,370, Sporting Goods/Hobby/Musical Instrument Stores (NAICS 4511) $9,651,474 $3,872,290 $5,779, Book, Periodical, and Music Stores (NAICS 4512) $3,979,635 $7,388,140 $-3,408, Data Note: Supply (retail sales) estimates sales to consumers by establishments. Sales to businesses are excluded. Demand (retail potential) estimates the expected amount spent by consumers at retail establishments. Supply and demand estimates are in current dollars. The Leakage/Surplus Factor presents a snapshot of retail opportunity. This is a measure of the relationship between supply and demand that ranges from +100 (total leakage) to -100 (total surplus). A positive value represents 'leakage' of retail opportunity outside the trade area. A negative value represents a surplus of retail sales, a market where customers are drawn in from outside the trade area. The Retail Gap represents the difference between Retail Potential and Retail Sales. Esri uses the North American Industry Classification System (NAICS) to classify businesses by their primary type of economic activity. Retail establishments are classified into 27 industry groups in the Retail Trade sector, as well as four industry groups within the Food Services & Drinking Establishments subsector. Sources: Esri and Infogroup 2011 Esri 3/22/2013 Page 1 of 3
22 2010 Retail MarketPlace Profile Prepared by JGSC Group Park Slope - 7th Avenue Latitude: th St, Brooklyn, NY, Longitude: Ring: 1 mile radius Demand Supply Leakage/Surplus Number of Industry Group (Retail Potential) (Retail Sales) Retail Gap Factor Businesses General Merchandise Stores (NAICS 452) $101,656,715 $31,465,311 $70,191, Department Stores Excluding Leased Depts.(NAICS 4521) $24,798,453 $502,534 $24,295, Other General Merchandise Stores (NAICS 4529) $76,858,262 $30,962,777 $45,895, Miscellaneous Store Retailers (NAICS 453) $31,721,747 $22,185,208 $9,536, Florists (NAICS 4531) $3,276,657 $1,227,614 $2,049, Office Supplies, Stationery, and Gift Stores (NAICS 4532) $9,495,592 $5,113,217 $4,382, Used Merchandise Stores (NAICS 4533) $1,440,728 $815,774 $624, Other Miscellaneous Store Retailers (NAICS 4539) $17,508,770 $15,028,603 $2,480, Nonstore Retailers (NAICS 454) $91,882,290 $20,399,233 $71,483, Electronic Shopping and Mail-Order Houses (NAICS 4541) $66,514,904 $597,302 $65,917, Vending Machine Operators (NAICS 4542) $3,091,103 $5,463,614 $-2,372, Direct Selling Establishments (NAICS 4543) $22,276,283 $14,338,317 $7,937, Food Services & Drinking Places (NAICS 722) $237,929,294 $130,129,736 $107,799, Full-Service Restaurants (NAICS 7221) $119,113,363 $71,493,560 $47,619, Limited-Service Eating Places (NAICS 7222) $88,151,435 $36,426,145 $51,725, Special Food Services (NAICS 7223) $26,868,290 $18,750,018 $8,118, Drinking Places - Alcoholic Beverages (NAICS 7224) $3,796,206 $3,460,013 $336, Motor Vehicle & Parts Dealers Leakage/Surplus Factor by Industry Subsector Furniture & Home Furnishings Stores Electronics & Appliance Stores Bldg Materials, Garden Equip. & Supply Stores NAICS Industry Subsector Food & Beverage Stores Health & Personal Care Stores Gasoline Stations Clothing and Clothing Accessories Stores Sporting Goods, Hobby, Book, and Music Stores General Merchandise Stores Miscellaneous Store Retailers Nonstore Retailers Food Services & Drinking Places < Surplus Leakage > Sources: Esri and Infogroup 2011 Esri 3/22/2013 Page 2 of 3

23 2010 Retail MarketPlace Profile Prepared by JGSC Group Park Slope - 7th Avenue Latitude: th St, Brooklyn, NY, Longitude: Ring: 1 mile radius Automobile Dealers Other Motor Vehicle Dealers Auto Parts, Accessories, and Tire Stores Furniture Stores Home Furnishings Stores Electronics & Appliance Stores Building Material and Supplies Dealers Lawn and Garden Equipment and Supplies Stores Grocery Stores Specialty Food Stores Beer, Wine, and Liquor Stores Health & Personal Care Stores Leakage/Surplus Factor by Industry Group NAICS Industry Group Gasoline Stations Clothing Stores Shoe Stores Jewelry, Luggage, and Leather Goods Stores Sporting Goods/Hobby/Musical Instrument Stores Book, Periodical, and Music Stores Department Stores (Excluding Leased Depts.) Other General Merchandise Stores Florists Office Supplies, Stationery, and Gift Stores Used Merchandise Stores Other Miscellaneous Store Retailers Electronic Shopping and Mail-Order Houses Vending Machine Operators Direct Selling Establishments Full-Service Restaurants Limited-Service Eating Places Special Food Services Drinking Places (Alcoholic Beverages) < Surplus Leakage > Sources: Esri and Infogroup 2011 Esri 3/22/2013 Page 3 of 3
24
25
26
27
28
29
30
31
32
33
34
35
Retail MarketPlace Profile
 Ring: 1 mile radius Latitude: 32.35365 Summary Demographics 2016 Population 7,400 2016 Households 3,138 2016 Median Disposable Income $41,269 2016 Per Capita Income $24,267 Industry Summary (Retail Potential)
Retail MarketPlace Profile
 Ring: 3 miles radius Longitude: -83.78862 Summary Demographics 21 Population 28,66 21 Households 9,146 21 Median Disposable Income $35,477 21 Per Capita Income $18,259 Industry Summary (Retail Potential)
Retail MarketPlace Profile
 Drive Time: 5 minute radius Longitude: -86.79066 Summary Demographics 2015 Population 10,596 2015 Households 4,648 2015 Median Disposable Income $55,009 2015 Per Capita Income $47,446 Industry Summary
Retail MarketPlace Profile
 Summary Demographics Ring: 1 mile radius Longitude: -79.19276 2015 Population 2,497 2015 Households 1,302 2015 Median Disposable Income $36,906 2015 Per Capita Income $31,929 Industry Summary (Retail Potential)
Site Map. Meadowlark Dr & Robinhood Rd, Winston Salem, NC, October 31, Esri
 Site Map Robinhood Village Meadowlark Dr & Robinhood Rd, Winston Salem, NC, 27106 Ring: 1, 3, 5 Miles Latitude: 36.120508 Longitude: -80.367204 October 31, 2011 2011 Esri Executive Summary Ring: 1, 3,
Retail MarketPlace Profile
 Retail MarketPlace Profile Drive Time: 5 minute radius Longitude: -77.40323 Summary Demographics 2015 Population 8,394 2015 Households 3,199 2015 Median Disposable Income $38,578 2015 Per Capita Income
KARNS, TENNESSEE 5.7 Acres Available Located on Oak Ridge Highway Excellent Development Opportunity!
 KARNS, TENNESSEE 5.7 Acres Available Located on Oak Ridge Highway Excellent Development Opportunity! DIXON GREENWOOD, CCIM Ball Realty & Auction, Inc. P.O. Box 237, Tazewell, TN 37879 423-626-9393 office
Demographic and Income Profile
 Demographic and Income Profile Summary Census 21 212 217 Population 3,718 3,985 4,362 Households 1,316 1,418 1,571 Families 1,128 1,212 1,336 Average Household Size 2.82 2.81 2.77 Owner Occupied Housing
.33 AC AC RETAIL LAND FOR SALE OR BUILD TO SUIT ORCHARD ROAD & OAK STREET, NORTH AURORA, IL 60542
 Development Opportunity.33 AC - 6.74 AC RETAIL LAND FOR SALE OR BUILD TO SUIT ORCHARD ROAD & OAK STREET, NORTH AURORA, IL 60542 OFFERING SUMMARY Price / Acre: See Enclosed Pricing Summary Lot Size:.33
Retail / Office - Available on Busy Florence Ave.
 Retail / Office - Available on Busy Florence Ave. 1931-1935 Florence Ave. Los Angeles, CA 90001 DEMOS 1 mile 3 mile 5 mile Population 62,398 489,568 1,146,128 Avg. HH Income $43,380 $44,533 $45,775 Daytime
3598 OLD JENNINGS RD 3598 Old Jennings Rd, Middleburg, FL 32068
 LAND FOR SALE 3598 OLD JENNINGS RD 3598 Old Jennings Rd, Middleburg, FL 32068 PROPERTY FEATURES 7.69 Acres at Lighted intersection Adjacent Properties are Zoned MPC, School & Retail NC Across Tynes Water
SECOND FLOOR STUDIO AVAILABLE ON VENTURA BLVD
 SECOND FLOOR STUDIO AVAILABLE ON VENTURA BLVD Located at 13563 1/2 Ventura Blvd, Sherman Oaks, CA 91423 DEMOS 1 mile 3 mile 5 mile Population 24,151 187,734 519,845 Avg. HH Income $121,056 $109,474 $101,327
SUMMARY CENSUS Population 135, , ,685. Households 44,675 52,029 57,758. Families 36,035 41,582 45,978
 Retail Specialty Report 450 US-23, Suwanee, Georgia, 30024 RING: 5 MILES Demographic & Income Profile SUMMARY CENSUS 2010 2017 2022 Population 135,417 157,987 175,685 Households 44,675 52,029 57,758 Families
RETAIL PROPERTY FOR LEASE RYLAND PLAZA Ryland Pike, Huntsville, AL Clinton Avenue Suite 501 Huntsville, AL deancre.
 1001 Ryland Pike, Huntsville, AL 35811 2101 Clinton Avenue Suite 501 Huntsville, AL 35805 deancre.com 1001 RYLAND PIKE, HUNTSVILLE, AL 35811 EXECUTIVE SUMMARY OFFERING SUMMARY Available SF: 1,000-2,000
EDC ADDENDUM to the INTERIM REPORT
 EDC ADDENDUM to the INTERIM REPORT Economic Impact Assessment of Mansfield Park November 2018 STEWARDSHIP STRATEGIES Design Planning Historic Preservation Economic Development INTERIM REPORT - Economic
the GARRISON at Stafford
 the GARRISON at Stafford 425 GARRISONVILLE ROAD STAFFORD, VA 22556 STAFFORD COUNTY VA FOR LEASING INFORMATION PLEASE CONTACT: Dallon L. Cheney 703-268-2703 dcheney@klnb.com DEVELOPED BY: Melissa Welch
5245 South Durango Drive Las Vegas, Nevada
 Revised 01.17.17 Charles Creigh 702.221.2500 ext. 305 ccreigh@newmarketadvisors.com Bob Touma 702.221.2500 ext. 318 Cell/Text 702.371.3467 btouma@newmarketadvisors.com FEATURES Deer Springs Town Center
5245 South Durango Drive Las Vegas, Nevada newmarketadvisors.com
 Revised 11.9.18 Charles Creigh 702.221.2500 ext. 305 ccreigh@newmarketadvisors.com Bob Touma 702.221.2500 ext. 318 Cell/Text 702.371.3467 btouma@newmarketadvisors.com Features Deer Springs Town Center
Retail Market Place Analysis Village of Monroe Comprehensive Plan. Prepared by
 Retail Market Place Analysis Village of Monroe Comprehensive Plan Prepared by January 31, 2011 Introduction It is clear from travelling around the Village that Monroe's current land use pattern is not
RMP Opportunity Gap - Retail Stores 2007
 Radius 1: 5737 S TRANSIT RD, LOCKPORT, NY 14094-5892, 0.00-3.00 Miles, Total Total Retail Sales Incl Eating and Drinking Places 552,172,317 460,321,140 Motor Vehicle and Parts Dealers-441 103,214,550 82,475,641
RMP Opportunity Gap - Retail Stores
 Radius 1:, 0.00-1.00 Miles, Total Total Retail Sales Incl Eating and Drinking Places 20,171,574 13,300,717 Motor Vehicle and Parts Dealers-441 3,793,941 601,379 Automotive Dealers-4411 3,202,573 356,177
RMP Opportunity Gap - Retail Stores
 Radius 1:, 0.00-1.00 Miles, Total Total Retail Sales Incl Eating and Drinking Places 265,416,122 83,489,366 Motor Vehicle and Parts Dealers-441 45,469,731 11,931,711 Automotive Dealers-4411 40,430,946
RMP Opportunity Gap - Retail Stores
 Radius 1:, 0.00-3.00 Miles, Total Total Retail Sales Incl Eating and Drinking Places 709,535,602 1,041,558,846 Motor Vehicle and Parts Dealers-441 136,302,785 84,961,319 Automotive Dealers-4411 120,666,093
appendix 6: retail market potential opportunity gap retail stores 2007 Appendix Kensington and Vicinity Sector Plan Appendix 70
 appendix 6: retail market potential opportunity gap retail stores 2007 Appendix Kensington and Vicinity Sector Plan Appendix 70 Total Retail Sales Incl Eating and Drinking Places 32,442,099 95,578,148
Retail Leakage and Surplus Analysis
 The Retail Leakage and Surplus Analysis examines the quantitative aspect of the community's retail opportunities. It is a guide to understanding retail opportunities but it is not an analysis that indicates
Real Estate/Economic Considerations
 Real Estate/Economic Considerations Why a Market Study? Understand demographic trends & real estate market conditions Translate growth forecasts into New housing Workplace uses Hotel/lodging Retail & supporting
Business-Facts Summary - Retail NAICS Summary
 - Retail NAICS Summary Title Page Title Page Data Version: 2018 Feb (Internal) Report Generation Method: Single Analysis Area: 1789 STATE ST, SAN DIEGO, CA, 92101-2530 Reporting Detail: As Selected Include
Retail Leakage and Surplus Analysis
 Retail Leakage and Surplus Analysis The Retail Leakage and Surplus Analysis examines the quantitative aspect of the community's retail opportunities. It is a guide to understanding retail opportunities
Retail Leakage and Surplus Analysis
 Retail Leakage and Surplus Analysis The Retail Leakage and Surplus Analysis examines the quantitative aspect of the community's retail opportunities. It is a guide to understanding retail opportunities
Business-Facts: Retail NAICS Summary 2015
 Business-Facts: Retail NAICS Summary 25 McLean CRD 25 Polygon :, NAICS Code Business Description Establishment Employees Sales (in Millions) 44,45,22 All Retail (including Food Services and Drinking Places)
Business-Facts: Retail NAICS Summary 2015
 Business-Facts: Retail NAICS Summary 215 Lake Anne 215 Polygon 1: LAKE ANNE 2, NAICS Code Business Description Establishment Employees Sales (in Millions) 44,45,722 All Retail (including Food Services
Retail Availability. 1-Mile 3-Mile 5-Mile 23, , ,400 $74,386 $66,319 $63,873. Legendary COMMERCIAL REAL ESTATE
 Retail Availability Retail Availability Retail Availability & Lease Rates: > ±800 SF to ± 4,920 SF In-Line Stores - $2.75 PSF + 0.45 NNN Charges > ±24,980 SF - Anchor Space - Leased to 99 ONLY Stores Join
Legendary COMMERCIAL REAL ESTATE
 764 ive, San Bernardino, CA 92408 Retail Availability & Lease Rates: > ±1,782 Sq. Ft. to ±16,790 Sq. Ft. of High Density Retail Space Available > Anchor Space Rate: $1.25 PSF Mo +.25 NNN s > Shop Space
Legendary COMMERCIAL REAL ESTATE
 RETAIL ANCHOR & IN-LINE STORES FOR LEASE ±7,000 SF to ±8,250 SF Anchor Store Available & In-Line Shops In-Line Shops - 5 Available Stores at 1,250 Sq. Ft. Each Retail Availability & Lease Rates: > Anchor
VIA CAMPO PLAZA 2809 Via Campo, Montebello, CA Super Market Anchor Space Available
 Retail Availability Freeway Visible Pylon Retail Availability & Lease Rates: Join Project & Area Tenants: > ±767 SF to ± 3,595 SF In-Line Stores - $2.75 PSF + 0.45 NNN Charges > ±24,980 SF - Anchor Space
CUSTOM OFFICE SPACE AVAILABLE 3101 Bristol Road Bensalem, PA 19020
 FOR SALE OR LEASE CUSTOM OFFICE SPACE AVAILABLE 3101 Bristol Road Bensalem, PA 19020 Up to ~7,800 Square Feet Fully Customizable Space Can Be Finished to Suit Building Under Full Renovation & Upgrade Energy
PROPERTY INFORMATION Executive Summary
 PROPERTY INFORMATION Executive Summary OFFERING SUMMARY Sale Price: $749,000 Lease Rate: $15-18 NNN Lot Size: 0.37 Acres Year Built: 1886 Renovated: 2011 PROPERTY HIGHLIGHTS Located on Main Street Route
Business-Facts: Retail SIC Summary
 Order #: 9638549 Site: HIGHWAY 6 W AT HIGHWAY 35 S, CARTHAGE, MS 395,. - 5. Miles, + RET All Retailing,4 46. 5 Building Materials, Garden Supply and Mobile Homes 8 5.6 5 Lumber and Other Building Materials.8
Study Area Maps. Profile Tables. The CORE Shopping Centre Pitney Bowes 2018 Canada Business Summary
 Powered by Sitewise Page 1 Study Area Maps Profile Tables 2018 Canada Business Summary 2018 Canada Businesses By SIC Codes (1-49) 2018 Canada Businesses By SIC Codes (50-99) Prepared on: 4/20/2018 3:45:52
RAMHIC Eligible SIC Codes: Wholesale and Retail 5012 Automobiles and other Motor Vehicles 5013 Motor Vehicle Supplies and New Parts 5014 Tires and
 RAMHIC Eligible SIC Codes: Wholesale and Retail 5012 Automobiles and other Motor Vehicles 5013 Motor Vehicle Supplies and New Parts 5014 Tires and Tubes 5015 Motor Vehicle Parts, Used 5021 Furniture 5023
DOWNTOWN PORTLAND MARKET STUDY. Austin Colson, Brian Keesey Josh Kluzak, Maria Kornakova, Ann Sojka, David Wood
 DOWNTOWN PORTLAND MARKET STUDY Austin Colson, Brian Keesey Josh Kluzak, Maria Kornakova, Ann Sojka, David Wood Michigan State University: Urban and Regional Planning, Spring 2011 Agenda 1. Project Scope
Business-Facts Summary - Workplace Business and Employment
 - Workplace Business and Employment Title Page Title Page Data Version: 2018 Feb (Internal) Report Generation Method: Single Analysis Area: 1789 STATE ST, SAN DIEGO, CA, 92101-2530 Reporting Detail: As
Second Wednesdays 1:00 2:15 pm ET
 Second Wednesdays 1:00 2:15 pm ET www.fs.fed.us/research/urban-webinars This meeting is being recorded. If you do not wish to be recorded, please disconnect now. USDA is an equal opportunity provider and
House and Home Expenditures
 Ring: 1 mile radius Longitude: -87.63703 2017 Housing Summary 2017 Demographic Summary Housing Units 41,485 Population 60,881 2017-2022 Percent Change 5.75% Households 34,983 Percent Occupied 84.3% Families
House and Home Expenditures
 Ring: 1 mile radius Longitude: -76.70654 2016 Housing Summary 2016 Demographic Summary Housing Units 2,011 Population 8,323 2016-2021 Percent Change 6.56% Households 1,792 Percent Occupied 89.1% Families
Treasure Coast Regional Planning Council
 Treasure Coast Regional Planning Council Began these Services in 1989 Lead 93 Public Charrettes Regionally & Statewide Assisted with 23 Other Public Charrettes Services Include: Citizen-Based Planning
Retail, Reinvestment, Redevelopment Scott Polikov, FAICP
 Retail, Reinvestment, Redevelopment Scott Polikov, FAICP TCMA Summer 2018 Amazon HQ 2.0 In Plano 3.0 Customers see this as a transformative opportunity for Plano and Amazon 5,555 customer reviews
SOUTH DADE PLAZA N. Dixie Highway Cutler Bay, FL
 18591 N. Dixie Highway Cutler Bay, FL SUMMARY Description South Dade Plaza is a fully renovated 30,270 square foot outparcel. Staples, currently occupies two-thirds of the building. The space available
ARTICLE XVIII C 1 CENTRAL BUSINESS DISTRICT
 ARTICLE XVIII C 1 CENTRAL BUSINESS DISTRICT SECTION 1. INTENT AND PURPOSE OF DISTRICT: The C 1 Central Business District is intended for the purpose of grouping retail merchandising activities into a concentrated
FOR LEASE. Downtown Frederick Retail/Office Space for Lease. Property Details PRESENTING
 FOR LEASE $3,500/SF (Modified Gross Lease) 630 North Market Street, 1 st Floor, Frederick, Maryland 21701 PRESENTING Location: 630 North Market Street, 1 st Floor, Frederick, MD 21701 Downtown Frederick
333 Troutman Street MSNYC RETAIL. myspacenyc.com
 333 Troutman Street MSNYC RETAIL myspacenyc.com 888.484.1115 About the Property This 17,000 square foot corner property boasts 170 square feet of property on Troutman and is only a block away from the
and Establishments Report
 TOTAL Population (2012) 441,874 Sex (2012) Male 215,584 48.79 Female 226,290 51.21 Age Distribution (2012) 0 4 22,026 4.98 5 9 23,005 5.21 10 19 54,427 12.32 20 29 56,542 12.8 30 39 49,124 11.12 40 49
Issues Shaping the Outlook for the Remodeling Industry
 Issues Shaping the Outlook for the Remodeling Industry Kermit Baker Remodeling Futures Program Joint Center for Housing Studies NARI Fall 2017 Leadership Summit September 8, 2017 Home Remodeling Spending
FOR LEASE. Ideal Downtown Frederick Location for Retail, Restaurant or Fitness PRESENTING
 FOR LEASE CALL FOR PRICING 125 East All Saints Street, Frederick, Maryland 21701 Ideal Downtown Frederick Location for Retail, Restaurant or Fitness Here is where the downtown action is today and will
Spotlight on Upholstery
 SPECIAL SUPPLEMENT TO FURNITURE TODAY APRIL 8, 2013 CONSUMER VIEWS Spotlight on Upholstery PRESENTATION SPONSORED BY 2 FURNITURE TODAY APRIL 8, 2013 Stain-resistant fabric is top priority for buyers Americans
Mercantile Classifications
 Mercantile s Refer to the following table for a list of eligible Mercantile s. If the risk does not match one of the descriptions from the classification table but is similar to one of the classifications,
Northshore Commerce Study
 Northshore Commerce Study An Overview of Demographics, Employment, and Business Activity of the Northshore Region of Louisiana September 2008 Southeastern Louisiana University Business Research Center
124 Rivington Street MSNYC RETAIL myspacenyc.com
 124 Rivington Street MSNYC RETAIL 888.484.1115 myspacenyc.com ABOUT THE PROPERTY 124 Rivington Street Rental Rate: Building Size: Space Available: Year Built: Property Type: Property Sub-type: Additional
Electric (208/120 v 3 phase), Natural Gas, Water & Sewer
, Natural Gas, Water & Sewer") FOR LEASE CALL FOR PRICING 2 East Patrick Street, Frederick, Maryland 21701 Exceptional Frederick Historic Location Located at the corner South Market and East Patrick Streets in Downtown Frederick, this
FOR LEASE CALL FOR PRICING 2 East Patrick Street, Frederick, Maryland 21701 Exceptional Frederick Historic Location Located at the corner South Market and East Patrick Streets in Downtown Frederick, this
Retail Goods and Services Expenditures
 Ring: 1 mile radius Longitude: -87.63703 Top Tapestry Segments Percent Demographic Summary 2017 2022 Metro Renters (3B) 86.7% Population 60,881 65,727 Laptops and Lattes (3A) 10.6% Households 34,983 38,003
Appendix D: Background Data and Definition of Terms
 Appendix D: Background Data and Definition of Terms Gross Leasable Area (GLA) Gross leasable area (GLA) is the total retail floor area designed for tenant occupancy and exclusive use, including basements,
Seeking Restaurant / Retail For Total Of 6,767 SF Adjacent to UC Berkeley, High Foot Traffic
 Exclusive Lis ng Agent: John Polyzoides john.polyzoides@srsre.com 415.908.4939 CA Lic: 01942201 415.908.4930 Description The new David Blackwell Hall is ideally situated one block from Berkeley s busiest
Livingston County. Commercial District Assessment. Phase 1: Market Analysis
 Click to Livingston County Commercial District Assessment Phase 1: Market Analysis This document has been developed with funding assistance from Housing Trust Fund Corporation and NYS Homes & Community
Retail Goods and Services Expenditures
 Ring: 1 mile radius Longitude: -87.63698 Top Tapestry Segments Percent Demographic Summary 2012 2017 Metro Renters 86.1% Population 54,570 59,470 Laptops and Lattes 13.2% Households 30,965 34,423 College
Canadian Retail Sales Slide During Icy Winter
 Canadian Retail Sales Slide During Icy Winter Retailers struggled to bring in sales this December and finished the year on a weak note. All Stores sales increased by 2.1% and All Stores Less Automotive,
CooperTowne Center. Somerdale, NJ (c) National Realty & Development Corp. Page 1
 National Realty & Development Corp. Page 1") CooperTowne Center Somerdale, NJ Page 1 Somerdale, NJ Table of Contents Quick Facts Property Photo Property Photo Property Photo Lease Plan Competition Map Demographics Demographics Demographics 3 4 5
CooperTowne Center Somerdale, NJ Page 1 Somerdale, NJ Table of Contents Quick Facts Property Photo Property Photo Property Photo Lease Plan Competition Map Demographics Demographics Demographics 3 4 5
City Council March 27, Parks, Recreation, and Trails Master Plan
 City Council March 27, 2018 Parks, Recreation, and Trails Master Plan Planning Process Develop Goals and Objectives Inventory of Areas and Facilities Needs Assessment And Identification Public Participation
LAND USE AND DEVELOPMENT REGULATIONS. 140 Attachment 3
 LAND USE AND DEVELOMENT REGULATIONS 140 Attachment 3 Schedule of ermitted and Conditional Uses for Nonresidential Zone Districts 1 [Amended 3-10-2004 by Ord. No. 3-2004; 6-23-2004 by Ord. No. 14-2004;
Retail Goods and Services Expenditures
 Ring: 1 mile radius Latitude: 25.80474 Top Tapestry Segments Percent Demographic Summary 2017 2022 Southwestern Families (7F) 33.9% Population 27,810 29,255 NeWest Residents (13C) 19.0% Households 9,092
Village Center N. Dale Mabry Hwy. Tampa, FL LEASING OPPORTUNITIES
 Village Center 13100-13262 N. Dale Mabry Hwy. Tampa, FL 33618 This is how we mix it up. An inspired selection of quality and value for a deserving market. Our Fresh Look philosophy combines unique placemaking
O'REILLY AUTO PARTS. Investment Property Offering $1,220,000. West Spring St. & Swanson Dr., Monroe, GA Offering Highlights
 Investment Property Offering $1,220,000 O'REILLY AUTO PARTS West Spring St. & Swanson Dr., Monroe, GA 30655 Presented By: Cindy Langman 322 Washington Street, Suite 101 Gainesville, GA 30501 (770)531-9992
Floor Coverings Industry Distribution Channels
 TABLE OF CONTENTS U.S. FLOOR COVERINGS SPENDING TRENDS AND DISTRIBUTION CHANNEL ANALYSIS... 1 Summary Of Major Findings... 1 Installed Value Of Floor Coverings Spending... 2 Hard Surface Versus Soft Surface
Hammond Retail Study
 Hammond Retail Study February 2007 Southeastern Louisiana University Business Research Center Compiled By: John Giamalva Acknowledgement of contributors to this study: Southeastern Louisiana University,
Price Elasticity Number Name Type. Income Elasticity. Income Elasticity
 Consumption Categories for Policy Insight v9.5 Consumption Categories for PI + v Number Name Type Income Price Number Name Type Income Price parts Necessities 0.46-0. New autos Luxuries.4 -. Net purchases
DeGeorge Realty LLC. For Sale Highway Commercial Land. Location: 4816 Highway 33 Wall, NJ Taxes: $7,492. Block: 910 Lot: 1
 DeGeorge Realty LLC For Sale Highway Land Acres: 1.75 +/- rice: $ 1,850,000 / $120,000 Ground Lease Location: 4816 Highway 33 Wall, NJ 07719 Taxes: $7,492 Block: 910 Lot: 1 Zoning: HB-40 ( 40,000 sqft).
NEW BUSINESS PITCH. Let s Build Something Together
 NEW BUSINESS PITCH Let s Build Something Together The Data You Need to Win This Pitch NAME BRAND PITCH TYPE MARKET DATE Lowe s has launched its first media agency review in more than a decade. Media North
Rubber and Plastics Rubber and Plastics Leather Manufacturing Leather Manufacturing Stone, Glass, and Concrete 5 0.
 Rubber and Plastics 7 0.05 Rubber and Plastics 508 0.28 Leather Manufacturing 0 0.00 Leather Manufacturing 0 0.00 Stone, Glass, and Concrete 5 0.03 Stone, Glass, and Concrete 139 0.08 Metals Fabrication
New York City s Neighborhood Grocery Store and Supermarket Shortage New York City Department of City Planning
 Going to Market: New York City s Neighborhood Grocery Store and Supermarket Shortage New York City Department of City Planning Going to Market: Introduction Grocery Stores to People Assessing Need for
Market Settings and Market Structure for Appliances and Energy Consumption
 Market Settings and Market Structure for Appliances and Energy Consumption Alladi Venkatesh Shivendu Shivendu Sumit Deo April 1, 2010 Center on Energy Efficiency in Appliances and Consumer Electronics
Carving up the Northshore
 April 9, 2010 The Southeastern Louisiana University Business Research Center (BRC) is jointly operated by the Southeast Louisiana Business Center and the Southeastern College of Business. The BRC provides
Investment Opportunity Lowe s (S&P: A+)
") Lowe s (S&P: A+) Plus Pad Sites Burger King, Webster Bank, Dunkin Donuts & Dollar Tree 500 New Haven Avenue - Derby, CT Investment Summary: This investment opportunity consists of a new Lowe s ground leased
Lowe s (S&P: A+) Plus Pad Sites Burger King, Webster Bank, Dunkin Donuts & Dollar Tree 500 New Haven Avenue - Derby, CT Investment Summary: This investment opportunity consists of a new Lowe s ground leased
Origin Energy Essentials Report. Full Report May 2014
 Origin Energy Essentials Report Full Report May 2014 Introduction Phil Craig Executive General Manager, Corporate Affairs, Origin Energy is an essential part of our everyday lives, but one that we often
CLASS CODE CLASSIFICATION
 CLASS CODE 1A 2A 2B 2C 2D 2E 2F 2G 2H 2I 2J 2K 2L 2M 2N 2O 2P 2Q 2R 2S 2T 2V 3A 3BA 3BB 3CC 3D 3E 3F 3G 3H CLASSIFICATION AGENT AND DEALER MANUFACTURER LICENSE IMPORTER LIQUOR WHOLESALE LICENSE WHOLESALE
Locally Produced Food. Access to Nutritious Foods
 a healthy LA ...eats well Locally Produced Food Access to Nutritious Foods The types, amount, and availability of healthy food is just as important in promoting healthier lifestyles and combating chronic
Home Improvement Multiples Market Report - UK Analysis
 Home Improvement Multiples Market Report - UK 2016-2020 Analysis Published: 26/08/2016 / Number of Pages: 89 / Price: 845.00 Introduction and Overview The new edition of the 'Home Improvement Multiples
2.18 MU Mixed Use District.
 2.18. Intent - The is established to promote the development of an urban residential environment. The regulations are intended to encourage single family urban residential use and development while allowing
SECOND QUARTER 2018 CHARLOTTE-MECKLENBURG GROWTH REPORT
 SECOND QUARTER HIGHLIGHTS SECOND QUARTER 2018 CHARLOTTE-MECKLENBURG GROWTH REPORT Manufacturing, Professional Services Investments Lead Strong Second Quarter CLT ranked No. 2 Best Airport for Business
Retail Goods and Services Expenditures
 Drive Time Band: 0-5 minute radius Latitude: 29.70382 Top Tapestry Segments Percent Demographic Summary 2015 2020 NeWest Residents (13C) 31.4% Population 44,671 46,756 American Dreamers (7C) 29.5% Households
Metro. Activity Center Design Guidelines. Recommendations For Developing Focused, Mixed-Use Commercial/Residential Centers
 Metro Activity Center Design Guidelines Recommendations For Developing Focused, Mixed-Use Commercial/Residential Centers Metro Activity Centers What is a MAC? Legacy, the adopted guide for the future growth
Retail Goods and Services Expenditures
 Ring: 1 mile radius Longitude: -110.88453 Top Tapestry Segments Percent Demographic Summary 2015 2020 Old and Newcomers (8F) 32.1% Population 15,672 15,655 Set to Impress (11D) 19.1% Households 7,683 7,689
Growth Markets for Remodeling
 Growth Markets for Remodeling While the timing and magnitude of a remodeling turnaround are difficult to predict, it is clear that the home improvement industry can no longer rely as heavily on upper-end
EMERGING TRENDS IN THE REMODELING MARKET JOINT CENTER FOR HOUSING STUDIES OF HARVARD UNIVERSITY 22
 5OPPORTUNITIES FOR GROWTH With the home improvement market nearing full recovery, spending growth is likely to moderate. Indeed, given the demographic and economic obstacles facing the industry, generating
Retail Goods and Services Expenditures
 Ring: 1 mile radius Longitude: -120.48310 Top Tapestry Segments Percent Demographic Summary 2016 2021 Down the Road (10D) 51.1% Population 3,473 3,558 Small Town Simplicity (12C) 38.9% Households 1,244
Retail Goods and Services Expenditures
 Ring: 1 mile radius Latitude: 32.22201 Top Tapestry Segments Percent Demographic Summary 2016 2021 Retirement Communities (9E) 33.4% Population 14,275 14,644 Old and Newcomers (8F) 23.8% Households 7,066
Business and Marketing Practices of U.S. Green Industry
 Business and Marketing Practices of U.S. Green Industry Ariana Torres, Ph.D. Assistant Professor Marketing Specialist Purdue University torres2@purdue.edu January 17, 2018 Business Category Type of Business
Planning & Zoning Commission
 Planning & Zoning Commission Planning & Development Department June 2, 2014 Request Applicant Owner Zoning Location Attachments Background Consideration of a Master/Site Development Plan for Calder Plaza
Kroger Junction FOR LEASE 2619 Red Bluff Rd, Pasadena, Texas 77506
 Kroger Junction FOR LEASE 2619 Red Bluff Rd, Pasadena, Texas 77506 The information contained herein while based upon data supplied by source deemed reliable, is subject to errors or omissions and is not
CITY OF SURREY BY-LAW NO. 2076
 CITY OF SURREY BY-LAW NO. 2076 A By-law to exempt certain defined classes of shops in the City from the Shop Closing Provisions of the "Municipal Act"....................................................
ScS Group plc Preliminary Results for the year ended 30 July October 2016
 ScS Group plc Preliminary Results for the year ended 30 July 2016 4 October 2016 October 2014 ScS Group plc preliminary results for the year ended 30 July 2016 Agenda Agenda Introduction David Knight Chief
New York Workers Compensation & Employers Liability Manual Classification Code 8025 Bicycle Store retail Effective October 1, 2010
 B U L L E T I N July 19, 2010 200 East Forty-Second Street New York, New York 10017 Tel: (212) 697-3535 www.nycirb.org Contact: Ms. Annmarie Visciano Manager, Underwriting Services Ext. 161, avisciano@nycirb.org