Systematic Test & Evaluation of Metal Detectors (STEMD) Interim Report Field Trial Mozambique
|
|
|
- Jean Powell
- 6 years ago
- Views:
Transcription


1 2nd ed. January 2008
2 Systematic Test & Evaluation of Metal Detectors (STEMD) Interim Report Field Trial Mozambique EUROPEAN COMMISSION J.R.C. ISPRA IPSC Distribution List: Distribution Unit Quantity Distribution Unit Quantity J.M. Cadiou - 1 A. Sieber SERAC 1 AIDCO EC 3 A. Lewis SERAC 2 Prof. M. Sato Tohuko Univ. 1 D. Guelle SERAC 3 N. Mulliner UNMAS 1 M. Pike SERAC 1 E. Gagnon UNDP 1 G. Lewis SERAC 1 B. Sayasenh UXO Lao 4 J. Fortuny SERAC 1 A. Carruthers GICHD 1 A. Scholderman TNO 1 S.M. Bowen QinetiQ 1 C. Mueller BAM 1 Y. Das DRDC 1 M. Gaal BAM 1 T. van Dyck CSIR 2 H. Eigenbrod Fraunhofer Inst. 2 A. Manneschi CEIA S.p.A 1 O. Jungwirth CROMAC 1 K. Ebinger Ebinger GmbH 1 N. Pavkovic CTDT 1 K. Himmler Dr. Foerster Inst. 1 D. Barlow JMU 3 H. Graham Minelab Limited 1 D. Lewis QinetiQ 1 H.G. Schiebel Schiebel GmbH 1 ITEP Secretariat ITEP 2 Mr. Vallon Vallon GmbH 1 Curt Larsson ITEP 1 2
3 Table of Contents 1 Introduction Background Systematic Test and Evaluation of Metal Detectors The mine problem in Mozambique Purpose and Objectives of the Trial Trial preparation and selection of detectors Long-term preparation Personnel and Resources Final field trial preparation and training seminar Detector selection before the trial Technical details of the detectors tested Methodology and Procedures of the Trial Selection of CWA tests Selection of targets Test matrix Target layout in lanes Daily lane preparation Detection Depths in Soils In Air Detection Height detector setup to soil Limitations of detector sensitivity measurements in the field Estimate of uncertainty Soil properties Introduction Ground Reference Height Magnetic Susceptibility Meter Expected dependence of the sensitivity on the soil magnetic properties Results: Comparison of all detectors Introduction Consolidated results and general trends Individual Target results Comparative results for detectors: 10mm steel ball in cubic holder Comparative results to used targets: rendered safe mines Comparative results to used targets: mine simulants Individual Detector Descriptions and Results Introduction to the individual detector results CEIA S.p.A., metal detector MIL-D Ebinger GmbH, metal detector EBEX 421GC Ebinger GmbH, metal detector EBEX 420 HS Guartel Ltd., metal detector MD Inst. Dr. Foerster GmbH and Co. KG, metal detector Minex 2FD Inst. Dr. Foerster GmbH and Co. KG, metal detector Minex 2FD Minelab Pty. Ltd., metal detector F1A Minelab Pty. Ltd., metal detector F Schiebel Elektronische Geräte GmbH, metal detector ATMID Shanghai Research Institute of Microwave Technology, M90 metal detector Vallon GmbH, Detector VMH Lessons learned Conclusions Recommendations regarding detector use
4 12 Annexes ANNEX A Additional Training Exercises ANNEX B - Mines and simulated mines ANNEX C - Soils and graph legend fold out ANNEX D - Fold out page 2: Mines ANNEX E - Fold out page 3: Simulants ANNEX F - Fold out page 4: Spheres/Balls References NOTE: Annex C is a fold out page- it provides complementary information which can facilitate the interpretation of graphs and tables. 4
5 List of Tables Table 4-1 Detector features apparent to the users 15 Table 4-2 Working principles of the detectors 17 Table 5-1 Test Matrix 20 Table 6-1 Susceptibility measurements in lanes 1 to 7 29 Table 8-1 MIL D1 & Mine targets: percent change of sensitivity with respect to L1 maximum in-air value. 45 Table 8-2 MIL D1 & Simulants: percent change of sensitivity with respect to L1 maximum in-air value 46 Table 8-3 Technical data CEIA MIL D1 48 Table 8-4 EBEX 421GC & mine targets: percent change of sensitivity with respect to L1 maximum in-air value 51 Table 8-5 EBEX 421GC & Simulants: percent change of sensitivity with respect to L1 maximum in-air value 51 Table 8-6 Technical data EBEX 421 GC 53 Table 8-7 EBEX 420 HS & mine targets: percent change of sensitivity with respect to L1 maximum in-air value 56 Table 8-8 EBEX 420 HS & Simulants: percent change of sensitivity with respect to L1 maximum in-air value 57 Table 8-9 Technical data EBEX 420 HS 59 Table 8-10 MD8+ & mine targets: percent change of sensitivity with respect to L1 maximum in-air value 61 Table 8-11 MD8+ & Simulants: percent change of sensitivity with respect to L1 maximum in-air value 62 Table 8-12 Technical data Guartel MD8+ 64 Table 8-13 MINEX 2FD & mine targets: percent change of sensitivity with respect to L1 maximum in-air value 67 Table 8-14 MINEX 2FD & Simulants: percent change of sensitivity with respect to L1 maximum in-air value 68 Table 8-15 MINEX 2FD & mine targets: percent change of sensitivity with respect to L1 maximum in-air value 70 Table 8-16 MINEX 2FD & Simulants: percent change of sensitivity with respect to L1 maximum in-air value 71 Table 8-17 Technical data MINEX 2FD and MINEX 2FD Table 8-18 Minelab F1A4 & mine targets: percent change of sensitivity with respect to L1 maximum in-air value 76 Table 8-19 Minelab F1A4 & Simulants: percent change of sensitivity with respect to L1 maximum in-air value 77 Table 8-20 Technical data Minelab Metal detector F1A4 78 Table 8-21 Minelab F3 & mine targets: percent change of sensitivity with respect to L1 maximum in-air value 81 Table 8-22 Minelab F3 & Simulants: percent change of sensitivity with respect to L1 maximum in-air value 81 Table 8-23 Technical data Minelab F3 83 Table 8-24 ATMID & mine targets: percent change of sensitivity with respect to L1 maximum in-air value 86 Table 8-25 ATMID & Simulants: percent change of sensitivity with respect to L1 maximum in-air value 86 Table 8-26 Technical data ATMID 88 Table 8-27 M90 & mine targets: percent change of sensitivity with respect to L1 maximum in-air value 91 Table 8-28 M90 & Simulants: percent change of sensitivity with respect to L1 maximum in-air value 91 Table 8-29 Technical Data SHRIMT M90 93 Table 8-30 VMH3 & VMH3 (M) & mine targets: percent change of sensitivity with respect to L1 maximum in-air value 96 Table 8-31 VMH3 & VMH3 (M) & Simulants: percent change of sensitivity with respect to L1 maximum in-air value 97 Table 8-32 Technical data VMH3 and VMH3(M) 100 5
6 List of Figures Figure 4-2 Mozambique (source: UN) 13 Figure 4-3 Location of Trial Site (source: Expedia) 13 Figure 5-1 Detection height as a function of size for steel balls 19 Figure 5-4 Establishment of burial depth and lane lay out (not to scale) 21 Figure 6-1 Two calibration methods for ground reference height measurement using a Schiebel 28 Figure 6-3 Magnetic susceptibilityand ground reference height in the seven test lanes 30 Figure 6-4 Expected reaction of detectors to ground 30 Figure 7-1 Detectors normalised sensitivity to the average sensitivity of all detectors for all targets in Lane 1 31 Figure 7-2 Detectors sensitivity comparison for the 10mm ball across the test lanes. 34 Figure 7-3 Detectors sensitivity comparison for the PMN across the test lanes 35 Figure 7-4 Detectors sensitivity comparison for the PMN2 across the test lanes. 36 Figure 7-5 Detectors sensitivity comparison for the Gyata-64 across the test lanes. 37 Figure 7-6 Detectors sensitivity comparison for the ITOP Mo across the test lanes. 38 Figure 7-7 Detectors sensitivity comparison for the ITOP Ko across the test lanes 39 Figure 7-8 Detectors sensitivity comparison for the ITOP Io across the test lanes 40 Figure 7-9 Detector Comparison per target and lanes: Simulant AP T72 41 Figure 7-10 Detector Comparison per target and lanes: Simulant AP R2M1, R2M2; AT No 8 RSA 42 Figure 8-2 In-air and in-soil sensitivity for mine targets 44 Figure 8-3 In-air and in-soil sensitivity for simulants 45 Figure 8-4 In-air and in-soil sensitivity for balls 46 Figure 8-6 In-air and in-soil sensitivity for mine targets 50 Figure 8-7 In-air and in-soil sensitivity for simulants 51 Figure 8-8 In-air and in-soil sensitivity for balls 52 Figure 8-10 In-air and in-soil sensitivity for mine targets 55 Figure 8-11 In-air and in-soil sensitivity for simulants 56 Figure 8-12 In-air and in-soil sensitivity for balls 57 Figure 8-14 In-air and in-soil sensitivity for mine targets 61 Figure 8-15 In-air and in-soil sensitivity for simulants 62 Figure 8-16 In-air and in-soil sensitivity for balls 63 Figure 8-18 In-air and in-soil sensitivity for mine targets 66 Figure 8-19 In-air and in-soil sensitivity for simulants 67 Figure 8-20 In-air and in-soil sensitivity for balls 68 Figure 8-21 MINEX in-air and in-soil sensitivity for mine targets 70 Figure 8-22 MINEX in-air and in-soil sensitivity for simulants 71 Figure 8-23 MINEX in-air and in-soil sensitivity for balls 72 Figure 8-25 In-air and in-soil sensitivity for mine targets 75 Figure 8-26 In-air and in-soil sensitivity for simulants 76 Figure 8-27 In-air and in-soil sensitivity for balls 77 Figure 8-29 In-air and in-soil sensitivity for mine targets 80 Figure 8-30 In-air and in-soil sensitivity for simulants 81 Figure 8-31 In-air and in-soil sensitivity for balls 82 Figure 8-33 In-air and in-soil sensitivity for mine targets 85 Figure 8-34 In-air and in-soil sensitivity for simulants 86 Figure 8-35 In-air and in-soil sensitivity for balls 87 Figure 8-37 In-air and in-soil sensitivity for mine targets 90 Figure 8-38 In-air and in-soil sensitivity for simulants 91 Figure 8-39 In-air and in-soil sensitivity for balls 92 Figure 8-41 In-air and in-soil sensitivity for mine targets 95 Figure 8-42 In-air and in-soil sensitivity for simulants 97 Figure 8-43 In-air and in-soil sensitivity for balls 98 Figure 12-3: Pinpointing with simple search head (a), and double-d (b) 106 6
7 List of Plates Plate 4-1 Moamba ADP training facility with seven prepared lanes 12 Plate 5-2 Targets used during the trial 19 Plate 5-3 Lane 6 with target rows and markers 21 Plate 5-5 Burial of the PMN mine 22 Plate 5-6 Preparation of the lane for ITOP targets 22 Plate 5-7 Filling of the hole and depth measurement of the target 23 Plate 5-8 In-air measurement jig 24 Plate 6-2 Bartington MS2 configuration for sample (MS2B-left) and field measurements (MS2D-right) 29 Plate 8-1 MIL-D1 during the trial 44 Plate 8-5 Ebex 421GC during the trial 50 Plate 8-9 EBEX 420 HS detector during the trial 55 Plate 8-13 Metal detector MD8+ during trial 61 Plate FD during the trial 66 Plate8-24 F1A4 during the trial 75 Plate 8-28 Detector F3 during the trial 80 Plate 8-32 ATMID during the trial 85 Plate 8-36 M90 during the trial 90 Plate 8-40 VMH3 and VMH3(M) during the trial 95 Plate 12-1 Determination of the cone s width / depth 105 Plate 12-2 The same but with a dynamic detector 105 7
8 Acknowledgements We would warmly acknowledge the collaboration of Mr Florencio Chongo, Mr Mohammad Kadar, and the ADP staff in this project. We would like to thank the following organisations for their help in making this trial possible: - Mr Gamiliel Munguambe and the staff of IND, and J.V. Desminagem for their practical participation, - Mozambique Customs for authorizing temporary import of the equipment, - Mrs Maria Del Mar Polo and Mr Bachiro Liasse at the EC Delegation for help with logistics. - present and former colleagues, in particular F. Littman and T.J. Bloodworth, who planned the project. This project was funded by EuropeAid Cooperation Office (AidCo) under Administrative Arrangement MAP/2004/ This second edition contains corrections to Table 8.1 and Table 8.31 and clarified text on on page 98. Many thanks to Dr Yann Yvinec of the Royal Military Academy of Belgium whose sharp eye detected the errors. 8
9 List of abbreviations ADP AP AT BAM CEN CSIR CWA EC FRELIMO GICHD GC GRH IND IPPTC ITEP ITOP JRC L1 MD PARPA RENAMO RSA SHRIMT STEMD Accelerated Demining Programme Anti-Personnel Mine Anti-Tank Mine Bundesanstalt für Materialforschung und -prüfung Comité Européen de Normalisation Council of Scientific and Industrial Research CEN Workshop Agreement European Commission Frente de Libertação de Moçambique Geneva International Centre for Humanitarian Demining Ground compensation Ground Reference Height Instituto Nacional de Desminagem International Pilot Project for Technology Co-operation International Test and Evaluation Program International Test Operation Procedures Joint Research Centre Lane 1, or other numbers indicate the number of test lane Metal detector Plano de Acção para a Redução da Pobreza Absoluta Resistência Nacional Moçambicana Republic of South Africa Shanghai Research Institute of Microwave Technology Systematic Test & Evaluation of Metal Detectors 9
10 Systematic Test & Evaluation of Metal Detectors (STEMD) Interim Report Field Trials Mozambique 1 Introduction This report describes the second field trial of the STEMD project. The concept of STEMD is to conduct tests which are relevant to specific mine and UXO problems in different regions of the world. The project consists of laboratory tests, field trials and training of interested parties in testing methods. Lab tests are being carried out in the laboratories of the JRC Ispra. A trial in Southern Africa was planned from the outset. Mozambique was favoured because of previous experience and because of the existence of a dedicated training site with different types of soils and the availability of local test targets. Some basic information from the STEMD Interim Report Field Trial Laos will be repeated so that this present report may be understood independently. For interested readers the Lao report is available at: of the JRC, and ; homepages for test and evaluation in the area of humanitarian demining equipment. 2 Background 2.1 Systematic Test and Evaluation of Metal Detectors A key milestone in metal detector evaluation was the International Pilot Project for Technology Co-operation (IPPTC) which was conducted from 1998 to 2000, producing a "consumer report" of the detectors available at the time. The experiences of IPPTC and of those of other trials with international importance were subsequently integrated into CEN Workshop Agreement 14747:2003, henceforth referred to as CWA. This Agreement standardises test methods for both laboratory and field use, and summarises the practical experience and theoretical knowledge of a large number of deminers, engineers, managers, and manufacturers. Between May and December 2003 an exercise to validate the CWA field trial methodology was conducted by the German Federal Materials Agency (BAM) with the collaboration of the JRC, the German Bundeswehr and the Croatian Mine Action Centre (CROMAC) (Mueller et al 2004). In addition to confirming the basic validity of the CWA methods, this project introduced improved techniques for test matrix design, statistical analysis and human-factor analysis which we adopted in the present trial. STEMD can be regarded as a trial making use of the experience distilled into the CWA and giving an overview of the state of art of the current metal detector fleet. It provides scientifically sound data for the mine action centres and demining organisations and training in the use of CWA. It also provides the donors with information that allows a better understanding of detector performance under different field conditions. The collected data will be added to the catalogue on metal detectors published by GICHD. 10
11 2.2 The mine problem in Mozambique Armed conflict between Portugal & FRELIMO in the 1960s was followed by conflict between the FRELIMO government and RENAMO from1974 until During this period, AT and AP mines were widely used. Estimates range from 0.5 million to 2 million. Demining activities in Mozambique developed as follows: 1992: ceasefire signed : UNOMOZ established first demining capacity. Commercial and international NGO s also started work. 1995: UN Accelerated Demining Programme (UNADP) was created under the umbrella of UNDP. Later renamed ADP, in Portuguese Programa Acelerado de Desminagem (PAD). 1996: first national mine action centre was established, Comissão Nacional de Desminagem (CND) set up, later renamed Instituto Nacional de Desminagem (IND) 1999: First Meeting of the State Parties to the Ottawa Convention, held in Maputo in May The National Mine Action Strategy, developed by the Government of Mozambique within the current context, aims at the following main objectives and targets: Reduce the risk of damage or death caused by anti-personnel mines; Contribute to PARPA, the government's strategy for poverty reduction in Mozambique; Clear all areas of large and medium mine impact; Destroy all unexploded ordnance; Destroy all stocks of landmines; Inspect and signpost the remaining low impact areas; and Set up a civic education programme on the danger posed by mines. ADP is a nationally executed operational program covering the three provinces of Maputo, Gaza and Inhambane. These efforts are complemented by those of international humanitarian demining non-governmental organizations, which play an extremely important role. These are: Handicap International, operating in the provinces of Inhambane, Sofala and Manica; Norwegian People s Aid (NPA), operating in the central provinces of Tete, Manica, and Sofala; The Halo Trust, concentrating its operations in the northern provinces of Zambezia, Nampula, Niassa, and Cabo Delgado. The above-mentioned demining organisations execute demining operations all the year. There has also been, and continues to be, a significant contribution from national and private demining companies, via tenders for infrastructure and other specific investment projects. The established Mine Action Portfolio country team contributes to the National Mine Action Strategy by engaging in the following activities: mine-risk education, victim assistance, demining, and capacity building. One of the more important activities recently agreed upon by demining operators is the need to intensify technical surveys as a means of measuring current contamination levels and establishing a national non-governmental organization to focus on rural development needs. These activities are aligned with the five-year National Mine Action Plan (NMAP) 2002 to 2006 and with the National Strategy on Mine Action. The country team will assist the government in working in these specific areas. 11

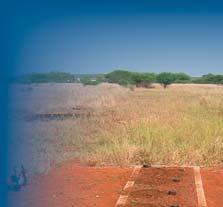
12 3 Purpose and Objectives of the Trial The purpose of the trials in Mozambique was to: Assess recent commercial off-the-shelf detectors believed to be appropriate to Mozambique and for humanitarian demining generally, and make the data available for the humanitarian demining community. Objectives of the trials: Compare performance of detectors in different types of Mozambican soils. Measure sensitivity of detectors to typical local targets of interest and standard targets Train local staff in the CWA Collect site information for ITEP 4 Trial preparation and selection of detectors 4.1 Long-term preparation JRC conducted a small market investigation of test facilities in Mozambique which confirmed our earlier belief that the Accelerated Demining Programme (ADP) site in Moamba was the best choice for the purposes of this trial. Plate 4-1 Moamba ADP training facility with seven prepared lanes 12


13 In this trial we were able to take advantage of 7 prepared lanes used for training purposes by ADP. Lane 1 contains builder s sand from a sandpit about 30km north of Maputo. Lanes 2-6 contain five different soil types from the zone around Moamba, Lane 7 contains soil from Namaacha, adjacent to the Swaziland border. Further details of the soils are given in Chapter 6 (see also ANNEX C). The main support to carry out the trial was given by ADP, which provided not only its training facility but also the detector operators. The principle of integrating national and international working demining organisations into the STEMD project helped again to carry out the trial. The National Demining Institute of Mozambique as well as a national demining organisation J.V. Desminagem provided personnel for supervising and the collection of trial data. CSIR agreed to support the trials and sent one geophysicist (Mr Christo Craill). All equipment was shipped to ADP in early February. Special permission was obtained by the EC delegation in Maputo from the Mozambique Customs for a temporary import. JRC is in regular contact with manufacturers, two of which requested just before the trials that two of their new models be included. Figure 4-2 Mozambique (source: UN) Location of the trial site in Mozambique Figure 4-3 Location of Trial Site (source: Expedia) 4.2 Personnel and Resources Data Gathering Team, D. Guelle (also trial team leader), M. Pike both JRC; Christo Craill CSIR (Mr. Craill is attached to the Defence, Peace, Safety and Security Research Unit within the CSIR on a contract basis.) Local personnel o The main team of ADP included Mohamed Kadar (Quality Assurance Officer ADP), seven detector operators and one driver. Due to internal problems strike and illness the full complement of personnel was available only for two of the ten trial days. o IND provided four lane supervisors, and J.V. Desminagem (national NGO) another two supervisors. 13
14 The ADP and the J.V. Desminagem teams included experienced demining operators that were familiar with most of the detectors so preparation and instruction in the use of the different detectors could be reduced to a minimum. 4.3 Final field trial preparation and training seminar An initial equipment check was made in the store after the arrival of JRC staff in the stores and no damage was found. All the equipment was moved to the test site and measurements of soil moisture, temperature and magnetic susceptibility were made. The next two days were devoted to a training seminar where the JRC staff explained the content and use of CWA (see ANNEX A). Twenty five participants received practical training for tests which can be carried out under field conditions: in-air and in-soil detection depth measurement, pinpointing and the establishment of sensitivity profile (footprint) for different targets. The emphasis was on the practical application of these tests and their importance to field operations. The latter two tests were not directly applied in the trial, but the knowledge of detector handling gained by the operators in learning them was useful in the trial itself. Immediately after the seminar practical exercises, instruction of the participants on-site at the test lanes took place, with explanations of the role and tasks of the lane supervisors and detector operators. Finally, those staff participating in the trial were instructed in the specific plans for lane preparation, measurement and recording of data. The following day, the first set of targets was buried in the lanes. 4.4 Detector selection before the trial Manufacturers were informed about the trial in Mozambique in July 2004, when the original invitations for the Laos trial were sent out. The companies contacted at that time were: Adams Electronics International Ltd CEIA S.p.A. Ebinger GmbH Guartel Ltd. Inst. Dr. Foerster GmbH and Co. KG Minelab Pty. Ltd. Schiebel Elektronische Geräte GmbH Vallon GmbH. To this list, we added one more company: Shanghai Research Institute of Microwave Technology, whose M90 detector we had subsequently learned about from UNMAS, and procured. The criteria for inclusion were less strict than for the field trial in Laos since we were able to test 12 models instead of 8, because we did not conduct blind reliability testing, which is the most time-consuming test. We therefore did include the Guartel MD8+ and Ebinger 420 HS solar. The Adams AX777 was found in ergonomic tests in Ispra to be less robust, especially with regard to the electrical contact to the battery. We did not consider it to be suitable for the rugged field conditions in Mozambique and therefore did not include it. No large head UXO-type 14
15 detector were used in this trial, because UXO items are a less serious problem in humanitarian demining operations in Mozambique, where the main problem is with antipersonnel landmines. Subsequently, two manufacturers requested that new models that were available should be included in Mozambique. One manufacturer (Vallon GmbH) shipped copies of a model with updated electronics to Mozambique. Another manufacturer (Inst. Dr Foerster) also conducted two days of testing at Ispra with their new model. The final list of tested equipment was as follows: CEIA S.p.A. MIL-D1 Ebinger GmbH Ebex 421 GC & Ebex 420 H-Solar Guartel Ltd. MD 8+ Inst. Dr. Foerster GmbH and Co. KG MINEX 2FD & MINEX 2FD Minelab Pty. Ltd. F1A4 & F3 Schiebel Elektronische Geräte GmbH - ATMID Shanghai Research Institute of Microwave Technology M90 Vallon GmbH VMH3 & VMH3 (M) Technical details of the detectors tested Table 4-1 Detector features apparent to the users Principal Features Set-up Detectors Manufacturer Static Mode Coil Sensitivity adjustment Dynamic Single Double-D Fixed Stepped Continuous Automatic Ground compensation Manual None Software access YES/NO Signal 4 A/L/V MIL-D1 CEIA X - - X - - X X - - Y A EBEX 421GC Ebinger - X X X - X - - A EBEX 420HS Ebinger - X X X - - X - A MD8+ Guartel - X X X - A/L Minex 2FD Foerster X - - X X A Minex 2FD Foerster X - - X X - - Y A F1A4 Minelab - X X - X - - X - - Y A F3 Minelab X - X - X X - - Y A ATMID Schiebel - X X X X A M90 SHRIMT - X X X - - X - A VMH3 Vallon - X X X 3 X - - Y A/L/V VMH3 (M) Vallon - X X X 3 X - - Y A/L/V 1 Double coil (separate sending and receiving coils) 2 The sensitivity level is normally fixed but can be changed (see detailed description in Section 8). 3 A large number of digitized levels are available, so the adjustment is effectively continuous. 4 The signal may be delivered to the operator via audio signal (A), LED/display (L), vibration (V) of the handle. 1 The software-modificated VMH3 does not have an additional name the (M) was added for differenciation by the authors. 15
16 Table 4-1 lists all the detectors that were tested and the features which are most immediately important in use. The mode may be either static, if the detector continues to emit a sound when it is held stationary over a metal target, or dynamic if it must be moved over the target to signal. Some detectors have the receive coil divided into two halves, the double-d design, which have a zero line in the middle where the signal stops or changes, to enhance pinpointing. The manner and capability of detection and pinpointing depend on both these factors. The deminer should be aware of them and they should be emphasised during training. A detector with a double-d coil behaves very differently from one with a simple circular coil and it is dangerous to confuse the two, because the shapes of the sensitive areas are different. Similarly, it is important to understand that a dynamic mode detector can be silent, even over a metal object, when it is not moved. Sensitivity adjustment in some detectors is made with a switch with a limited number of positions, such as low, medium and high, with others it is made with a continuously variable knob and others have fixed sensitivity. Setting of the soil compensation, where the detector has it, is usually made by invoking an automatic procedure which allows the detector to learn the soil properties. The Ebinger 421GC is the only detector tested here which has a completely manual adjustment. The CEIA Mil D-1 makes its soil compensation adjustment automatically, but the manual-adjusted sensitivity setting affects it. The detailed procedures are different for each detector and it is important to follow precisely the instructions of the manufacturer for the model in question. Some of the most recent detectors allow the user access to the software via a communications port, for example it may be possible to download updates from the manufacturer, or make special changes to adapt the detector to particular conditions on the operational site. All detectors have an audio indication when metal is detected and this is generally considered superior to visual indication to avoid distracting the operator from looking at the ground. The VMH3 and MD8+ do provide also visual indication by LEDs on the handle. Vallon have also recently introduced a vibrator in the handle as a tertiary indication. We include here some technical details concerning the working principles of the devices, which are not normally apparent to the user but which are important for engineers. The principle of electromagnetic induction is common to all metal-detectors but there are many variations in the way it is used. The participating detectors represent a broad spectrum of different practical technical solutions 2 (Guelle, Smith, Lewis and Bloodworth) (Table 4-2). Briefly, the wave shape type refers to whether the magnetic field is in the form of a smoothly varying wave or brief pulses. The polarity type refers to whether the magnetic field is always in one direction or reverses direction on each pulse or wave, to avoid initiating magnetic influence fuzes. The domain type refers to whether the receiving circuit measures the returned signal at specific time points on the wave or extracts and measures sinus wave signals of specific frequencies. Some detectors have separate coils for sending the signal and receiving it, others use just one coil for both. 2 A discription of the technical solutions and their meaning can be found in more detail in the Metal Detector Handbook - (see references). 16
17 Table 4-2 Working principles of the detectors Technical Principles & Design Detectors Manufacturer Wave shape Polarity Domain Send/receive Coil Pulse Continuous wave Bipolare MIL-D1 CEIA - X X - - X - X EBEX 421 GC Ebinger X - X - X - X - EBEX 420HS Ebinger - X X - - X - X MD8+ Guartel X - - X X - - X Minex 2FD Foerster - X X - - X - X Minex 2FD Foerster - X X - - X - X F1A4 Minelab X - - X X - X - F3 Minelab X - X - X - X - ATMID Schiebel - X X - - X - X M90 SHRIMT - X X - X X?? VMH3 Vallon X - X - X - X - VMH3 (M) Vallon X - X - X - X - Unipolar Time Frequency Single Separate 17
18 5 Methodology and Procedures of the Trial 5.1 Selection of CWA tests In this trial, we focused on in-air and in soil detector sensitivity, in a wide range of soil types. As such, the detection reliability tests of CWA 8.5, which are statistical blind trials, were not considered best adapted. Instead, we used the in-soil deterministic tests of CWA 8.4 and the inair tests of CWA 6.5 and 6.6. The main advantage of this approach is that it permitted the testing of a greater number of detectors and soil types in the time available, as there is no critical need for many repetitions. The number of operators required was also fewer. Nevertheless, we did take the precaution of having more than one operator perform each test and having each operator work in two lanes. We planned a test matrix in advance to organise the rotation of the detectors through the lanes. The trial site conditions allowed the simultaneous use of seven detectors in seven different soil conditions against thirteen targets at nine different depths. This amount of data will give an overview about the different factors influencing the detector performance. These include the technical solutions of the manufacturer, the metal object, shape and position, and distance of the target and finally the ground properties, in particular magnetic susceptibility 3. Some light is also shed on human factors, in spite of all the tests being intended as deterministic, rather than statistical, as will be discussed below. The final selection of tests was as follows: CWA Test 8.4 Fixed depth detection tests in soil CWA Test 6.5 Minimum detectable target as a function of height CWA Test 6.6 Detection capability for specific targets in air The in-air testing was conducted with the detectors set at the sensitivities established for each soil type, excluding the first lane where the detector was set up in air to maximum sensitivity. Ideally, we would have liked to perform the in-air tests immediately before or after the in-soil tests, without changing the set-up, but due to the lack of personnel mentioned above, we were obliged to carry out the in-air tests all together, after the in-soil tests had finished. Test 6.6 conducted with the steel balls of five diameters enables simple detection capability graphs to be plotted (see below). When this test is conducted in air with a complete set of eight or more diameters it becomes Test Minimum detectable target as a function of height. For reasons of time, we only used five diameters in these field trials but full testing compliant with CWA has been conducted in the laboratory at Ispra. 3 Magnetic susceptibility is the degree to which a material can be magnetized in an external magnetic field. If the ratio of the magnetization is expressed per unit volume, volume susceptibility is defined as = M / H, where M is the volume magnetization induced in a material of susceptibility by the applied external field H. 18
 Type 72 and Gyata AP simulants, locally used and")
19 Detectionheight mm det x ball diameter mm Figure 5-1 Detection height as a function of size for steel balls 5.2 Selection of targets The selected targets included: Plate 5-2 Targets used during the trial PMN2 and PMN, mines with neutralized fuzes (left) Type 72 and Gyata AP simulants, locally used and produced R2M2 fuze mounted in 60mm diameter clear plastic holders 4 ITOP fuze inserts Mo, Ko, Io, 100Cr6 chrome steel balls, 5,7,10,12 and 15mm diameter, placed in wooden containers. Experiences from earlier tests have shown that there are practical limitations to the accuracy of targets used in tests. It is difficult to find simulants for minimum metal mines if the original metal part is not available; the less metal is present the more difficult it is to find a faithful simulant, common to all detectors. It should also be borne in mind that mines left in the ground will change over time, generally becoming more difficult to detect e.g. as steel parts rust away, so the reality that is being simulated itself is not fixed. We took the following approach. The original PMN and PMN2 mines were rendered safe by taking out the percussion caps, which are a small part of the total metal content for these types. All other metal parts were left as originally produced. o The safety pins of both mines were taken off, as would be the case for a laid mine. The Gyata and Type 72 simulants were made by ADP for an earlier trial conducted by Mr A V Smith in Autumn These simulants were designed to give equivalent response to the real mines for the Minelab F1A4, but it is possible that they will not be as accurate simulants for other detectors. The R2M2 fuzes are originals, R2M1 and RSA No.8 antitank mine use the same fuze. 4 An essentially identical fuse is used in the R2M1 antipersonnel mine and the RSA No.8 antitank mine. 19
20 The ITOP simulant fuzes were specifically designed and tested to have electromagnetic properties closely resembling those of real mines. The ones we used here correspond to the following mines: o Io = M14, PMA3, VS-1.6 o Ko = Type 72A, TMA-4, M19, PMA3 o Mo = VS-2.2, PT Mi-Ba-III For more details about the mines and simulated mines see ANNEX B The steel balls were used as neutral targets for comparison of test results done in the lab. Note that the balls were always used in the cubic wooden holders, so that each one displaces the same volume of soil regardless of the ball diameter. 5.3 Test matrix The test included: 7 operators 12 detector types, 2 copies of each type All detector models were used by each operator Each operator worked in two lanes 7 lanes on the site 13 types of target (5 steel balls, 5 mines and mine simulants, 3 ITOP fuze inserts) 2 9 targets per lane (1 9 for PMN) Table 5-1 Test Matrix Detectors Lane1 Lane 2 Lane3 Lane 4 Lane 5 Lane 6 Lane 7 Operators: A B C D E F G G A B C D E F Table 5-1 shows the manner in which the detectors are cycled through all the lanes, and used by different operators. For example, operator A starts with detector 1 in lane 1, after he has finished, operator G from lane 7 takes it and repeats the measurement in lane 1. Meanwhile, operator A has taken over from operator B with detector 2 in Lane 2 etc. When detectors 1-7 have been tested by two operators in one Lane, detectors 1-6 are moved one lane along, detector 7 is taken out, detector 8 is moved into Lane 1 and the process is repeated. The sequence continues until all detectors have been tested in all lanes. 20
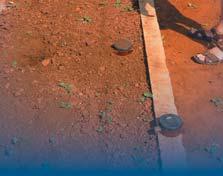
 Plate 5-3 shows a photograph of lane 5. Two rows of targets were placed in every lane, excluding the lane which had the original inerted PMN mines, which had only one row of targets.")

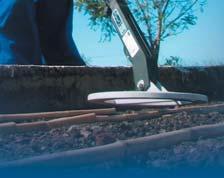
21 5.4 Target layout in lanes Upper reference depth Lower reference depth Uniform increments Plate 5-3 Lane 6 with target rows and markers Figure 5-4 Establishment of burial depth and lane lay out (not to scale) Plate 5-3 shows a photograph of lane 5. Two rows of targets were placed in every lane, excluding the lane which had the original inerted PMN mines, which had only one row of targets. Where there were two rows, the pattern of positions was staggered between them as in Figure , to increase the separation between targets (see also Plates 5-5 and 5-6). Positions for burial of the mines were indicated with small wooden cubes. Thick dried grass stems, similar to bamboo, were laid down to prevent the deminers moving the cubes and to help maintain constant height. At the start of the lane, a 1m by 1m area was kept free of targets, for adjusting the detector to the ground if necessary. Nine depths were selected, with uniform increments, using the in-air performance of five of the detectors as a guide, as follows. A lower (shallower) reference depth was defined by taking the detector which appeared to have the lowest sensitivity to the target, setting it up to the soil in the lane and establishing the detection height in air. An upper (deeper) reference depth was defined in a similar way, using four detectors which appeared to have highest sensitivity to that target. The burial depths were chosen so that there were four increments between the upper and lower reference depths and two increments below and above (Figure 5-4). 21


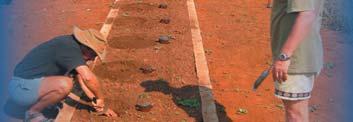
22 5.5 Daily lane preparation Plate 5-5 Burial of the PMN mine because of its large detection halo, only one line was used Plate 5-6 Preparation of the lane for ITOP targets The daily lane preparation started with the recovery of the buried targets used in the previous session, excluding the first day when a check of the lanes for metal pieces was done instead. Once the targets had been recovered and checked, the burial depths for the new session were established using in-air measurements as described in Section 5.4. The increments varied between 10mm to 35mm depending on the differences of detection height found in the in-air measurements. The targets were then moved to the next lane and from L7 to L1. The lines for the placement of the targets were drawn, the locations for burying the targets were marked and holes made to the required depths (see Figure 5-5 and 5-6). In stony ground, the corer (Figure 5-6) was used to loosen the soil. In the sand lanes, this was necessary only the first time the targets were buried so, to keep the disturbance of the ground to a minimum, in the sand lanes, the same holes were used again. No attempt was made to compact the soil in any lanes after placing the targets. The soil was put back into the hole and made even with the surrounding surface. This form of rotation was repeated every day. The initial idea was at least to have the night for settlement of ground but personnel numbers and time needed in the first days did not allow us to do so. It was important to mark exactly which targets were placed in each lane to avoid confusion. A precision in planting depth of ±5mm was achieved by compacting the ground below the target, using rulers vertically on top of the target and carefully filling the hole with the removed ground (Plates 5-7). 22


23 Plate 5-7 Filling of the hole and depth measurement of the target 5.6 Detection Depths in Soils The maximum detection depth in soil was established by two deminers with both detectors to reduce individual influence on the result. As the first step, both available detectors were set up to maximum sensitivity in air. If the detector reacted to the ground, ground compensation was carried out or, for detectors without compensation, the sensitivity was reduced to a level that the detector could be used without reaction to the soil. In some cases, those detectors had to be lifted to a height where the ground signal stopped but a detection of the targets was still possible. (This method of using a detector is possible but it is not satisfactory, because the risk that a ground signal will be registered as a target signal is very high. The main reason for this is that it is very difficult to maintain a constant height above the ground, beyond 30-50mm.) The height above the ground at which it was possible to use the detector was recorded for every lane. Detectors with ground compensation (GC) were set up to the ground conditions if they reacted with a signal when moving them close to the ground. The detector operator started from the lowest burial depth and proceeded to the next level. When the detector did not 5 times confirm a signal above the target, the previous depth was registered as max detection depth. Nevertheless, the operator tried the next two deeper levels for confirmation that no further detection was possible. Where the supervisor was not sure about the detection signal, he instructed the operator to make a comparison with the signal from the previous depth. Only when both operator and supervisor, agreed that the signal had been confirmed 5-times was it accepted. Pinpointing the signal was also used as an additional confirmation in certain cases. If the operator and supervisor were still unsure about a detection, or if other complications, such as questions regarding the setup of the detector arose, they consulted the senior staff. 5.7 In Air Detection Height detector setup to soil As above mentioned, the in-air maximum detection height was established with all detectors after the in-soil measurements were finished. For measuring this the JRC-jigs were used and 23

24 placed on available plastic cones to have enough height for excluding ground interference on the in-air measurements (Plate 5-8). Plate 5-8 In-air measurement jig The procedure was that the detector was set up to the lane in the same way as for in-soil measurements. The detector was placed on the top of the jig after a rough measurement of the target distance in air was executed and height slightly less than this was used as the start for the measurements. If a clear signal was produced by the detector, the height (distance) was increased until the last level where the detector could produce a clear signal five times in a row. For double-d search heads it was accepted that this signal was produced under only one of the Ds. In some cases, when there was a problem exactly to define the maximum distance, the measurement was repeated, this time raising the platform in increments instead of lowering it. The distance increments used were to recorded to ±5mm precision, in accordance with CWA, the jig itself is graduated in millimetres. The detectors without GC were prepared in the same way as they were for the in-soil detection measurements. For non-gc detectors which were used in soil at a significant additional height above the ground to eliminate the soil signal, this height was subtracted from the in air measurement. 5.8 Limitations of detector sensitivity measurements in the field Any measurement made in the field is likely to be less controlled than a laboratory measurement, as is recognised in the CWA. We describe here some factors which could have led to signals being recorded incorrectly as detections, even after all the precautions described above had been taken. Depending on the soil conditions and the efficiency of the ground compensation, it may be possible to eliminate completely the soil noise, so the only reaction is to metal. Some of the detectors still have background soil noise either continuously or in reaction to inhomogeneities in the ground, i.e. parts with different electromagnetic properties to the surrounding area or hot stones in a neutral environment or the other way around. Some detectors may give background noise due to drift of the electronics or the presence of electromagnetic fields from external sources. A noise cancel function is provided in most of the detectors, typically activated by holding the detector in the air and pushing a button. The detectors vary in the sophistication of their noise cancellation: from simple zeroing to complex intelligent processing. Particularly for the detectors with less effective noise cancellation, there is always a risk of electromagnetic noise being falsely declared as a detection. It should also be remembered that ground compensation circuits may be subject to electronic drift. To a certain extent, the deminer is able to recognise background noise and distinguish it from a true detection. But he is normally not able to distinguish between a signal from a test target and one from other sources. If a specific source of false alarms is located near to a test target, its signals could influence the result. We cannot be sure that every false alarm was recognised as such and investigated during the trial. Some obvious contradictions in the results may, in our opinion, only be explained in this way. In particular, we highlight in the results cases where there are major discrepancies between the in-air and in-soil data. 24
25 Some of the detectors could not be used on high sensitivity because the background noise overwhelmed the signal strength of any target. Where this occurred, it is noted in the individual assessment of the detectors in Section 8. An obvious possible source of error is incorrect adjustment or handling of the detector. Although precautions of training and supervision were taken to avoid these errors, we cannot be absolutely certain that none occurred. In these tests, unfortunately, some reduction of the planned manpower occurred, so that the senior staff were obliged to carry out certain operations themselves, which meant that they had less time available to investigate problematic cases in situ. 5.9 Estimate of uncertainty When trial data is used to judge whether or not a detector is able to achieve the sensitivity required for a particular task, or to compare the merits of different detectors, it is important to allow for the experimental uncertainties which are inevitably present. If two results differ by an amount less than the calculated uncertainty they should be regarded as essentially indistinguishable. We attempt here to quantify the known contributions of uncertainty in our measurements and to explain how we combined the estimates to arrive at overall figures. In-soil measurements Operator subjectivity, detector dependent : o = ± 10mm typical Resolution, target and sensitivity dependent : r = ± 5mm to ± 20mm Variation in height above soil surface: h= ± 5mm Burial depth : b= ± 5mm The operator subjectivity is reduced by 2 because test repeated by two operators. Total = ± ( ½ o 2 + r 2 + h 2 + b 2 ) For the steel balls, was about ±14mm For the mines, it was on average ±15 mm and a maximum of 22mm In air-measurements Operator subjectivity, detector dependent : o = ± 10mm typical Resolution : r = ± 5mm always 1 operator always Total = ± ( o 2 + r 2 ) = ± (1.25) cm =±11mm Uncertainty in percentage change Some of the results below are expressed as percentage changes from a reference measurement. The uncertainty in these values is a combination of the uncertainties for the two, which may be shown to be y 2 ref y yref y yref 1 2 y y ref y 2 ref y ref 2 25
26 The following simpler formula is a good approximation and has the advantage of being independent of the depth y, so that a single uncertainty value can be used for each target-soil combination, without the need to calculate it for each data-point. Since, in practice, the uncertainty estimates are similar in all lanes, in this report we further simplify the estimate by using an average figure. y y y ref refref y y. 2 y ref 26
27 6 Soil properties 6.1 Introduction Some soils contain minerals which cause a reaction by a metal detector even when there is no metal present. In such situations, the operator is obliged to turn down the sensitivity of the detector, unless it is equipped with a ground-compensation circuit which can be adjusted to reduce the influence of the ground. The test site at Moamba, with its seven graded lanes, is ideally suited to investigating the performance of the detectors in different soil conditions; the emphasis of the trial was on this question. Measurements of the magnetic susceptibility, the frequency dependence of the magnetic susceptibility and the ground reference height (GRH) were made during the trial. In very general terms, the magnetic susceptibility is the main physical property which measures how much the ground couples electromagnetically with the field produced and detected by the detector coil and he GRH is an empirical measurement of the effect of the ground on the detector. More specifically, the susceptibility is the extent to which the magnetic field is increased by the soil minerals. Generally it is a small number: a soil with a susceptibility of 0.01 would be considered severe in the terminology of the CWA. All good modern detectors are designed to be usable in magnetic soils but they may still be affected if the susceptibility has a strong frequency dependence, that is to say, if its susceptibility at high frequencies is significantly less than at low frequencies. It is therefore usually considered that the greater the frequency dependence, the more uncooperative is the soil for metal detectors. In all the examples we have seen, the GRH increases with the frequency dependence of the susceptibility. 6.2 Ground Reference Height The ground reference height is the height above the soil at which a detector sounds as it is brought down onto the surface from above, in the absence of metal. A neutral soil has a GRH of zero and very severely noisy soil a GRH of tens of cm. In order to compare different ground reference heights it is necessary to standardize on a specific detector and calibrate it in a consistent manner i.e. set the detectors to a repeatable sensitivity for measuring the GRH. This is necessary for two reasons. First, the detector must always be set up in the same way if the GRH readings are to be meaningful. Second, the electronic units of most detectors are individual and must be set to a common benchmark for their results to be interchangeable when different detectors are used. The Schiebel Metal Detector AN19/2 M7 is suitable for this measurement because it has continuous adjustment of sensitivity and operates in the static mode. It has been widely-used in the past and is well-known to most organisations. We describe here two methods we use to calibrate it for the GRH measurement. The sensitivity after calibration will sufficiently similar to give equivalent GRH results, whichever of the two methods is used. The calibration should be done before measuring the GRH at each site. The targets to be used for this process are either the Schiebel test piece (delivered with each detector) or a 10mm diameter chrome steel ball (10mm Ø 100 Cr6). a) The Schiebel test piece is held 100mm away of the centre from the search-head in air. The sensitivity knob is then moved clockwise to a point where a reading starts. This should be repeated several times for confirmation. The distance to the Schiebel test piece 27
28 should not be measured from the real position of the metal piece but from the bottom of the arrow on the plastic cover (base of the arrow). b) A 10mm diameter chrome steel ball is placed 140mm away from the centre of the searchhead in air. The sensitivity knob is then moved clockwise to a point where a reading starts. This should be repeated several times for confirmation. 5 Schiebel test-piece 50 mm 50 mm Steel ball 140 mm 100 mm Detector starts to sound Figure 6-1 Two calibration methods for ground reference height measurement using a Schiebel Use the marking and add another 50mm for the Schiebel Test Piece, or use a 10 mm Ø 100Cr6 ball at 140 mm distance to the centre of the search head. The point at which the detector ceases to make a definite sound is somewhat subjective but if a point is chosen in the same way during the Ground Reference Height measurement as during the calibration procedure, the results should be reproducible. At least five GRH measurements should be made at each place where a reading is taken and the results should normally be within ± 5 mm of each other. This level of accuracy is both achievable in field conditions and useful. The final GRH result is then calculated as an average of the five readings. The ground reference height (GRH) was measured once with each of five Schiebel detectors AN19/2 M7, calibrated so that a standard test piece created a signal at a distance of 10cm to the centre of the search head. The correlation between the GRH and the frequency dependence of susceptibility may be clearly seen by comparing the dotted and green curves in Figure Note: The search-head of early versions of the Schiebel AN19 may be particularly sensitive to ground and atmospheric moisture. When it was the most widely used metal-detector in HD, deminers in some countries were advised to wrap the search-head in a plastic bag before using the detector on wet grass or in damp conditions. 28
 and two different sensors (MS2B and MS2D).")
, and so gives an indication of the frequency dependence.")
29 6.3 Magnetic Susceptibility Meter STEMD Field Trial Mozambique The magnetic susceptibility measurements presented in this report were carried out using a Bartington MS2 system. The system used consists of a meter (MS2) and two different sensors (MS2B and MS2D). The MS2B is a chamber which is used to obtain mass or volume susceptibility measurements of soil samples (Plate 6-1 left). It operates at 2 frequencies (0.465kHz and 4.65kHz), and so gives an indication of the frequency dependence. The MS2D is a handheld probe operating at 958Hz with a coil similar to that of metal detector which probes the upper parts of the soil surface directly in situ without disturbance of the soil by sampling (Plate 6-1 right) but does not by itself indicate the frequency dependence. Plate 6-2 Bartington MS2 configuration for sample (MS2B-left) and field measurements (MS2D-right) Measurements were made in all lanes with the MS2D and 10ml samples were taken and measured with the MS2B. Results are shown in Table 6-1 below, the frequency dependence is indicated in the column Low Frequency Susceptibility minus High Frequency Susceptibility. Table 6-1 Susceptibility measurements in lanes 1 to 7 Lane Magnetic Susceptibility measured with the Bartington MS2 meter (SI) MS2B (465Hz) MS2D Loop (968Hz) MS2B (4650Hz) Low Frequency Susceptibility minus High Frequency Susceptibility MS2B (465Hz) minus MS2B (4650Hz) GRH (mm) Schiebel AN19 Mod 7 CWA classification Neutral Neutral Moderate Severe Severe Severe Very Severe The data shown in Table 6-1 are averaged data. The measurements of the susceptibility with the D coil did not change significantly from day to day. The two-frequency data differed very little from data measured at Ispra in 2002, 2003 using the same type of instrument, from samples of the Moamba lanes 1-6 taken in 2001 (lane 7 was constructed in Spring 2005). 29
30 Susceptibility (SI units Soil Properties of the Lanes Field Coil Lab Low Freq. Lab High Freq. Freq. Difference 10 GRH Figure 6-3 Magnetic susceptibilityand ground reference height in the seven test lanes GRH (mm Figure 6-3 is the graphical representation of Table The curves demonstrate a continued increase of the magnetic susceptibility from L1 to L7 with the exception from L5 to L6. Different are the results for the GRH and differences between low and high frequency measurements in this case which both increase continuously. In general the reaction of the detectors follow these curves. The lower the plotted values the lower the influence of the ground on the detectors. 6.4 Expected dependence of the sensitivity on the soil magnetic properties DetectionDepth Expected loss of sensitivity across the lanes Lane When there is noise from the soil which the detector cannot compensate, the alarm threshold must be raised i.e. the detector s sensitivity must be reduced, to allow it to be used. If this reduction in sensitivity varies smoothly with the magnetic properties; that is to say, with the difference between the LF and HF susceptibilities and the GRH shown in Figure 6-3, then from Lane 1 to Lane 7 one would expect it to vary qualitatively as shown in Figure 6-4. Figure 6-4 Expected reaction of detectors to ground magnetic properties from Lane 1 to Lane 7 In Chapters 7 and 8, it will be seen that all of the detectors without soil compensation follow approximately the trend of Figure 6-4, in some cases the detector s sensitivity even falls to zero (not usable). Of the soil compensating detectors, some follow this curve but for others the curve is flatter, because the soil compensation electronics has prevented the loss of sensitivity in the higher numbered lanes. The detection depth in the more severe soils strongly depends on the solution found by the manufacturers for processing the ground data so that the detector does not lose sensitivity. So the curve of detection depth against Lane number is a measure of how efficiently the soil compensation circuit works. It should be borne in mind that the designer cannot just optimise the soil compensation to the exclusion of other considerations. Efficient soil compensation would be of no merit if the sensitivity value itself was poor i.e. if the detector was equally bad in all soils. Two design philosophies can reasonably be adopted: either to optimise for efficient soil compensation and good sensitivity or to optimise for the best sensitivity achievable under any given soil conditions. 30
31 7 Results: Comparison of all detectors 7.1 Introduction STEMD Field Trial Mozambique This chapter will give a direct comparative overview of the results of all participating detectors. Individual assessments of each detector are given separately in Chapter 8. In Chapter 7 we first present consolidated results for all targets and describe the typical trends then give results target by target and discuss results which stand out as of particular interest. Throughout Chapter 7, detectors will be listed alphabetically, all seven soil types and in-air data are on a single graph. For easier reading and understanding, legends and explanations for the graphs and tables are added in a fold-out pages ANNEX C to F, which can be viewed when reading each part of the report. For L1, for both the in-soil and in-air measurement, the detector was set up to maximum sensitivity in air, because the detector could always be used in this way without reaction to the ground in L1, since it is almost inert. For the other in-air and in-soil results the detector was setup individually to the soil in each lane. 7.2 Consolidated results and general trends 1.40 CEIA MIL- D1 EBEX 420HS EBEX 421GC Foerster Foerster MINEX MINEX 2FD FD Guartel MD8+ Minelab F1A4 Minelab F3 Schiebel ATMID SHRIMT M90 Vallon VMH3 Vallon VMH3 (M) L1 L2 L3 L4 L5 L6 L Figure 7-1 Detectors normalised sensitivity to the average sensitivity of all detectors for all targets in Lane 1 Figure 7-1 shows the in-soil detection depth data normalised to L1 global average i.e. all detectors and targets. The graph shows the pattern of reaction to the soil properties. The graph does not include cases where some detectors could not be used to detect smaller targets, this can only be found in the individual targets graphs and the assessment of the detectors. 31
32 The main trends visible are: a) A general pattern of significant loss of sensitivity with lane number, i.e. with increasing frequency dependence of soil magnetic susceptibility and ground reference height. Some detectors show this effect more than others. b) There are some cases where there are peaks after Lane 1. This is especially so in Lanes 2 and 3. Six of the twelve detectors have values greater than the Lane 1 value in at least one of these lanes. c) For some detectors, there is a pronounced fall at Lane 4. This effect is especially apparent for the CEIA, EBEX 420HS, MD8+ and ATMID. d) Six detectors have Lane 6 values greater than those of Lane 5. Some other effects are visible when the in-soil data is compared with the data measured in-air, after the detectors have been set up to each lane.: e) In general, the in-soil depths are greater than the in-air heights. f) The trend in sensitivity across the lanes in-air does not always follow the same pattern as the trend in soil. We will highlight cases where the trends are in the opposite sense. Discussion The general pattern of the sensitivity falling in the higher lane numbers is as expected according to the explanation in section 6.4. The exceptional behaviour of the Minelab detectors is due to their good soil compensation and also because of the design philosophy adopted, which is to optimise for equal performance in all conditions rather than to achieve the best possible performance in any given conditions as in e.g. the Vallon detectors (see Chapter 8 for more detail). The pronounced falls in Lane 4 are to be expected from the magnetic properties in Figure 6-3. The rises in Lane 6 with respect to Lane 5 may be connected with the fact that the L5 susceptibility itself is lower than that of L6, even though the frequency difference is greater i.e. that these instruments are responding partly to the absolute susceptibility as well as to the frequency difference. Our explanations for the slightly higher sensitivity measured in Lanes 2 and 3 are more tentative. Because of the small size of the changes, and the fact that only two operators used each model in each lane, operator subjectivity cannot be ruled out. It may be due to the default adjustment of the phases and timings being not quite appropriate for the targets used here, so that the compensation cycle actually improves the alignment slightly. However, the effect is seen to some degree even for the 420HS, MD8+ and SHRIMT, which do not have soil compensation. Another possible explanation is that the detectors are responding to the void in the soil formed by the target body, and this effect is slightly greater in Lanes 2 and 3. However, in Lane 2, one would expect this effect to be negligible. 32
33 7.3 Individual Target results The targets are grouped according to type first the steel ball as a neutral shape, then the rendered safe mines, followed by the simulants, each ordered according to the response they cause in most of the detectors. This indicates how the detectors behave to the reduction of metal content in the targets. Figures 7-2 to 7-10 shows the individual results of the rendered safe mines, simulant mines, ITOP inserts, and the 100Cr6 steel balls and allow the direct comparison of all participating detectors sensitivities in air and in-soil to the named target in the headline. Results for all lanes are grouped for each detector. Lane numbers 1 to 7 are indicated below the detector names (soil property details are described in ANNEX C fold-out page 1. Sensitivity of the detector to the target is shown on the y-axis: the achieved heights in-air are indicated above the x-axis in blue and the achieved depth in-soil below the x-axis in brown. Light and dark shades are used to differentiate between detectors. The red lines on the graphs for the used targets indicate 130mm, which is the Mozambican national standard clearance depth, the UN norm for its own operations and the IMAS default recommendation. The line is also added in the in-air data and spheres for easier visual comparison. The trends visible in the consolidated data and described above are also visible on the individual target graphs, but all of the effects are not always seen for every target. 33
34 7.4 Comparative results for detectors: 10mm steel ball in cubic holder CEIA MIL-D1 EBEX 420HS EBEX 421GC 10mm Ball Detection Height and Depth MINEX MINEX 2FD 2FD Guartel Minelab Minelab Schiebel MD8+ F1A4 F3 ATMID SHRIMT M90 Vallon VMH3 Vallon VMH3 (M) Depth in soil Height in air (mm Detectors and Lanes Figure 7-2 Detectors sensitivity comparison for the 10mm ball across the test lanes. Uncertainty ±11mm in-air, ±14mm in-soil The 10mm 100Cr6 chrome steel ball is used as a reference target in several of the CWA tests. Its metal content is comparable to a small to medium sized AP landmine. For all tests in this trial, the ball was mounted in the wooden holder described above. a) General tendency: Most of the detectors follow the expected general tendency and lose sensitivity from L1 to L7 in-soil and in air, the Ceia MIL D1 and Vallon VMH3 (M) displaying this especially clearly, but the Minelab detectors are exceptions, even giving increased sensitivity in soil in L7. The loss of sensitivity is sufficiently strong for some of the detectors, such as the MINEX and the Guartel MD8+, that they are unusable in some lanes. b) Lanes 2 and 3: there are seven detectors with results in these lanes that are better than in L1. c) Lane 4: Eleven of the twelve detectors have a pronounced decrease of sensitivity in L4 in comparison with L1 or L3. The exception is the Minelab F1A4. d) Lanes 5 and 6: For this target, there are few examples of L6 sensitivity greater than L5. e) Higher sensitivity for in-soil data: Eleven detectors achieved in some lanes significantly better results in-soil than in-air. f) Opposite trend in sensitivity in-air to in-soil: This can be seen quite clearly for the EBEX 421 GC in Figure 7-2. If one looks at the first three lanes, eight of the detectors have increases or decreases in sensitivity in the in-air data that are either not mirrored in soil or there is an opposite tendency. Some examples: The 421 GC has a sensitivity peak in-air at L2 and a decrease in-soil; the MINEX has in L2 a decrease in sensitivity in-air and a peak in-soil; the Minelab F1A4 a decrease in-air and increase in-soil, similarly but not to a significant extent the F3 from the same manufacturer; etc. In summary, this effect appears again for eight detectors for L1 to L3, and similar effects can be found in other lanes. 34
35 7.5 Comparative results to used targets: rendered safe mines Antipersonnel mine PMN PMN Detection Height and Depth CEIA MIL-D1 EBEX 420HS EBEX 421GC MINEX 2FD MINEX 2FD Guartel MD8+ Minelab F1A4 Minelab F3 Schiebel ATMID SHRIMT M90 Vallon VMH3 Vallon VMH3 (M) Depth in soil Height in air (mm Detectors and Lanes Figure 7-3 Detectors sensitivity comparison for the PMN across the test lanes Uncertainty ±11mm in-air, ±17mm in-soil Of the targets used in the trial, the PMN causes the strongest response by all the detectors because of the large diameter of the metal retaining ring around its cap and the large metal fuze components. The concrete bed of L1 allowed a burial depth of only 340mm, measured to the top of the mine. Nine out of twelve detectors achieved the 340mm limit in L1, all except the 421GC, F1A4 and M90. Experiments in the laboratory have not confirmed the results, they are for those detectors achieving 340 above this. All detectors achieved the 130mm standard depth in all soils, except the MD8+ in L4. a. General tendency: The loss of sensitivity with lane number is not very well-marked. Peaks of sensitivity in L3 are seen for eleven detectors, and another peak at L5 or L6 for eight detectors (excl. 420HS, MD8+, M90 all without GC; VMH3 (M)): if we take the L3 as reference for maximum sensitivity again all are significantly loosing sensitivity (excl M90). b. Lanes 2 and 3: All detectors have L2 and/or L3 results greater than L1, in soil. c. Lane 4: eleven of the twelve detectors (all except M90) have a pronounced decrease of sensitivity in L4 in comparison with L1 or L3. d. Lanes 5 and 6: Substantially greater in-soil sensitivity is seen in L6 than in L5, for both Foersters and both Minelabs. e. Higher sensitivity for in-soil data: Not generally confirmed for this target. f. Opposite trend in sensitivity in-air to in-soil: The and both Vallon detectors display opposing trends for the first four lanes. The Ebinger 420 HS shows it for the first three lanes. 35
36 Antipersonnel mine PMN2 PMN2 Detection Height and Depth CEIA MIL-D1 EBEX 420HS EBEX 421GC MINEX 2FD MINEX 2FD Guartel MD8+ Minelab F1A4 Minelab F3 Schiebel ATMID SHRIMT M90 Vallon VMH3 Vallon VMH3 (M) Depth in soil Height in air (mm Detectors and Lanes Figure 7-4 Detectors sensitivity comparison for the PMN2 across the test lanes. Uncertainty ±11mm in-air, ±16mm in-soil The PMN2 also produces quite a strong response. All participating detectors with ground compensation could easily detect the mine to the standard 130mm depth in all ground conditions available on the test site, but the 420 HS and themd8+, detectors without ground compensation had difficulties in L6. PMN2 graph: a. General tendency: The loss of sensitivity with lane number is not well marked but is more clearly seen than for the PMN; the in-soil L7 results are without exception lower than the L1 results. Peaks in intermediate lanes are less prominent than for the PMN. b. Lanes 2 and 3: nine detectors have instances of in-soil sensitivities in L2 or L3 greater than those of L1. c. Lane 4: six detectors have a pronounced decrease of sensitivity in L4 but five (421 GC, both Foerster, both Minelabs) show peaks there. d. Lanes 5 and 6: six of the twelve detectors have L6 results higher than L5, but the difference is mostly small. e. Higher sensitivity for in- soil data: most of the in-soil sensitivities are higher than the in-air but there are many exceptions. f. Opposite trend in sensitivity in-air to in-soil: for MINEX and Minelab F1A4 36
37 7.6 Comparative results to used targets: mine simulants Simulant Gyata-64 Gyata-64 Detection Height and Depth CEIA MIL-D1 EBEX 420HS EBEX 421GC MINEX 2FD MINEX 2FD Guartel MD8+ Minelab F1A4 Minelab F3 Schiebel ATMID SHRIMT M90 Vallon VMH3 Vallon VMH3 (M) Depth in soil Height in air (mm Detectors and Lanes Figure 7-5 Detectors sensitivity comparison for the Gyata-64 across the test lanes. Uncertainty ±11mm in-air, ±15mm in-soil The Gyata-64 simulant ranks next after the PMN and PMN2 mines in the signal strength it produces. Most of the detectors with ground compensation can detect it to 130mm (excluding the 421 GC in L2, L7 and the MINEX in L2). Gyata-64 graph: a. General tendency: There is a reasonably clear loss of sensitivity across the lanes for most detectors, with several exceptions. For all detectors, the in-soil sensitivity in L7 is less than that in L1. b. Lanes 2 and 3: There are only two clear examples of in-soil sensitivities in L2 or L3 being greater than those in L1. c. Lane 4: Only the Mil D1 and VMH3 show a pronounced drop in sensitivity at L4 and the EBEX 420HS, MINEX 4.510, both Minelabs and the VMH3(M) show peaks there. d. Lanes 5 and 6: Ten of twelve detectors have L6 sensitivities higher than L5, the exceptions being the 420HS and MD8+ which were unusable there. e. Higher sensitivity for in-soil data: this is seen for the Mil D-1 and 4.500, and in certain cases for other detectors but it is not confirmed generally. f. Opposite trend in sensitivity in-air to in-soil: for VMH3 from L1 to L3, in some lanes it is also seen in the Foersters. 37
38 g. Insert Mo: = antitank mines VS-2.2, PT Mi-Ba-III Mo Detection Height and Depth CEIA MIL-D1 EBEX 420HS EBEX 421GC MINEX 2FD MINEX 2FD Guartel MD8+ Minelab F1A4 Minelab F3 Schiebel ATMID SHRIMT M90 Vallon VMH3 Vallon VMH3 (M) Depth in soil Height in air (mm Detectors and Lanes Figure 7-6 Detectors sensitivity comparison for the ITOP Mo across the test lanes. Uncertainty ±11mm in-air, ±17mm in-soil The Mo insert is one of the larger format ITOP simulant fuzes. Its metal content is a 38mm long aluminium tube. It is designed to be used with the larger ITOP mine body simulants, to simulate AT mines such as the VS-2.2 and Pt-Mi-Ba-III. In the tests reported here it was buried without a body. The response of most detectors was less than to the Gyata simulant. Five detectors could detect it in all lanes to 130mm standard depth. (NB This target was also used extensively in the IPPTC trials.) Mo graph: a. General tendency: There is a general fall in detection depths across the lanes in soil but there are many exceptions. Eight detectors have clearly lower detection depths in L7 soil than in L1. b. Lanes 2 and 3: Eight detectors have examples of detection depths in L2 or L3 greater than those in L1. c. Lane 4: A pronounced drop in sensitivity between L3 and L4 is seen in most detectors, insoil or in-air or both. d. Lanes 5 and 6: All detectors have greater in-soil sensitivity in L6 than in L5. In two cases (421GC and M90) the difference is small. e. Higher sensitivity for in- soil data: confirmed for some detectors in L1 to L3, (CEIA, both Ebingers, ATMID, both VMH3). f. Opposite trend in sensitivity in-air to in-soil: There are no very clear cases 38
39 g. Insert Ko: = antipersonnel mine Type 72A, anti-tank mines TMA-4, M19 Ko Detection Height and Depth CEIA MIL-D1 EBEX 420HS EBEX 421GC MINEX 2FD MINEX 2FD Guartel MD8+ Minelab F1A4 Minelab F3 Schiebel ATMID SHRIMT M90 Vallon VMH3 Vallon VMH3 (M) Depth in soil Height in air (mm Detectors and Lanes Figure 7-7 Detectors sensitivity comparison for the ITOP Ko across the test lanes Uncertainty ±11mm in-air, ±17mm in-soil The Ko insert is one of the smaller format ITOP simulant fuzes Its metal content consists of a 7mm steel pin and a 12.7mm long aluminium tube. It is designed to be used with the smaller ITOP mine body simulants, to simulate AP mines such as the 72A. It is also produced in the larger format version, with the same metal content, to simulate AT mines such as the TMA-4 and M19. In the tests reported here it was buried without a body. The response of all the detectors was less than to the Mo, as expected. No detectors could detect the Ko in all lanes to the 130mm standard depth. Ko graph: a) General tendency: The fall in sensitivity across the lanes is present but not very well-marked, seven detectors showing some in-soil sensitivities greater than those of L1. All detectors except the Minelab F3 have lower sensitivities in soil in L7 than in L1. b) Lanes 2 and 3: Five detectors have values in L2 or L3 greater than those in L1, but most of the differences are small. c) Lane 4: pronounced drops in L4 in-soil are seen for the 4.510, MD8+, F3, and VMH3(M). d) Lanes 5 and 6: Six detectors have higher in-soil sensitivities in L5 than L6. e) Higher sensitivity for in-soil data: confirmed for most lanes for MIL D1, 420HS, ATMID and VMH3 (M). f) Opposite trend in sensitivity in-air to in-soil: for L3-L , L4-L6 for
40 Insert Io: = M14, PMA3, VS-1.6 Io Detection Height and Depth CEIA MIL-D1 EBEX 420HS EBEX 421GC MINEX 2FD MINEX 2FD Guartel MD8+ Minelab F1A4 Minelab F3 Schiebel ATMID SHRIMT M90 Vallon VMH3 Vallon VMH3 (M) Depth in soil Height in air (mm Detectors and Lanes Figure 7-8 Detectors sensitivity comparison for the ITOP Io across the test lanes Uncertainty ±11mm in-air, ±15mm in-soil The Io insert is one of the smaller format ITOP simulant fuzes. Its metal content consists of a 12.7mm long aluminium tube, narrower than that of the Ko. It is designed to be used with the smaller ITOP mine body simulants, to simulate AP mines such as the M14 and PMA3. It is also produced in the larger format version, with the same metal content, to simulate very low metal content AT mines such as the VS-1.6 In the tests reported here, it was buried without a body. The response of all the detectors was mainly less than to the Ko, as expected, however, the VMH3 and F3 did succeed in detecting all lanes to the 130mm standard depth. Io graph: a. General tendency: The in-soil results are characterised by very substantial decrease of sensitivity from L1 to L7 for all detectors without GC (420HS, MD8+, M90) and for the MIL-D1, Other detectors with GC significantly lose sensitivity from L1 to L7, the 4.510, ATMID and VMH3 (M). A third group, the 421 GC, both Minelabs and the VMH3 maintain to a certain degree their sensitivity across the lanes. b. Lanes 2 and 3: nine detectors show L2 or L3 sensitivities in-soil greater than those of L1. c. Lane 4 reaction: two detectors (420HS, 4.510) have a pronounced fall in sensitivity at L4 insoil and decrease of sensitivity in L4 in comparison with L1 or L3. d. Lanes 5 and 6: six detectors have higher sensitivity in-soil in L5 than in L6, in some cases marginally significant. e. Higher sensitivity for in-soil data: confirmed for some detectors in L1 to 2, (CEIA, both Ebinger, ATMID) but not as clear as for other targets. f. Opposite trend in sensitivity in-air to in-soil: for L1 to L2 MD8+ and F1A4, L2 to L3 420 HS and ATMID. Flat in air, rise in soil seen in L1 to L and
41 Simulant T72 T72 Detection Height and Depth CEIA MIL-D1 EBEX 420HS EBEX 421GC MINEX 2FD MINEX 2FD Guartel MD8+ Minelab F1A4 Minelab F3 Schiebel ATMID SHRIMT M90 Vallon VMH3 Vallon VMH3 (M) Depth in soil Height in air (mm Detectors and Lanes Figure 7-9 Detector Comparison per target and lanes: Simulant AP T72 Uncertainty ±11mm in-air, ±14mm in-soil The simulant T72 gave a signal intermediate between the Ko and Io, with some exception to this order, depending on the detector. Note that this is a somewhat weaker signal than expected, since the Ko is supposed to give the same signal as a T72 mine. There were again several lanes where the detectors with GC were not able to detect it to standard depth across the lanes. Three detectors can detect it in all lanes to 130mm standard depth. T72 graph: a. General tendency: The in-soil results are characterised by very substantial decrease of sensitivity from L1 to L7 for all detectors without GC (420HS, MD8+, M90) and for the MIL-D1 and Other detectors with GC significantly lose sensitivity from L1 to L , ATMID, VMH3 (M). A third group the 421 GC, both Minelab, the VMH3 maintain to a certain degree their sensitivity across the lanes. b. Lanes 2 and 3: All detectors except the ATMID and the Vallons have cases of either L2 or L3 in-soil sensitivities greater than those of L1. c. L4 reaction: Mil D1, 420HS, MD8+ and ATMID show pronounced falls at L4. d. L5 and L6: nine detectors show L6 sensitivities in-soil greater than those of L5. e. Higher sensitivity for in-soil data: confirmed for some detectors in L1 and L 2, (CEIA, both Foerster, ATMID), not as clear as for other targets. f. Opposite trend in sensitivity in-air to in-soil: for L2 and L , L4 and L , L3, L4,L6 F1A4. 41
42 Simulant Antipersonnel mine R2M1, R2M2; antitank mine No 8 RSA CEIA MIL-D1 EBEX 420HS EBEX 421GC R2M2 Detection Height and Depth MINEX 2FD MINEX 2FD Guartel MD8+ Minelab F1A4 Minelab F3 Schiebel ATMID SHRIMT M90 Vallon VMH3 Vallon VMH3 (M) Depth in soil Height in air (mm Detectors and Lanes Figure 7-10 Detector Comparison per target and lanes: Simulant AP R2M1, R2M2; AT No 8 RSA Uncertainty ±11mm in-air, ±14mm in-soil Out of all used targets this was the most problematic object for all detectors. It is produced from the original fuze of the above mentioned mines and an ITOP equivalent is not known to us. Only few detectors can detect this target in 130mm depth and that also only in L1 to L3, the up to L4, from L4 non achieves the 130mm. R2M2 graph: a. General tendency: The in-soil results are characterised by very substantial decrease of sensitivity from L1 to L7 for all detectors without GC (420HS, MD8+, M90) and for the MIL-D1 and & Other detectors with GC significantly lose sensitivity from L1 to L7, ATMID, VMH3. A third group the 421 GC, both Minelab, the VMH3 (M) maintain to a certain degree their sensitivity across the lanes. b. Lanes 2 and 3: Six detectors both EBEX, Vallon, Minelab have cases of either L2 or L3 in-soil sensitivities greater than those of L1. c. L4 reaction: Mil D1, 420HS, MD8+, both MINEX, F1A4 and ATMID show pronounced falls at L4. d. L5 and L6: five detectors (MIL-D1, 420HSBoth Minelab, ATMID), show L6 sensitivities in-soil greater than those of L5. e. Higher sensitivity for in-soil data: confirmed for some detectors mainly in L1 to L4 but also happen in L5, (both EBEX, both Foerster,MD8+, M90, VMH3), not as clear as for other targets and more spread across the lanes. f. Opposite trend in sensitivity in-air to in-soil: for L3 F1A4, VMH3 and L5 ATMID. 42
43 8 Individual Detector Descriptions and Results 8.1 Introduction to the individual detector results This section gives the individual technical description of each participating metal detector, its results, and remarks based on experiences during the trial. Each detector has a short description of technical solutions that influence use and performance. The results consist of the sensitivity to the test targets in the different soil types present in the lanes. Because of the varying nature of soils in which the trials were performed, comparing the results in the different lanes gives an indication of the loss of sensitivity, and of the ability of the ground compensation feature, when integrated, to overcome this. At the time of writing, completely effective ground compensation is still difficult to implement, so some loss of sensitivity does occur for almost all detectors. Graph description Figures 8-2 to 8-43 relate a detector s in-air and in-oil sensitivity to a group of targets in all lanes. There are three target groups: Mines include the PMN and the PMN-2 mines which have higher metal content than all the other targets. The signal from the PMN is particularly strong because of a metal ring which holds the rubber cover to the plastic body of the mine. Simulants include the Gyata AP and a Type 72 simulants, which were made locally for training and testing purposes. ITOP inserts were also used. These have similar metal content to fuzes of commonly found minimum metal mines (Io and Ko) and also anti-tank (Mo) mines. Spheres 5, 7, 10, 12, and 15mm 100Cr6 Chrome steel balls were also included for comparison purposes. The diameters used during the trial were. In-lab results in Ispra suggest that the detection height always increased with increasing sphere size. This was also generally observed in the in-air results from Mozambique. Each graph displays the different lanes on the x-axis and the sensitivity along the y-axis. In-air results are shown as positives whilst in-soil results are negative. Targets are individually coloured, and include their respective known uncertainties displayed as error bars. The results for a given target are joined to facilitate interpretation. As a benchmark, dotted lines were included in-soil to reflect the 130mm Mozambican and international standard clearance depth, and also in-air for easier in-air/in-soil comparison (except for sphere/balls graphs). Table explanation Tables 8-1 to 8-31 (except technical tables) show the percentage change in sensitivity of all observations with respect to in-air maximum sensitivity (in italics). This was the setting used for measurements in Lane 1. Values in red are not only greater than the in-air maximum reference but also above known experimental uncertainties (in lilac). The values highlighted in yellow indicate the maximum loss for a particular target. As the ITOP inserts were not used with ITOP bodies, they cannot be considered faithful representations of their intended targets. As such, ITOP insert results were not considered in the tables. Annex C -a foldout page- provides complementary soil and detector information which can ease the interpretation of both graphs and tables. 43

44 8.2 CEIA S.p.A., metal detector MIL-D1 The MIL-D1 is a continuous wave, static mode detector. It uses a bipolar waveform to avoid the initiation of magnetic igniters and has a double D search head for easy and accurate pinpointing. Further, the detector has: automatic ground compensation continuously changeable sensitivity control volume control a reset feature if the background noise increases different audible signals for detector status, and target classification different audio tones, one for each part of the double D search head for easier pin-pointing of the target possibility of modifying some parameters and upgrading software using an optional separate box Plate 8-1 MIL-D1 during the trial Further technical details and pictures are added after the assessment. Detection height in air and depth in soil for PMN and PMN-2 CEIA MIL-D1 - Mines Figure 8-2 shows the achieved 600 maximum detection height/depth of the MIL-D1 to the real mine targets used 400 during the trial. 200 For lanes 3-6, the in-air heights are similar to the in-soil depths but, PMN 0 PMN2 surprisingly, in lane 7 much better performance was achieved in soil than -200 in air. The maximum losses of sensitivity with respect to the Lane 1 inair -400 measurements were, for the PMN, % in air when set-up to L7, and 31% in soil when set-up to L4. Figure 8-2 In-air and in-soil sensitivity for mine targets For the PMN-2, the corresponding values were -54% in-air L7 and -61% in-soil L4. In air, there are two peaks, one in L3 and one in L6. This is repeated only in L3 for in-soil plot. In L3, the sensitivity values are even better than in the more neutral Lane 2. The concrete bed in L1 allowed only a burial depth of 340 mm (top of the target) so we are unable to say if deeper detection of the PMN was possible. A possible explanation for the increase of sensitivity in L3 may be due to the details of the soil compensation process. L3 is the first of the lanes to have an appreciable, if small, susceptibility, therefore one would expect the detector to align differently to the way it aligns in L1 and L2, apparently yielding a higher sensitivity in this case. in soil (mm) in air(mm 44
45 The peak in L6 may be associated with the fact that the soil has lower absolute magnetic susceptibility than L5, although its frequency dependence and GRH are higher. This peak in the sensitivity curve may indicate that the MIL-D1 is more sensitive to the absolute level of the magnetic susceptibility than to the frequency dependence. Table 8-1 MIL D1 & Mine targets: percent change of sensitivity with respect to L1 maximum in-air value. CEIA Uncert Target MIL D1 Height Change with respect to maximum in-air value ainties in air In-Air PMN 400mm -8% 35% -10% -16% 8% -40% 8% PMN-2 260mm -12% 42% -10% -21% -4% -54% 12% In-Soil PMN -15% -13% 30% -31% -15% -11% -25% 10% PMN-2 27% 30% 38% -25% -13% -11% 0% 16% When the detector is set-up to Lane 3, anomalous sensitivity measurements of up to 42% above the Lane 1 values were seen, both in-air and in-soil. Other measurements follow the expected trend of decreasing sensitivity from L1 to L7, with the exception of a small anomaly for the PMN in L6. Surprisingly, the loss of sensitivity for the in-soil measurements in L4 is nearly triple that for the in-air measurements. Conversely in L7, the in-air measurements are worse. Both mines may be detected by the MIL D1 at the required standard depth of 130mm. Detection height in air and depth in soil for mine simulants The grouped targets in Figure 8-3 include in soil (mm) in air(mm CEIA MIL-D1 - Simulants Gyata R2M2 T72 Io Ko Mo all mine simulants used during the test. The results are similar in general tendency to those shown in the graph for real mines. That is to say, the detector loses sensitivity as magnetic susceptibility increases. In L6, where the susceptibility decreases, the detection ability increases. The worst losses of sensitivity with respect to the Lane 1 in-air measurements were, for the Gyata, -55% in air and 38% in soil, both when set-up to Lane 7. For the T72, the corresponding values were - 67% in-air L7 and -15% in-soil L5. The Figure 8-3 In-air and in-soil sensitivity for simulants maximum loss of sensitivity for the R2M2 were -70% in-air L7 and the detector was not able to detect the target in L7. The increases of sensitivity for the Gyata and T72 in soil are highly anomalous and we are unable to explain them. The detector has first difficulties to achieve the recommended clearance standard with the simulants representing mines of the type R2M2, PMA 3, M14, VS-1.6 by L2- L3, a further decrease of sensitivity follows to L5, then a slight improvement in L6, and in L7 none of the simulants could be detected to the standard depth. In air, the peak in L6 observed for the real mines is also observed for the simulants. In soil, the peak in L6 is observed too. By L4, half of the targets are not detected to the required clearance depth. By L7, no targets are detected to the required depth. 45
46 Table 8-2 MIL D1 & Simulants: percent change of sensitivity with respect to L1 maximum in-air value CEIA Uncert MIL D1 Target Height Change with respect to maximum in-air value ainties in air Gyata 210mm -19% 24% -19% -26% -38% -55% 15% In-Air T72 120mm 25% 13% -8% -38% 8% -67% 26% R2M2 150mm -17% -17% -47% -57% -23% -70% 21% Gyata 55% 40% 38% -33% -20% 13% -38% 18% In-Soil T72 63% 58% 92% 25% -15% 42% 0% 30% R2M2 20% -23% -23% -43% -63% -43% -100% 24% Anomalously high sensitivity values of up to 24% above reference in-air and up to 92% above reference in-soil stand out, in L1 to L3 for the targets Gyata and T72. Other measurements follow the general trend of falling sensitivity from L1 to L7, excluding L6. The detector just gave a signal to the surface laid R2M2 simulant. Note that the strongly anomalous high values for the Gyata-64 and T-72 in Lanes 1 to 3 are greater than those in-air of the same lanes. Detection height in air and depth in soil for steel balls CEIA MIL-D1 - Balls In Figure 8-4 the practical field tests show a few exceptions to expected order in the in-soil measurements. But most of them are within the known uncertainties, excluding the 12mm ball in L6. The maximum losses in air are at L7 for all balls, which vary from 22% for the mm, 75% for the 7mm, 64% for the 10mm, 60% for the12mm to 48% for the mm ball. In-soil the maximum losses were correspondingly 100%, 100%, -300 Figure 8-4 In-air and in-soil sensitivity for balls 97%, 71%, and 41%. These losses of sensitivity for the spheres are similar to the results for the minimum metal content simulants above. The 15mm sphere in soil gave a surprisingly low result in Lane 1 but this result was due to 1 reading taken from 4 being much lower than others, and so shifting the average. Also surprising is that the in-soil result for the 15mm sphere was much greater than in-air result. This cannot be explained by void effect because L1 soil is inert. The peak in the results in L6 mentioned above is significant and follows a regular pattern, especially for the in air results. in soil (mm) in air(mm General remarks During the 2 weeks of the trial, no difficulties in use or technical questions arose. The detector had no problems in completing its automatic soil compensation process in all lanes, except sometimes in Lane 7 where the procedure had to be repeated. This detector is the only one tested in which soil compensation is made over a wider area, rather than with the head at a single horizontal position, so the reaction to small changes should not have as much influence as when compensating only on a search head sized region. We noticed during practice that some operators did not fully turn sensitivity to maximum to perform ground compensation. A minor recommendation would be that this manual intervention be made automatic (i.e. detector defaults to high sensitivity during ground compensation). 46
47 If the detector is moved a little faster than normal, there is a short signal delay after the target passes the zero-line of the double-d search head. This can easily be avoided by slowing down the speed when a signal starts on one side of the search head. This has importance for the accuracy of the pinpointing process (as a static detector it does not influence on the sensitivity). The loss of sensitivity with the increasing electromagnetic properties of the ground was substantial, especially in the area of low metal content mines. 47
48 Table 8-3 Technical data CEIA MIL D1 Metal detector: CEIA MIL-D1 Working technology Continuous wave Bipolar, triangle wave, frequency domain (3 frequencies induction used), static mode, separate sending and receiving coil Price 2700 Euro Without VAT Unit price Operational aspects Min- Max shaft cm Continuous length adjustment length Weight 1.6 / 3.2 kg Carrying C/Box ; C/Box fixed to shaft Ground Yes Automatic after initiation compensation User interactions Target signals Audio 2 tone pinpointing, large metal alarm tone System signals Audio Confidence click, low battery alarm Access to software Yes Sensitivity adjustment Equipment Design Design 2 piece design with possibility of attaching control box to shaft Search head Circular, 28cm Double-D design Speaker/headphones Yes, internal/ Yes Batteries LR20 4 Package Operator manual Yes Format A5 English - Not plasticized Instruction card Yes Format single page A5 English/French Plasticized List of content Yes Format single page A5 English/French Plasticized Test piece Yes Case dimensions cm Case mass (full) kg With all accessories + one set of battery Case type material Hard case Plastic Protection Yes Dust, rain, vibration Backpack Yes Mass backpack (full) 4.77 kg With all accessories + one set of battery 48


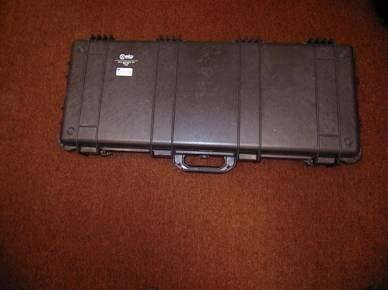
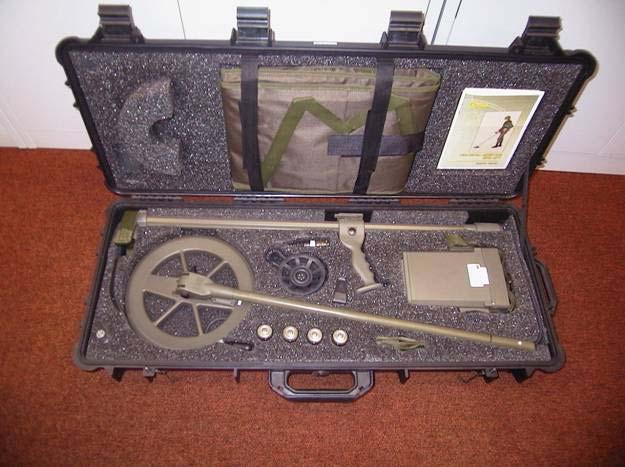
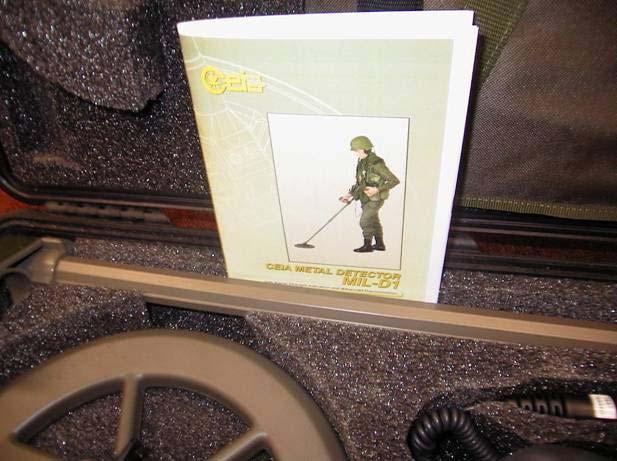
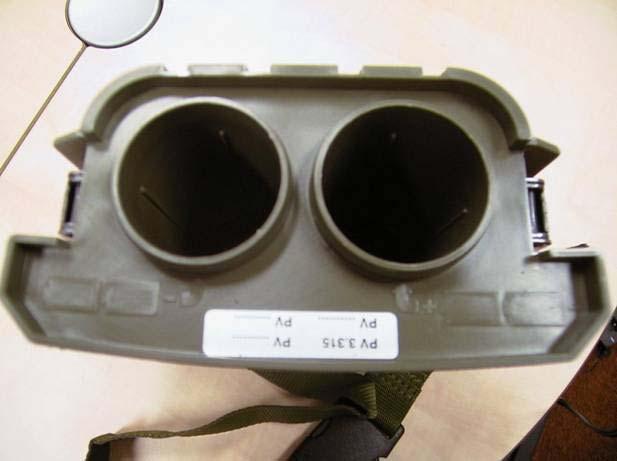
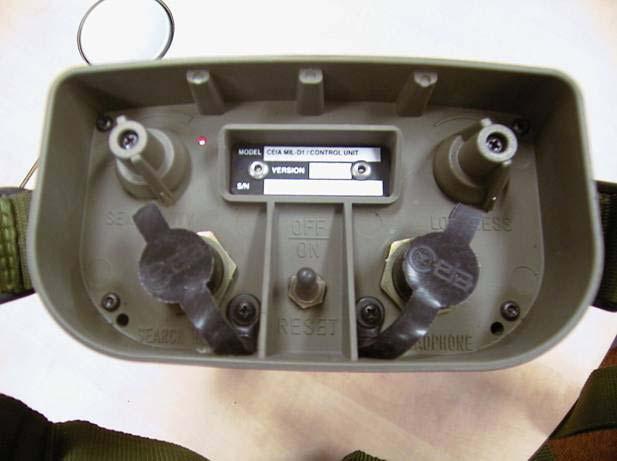
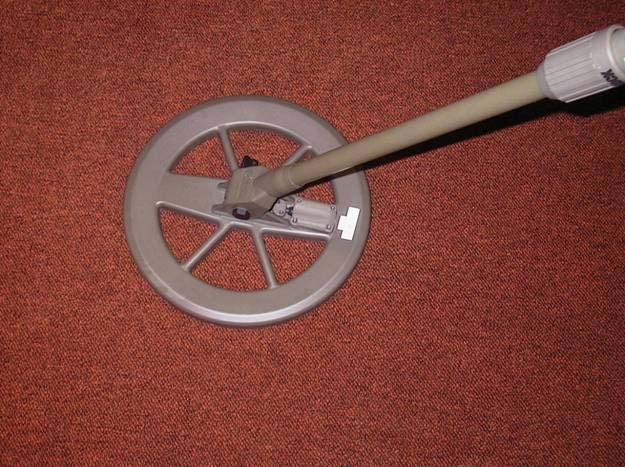
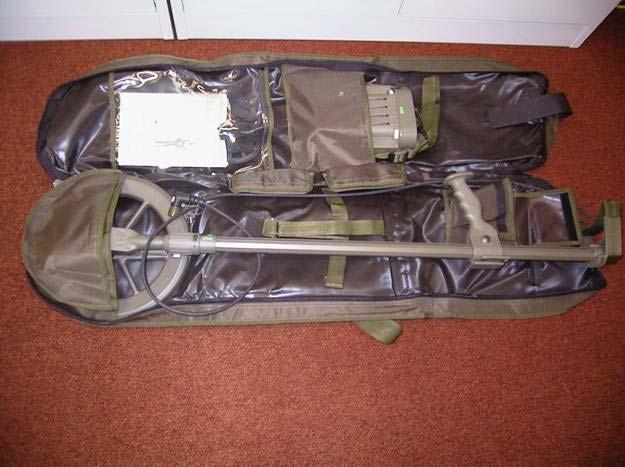
49 Picture details MIL-D1 49

50 8.3 Ebinger GmbH, metal detector EBEX 421GC The EBEX 421 GC is a pulse induction, dynamic mode detector. It uses a bipolar waveform to avoid the initiation of magnetic igniters. The single sendand-receive coil is circular with a 200mm diameter search head. The detector has: manual ground compensation continuously changeable sensitivity control external speaker or headphone battery container for C-cells, that may be replaced by an accumulator (see pictures below) The detector has a modular design whereby different elements can be screwed on. Such elements include a UXO head, different power options, and a length extension. The detector may be extended and used with an armrest and a handle. Plate 8-5 Ebex 421GC during the trial Further technical details and pictures are provided after the assessment. Detection height in air and depth in soil for the PMN and PMN-2 Ebinger EBEX 421GC - Mines Figure 8-6 illustrates the maximum 600 detection height/depth achieved with the real mine targets used during the trial. 400 The results for the PMN do not show a 200 consistent decrease from L1 to L7. The sensitivity in L4 (~ 36%) is significantly PMN 0 PMN2 lower than in L3, which one might expect, because the soil magnetic -200 properties are markedly worse than in L3 (Figure 8-6). However, there is no -400 further drop in sensitivity in L5-L7, so -600 one cannot conclude that the sensitivity Figure 8-6 In-air and in-soil sensitivity for mine targets of the EBEX 421GC always gets worse with the soil properties. The maximum losses of sensitivity with respect to the Lane 1 in-air measurements were, for the PMN, 36% in air and 42% in soil, surprisingly not in L7 but L4 in-air and L1 in-soil. For the PMN-2, the corresponding values were 21% in Lane 4 and 33% in Lane 2. The sensitivities vary significantly from one lane to another but not in a manner simply associated with the soil properties. in soil (mm) in air(mm In Figure 8-6, the changes from one lane to another are not even in the same direction in air as in soil. In fact, it is usually in the opposite direction. For example, the PMN2 in L4 gives a reduced sensitivity in air, with respect to the neighbouring lanes L3 and L5, whereas in soil it has an increased sensitivity. 50
51 Table 8-4 EBEX 421GC & mine targets: percent change of sensitivity with respect to L1 maximum in-air value EBEX Uncert 421 GC Target Height in Change with respect to maximum height in-air value ainties air In-Air PMN 390mm -28% -15% -36% -3% -23% -23% 8% PMN-2 290mm 0% -2% -21% 0% 3% -7% 11% In-Soil PMN -42% -12% 10% -38% -31% -33% -17% 10% PMN-2 7% -33% -12% 3% -7% -27% -16% 13% The yellow highlighted figures indicate the maximum loss of sensitivity for the detectors, which, for the in-soil data, is surprisingly not in L4 as for the in-air data. The detector is able to detect both mines to the recommended depth under all lane conditions. The decrease of 42% in the neutral sand of L1 is not explainable. Detection height in air and depth in soil to mine simulants in soil (mm) in air(mm Ebinger EBEX 421GC - Simulants Figure 8-7 In-air and in-soil sensitivity for simulants 51 Gyata R2M2 T72 Io Ko Mo The detector show losses of sensitivity that vary significantly from lane to lane but the curves remain relatively flat around a certain average loss. The worst losses of sensitivity with respect to the Lane 1 in-air measurements were, for the Gyata 46% in-air in L2&L7 and 82% insoil, when set-up to L2. (The last figure looks anomalous, since the loss in Lane 7 was only 60%). For the T72, the corresponding values were 33% in Lane 3 and 50% in L7. The maximum losses for the R2M2 were 28% in-air L3 and 44% in-soil to L5. We draw attention to the peak in soil in L4 and L6 for the Gyata and T72, which are not expected from the soil properties but are also seen in several other detectors. In general the detector can detect most of the simulants to the recommended clearance standard of 130mm excluding the R2M2, and excluding in L 7, where only the Mo target is detectable deeper than 130mm. The in soil data do not show the same steady trend as the in-air data and the differences cannot be explained by the known experimental uncertainties. They include significant changes in the order of detectability of the targets. The detector could keep a certain level of sensitivity for most targets, excluding the Gyata and T72, as evidenced by the relatively flat curves. Table 8-5 EBEX 421GC & Simulants: percent change of sensitivity with respect to L1 maximum in-air value EBEX Uncert 421 GC Target Height in Change with respect to maximum height in-air value ainties air Gyata 260mm -46% -21% -31% -4% -35% -46% 12% In-Air T72 150mm 0% -33% -27% -7% -17% -23% 21% R2M2 90mm 11% -28% -33% -6% -22% 6% 35% Gyata -18% -82% -38% -14% -47% -33% -60% 14% In-Soil T72-15% -21% -1% 29% -28% 13% -50% 24% R2M2 25% 67% 0% -6% -44% -42% -17% 40%
52 Sensitivity values of up to 67% above reference in-soil stand out (L2&L4 for T72 and R2M2) when the other measurements follow the general trend of losing sensitivity from L1 to L7. The maximum loss of 82% in soil and 46% in air in L2 for the Gyata are obviously out of the normal order. They may possibly have been caused by an error of set-up technique, however, the data were collected by different operators on different days. High losses of 47% in L5 and 60% in L7 are more expected:. Detection height in air and depth in soil for steel balls In Figure 8-8 the practical field tests Ebinger EBEX 421GC - Balls 300 show a few exceptions to the expected order for the in the in-soil measurements. 200 There are significant losses of sensitivity from L1 to L7 if one looks at the results in air for the targets >10mm and for all targets in soil. The in-air data especially 12 show a good level of average sensitivity The lower results in L1 compared with L2 and L5 in air are surprising, it appears -200 that the adjustment of the time-domain circuit to the soil has actually increased -300 its sensitivity to the steel balls used in Figure 8-8 In-air and in-soil sensitivity for balls this test. However, the in-soil data were all better in L1 than the in-air data. This is very hard to explain, given that L1 is almost inert magnetically. The result for L2, which is also nearly inert, is much more what would be expected: approximately equal values in air and in soil. Significant losses in air are seen only at L4, for the 10, 12, and 15mm balls. In-soil, significant losses were in different lanes for different ball size. The L5 results for the 10mm and 12mm balls are out of the normal order, as are the L7 results for the 12 and 15mm balls. in soil (mm) in air(mm The peak in the results in L2 is significant for the in air results and follows a regular pattern. However, the in-soil data have a slight but significant trough in L2, excluding the 12mm ball, but a less regular pattern overall for the order of the detectability of the balls versus their size, compared with the in air results. During the 2 weeks of the training and trial, no difficulties in use or technical questions arose. The detector had no problems in compensating the ground influence in all lanes and could well cope with the physically different structures of the soils i.e. the stones as well as with the magnetic properties. The signal interpretation is easy because there is little background noise. to help with adjustment at different sites. 52
53 Table 8-6 Technical data EBEX 421 GC Metal detector: Ebex 421 GC Working technology Pulse induction Bipolar pulse, dynamic mode, single sending and receiving coil Price 2360 Euro Without VAT Unit price Operational aspects Min- Max shaft ; 114- cm With cell ; (*): with battery extension length 174(*) Weight 2.35 ; >2.7(*) kg With cell ; (*): with battery extension Ground Yes Manual compensation User interactions Target signals Audio System signals Audio Confidence click, low battery alarm Access to software No Equipment Design Design 1 piece modular design Search head Circular, 23cm Speaker/headphones Yes, external/ Yes Speaker/headphone doubles as power switch Batteries C Cells 8 or rechargeable pack Package Operator manual Yes Format A5 English - Not plasticized Instruction card No List of content Yes In manual Test piece Yes Case dimensions cm Case mass (full) 6.7 kg With all accessories + one set of battery Case type material Hard case Plastic Protection Yes Dust, rain, vibration Backpack Yes Mass backpack (full) 3.4 kg With all accessories + one set of battery 53
 and the two")


,")

54 Pictures EBEX 421 GC The detector with the modular extension (above) and the two possible power attachments (right). The armrest and handle are not displayed The detector in short configuration with the rechargeable battery pack The armrest and handle are not displayed Sensitivity knob (left), soil compensation adjustment knob (middle), and loudspeaker (right) which can be covered by a protective cylinder. 54

55 8.4 Ebinger GmbH, metal detector EBEX 420 HS The metal detector EBEX 420 HS is a sine wave, dynamic mode detector. The bipolar waveform will avoid the initiation of magnetic fuses. The detector operates off a standard 9V accumulator, which is kept charged by a small solar panel mounted above the search head. This is a unique concept not applied by any other manufacturer to our knowledge. Further, the detector has: no ground compensation continuously changeable sensitivity control a tube extension and armrest for the handle so that the detector may be used in standing, kneeling or prone positions. Plate 8-9 EBEX 420 HS detector during the trial Further technical details and pictures are added after the assessment. Detection height in air and depth in soil to PMN and PMN-2 in soil (mm) in air(mm) Ebinger EBEX 420HS - Mines Figure 8-10 In-air and in-soil sensitivity for mine targets 7 was only 13%). PMN PMN2 Figure 8-10 shows the achieved maximum detection height/depth of the EBEX 420 HS Solar to the real mine targets used during the trial. The data of the in-air measurement look very consistent in their structure and display the expected loss of sensitivity from L1 to L7. The worst losses of sensitivity with respect to the Lane 1 inair measurements were, for the PMN, - 36% in air and 27% in soil, both when set-up to Lane 7. For the PMN-2, the corresponding values were 35% in Lane 7 and 61% in Lane 6. (The last figure looks anomalous, since the loss in Lane In general, for both mines, the in-soil values are significantly better than the in-air values, excluding L6 for the PMN 2, which we are unable to explain. This is particularly apparent in the PMN result for Lanes 2 and 3. In air and in-soil, there is a significant loss at L4, as expected from the soil properties. The concrete bed in L1 allowed only a burial depth of 340 mm (top of the target) so we are unable to say if deeper detection of the PMN was possible). 55
56 Table 8-7 EBEX 420 HS & mine targets: percent change of sensitivity with respect to L1 maximum in-air value EBEX Uncer 420 HS Target Height in taintie Change with respect to maximum height in-air value air s In-Air PMN 390mm -5% -9% -33% -26% -26% -36% 8% PMN-2 230mm 0% 4% -33% -26% -26% -35% 14% In-Soil PMN -13% 8% 26% -24% -21% -23% -27% 10% PMN-2 35% 30% 26% 1% 9% -61% 13% 16% Both mines may be detected by the EBEX 420 HS at the required standard depth of 130mm, excluding the PMN 2 in L6. Detection height in air and depth in soil to mine simulants The grouped targets in Figure 8-11 Ebinger EBEX 420HS - Simulants include all mine simulants used 350 during the test. The results are 250 similar in the general tendency shown in the graph for real mines. 150 Gyata The in-air data have a significant R2M2 50 T72 peak in L3 with increased Io sensitivity. Further, the detector -50 Ko loses sensitivity as magnetic Mo -150 susceptibility increases. The maximum losses of sensitivity -250 with respect to the Lane 1 in-air -350 measurements were, for the Gyata 23% in air and 100% in soil, when Figure 8-11 In-air and in-soil sensitivity for simulants set-up to L7 for in-air measurements and L6 for in-soil. (The last figure looks anomalous, since the loss in L7 was only 18%). For the T72, the corresponding values were 65% in Lane 7 and 100% in Lane 6&7. The maximum losses for the R2M2 were 50% inair and 100% in-soil both to L7. The in-air results look very consistent and similar to the mine curves above, Figure 8-11, excluding the peak in L3. The detector achieved better average results for the in-soil measurements to maximum sensitivity results, which we are not able to explain. The in-soil data demonstrate that for certain targets in L5 and L6 the detector should not be used, since it is not capable of detecting them at the depth required by national standards (130mm). The in soil data do not show the steady trends across the lanes seen in air and this cannot be explained by the known uncertainties. It is possible that additional experimental uncertainties were present of which we are not aware. In this respect, the in-soil results of Figure 8-11 are confusing. There are significant losses and increases of sensitivity, possibly connected with the fact that there is no ground compensation so that the individual ability of the operator may have had a substantial influence. Significant changes to the sensitivity to both sides, plus and minus, can be seen in the in-air data, even to the point that the target order changed. In general the detector has from the beginning in L1 difficulties to detect the R2M2, T72, and the Io targets in soil. This improves to L2-L3 and from L4 the detector is not able to achieve the required clearance standard of 130mm. in soil (mm) in air(mm 56
57 Table 8-8 EBEX 420 HS & Simulants: percent change of sensitivity with respect to L1 maximum in-air value EBEX Uncert 420 HS Target Height in Change with respect to Lane 1 height in-air value ainties air Gyata 110mm 18% 59% -14% -18% -18% -23% 28% In-Air T72 100mm 0% 15% -55% -50% -50% -65% 31% R2M2 70mm 21% 36% -50% -29% -29% -50% 44% Gyata 127% 7% 45% 61% 25% -100% 18% 34% In-Soil T72 20% 41% 130% -63% -25% -100% -100% 36% R2M2 39% 100% 43% -50% -43% 55% -100% 51% Anomalously high sensitivity values of up to 59% above reference in-air and up to130% above reference in-soil stand out. In-soil L1 to L3 for all targets higher sensitivity up to 130% was achieved when later the loss was 100% to all of them. The lanes 5 & 6 are the real limits for the use of this detector. Skilled operators may be able to use the detector in more severe conditions, as here in L7, by lifting the detector high enough above the surface to suppress the ground signal but this technique should never be allowed in normal clearance operations (see below). Detection height in air and depth in soil to steel balls Ebinger EBEX 420HS - Balls The in-air data displays a regular pattern (Figure 8-12). There were a few exceptions to this in the in-soil, one is the 15mm ball in L6. There is significant loss of sensitivity from L1 to L7 in air and it is worse in soil. There is some evidence for an increase of sensitivity from L1 to L3, i.e. the two peaks in L2 and L3 for the balls -100 >10mm. Significant losses in air after -200 Lane 4 are seen only at L7 for all balls, which range from 92% for 5mm, 63% -300 for 7mm, 38% for 10mm, 31% for Figure 8-12 In-air and in-soil sensitivity for balls 12mm to 23% for 15mm. In-soil, the maximum losses occurred almost always in L7 and were 100%, 95%, 94%, 62% and 58% respectively. The in-soil sensitivities were all better in L1 to L3 than the inair data. in soil (mm) in air(mm The peak in the results in L2&3 mentioned above are significant for the in air results and follows a regular pattern. The in-soil data have a significant peak in L3 for the 15mm ball. The other peak in L6 is significant for the in-soil measurements with 5,7,10, and 12mm balls to the results in L5. Surprisingly the 15mm ball was recorded as undetectable in L6, which we are not able to explain. During the 2 weeks of the training and trial, on some days the accumulators supplied did not retain their charge on an overnight charging. We did not investigate in detail why this occurred but it may be due to cold damage during storage in Italy in the winter. After the replacement of the accumulators, no further problems were experienced. Although there is the use of normal 9V 57
58 batteries foreseen we established during the lab tests interference of the solar panel (noise of the loudspeaker) if it was turned to the light. The absence of ground compensation made the use of the detector quite dependent on the individual abilities of the operator. The detector could be used in the different lanes by reducing the sensitivity so that the ground did not create a signal and in L7 by also lifting it to a height where no signal was received from the ground. As stated above, we do not recommend this technique because it is difficult to keep the constant level above the ground required to avoid the ground signal. An anomalous behaviour of the detector was registered when used in L7. When lowered onto the ground, the detector did not react with a signal in spite of the very high magnetic susceptibility. Only when the detector was lifted did it give a signal. It was possible to use this effect for detection of larger targets i.e. if a signal was produced when the detector was lowered the target was considered to be detected. The achieved in-soil results of L1 and the trend of the subsequent lanes clearly demonstrate the normal trend of sensitivity loss from L1 to L7. The reaction of the detector to the ground forces the operator to reduce the sensitivity or to lift the detector, so that by L7 sensitivity is reduced to zero for the 5mm ball. The loss of sensitivity with the increasing electromagnetic properties of the ground was significant and depends strongly on the type of the target. We do not recommend use of this detector for finding minimum metal mines when the ground conditions are similar to L3 or worse. The simple construction and low power consumption may make it valuable in less severe ground conditions. 58
59 Table 8-9 Technical data EBEX 420 HS STEMD Field Trial Mozambique Metal detector: Ebex 420 HS Working technology Sine wave Dynamic mode detector, single sinus wave, bipolar to avoid induction initiating magnetic fuzes. Price 1899 Euro Without VAT Unit price Operational aspects Min- Max shaft 64 cm Small version length Weight 1.2 kg Small version Ground No compensation User interactions Target signals Audio System signals Audio Confidence click, low battery alarm Access to software No Equipment Design Design 1 piece modular design. Extension available Search head Circular, 20cm Speaker/headphones Batteries Yes, internal/ No PP3 rechargeable 1 Integrated solar panel Package Operator manual Yes Format A5 English - Not plasticized Instruction card No List of content Yes In manual Test piece Yes Case dimensions cm Case mass (full) 5.2 kg With all accessories + one set of battery Case type material Hard case Plastic Protection Yes Dust, rain, vibration Backpack Yes Mass backpack (full) 1.9 kg With all accessories + one set of battery 59

 is")


60 Pictures EBEX 420 HS The short version of the EBEX 420 HS in its transport case The solar panel (right) is mounted on the search head shaft From left: sensitivity adjustment, battery compartment, internal speaker and power knob. 60

61 8.5 Guartel Ltd., metal detector MD8+ Plate 8-13 Metal detector MD8+ during trial Detection height in air and depth in soil to PMN and PMN-2 The MD8+ is a pulse, dynamic mode metal detector. It uses unipolar waveform, and has a double D search head for easy and accurate pinpointing. Further the detector has: no ground compensation 3 fixed sensitivity increments volume control optical indication of signal strength and position (relative to search head axis) the same audio tone for each part of the double D search head Further technical details and pictures are added after the assessment. Guartel MD8+ - Mines Figure 8-14 shows the achieved maximum 600 detection height/depth of the MD8+ to the real mine targets used during the trial. Both 400 targets are, in comparison to the other 200 targets used, relatively easy to detect due to PMN their high metal content. PMN2 0 The data of the in-air measurement look -200 consistent in their structure and display the expected loss of sensitivity from L1 to L The maximum losses of sensitivity with respect to the Lane 1 in-air measurements -600 were, for the PMN, 68% in air and 100% in Figure 8-14 In-air and in-soil sensitivity for mine targets soil both at L7. For the PMN-2, the corresponding values were 93% in L7in-air and 91% in-soil L6. In general, for both mines, the in-soil values indicate the loss of sensitivity from L1 to L7 and that starting with L6 the detector is not able to detect both mines, although there is a figure in L7 that is close to the in air data for the PMN-2. In-soil, there is again an unexpected increase of sensitivity at L3 for the Gyata, that cannot be explained by the known uncertainties as well as for the PMN-2 in L7. The concrete bed in L1 allowed only a burial depth of 340 mm (top of the target) so we are unable to say if deeper detection of the PMN was possible). in soil (mm) in air(mm Table 8-10 MD8+ & mine targets: percent change of sensitivity with respect to L1 maximum in-air value MD8+ Uncert Target Height in Change with respect to Lane 1 height in-air value ainties air In-Air PMN 340mm 15% 6% -15% -6% -21% -68% 9% PMN-2 280mm -21% -11% -36% -25% -43% -93% 11% In-Soil PMN 0% 15% 53% -24% -21% -19% -100% 12% PMN-2 12% 7% -13% -25% -29% -91% -7% 13% Both mines may be detected by the MD8+ at the required standard depth of 130mm only to L5 for the PMN-2 and to L6 for the PMN. 61
62 Detection height in air and depth in soil to mine simulants Guartel MD8+ - Simulants The grouped targets in Figure 8-15 include all mine simulants used during the test. The metal content of the 150 imitated mines is low: they are minimum Gyata R2M2 metal content mines. The in-air data 50 T72 Io indicate a rapid loss of sensitivity from -50 Ko L1 to L4, excluding the Gyata. Further, Mo the detector s signal interpretation is Figure 8-15 In-air and in-soil sensitivity for simulants difficult and only for the Gyata could acceptable results be achieved to L6. The in-soil data starts with higher values of L1 to the in-air results for the Gyata, R2M2, and Mo. Further the detector loses sensitivity for different targets at different lanes to zero. The interpretation would be a guesswork and we would recommend that this detector can only be used when the conditions of deployment are not worse as in L3. The maximum losses of sensitivity with respect to the Lane 1 in-air as well as in-soil measurements were to all targets at one point 100%, i.e. not usable for detection. The more detailed information is below in Table The detector has from the beginning in L1 difficulties to detect the grouped targets to the recommended standard clearance depth 130mm, excluding the Gyata and the Mo target. in soil (mm) in air(mm Table 8-11 MD8+ & Simulants: percent change of sensitivity with respect to L1 maximum in-air value MD8+ Uncer Target Height in taintie Change with respect to Lane 1 height in-air value air s Gyata 130mm 15% 50% -4% 19% -19% -100% 24% In-Air T72 110mm 9% -18% -82% -55% -100% -100% 28% R2M2 90mm -11% -44% -100% -89% -100% -100% 35% Gyata 140% 40% 19% -4% -42% -100% 0% 29% In-Soil T72-5% 35% 32% -60% -100% -100% 118% 32% R2M2 42% 44% -28% -100% 0% -68% -100% 40% Anomalously high sensitivity values of up to 118% above reference in-soil stand out. On the other side no detection in two lanes before. The experimental uncertainties of this detector are already much higher than for the others but they also cannot explain the results. From L4, the detector was in general not usable. To overcome this and obtain some results, the operators had to work with the search head lifted clear from the ground. This approach should not be used in the field. 62
63 Detection height in air and depth in soil to steel balls in soil (mm) in air(mm Guartel MD8+- Balls Figure 8-16 In-air and in-soil sensitivity for balls In Figure 8-16 the practical field tests show a exceptions to the expected order in the in-soil measurements. In comparison with the results of the simulants the performance of the detector is much more conform with the in-air results. With the exception of the 15mm ball in L7, most of the other results are within the known uncertainties. There is significant loss of sensitivity from L1 to L4 looking at the results in air and in-soil. There is also a peak in L5 with improvement to L4 for the targets > 10mm, which is repeated in-soil. During the 2 weeks of the training and trial, no technical questions arose. The detector has no soil compensation and from L4 to L7, it was very difficult to understand if the signals were caused by metal or by the ground. In general this detector should not be used if the ground conditions are worse than described for L3, or in places with inhomogeneous soil with low level susceptibility. The loss of sensitivity with the increasing electromagnetic properties of the ground was extreme. 63
64 Table 8-12 Technical data Guartel MD8+ STEMD Field Trial Mozambique Metal detector: Guartel MD8+ Working technology Pulse induction Pulse, dynamic mode metal detector. It uses unipolar waveform, and has a double D search head for easy and accurate pinpointing Price 2059 Euro Without VAT without transport case (+140 ) Operational aspects Min- Max shaft cm Continuous length adjustment length Weight 2.4 kg Ground no compensation User interactions Target signals Audio/Visual 1 tone pinpointing, LEDs indicate signal strength and position relative to centre of search head System signals Audio/Visual Confidence click, low battery alarm (sound and LEDs) Access to software No Equipment Design Design 2 piece design Search head Truncated ellipse, cm Double-D design L:27, W:20 Speaker/headphones Yes, internal/ Yes Batteries LR20 3 Detector goes in sleep mode when not moved Package Operator manual No Instruction card Yes Format single page A4 English Plasticized List of content No Test piece No Case dimensions cm Case mass (full) 9.2 kg With all accessories + one set of battery Case type material Hard case metal Protection Yes Dust, rain, vibration Backpack Yes Mass backpack (full) 3.38 kg With all accessories + one set of battery 64


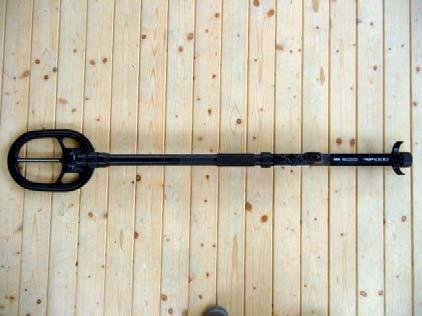
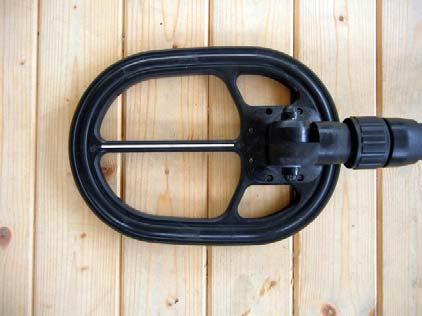
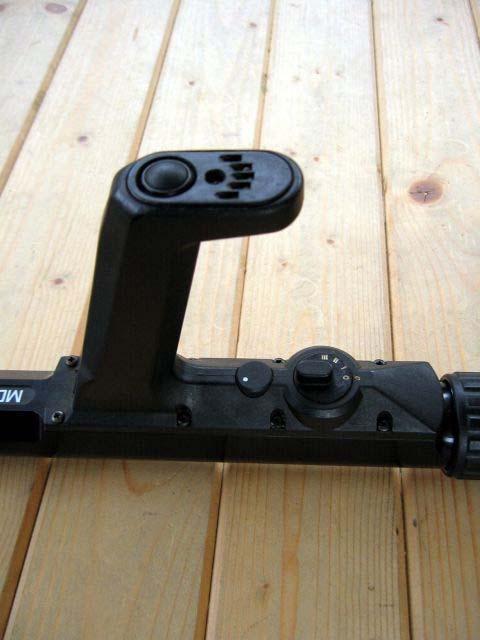
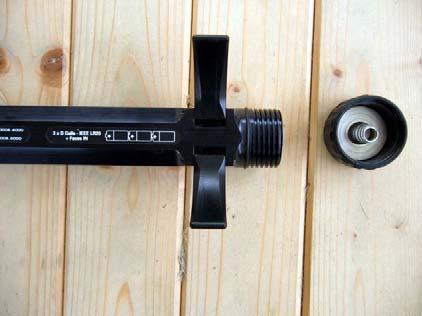
65 Pictures Guartel MD8+ 65

66 8.6 Inst. Dr. Foerster GmbH and Co. KG, metal detector Minex 2FD The MINEX 2FD is a compact, continuous wave, static mode metal detector. The bipolar waveform will avoid the initiation of magnetic igniters. It has a double D search head for easy and accurate pinpointing. Further the detector has: automatic ground compensation 3 fixed sensitivity levels volume control a reset feature if the background noise increases different audible signals for the detector status two different audio tones sounds, one for each part of the double D search head, for defining the target position The MINEX 2FD is the upgraded version of the 2FD The aspect is identical, except for a serial interface, and completely new internal hardware. See section 8.7 Plate FD during the trial Further technical details and pictures are added after the assessment. Detection height in air and depth in soil to PMN and PMN-2 Foerster MINEX 2FD Mines Figure 8-18 shows the achieved 600 maximum detection height/depth of the MINEX 2FD to the real mine 400 targets used during the trial. 200 The data of the in-air measurement look very consistent in their structure and PMN 0 PMN2 display the expected loss of sensitivity from L1 to L7,excluding the Gyata in -200 L4 in-air measurement. The worst losses of sensitivity with respect to the Lane in-air measurements were, for the PMN, % in air at L7 and 33% in soil L5. For the PMN-2, the corresponding Figure 8-18 In-air and in-soil sensitivity for mine targets values were 50% in L7in-air and 33% in-soil L5. Although the in-air data show a clearer and more consistent trend, it should not be concluded that they are necessarily more accurate than the data from the in-soil test, which is more realistic and complete. The in-soil results are, however, more difficult to interpret than the in-air data. in soil (mm) in air(mm In general, for both mines, the in-soil values are better in L3 than the maximum sensitivity in-air reference, which we are unable to explain. This is particularly apparent in the PMN-2 result for L2 to L 4. In air and in-soil, unexpected increase/loss at L4, that are contradicting. The PMN has in-air an increase of sensitivity and a loss for the in-soil measurement when for the PMN-2 the other way around. The concrete bed in L1 allowed only a burial depth of 340 mm (top of the target) so we are unable to say if deeper detection of the PMN was possible). 66
67 Table 8-13 MINEX 2FD & mine targets: percent change of sensitivity with respect to L1 maximum in-air value MINEX 2FD In-Air In-Soil Uncer Target Height in taintie Change with respect to Lane 1 height in-air value air s PMN 430mm 5% -9% 9% -19% -23% -40% 7% PMN-2 310mm -6% -11% -48% -27% -32% -50% 10% PMN -23% 2% 21% -23% -33% -7% -22% 9% PMN-2 6% 16% 16% 26% -33% -3% -16% 12% Both mines may be detected by the MINEX 2FD at the required standard depth of 130mm. Detection height in air and depth in soil to mine simulants The in-air data have a significant peak Foerster MINEX 2FD Simulants 350 in L2 for the Mo and Ko targets. Further, the detector loses sensitivity 250 significantly as magnetic susceptibility 150 increases for the in-air values from L1 Gyata R2M2 to L7. The in-soil data starts with 50 T72 higher values L1 for the T72 and Io R2M2 has an increase of sensitivity to -50 Ko Mo L3&L4 coming to zero for most of the -150 targets in L7, excluding the Gyata and the T The worst losses of sensitivity with -350 respect to the Lane 1 in-air Figure 8-19 In-air and in-soil sensitivity for simulants measurements were, for the Gyata 78% in air and 43% in soil, when set-up to Lane 7 for in-air and for in-soil measurements. For the T72, the corresponding values were 100% L4 and 93% L7 in air but only 7% in L7 in soil. The maximum losses for the R2M2 were 86% in-air for L4 and L7 and 100% in-soil to L7. The in-air results look consistent and indicate significant loss of sensitivity with increasing magnetic susceptibility. The detector achieved better average results for the in-soil measurements than the reference value in-air results, which we are not able to explain. The in soil data do not show the same steady trend as the in-air data and the differences cannot be explained by the known experimental uncertainties. In this respect, the in-soil results of Figure 8-19 are confusing. There are significant losses and increases of sensitivity, possibly connected with the fact that the detector is very sensitive to inhomogeneous ground and signals in the more complicated ground conditions, starting with L4. Individual ability of the operator may have had an additional influence.. Significant changes both above and below the in-air sensitivity occurred, even to the extent that the order of target detectability changed. The in-soil data demonstrate that the detector is not able to detect certain targets in L5 to L7, and so should not be used in similar conditions if these or similar targets are expected. The detector has, from L4, difficulties in detecting targets to the recommended standard: in L4 in soil the Io is not detected at 130mm and in L5 only the T 72 is detected at 130mm and in L6 only the Gyata, T72 and Mo. For L7 the detector could not compensate the ground and the results were achieved by lifting the detector above the ground: a technique that would not be allowed for these targets in clearance operations. in soil (mm) in air(mm 67
68 Table 8-14 MINEX 2FD & Simulants: percent change of sensitivity with respect to L1 maximum in-air value MINEX 2FD In-Air In-Soil Uncer Target Height in taintie Change with respect to Lane 1 height in-air value air s Gyata 230mm 4% -22% -65% -37% -39% -78% 14% T72 140mm -14% -46% -100% -68% -86% -93% 22% R2M2 140mm -7% -36% -86% -68% -71% -86% 22% Gyata -2% 9% 26% 26% -46% 22% -43% 16% T72 18% 89% 48% 114% 14% 43% -7% 25% R2M2 39% 18% 43% 7% -36% -28% -100% 25% Anomalously high sensitivity values in-soil of up to 114% above reference stand out. In-soil L1 to L4 for most targets higher sensitivity up to 114% was achieved when, in the higher numbered lanes, the loss was 100% to all of them in L7(no ground compensation). Good operators may still be able to use the detector in such conditions by reducing the sensitivity and raising the detector above the ground so that the signal or interference from the ground stops. We recommend that this technique is never used in normal clearance operations because it is too operator-dependent to be safe. Detection height in air and depth in soil to steel balls In Figure 8-20 the practical field tests Foerster MINEX 2FD Balls 350 show a few exceptions to the expected order in the in-soil measurements. 250 There is substantial loss of sensitivity from L1 to L7 if one looks at the results in air, which is worse in soil due to the higher results in L1. There is 12 an increase of sensitivity from L1 to L3. This is based on the results with -150 maximum sensitivity in air and the peak in L2 for the ball 15mm Significant losses in air and in soil begins with L4. The max losses in air -350 Figure 8-20 In-air and in-soil sensitivity for balls are 100% for 5mm, 82% for 7mm, 63% for 10mm, 63% for 12mm and 47% for 15mm. In-soil the maximum losses were in L7 and were 100%, 100%, 100%, 89%, and 3% respectively. The in-soil data were all better in L1 to L3 than the in-air data. in soil (mm) in air(mm During the 2 weeks of the training and trial, no difficulties in use or technical questions arose. The detector was unable to complete its automatic soil compensation process in L7. The physically different structures of the soils i.e. the stones as well as the magnetic properties produced difficulties for the operators by creating false alarms in the absence of metal. In general, signal interpretation with this detector is difficult when inhomogeneous ground conditions are combined with magnetic ground properties. It is possible that some points where the sensitivity appeared to be greater than the in-air reference may have been due to false alarms from the soil, in the lanes starting from L4. The loss of sensitivity with the increasing 68
69 electromagnetic properties of the ground was substantial, especially in the area of low metal content mines. 69
70 8.7 Inst. Dr. Foerster GmbH and Co. KG, metal detector Minex 2FD The MINEX 2FD is the new upgraded version of the described above. It has the same external appearance and general technical characteristics: it is a compact, one-piece, static mode metal detector with dual-frequency sinusoidal, bipolar waveform and double D search head. The differences are: new electronic hardware that retains the last setup to the ground conditions. serial interface for o software setup to local conditions o data logging. Because the set-up is retained in memory, if the user wishes to use the detector at maximum sensitivity, an in-air set up should be performed. Detection height in air and depth in soil to PMN and PMN-2 Foerster MINEX 2FD Mines Figure 8-21 shows the achieved 600 maximum detection height/depth of the MINEX 2FD to the real mine 400 targets used during the trial. 200 The maximum losses of sensitivity with respect to the L1 in-air PMN 0 PMN2 measurements were, for the PMN, - 53% in air and 44% in soil both at L For the PMN-2, the corresponding values were 62% in L7 in-air and 45% -400 in-soil L5. The data of the in-air measurement look very consistent in -600 their structure and display the expected Figure 8-21 MINEX in-air and in-soil sensitivity for loss of sensitivity from L1 to L7. In mine targets general, for both mines, the trend in the values is more complicated than that of the simpler in-air data, as with the The departures from a simple trend are beyond what can be explained by the known uncertainties This is particularly apparent in the PMN result. The PMN results for L6 in-soil and the PMN-2 increased sensitivity from L3 to L4 are surprising. The concrete bed in L1 allowed only a burial depth of 340 mm (top of the target) so we are unable to say if deeper detection of the PMN was possible in this lane. in soil (mm) in air(mm Table 8-15 MINEX 2FD & mine targets: percent change of sensitivity with respect to L1 maximum in-air value MINEX 2FD In-Air In-Soil Target Uncert Height in Change with respect to Lane 1 height in-air value ainties air PMN 490mm -6% 0% -39% -41% -43% -53% 6% PMN-2 340mm 0% 6% -44% -54% -44% -62% 9% PMN -33% -28% -6% -41% -43% -8% -44% 8% PMN-2-7% -18% -6% 6% -45% -12% -24% 11% 70
71 Both mines may be detected by the MINEX 2FD at the required standard depth of 130mm. Detection height in air and depth in soil to mine simulants The in-air data demonstrate consistently a Foerster MINEX 2FD Simulants 350 significant loss of sensitivity as magnetic susceptibility increases for the in-air 250 values from L1 to L7. The in-soil data do 150 not have this consistency and significant Gyata departures from a simple trend are R2M2 50 T72 present, including in the order of Io Ko detectability the targets. in soil (mm) in air(mm The maximum losses of sensitivity with respect to the Lane 1 in-air measurements -250 were, for the Gyata 76% in air when setup to L7 and 50% in soil L2. For the T72, -350 Figure 8-22 MINEX in-air and in-soil sensitivity for the corresponding values were 75% in simulants Lane 7 and 46% in L6. The maximum losses for the R2M2 were 68% in-air and 93% in soil, both for L7. The in-soil data demonstrate that for certain targets from L4 to L7 the detector is not able to maintain the recommended clearance depth of 130mm. The in soil data do not show the same steady trend as the in-air data and the differences cannot be explained by the known experimental uncertainties. There are significant losses and increases of sensitivity, possibly connected with the fact that the detector is still sensitive to inhomogeneous ground. Soil signals in the more complicated ground conditions, starting with L4, may have sometimes been misinterpreted as metal signals. Individual ability of the operator may have had an influence. The detector has, from L4, difficulties in detecting targets to the recommended standard. In L4, only the Gyata may be detected deeper than130mm. In L5 the Gyata, T 72 and Mo are detected at 130mm and in L6 the Gyata and Mo. For L7 this model could compensate the ground, which is an improvement on the previous version The L7 in-soil results shown here were obtained by normal handling of the detector, without raising it off the surface. Table 8-16 MINEX 2FD & Simulants: percent change of sensitivity with respect to L1 maximum in-air value MINEX Uncert 2FD Target Height in Change with respect to Lane 1 height in-air value ainties air Gyata 210mm 19% 17% -33% -48% -52% -76% 15% In-Air T72 140mm -7% 0% -57% -68% -36% -75% 22% R2M2 140mm -14% 18% -50% -61% -32% -68% 22% Gyata 31% -50% 2% 13% -29% 33% -38% 18% In-Soil T72 7% 6% 14% -20% 14% -46% 43% 25% R2M2 34% 29% 25% -66% -61% -71% -93% 25% Anomalously high sensitivity values in soil of up to 43% above in-air reference stand out but are much less than the equivalent values for the older model, version 4.500, where they were as great as 114% above in-air reference. Detection height in air and depth in soil to steel balls Mo 71
72 Figure 8-23 shows the ball size and Foerster MINEX 2FD Balls 350 detection height in air and depth in soil. In lab results in Ispra, the detection 250 height always increases with the size of 150 the target, confirmed here with the inair data. In Figure 8-23 the practical field tests show a few exceptions to this in the in-soil measurements but most of them are within the known Figure 8-23 MINEX in-air and in-soil sensitivity for balls uncertainties. There is significant loss of sensitivity from L1 to L7 if one is looking at the results in air, and a similar trend is seen in soil. There is an increase of sensitivity from L1 to L3 for the ball 10mm and 12mm balls. Significant losses in air and in soil begins with L4. In L7 the max losses in air are 79% for 5mm, 70% for 7mm, 61% for 10mm, 55% for 12mm and 61% for 15mm. In-soil, the L7 losses were 100%, 100%, 33%, 56% and 20% from 5 to 15mm balls, which were all maximum losses excluding the 12mm and 15mm balls, where the max losses were 68 % and 43% in L6. in soil (mm) in air(mm During the 2 weeks of the training and trial, no difficulties in use or technical questions arose. The detector was always able to complete its automatic soil compensation process, even in L7. But the physically different structures of the soils i.e. the stones as well as the magnetic properties still produced difficulties for the operators by creating false alarms without the presence of metal. Both the sensitivity and indication of the signals has been improved and made louder, so that it is easier to interpret. There is still a signal interpretation problem when inhomogeneous ground conditions are combined with magnetic ground properties, although it is reduced in comparison with the previous model. Some of the cases where sensitivity greater than in-air reference was recorded may have been due to misinterpretation of ground signals as metal signals. The loss of sensitivity with the increasing electromagnetic properties of the ground was substantial, especially in the area of low metal content mines. 72
73 Table 8-17 Technical data MINEX 2FD and MINEX 2FD Metal detector: MINEX 2FD and Working technology Sinus wave Two sinus waves, bipolar, frequency domain, static mode, induction separate sending and receive coils, double-d receive coil Price 2990 Euro Without VAT Operational aspects Min- Max shaft cm Continuously adjustable length Weight 2.6 kg Ground Yes Automatic after initiation compensation User interactions Target signals Audio 2 tone pinpointing System signals Audio/Visual Confidence click, low battery alarm (sound and LEDs) Access to software Yes for Equipment Design Design 1 piece design Search head ellipse,l:29, W:21 cm Double-D design Speaker/headphones Yes, internal/ Yes Batteries LR20 3 Package Operator manual Yes A4, not plasticized - English Instruction card No List of content Yes In manual Test piece Yes Case dimensions cm Case mass (full) 9.4 kg With all accessories + one set of battery Case type material Hard case plastic Protection Yes Dust, rain, vibration Backpack Yes Mass backpack (full) 3.75 kg With all accessories + one set of battery 73

74 Picture details MINEX 2FD & STEMD Field Trial Mozambique The has the same appearance except for a serial interface near the sensitivity switch 74

75 8.8 Minelab Pty. Ltd., metal detector F1A4 The F1A4 is a pulse, dynamic mode detector, using a unipolar waveform. A patented multiple pulse-width technology is used for improved soil compensation. Further, the detector has: automatic ground compensation fixed sensitivity a reset feature if the background noise increases noise cancel function so that detectors can adjust to the surrounding electromagnetic field including the work of nearby detectors plugging the earpiece will not switch off the integrated loudspeaker of the electronic unit. An optional earpiece which mutes the loudspeaker is also available different audible signals for the detector status as well as for target classification continuous confidence tone Plate8-24 F1A4 during the trial The Minelab design ensures that the operator does not accidentally change sensitivity whilst working. Further technical details and pictures are added after the assessment. Detection height in air and depth in soil to PMN and PMN-2 MINELAB F1A4 - Mines Figure 8-25 shows the achieved maximum 600 detection height/depth of the F1A4 to the real mine targets used during the trial. The 400 data of the in-air measurement look consistent in their structure and display 200 the expected loss of sensitivity from L1 to PMN 0 L7. The curves are relatively flat and PMN2 show that the general loss of sensitivity is -200 not too much influenced by the necessary ground compensation starting in L The maximum losses of sensitivity with respect to the Lane 1 in-air measurements -600 were, for the PMN, -20% in air when setup to L7 and -35% in soil L5. For the Figure 8-25 In-air and in-soil sensitivity for mine targets PMN-2, the corresponding values were - 18% in-air L5 and -33% in-soil L7. The loss of sensitivity in soil of 42% in L1 is based on the allowed burial depth that was limited to 340mm (top of the target) due to the concrete bed of the lane. So we were not able to establish if a deeper detection was possible. The in-soil data in Figure 8-25 from the practical field tests show a few exceptions to the in-air measurements. L1 for the PMN was explained above, further the detector loses sensitivity to L5 comes to higher sensitivity as in air in L6 within the known uncertainties and losing sensitivity in soil (mm) in air(mm 75
76 again in L7. Surprisingly the detector has its highest sensitivity to the PMN-2 in L4, where most detectors are significantly losing sensitivity. Table 8-18 Minelab F1A4 & mine targets: percent change of sensitivity with respect to L1 maximum in-air value Minelab Uncer F1A4 Target Height in taintie Change with respect to Lane 1 height in-air value air s In-Air PMN 430mm 7% -7% -14% -10% -21% -20% 7% PMN-2 390mm 3% -13% -13% -18% -15% -10% 8% PMN -42% -14% -2% -16% -35% 5% -16% 9% In-Soil PMN-2-22% -17% -10% 0% -10% -23% -33% 10% Both mines could be easily detected by the Minelab F1A4 at the required standard depth of 130mm under all available ground conditions at the trial site. Detection height in air and depth in soil to mine simulants The results are similar in general MINELAB F1A4 - Simulants 350 tendency to those shown in the graph for real mines. That is to say, the detector 250 loses sensitivity as magnetic susceptibility increases. In L6 where the 150 Gyata susceptibility decreases an increase of R2M2 50 T72 sensitivity is indicated. But the large Io increase of susceptibility between L6 and -50 Ko Mo L7 (from 636 to 2885 SI units) influenced on two targets (Gyata, R2M2) -150 only. The maximum losses of sensitivity -250 with respect to the Lane 1 in-air measurements were, for the Gyata, -24% -350 in air and 48% in soil, both when set-up Figure 8-26 In-air and in-soil sensitivity for simulants to L7, the same loss was in-air at L5. For the T72, the corresponding values were - 35% in-air L6 and -25% in-soil L1, when in L7-20% only. The maximum loss of sensitivity for the R2M2 were -27% in-air L6 and -47% in-soil L7. The increases of sensitivity for the Gyata and T72 in soil are highly anomalous in L4 and in L5 for the Gyata and we are unable to explain them. The detector has first difficulties to achieve the recommended clearance standard of 130mm with the simulants representing mines of the type R2M2, PMA 3, T72, M14, VS-1.6 by L4 to L7. An in-air increase of sensitivity is visible. The sensitivity loss concerning the standard clearance depth concerns mainly the R2M2 and the Io ITOP L5&6. The Kop ITOP is within the known uncertainties at the limits to the clearance standard. All other targets may be detected in all lanes to 130mm depth. in soil (mm) in air(mm 76
77 in soil (mm) in air(mm STEMD Field Trial Mozambique Table 8-19 Minelab F1A4 & Simulants: percent change of sensitivity with respect to L1 maximum in-air value Minelab Uncert F1A4 Target Height in Change with respect to Lane 1 height in-air value ainties air Gyata 250mm 4% 4% 0% -24% -12% -24% 12% In-Air T72 200mm -5% -13% -20% -23% -35% -20% 16% R2M2 150mm -3% -13% 0% -10% -27% -20% 21% Gyata -30% -22% -4% 16% -10% 12% -48% 15% In-Soil T72-25% -28% 15% 47% -20% 0% 20% 18% R2M2-10% -17% 7% -32% -40% -10% -47% 24% Anomalously high sensitivity values of to 47% above reference in-soil stand out in L4, L5 &L7 for the T72 and L4 for the target Gyata. Other measurements follow the general trend of losing sensitivity from L1 to L7, excluding the mentioned before. The loss of sensitivity to the R2M2 in-soil is not created by the amount of metal but by the type of used metal, stainless steel. The increase of sensitivity for the Gyata and T72 is a phenomenon we cannot explain. Similar cases of increased sensitivity appeared with other detectors and targets too. Detection height in air and depth in soil to steel balls In Figure 8-27 the practical field tests show MINELAB F1A4 - Balls 350 a few exceptions to the expected order in the in-soil measurements. But most of them 250 are within the known uncertainties. 150 The maximum losses in air are distributed 5 7 at different lanes, which vary from -5% in L1 for the 5mm, -28% for the 7mm, -24% L4 for the 10mm, -18% L4 for the 12mm to -17% L6 for the 15mm ball. In-soil the -150 maximum losses were correspondingly to mm L6-33%, 7mm L2-26%, 10mm L6-36%, 12mm L5-20%, and 15mm L6-25% These losses of sensitivity for the spheres Figure 8-27 In-air and in-soil sensitivity for balls are similar to the results for the minimum metal content simulants above. This may be due to their size and metal content being similar. For the in-soil data there two peaks one in L3 and one L7 where a significant increase of sensitivity to L1 or the lane before to most of the targets is shown. During the 2 weeks of the training and trial, no difficulties in use or technical questions arose. The detector had no problems in completing its automatic soil compensation process in all lanes and could well cope with the physically different structures of the soils i.e. the stones as well as with the magnetic properties. The signal interpretation is easy because of the relatively low background noise. The detector kept a good level of sensitivity to all lanes. The distribution of the maximum loss to different lanes may in this case be a part of the uncertainties we are not aware about. A possibility may be the used metal for the simulants. The loss of sensitivity with the increasing electromagnetic properties of the ground was significant but most of the used targets i.e. mines and simulants of mines could be detected in all lanes to 130mm depth. 77
78 Table 8-20 Technical data Minelab Metal detector F1A4 STEMD Field Trial Mozambique Metal detector: Minelab F1A4 Working technology Pulse induction Dynamic mode. Patented multiple pulse width technology for improved soil compensation, Price 1969 Euro Without VAT Operational aspects Min- Max shaft cm Continuously adjustable length Weight 3.1 kg With control box fitted to shaft Ground Yes Automatic after initiation compensation User interactions Target signals Audio System signals Audio/Visual Confidence tone, low battery alarm (sound and LED) Access to software Yes Via RS232 port Equipment Design Design 2 piece design. Control box can be fitted to shaft Search head circular, 21 cm Speaker/headphones Yes, internal/ Yes Batteries LR20 4 Package Operator manual Yes A5, not plasticized English, water proof, tear resistant Instruction card Yes Single A5 page, plasticized - English List of content Yes On the instruction card Test piece Yes Case dimensions cm Case mass (full) 8.6 kg With all accessories + one set of battery Case type material Hard case plastic Protection Yes Dust, rain, vibration Backpack Yes Mass backpack (full) 4 kg With all accessories + one set of battery 78


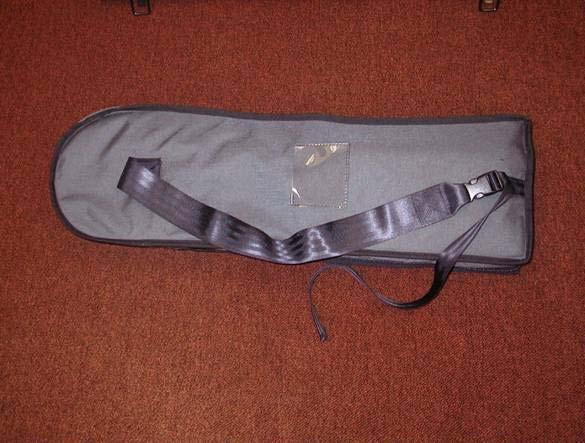
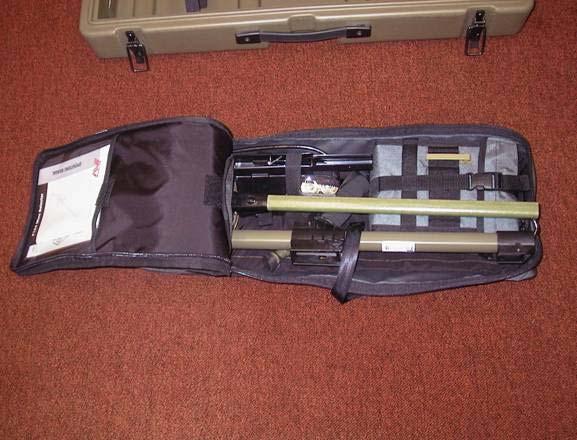
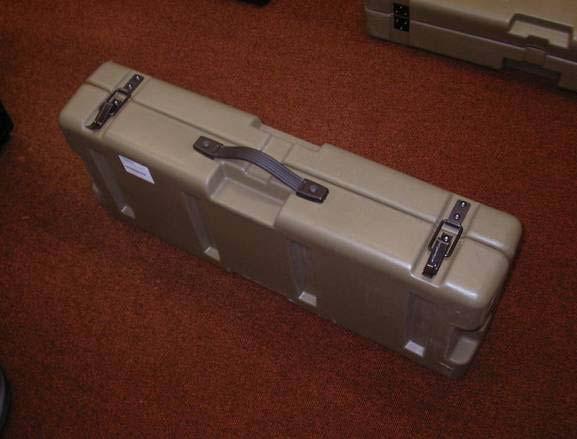
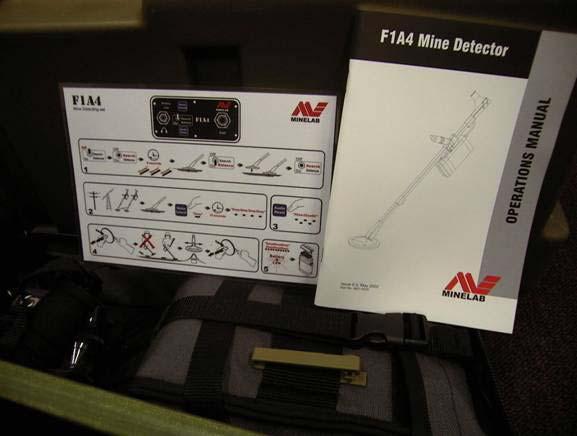
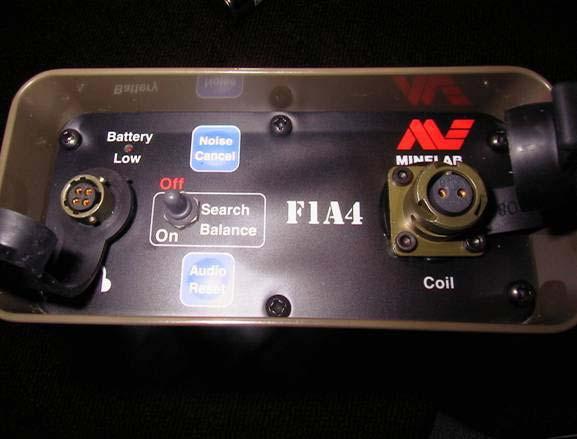
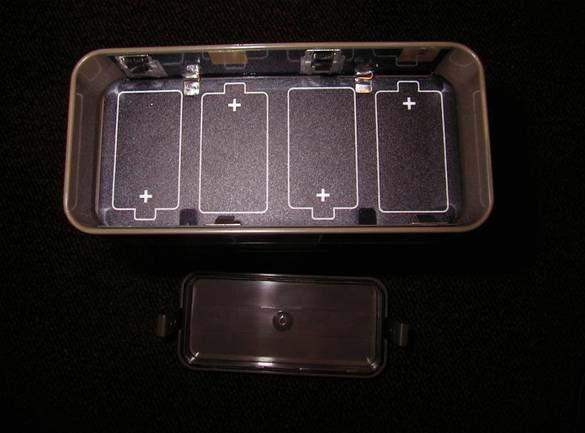
79 Picture details Minelab F1A4 79

80 8.9 Minelab Pty. Ltd., metal detector F3 The Minelab F3 is a compact one-piece, pulse dynamic mode detector. A patented multiple pulse-width technology is used for improved soil compensation. It uses bipolar pulses to avoid the ignition of magnetic fuzes. Further, the detector has: automatic ground compensation fixed sensitivity. This can only be changed by using special coloured caps which are fitted to the electronic unit. This approach avoids accidental changes of sensitivity during use a reset feature if the background noise increases earpiece that will not switch off the integrated loudspeaker of the electronic unit. Optionally, an earpiece that will mute the internal loudspeaker is available continuous confidence tone Further technical details and pictures are added after the assessment. Plate 8-28 Detector F3 during the trial Detection height in air and depth in soil to PMN and PMN-2 Figure 8-29 shows the achieved maximum MINELAB F3 - Mines 600 detection height/depth of the F3 to the real mine targets used during the trial. The 400 data of the in-air measurement look consistent in their structure and indicate 200 no or minimum loss of sensitivity for the PMN 0 in-air results. The curves are flat and PMN2 express that the general loss of sensitivity -200 is not really influenced by the necessary ground compensation starting in L The loss of sensitivity with respect to maximum sensitivity in-air measurements -600 is reduced to the Gyata and was -3% for Figure 8-29 In-air and in-soil sensitivity for mine targets the L3&L6. All other in air results are above the in air measurements. The maximum loss of sensitivity in soil of 18% in L1 is based on the allowed burial depth that was limited to 340mm (top of the target) due to the concrete bed of the lane. So we were not able to establish if a deeper detection was possible. The other loss of 16% in L5. The in-soil data in Figure 8-29 from the practical field tests show significant differences to the in-air measurements. L1 for the PMN was explained above, further the detector has a peak of sensitivity at L3 loses sensitivity to L5 another peak at L6 and losing sensitivity again in L7. For the PMN-2 the highest sensitivity as in-air as well as in-soil was measured in L4. This is similar to the F1A4 reaction and contrasts with the other detectors. in soil (mm) in air(mm 80
81 Table 8-21 Minelab F3 & mine targets: percent change of sensitivity with respect to L1 maximum in-air value Minelab Uncert F3 Target Height in Change with respect to Lane 1 height in-air value ainties air In-Air PMN 400mm 10% -3% 0% 8% -3% 3% 8% PMN-2 280mm 7% 7% 25% 13% 18% 7% 11% PMN -18% -9% 15% -10% -16% 13% -10% 10% In-Soil PMN-2 9% 10% 18% 39% 3% 7% -9% 13% The in-soil data are mirrored in-air measurements for the PMN-2 with the highest level of sensitivity in L4. The same but in a negative way can be said for the PMN, where the lowest level of sensitivity in air was measured the highest level in soil was achieved L3&L6. Both mines could be easily detected by the Minelab F3 at the required standard depth of 130mm under all available ground conditions at the trial site. Detection height in air and depth in soil to mine simulants MINELAB F3 - Simulants The results are similar in general tendency to those shown in the graph for real mines. In-air the detector loses only sensitivity to the Gyata in L2&L3. All 150 other results are above the values from Gyata maximum sensitivity in-air L1 and within R2M2 50 T72 the known uncertainties. The results of -50 Io the in-soil data are quite different. In L4 Ko Mo there is a peak for the Gyata and T72 and -150 in L5 the general negative peak in sensitivity. The large increase of -250 susceptibility from L6 to L7 (636 to SI units) influenced on the Gyata results Figure 8-30 In-air and in-soil sensitivity for simulants only. The other targets can be detected as in L6 or even deeper as there. The maximum losses of sensitivity with respect to the Lane 1 in-air measurements were, for the Gyata, -10% in air in L2&L3 and -38% in soil when set-up to L7. For the T72, a loss of sensitivity appeared only with -8% in-soil in L1, when in L7 -+58% were established, which we are not able to explain. A loss of sensitivity for the R2M2 was only with -45% in-soil L5. in soil (mm) in air(mm Table 8-22 Minelab F3 & Simulants: percent change of sensitivity with respect to L1 maximum in-air value Minelab Uncert F3 Target Height in Change with respect to Lane 1 height in-air value ainties air Gyata 210mm -10% -10% 0% 7% 14% 10% 15% In-Air T72 130mm 8% 8% 8% 12% 12% 15% 24% R2M2 100mm 20% 15% 10% 15% 20% 5% 31% Gyata -5% -32% -5% 38% -17% 7% -38% 18% In-Soil T72-8% 9% 42% 88% 8% 42% 58% 27% R2M2 5% 10% 45% 28% -45% 20% 25% 36% Anomalously high sensitivity values of to 88% above reference in-soil stand out in L3, L4, L6&L7 for the T72 and L4 for the target Gyata. The increases of sensitivity for the Gyata and T72 in soil are highly anomalous in L4 for the Gyata and for the T72 in four lanes, we cannot explain them but they are a general repetition of the F1A4 behaviour. The increase of sensitivity 81
82 for the Gyata and T72 is a phenomenon we cannot explain. Other measurements follow no pattern. Similar cases of increased sensitivity appeared with other detectors and targets too. The detector has difficulties to achieve the recommended clearance standard of 130mm with the simulant representing the mines of the type R2M2, R2M2, and the AT No8 (RSA) from L1 to L7. Two other simulants are to the limits of the 130mm but within the known uncertainties at some places. Detection height in air and depth in soil to steel balls In Figure 8-31 the practical field tests MINELAB F3- Balls 350 show a few exceptions to the expected order in the in-soil measurements. 250 The maximum losses in-air are all in L3, 150 which graduate from -22% for the 5mm, 5 7-8% for the -7mm, -3% for the 10mm, % for the 12mm to positive for the mm ball. In-soil the maximum losses were distributed to different lanes and -150 were correspondingly to 5mm L6-33%, mm L1-8%, 10mm L4-10%, and positive for 12mm and 15mm For the in-soil data there are two peaks Figure 8-31 In-air and in-soil sensitivity for balls one in L3 and one L7 where a significant increase of sensitivity to L1 or the lane before to most of the targets is shown. in soil (mm) in air(mm During the 2 weeks of the training and trial, no difficulties in use or technical questions arose. The detector had no problems in completing its automatic soil compensation process in all lanes and could well cope with the physically different structures of the soils i.e. the stones as well as with the magnetic properties. The signal interpretation is easy because of the low background noise. The detector kept a good level of sensitivity to all lanes and targets. The maximum loss to different lanes may in this case be a part of the uncertainties we are not aware about, and may be also connected with the metal used for the simulants. There are common pattern in the loss and increase of sensitivity between both Minelab detectors, F1A4 and F3. This is visible in all groups of targets that certain targets stand out in their results and repeated by the other detector. 82
83 Table 8-23 Technical data Minelab F3 Metal detector: Minelab F3 Working technology Pulse induction Static mode. Patented multiple pulse width technology for improved soil compensation, uses bipolar pulses to avoid the ignition of magnetic fuzes. Price 2450 Euro Without VAT Operational aspects Min- Max shaft cm Continuously adjustable length Weight 3.2 kg Ground Yes Automatic after initiation compensation User interactions Target signals Audio System signals Audio Confidence tone, low battery alarm, equipment faults Access to software Yes Via RS232 port Equipment Design Design 1 piece design. Search head circular, 21 cm Speaker/headphones Yes, internal/ Yes Speaker continues functioning when headphones plugged in. Optional earpiece which disables speaker is also available Batteries LR20 4 Package Operator manual Yes A5, not plasticized English, water proof, tear resistant Instruction card Yes Single A5 page, plasticized - English List of content Yes On the instruction card Test piece Yes Case dimensions cm Case mass (full) 11.9 kg With all accessories + one set of battery Case type material Hard case plastic Protection Yes Dust, rain, vibration Backpack Yes Mass backpack (full) 4.25 kg With all accessories + one set of battery 83

84 Picture details Detector F3 84

85 8.10 Schiebel Elektronische Geräte GmbH, metal detector ATMID The Schiebel ATMID is a continuous wave dynamic mode detector. Further, the detector has: Semi-automatic ground compensation continuous sensitivity control volume control different audio signals for the detector status as well as for target classification The Schiebel ATMID is built in the traditional way with a telescopic pole, the cable connected to the search head outside the pole, and a separate electronic box which can be fixed to the shaft with optional clips. The search head and the earphone are to be connected with the electronic box.. Further technical details and pictures are added after the assessment. Plate 8-32 ATMID during the trial Detection height in air and depth in soil to PMN and PMN-2 ATMID - Mines Figure 8-33 shows the achieved maximum 600 detection height/depth of the ATMID to the real mine targets used during the trial. 400 The data of the in-air measurement look 200 consistent in their structure and indicate loss of sensitivity from L1 to L7 as PMN 0 PMN2 expected. The in-air results have significant negative peak at L The maximum loss of sensitivity with respect to the L1 in-air measurements -400 were for the Gyata -35% in-air and -44% -600 in-soil both for L7 and was Figure 8-33 In-air and in-soil sensitivity for mine targets correspondingly for the PMN-2 in air - 35% L7 and in-soil -8%L4. The loss of sensitivity in soil of -21% in L1 may be based on the allowed burial depth that was limited to 340mm (top of the target) due to the concrete bed of the lane. So we were not able to establish if a deeper detection was possible. The in-soil data in Figure 8-33 from the practical field tests show significant differences to the in-air measurements. L1 for the PMN was explained above, further the detector has a peak of sensitivity at L3 loses sensitivity to L4 another peak at L5 and losing sensitivity again to L7. For the PMN-2 the highest sensitivity was in L2 with 38% above the highest sensitivity in-air. in soil (mm) in air(mm 85
86 Table 8-24 ATMID & mine targets: percent change of sensitivity with respect to L1 maximum in-air value ATMID Uncert Target Height in Change with respect to sensitivity height in-air value ainties air In-Air PMN 430mm 5% 9% -14% 1% -7% -35% 7% PMN-2 260mm 19% 21% 13% 10% 0% -35% 12% In-Soil PMN -21% -9% 16% -28% -7% -13% -44% 9% PMN-2 27% 38% 23% -8% 8% 1% 0% 14% Both mines could be easily detected by the ATMID at the required standard depth of 130mm under all available ground conditions at the trial site. Detection height in air and depth in soil to mine simulants The results are similar in general Schiebel ATMID - Simulants 350 tendency to those shown in the graph for real mines, i.e. the detector is losing 250 sensitivity from L1 to L7. The in-air 150 Gyata data show to peaks with significant R2M2 changes of sensitivity one in L3 another T72 50 Io in L5. The results of the in-soil data are Ko -50 Mo quite different. In general the detector is losing sensitivity from L1 to L5 has a -150 peak in L6. For two ITOPs (Io, Mo) the -250 loss from L1 goes to L6 and there is a peak for both at L7. The maximum -350 Figure 8-34 In-air and in-soil sensitivity for simulants losses of sensitivity with respect to the Lane 1 in-air measurements were all in L7, for the Gyata, -80% in-air and in-soil -35%, for the T72 in-air -88% and in-soil -75%, for the R2M2 100% in-air and -85% in-soil. in soil (mm) in air(mm Table 8-25 ATMID & Simulants: percent change of sensitivity with respect to L1 maximum in-air value ATMID Uncer Target Height in taintie Change with respect to Lane 1 height in-air value air s Gyata 200mm 20% 10% -28% -3% -10% -80% 16% In-Air T72 120mm -42% 21% -29% -8% -25% -88% 26% R2M2 100mm 0% 90% -20% 5% -20% -100% 31% Gyata 50% 25% -8% -15% -25% -3% -35% 19% In-Soil T72 125% 55% 59% -38% -20% 29% -75% 30% R2M2 58% 50% 25% 8% -40% 24% -85% 36% Anomalously high sensitivity values of to 125% above reference in-soil stand out in the first three lanes in air as well as in soil. The increase of sensitivity for all of the targets is a phenomenon we cannot explain. Similar cases of increased sensitivity appeared with other detectors and targets too. Changes in the order of the targets have no real influence on the general tendency of the sensitivity behaviour. 86
87 The detector has difficulties to achieve the recommended clearance standard of 130mm from L3 with the simulant representing R2M2, followed by the other targets in the following lanes. The only target that can be detected from L1 to L7 in the depth of 130mm is the Gyata. Detection height in air and depth in soil to steel balls The general tendency is the loss of Schiebel ATMID - Balls 350 sensitivity from L1 to L7 and that the in-soil data are better than the in-air data for the first three lanes partially to the 4 th lane too. In Figure 8-35 the practical 5 7 field tests show exceptions to expected order in the in-soil measurements The maximum losses in-air are all in L7, which vary from -100% for the 5mm, - 92% for the -7mm, -75% for the 10mm, -56% for the 12mm and -41% for the 15mm ball. In-soil the maximum losses -350 were all in L7 too, excluding 10mm in Figure 8-35 In-air and in-soil sensitivity for balls L6. The results were correspondingly to 5mm -63%, 7mm -95%, 10mm L6-32%, 12mm -37%, and 15mm -37%. For the in-air data there are two peaks one in L3 and one L5 where a significant increase of sensitivity to L1 or the lane before to most of the targets is shown. The in-soil data show a significant drop of sensitivity from L1 to L4, a certain stabilisation to L6 and a further drop in L7. in soil (mm) in air(mm During the 2 weeks of the training and trial, no difficulties in use or technical questions arose. The detector had no problems in completing its automatic soil compensation process in all lanes and could well cope with the physically different structures of the soils i.e. the stones as well as with the magnetic properties. The signal interpretation is easy because of the low background noise. The detector had a substantial loss of sensitivity from L1 to L7. There is a pattern in the loss and increase of sensitivity to the groups of targets. The L4 is the breaking point in sensitivity for in-soil data and the L3&L5 peaks in-air. General for all groups of targets is the higher sensitivity in the first three lanes. 87
88 Table 8-26 Technical data ATMID Metal detector: Schiebel ATMID Working technology Sinus wave Dynamic mode. Single frequency continuous wave, bipolar to induction avoid initiation of magnetic fuzes. Price 3050 Euro Without VAT Operational aspects Min- Max shaft 116,126,136 cm 3 fixed increments length Weight 1.5 kg Ground Yes Semi-automatic after initiation compensation User interactions Target signals Audio large metal alarm tone System signals Audio/Visual Confidence click, low battery alarm (audio+led) Access to software Equipment Design Design No 1-piece design. Control box can be fitted to shaft with optional clips Search head Circular, 26.5 cm Speaker/headphones optional / yes headphones can be used as speaker by turning volume up Batteries LR20 4 Package Operator manual Yes A5, not plasticized - English Instruction card Yes Single A5 page, plasticized - English List of content Yes Test piece Yes Case dimensions cm Case mass (full) 7 kg With all accessories + one set of battery Case type material Hard case metal Protection Yes Dust, rain, vibration Backpack Yes Mass backpack (full) 4.75 kg With all accessories + one set of battery 88

89 Picture details ATMID 89
 block, for detection of the non-metallic parts of the mine.")
90 8.11 Shanghai Research Institute of Microwave Technology, M90 metal detector The M90 is a continuous wave, dynamic mode detector. It has an integrated high frequency (GPR) block, for detection of the non-metallic parts of the mine. Further, the detector has: Possibility to operate either with or without the GPR no ground compensation continuously changeable sensitivity control volume control In these tests, the SHRIMT M90 was only operated in metal detector mode. The GPR was not tested. Plate 8-36 M90 during the trial assessment. The M90 is built in the traditional way with a telescopic pole, cable connected to the search head inside the pole, and a separate electronic box. The search head and the earphone are to be connected with the electronic box. The sensitivity is changeable by the operator. Further technical details and pictures are added after the Detection height in air and depth in soil for PMN and PMN-2 SHRIMT M90 - Mines Figure 8-37 shows the achieved 600 maximum detection height/depth of the 400 M90 to the real mine targets used during the trial. Both targets are, in comparison 200 to the other targets used, relatively easy PMN 0 to detect due to their high metal content. PMN2 The data of the in-air measurement look Figure 8-37 In-air and in-soil sensitivity for mine targets consistent in their structure and indicate loss of sensitivity from L1 to L7 as expected. The maximum loss of sensitivity with respect to the L1 in-air measurements were for the Gyata -44% in-air for L7 and -31% in-soil L5 and was correspondingly for the PMN-2 in air -42% L7 and in-soil no loss of sensitivity. The in-soil data have in general much less losses of sensitivity assessing the results from L1 to L7. The data in Figure 8-37 show for both mines a quite flat curve which is surprising for a detector without ground compensation. The sensitivity to the PMN keeps on a higher level than in L1 in all lanes excluding L5 where the maximum loss of sensitivity is -31% to the PMN. There is a significant decrease of sensitivity for the L3 to L5 and again in L7 for the PMN-2. in soil (mm) in air(mm 90
91 Table 8-27 M90 & mine targets: percent change of sensitivity with respect to L1 maximum in-air value M90 Uncert Target Height in Change with respect to Lane 1 height in-air value ainties air In-Air PMN 390mm -6% -5% -23% -21% -31% -44% 8% PMN-2 190mm 11% 5% -11% -16% -26% -42% 16% In-Soil PMN -21% -8% -13% -9% -31% -13% -12% 10% PMN-2 32% 50% 11% 3% 5% 38% 11% 20% Both mines could be easily detected by the M90 at the required standard depth of 130mm under all available ground conditions at the trial site. Detection height in air and depth in soil for mine simulants The in-air data are consistent, but the SHRIMT M90 - Simulants 350 results show that the detector has poor sensitivity for all targets in all lanes. The in-soil data are not consistent, swinging Gyata from low to high values for no obvious R2M2 reasons. The Gyata and R2M2 data are T72 Io the most consistent sets. The Ko and Mo Ko Mo are similar in their structure but the T72 and Io do not seem to fit in any pattern. The reason for this we see in the general low sensitivity of the detector and the necessary individual operator setup of -350 Figure 8-38 In-air and in-soil sensitivity for simulants the detector to the lanes. The mixture of the possibility to reduce sensitivity and to lift the detector to the moment when the ground interference stops is so manifold in its effect that is will be difficult to repeat this setup for another person. We would not recommend to use this detector where the mines simulated by the used targets are expected. in soil (mm) in air(mm Table 8-28 M90 & Simulants: percent change of sensitivity with respect to L1 maximum in-air value MD 90 In-Air In-Soil Uncer Target Height in taintie Change with respect to Lane 1 height in-air value air s Gyata 100mm 20% 20% -40% -10% -40% -55% 31% T72 30mm 83% 117% -33% 0% -100% -100% 104% R2M2 20mm 100% 125% -100% -75% -100% -100% 156% Gyata 38% 33% 40% 40% 0% 125% -63% 37% T72 225% 346% -100% 171% 417% 567% 167% 119% R2M2 388% 325% 325% 575% 350% -25% 0% 178% The detector has difficulties to achieve the recommended clearance standard of 130mm for all targets in one or the other lane. 91
92 Detection height in air and depth in soil to steel balls The general tendency is the loss of SHRIMT M90 - Balls 350 sensitivity from L1 to L7 and that the 250 in-soil data are better than the in-air data for the first three lanes partially to the th 5 lane too. In Figure 8-39 the practical field tests show exceptions to this in the in-soil measurements. The maximum losses in-air and in-soil -150 are all in L7 and for some targets -250 already before L7. The results differ for the 5mm -100% L6&L7, for the -7mm Figure 8-39 In-air and in-soil sensitivity for balls 975%, for the 10mm -40%, for the 12mm -61% and for the 15mm ball - 14%. In-soil the maximum losses were all in L7 too, excluding the 5mm in L4. The results were correspondingly to 5mm -100%, 7mm -22%, 10mm -25%, 12mm -72%, and 15mm -64%. For the in-air data there are two peaks one in L3 and one minor L5 for 12 and 15mm balls where a significant increase of sensitivity to L1 or the lane before to some targets is shown.. The peak in L5 is repeated in-soil for the 5, 7, and 15mm balls. The in-soil data show a significant drop of sensitivity from L1 to L4 for the three smaller balls, the peak at L5 and a further drop in L7. The in-soil data demonstrate also a much higher sensitivity in the first three lanes to most of the targets as the in-air data. in soil (mm) in air(mm During the 2 weeks of the training and trial, no difficulties in use or technical questions arose. The detector has no soil compensation and the operator had to reduce the sensitivity or to lift the detector to reduce the ground noise. A combination of both was quite effective but is also dangerous when used in real minefields, because it may result in missing mines. This specific set up can only be done for one target. The signal interpretation is not easy because a loss of height will create a signal that does not differ from ground noise. The detector has a low basic sensitivity to the group with the minimum metal content mines and substantial loss of sensitivity from L1 to L7. Therefore we would not recommend to use the detector where such mines are expected. There is a pattern in the loss and increase of sensitivity to the groups of targets. The L4 is the breaking point in sensitivity for in-soil data and the L3&L5 peaks in-air. General for all groups of targets is the higher sensitivity in the first three lanes. It is worth to be mentioned that the a slight move of the sensitivity knob around one millimetre may change the sensitivity essentially (during lab tests up to 40-60%) if the threshold to maximum sensitivity use is nearly achieved. 92
93 Table 8-29 Technical Data SHRIMT M90 Metal detector: SHRIMT M90 Dual-sensor sinus Single sinus wave, bipolar, frequency domain, dynamic mode. Working technology wave induction Integrated high frequency (GPR) block. MD and GPR Price Euro Without VAT Operational aspects Min- Max shaft cm continuously adjustable length Weight 3.3 kg Ground No compensation User interactions Target signals Audio System signals Audio Confidence click, low battery alarm Access to software No Equipment Design Design Search head Square, 26 cm Speaker/headphones no / yes Batteries LR6 10 Package Operator manual Yes A5, not plasticized - English Instruction card No Single A5 page, plasticized - English List of content No Test piece No Case dimensions cm Case mass (full) 9 kg With all accessories + one set of battery Case type material Hard case metal Protection Yes Dust, rain, vibration Backpack Yes Mass backpack (full) 4.25 kg With all accessories + one set of battery 93


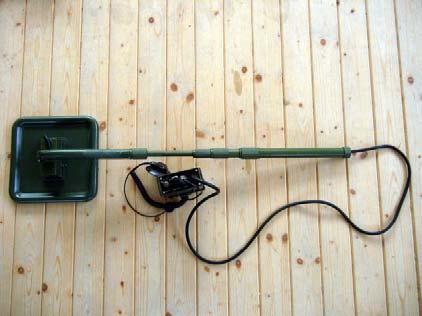
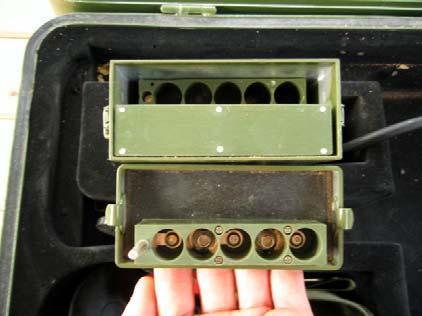
94 Picture details M90 94


95 8.12 Vallon GmbH, Detector VMH3 STEMD Field Trial Mozambique The Vallon VMH3/VMH3 (M) share the same appearance but the VMH3(M) has new software. They both are compact one piece dynamic detectors using time domain bipolar pulse wave to avoid the initiation of magnetic igniters. Plate 8-40 VMH3 and VMH3(M) during the trial Further, the detectors have: A specific difficult soil mode with automatic ground compensation. Compensation settings are kept. nearly continuously changeable sensitivity control via LED indication volume control a reset feature if the background noise increases different audio signals for detection signal, detector status but no confidence click detection signal can be indicated by one or any combination of the following: o audio signal o LEDs o vibration of the handle interface for software upgrade and data logging Further technical details and pictures are added after the assessment. Detection height in air and depth in soil to PMN and PMN Vallon VMH3 - Mines 600 Vallon VMH3 (M) - Mines in soil (mm) in air(mm PMN PMN2 in soil (mm) in air(mm PMN PMN Figure 8-41 In-air and in-soil sensitivity for mine targets Figure 8-41 shows the achieved maximum detection height/depth of the VMH3/VMH3 (M) to the real mine targets used during the trial. Both targets are, in comparison to the other targets used, relatively easy to detect due to their high metal content. The both graphs allow an easy and
96 direct comparison of the data and demonstrate the result of the software update. The data of the in-air measurement look consistent in their structure and indicate loss of sensitivity from L1 to L7 as expected for the in-soil data. The in-air results have significant peak at L4 for the Gyata for the VMH3. There is a very extreme increase of in-air sensitivity to all targets for the VMH3 (M). This will effect on the figures for the loss of sensitivity to the other lanes but curves indicate clearly that the sensitivity does not decrease as drastically as the figures indicate. The maximum loss of sensitivity for the VMH3 with respect to the L1 in-air measurements were for the Gyata -6% L2 in-air and -8% L4 in-soil and was correspondingly for the PMN-2 in air positive VMH3 all lanes, and in-soil -2 in L5. For the VMH3 (M) we will use a different approach due to the before mentioned extreme improved high in-air sensitivity. We will assess the maximum difference between the lanes which will in this case better express the changes of sensitivity between the lanes. This was in-air for the PMN 11% and for the PMN-2 only 5%. Accordingly the data in-soil were for the PMN 15% and for the PMN-18% of maximum change of sensitivity loss between all lanes. The loss of sensitivity in soil in L1 may be based on the allowed burial depth that was limited to 340mm (top of the target) due to the concrete bed of the lane. So we were not able to establish if a deeper detection was possible. The in-soil data in Figure 8-41 from the practical field tests show significant differences to the in-air measurements for the PMN. L1 for the PMN was explained above, further the detector has a peak of sensitivity at L4. The entire curve is mirrored in the opposite way in soil. Where a maximum sensitivity is in air a maximum loss of sensitivity is in soil. Where the sensitivity increase in-air the in-soil data decrease. Several other detector demonstrate a similar surprising result. Table 8-30 VMH3 & VMH3 (M) & mine targets: percent change of sensitivity with respect to L1 maximum in-air value VMH3 Uncert Target Height in Change with respect to Lane 1 height in-air value ainties air In-Air PMN 310mm -6% 10% 32% 5% 10% 16% 10% PMN-2 230mm 48% 43% 46% 30% 35% 35% 14% In-Soil PMN 10% 26% 35% -8% 32% 5% -8% 13% PMN-2 43% 50% 30% 4% -2% 30% 13% 16% VMH3 (M) In-Air In-Soil Target Uncert Height in Change with respect to Lane 1 height in-air value ainties air PMN 820mm -61% -61% -57% -52% -51% -50% 4% PMN-2 520mm -35% -35% -33% -35% -38% -37% 6% PMN -59% -56% -48% -63% -62% -63% -56% 5% PMN-2-37% -32% -38% -48% -47% -42% -50% 7% Both mines could be easily detected by both Vallon detectors at the required standard depth of 130mm under all available ground conditions at the trial site. 96
97 Detection height in air and depth in soil to mine simulants 350 Vallon VMH3 - Simulants 350 Vallon VMH3 (M) - Simulants in soil (mm) in air(mm Gyata R2M2 T72 Io Ko Mo in soil (mm) in air(mm Gyata R2M2 T72 Io Ko Mo Figure 8-42 In-air and in-soil sensitivity for simulants -350 The results are similar in general tendency to those shown in the graph for real mines, i.e. the detector is losing sensitivity from L1 to L7 in soil. The in-air data show two peaks with significant changes of sensitivity for the VMH3 one in L3 another in L7. The VMH3 (M) has a very different structure of the curves. The Gyata results are different to the other targets. There are for the other targets two peaks one in in-air, one in L4 another in L7. The results of the in-soil data are quite different. In general the VMH3 is losing sensitivity from L1 to L4 and further for most of the targets to L7, with three peaks for different lanes and targets (L4, L5,L7). For the VMH3 (M) the structure of the curves has changed two four peaks for L2 (Mo, Ko, R2M2), L4 (G, T72, R2M2), L6 (G, Mo, Io), and L7 (T72, R2M2). There were no losses of sensitivity for the VMH3 with respect to the maximum sensitivity in-air measurements, all results were better than the in-air. For the in-soil data of the VMH3 in L7-7% for the Gyata, -25% for the R2M2 were measured. The T72 results stayed in the in positive level with plus 9 % to maximum sensitivity. For the VMH3 (M) we will again compare the differences between the lanes, due to the before mentioned extreme improved high in-air sensitivity. We will assess the maximum difference between the lanes which will in this case better express the changes of sensitivity between the lanes. This was in-air for the Gyata 40% and for the T72 42 %, and R2M2 38%. Accordingly the data in-soil were for the Gyata 61% and for the T72 61%, and the R2M2 about 80%. i f we tak For both detectors significant changes of the results in-air and in-soil data were measured. The in-soil data again have significant differences in the results for the both detectors. Table 8-31 VMH3 & VMH3 (M) & Simulants: percent change of sensitivity with respect to L1 maximum in-air value VMH3 In-Air In-Soil Target Uncert Height in Change with respect to Lane 1 height in-air value ainties air Gyata 140mm 14% 89% 79% 57% 43% 43% 22% T72 110mm 36% 41% 55% 14% 9% 64% 28% R2M2 40mm 88% 113% 88% 25% 0% 125% 78% Gyata 119% 100% 39% 5% 16% 79% -7% 27% T72 173% 45% 77% 93% 9% 27% 64% 32% R2M2 200% 250% 138% 188% 94% 13% -25% 89% 97
98 VMH3 (M) In-Air In-Soil Target Uncert Height in Change with respect to Lane 1 height in-air value ainties air Gyata 320mm -13% -28% -34% -20% -34% -53% 10% T72 200mm -10% -23% -3% -18% -45% -5% 16% R2M2 250mm -32% -66% -68% -70% -80% -62% 12% Gyata 2% -23% -31% -9% -38% -13% -59% 12% T72 5% -16% -3% 41% -20% -8% 8% 18% R2M2-70% -28% -64% -53% -74% -87% -62% 12% An anomalously high sensitivity value of 250% above reference to maximum sensitivity for the VMH3 in-soil and in-air stands out. The increase of sensitivity for all of the targets for the VMH3 is a phenomenon we cannot explain. (An extreme result of 2500% was checked under lab conditions but could not be reproduced. ) Similar cases of increased sensitivity appeared with other detect ors and targets too. Changes in the order of the targets have no real influence on the general tendency of the sensitivity behaviour. Both detectors have difficulties to detect the R2M2 target to the standard depth of 130mm. Most of the targets can be detected but some of them are close to the limits as for the VMH3 the T72 L5 and Ko L6. The targets change for the VMH3 (M) to all ITOPs (Io,Ko,Mo) in L4 and to Io in L5. The phenomenon of the reversed reaction to the in air results appears for some targets Gyata, T72 in L4 for the VMH3 and for the VMH3 (M) with the Gyata, T72, and Mo again L4 and partially L6. Those targets are in their groups the biggest that reacts in this way. The T72 as a smaller one has an opposite direction to the bigger targets. Detection height in air and depth in soil to steel balls 350 Vallon VMH3- Balls 350 Vallon VMH3 (M) - Balls in soil (mm) in air(mm in soil (mm) in air(mm Figure 8-43 In-air and in-soil sensitivity for balls -350 The general tendency for the VMH3 is the increase of sensitivity from L1 to L7 in-air with three peaks L2, L4, L7.and the opposite in-soil. The general loss of sensitivity from L1 to L7 in-soil is interrupted by an opposite reaction to the in-air data of the smaller targets(5,7mm balls) in L6. For the VMH3 (M) we have three peaks in-air L1, L4, L7 and a general loss from L1 to L7. The in-soil data show a general loss of sensitivity from L1 to L7. There is a similar reaction in L6 as for the VMH3 but less significant. 98
99 There are no losses of sensitivity in air for the VMH3. The in-soil data where in general all better from L1 to 7 in comparison to the maximum in-air measurement excluding the 5mm ball in L7 with -25%, due to the low in air results. For the VMH3 (M) The general tendency and structure is similar excluding L1 with an extreme increase of in-air sensitivity. From L2 the data are at the same level as in air and decrease to L7. L6 has as well as the VMH3 a peak for the smaller targets. During the 2 weeks of the training and trial, no difficulties in use or technical questions arose. The detector had no problems in completing its automatic soil compensation process in all lanes. There were problems with background noise for the VMH3 on a significant higher level than with the VMH3 than with the VMH3 (M). The operator had to reduce the sensitivity down to 50% for the VMH3 to be able to work in the more complicated ground conditions from L4 upwards. Both detectors have still essential losses of sensitivity to the smaller targets. With increased metal content the sensitivity of the VMH3 (M) has an essentially reduced loss or even kept the level depending on the lane. The pattern of sensitivity of the detectors is similar but the VMH3 (M) curves are more flat. There is a pattern in the loss and increase of sensitivity to the groups of targets. The L4 and partially L6 are the breaking points in sensitivity for in-soil changes. For the VMH3 for all groups of targets is the higher sensitivity in-soil in respect to the maximum detection height in-air for the first three lanes. The VMH3 (M) achieves similar results in-soil in L1 but is losing less sensitivity in the other lanes. 99
100 Table 8-32 Technical data VMH3 and VMH3(M) Metal detector: Vallon VMH3 & VMH3(M) Working technology Pulsed induction Dynamic mode. Pulsed induction. Bipolar to avoid initiation of magnetic fuzes. Price 2420 Euro Without VAT - including optional headphone for VMH3 Operational aspects Min- Max shaft cm continuously adjustable length Weight 2.5 kg Ground Yes Separate mode, automatic after initiation compensation User interactions Target signals Audio/Visual/Vibration Any combination is possible; large metal tone System signals Audio/Visual/Vibration NO confidence click, low battery alarm Access to software Yes Data logging, system upgrade Equipment Design Design 1-piece design Search head Truncated ellipse cm /L:31, W:17 Speaker/headphones Yes, internal / yes Batteries LR20 3 high-capacity rechargeable batteries and charger provided with VMH3 Package Operator manual Yes A5, not plasticized - English Instruction card Yes List of content Yes In manual Test piece Yes Case dimensions cm Case mass (full) 5.45 kg With all accessories + one set of battery Case type material Padded soft case Plastic/Fabric Protection Yes Dust, rain, vibration Backpack Yes Mass backpack (full) 4.8 kg With all accessories + one set of battery 100
 and more LEDs on the control panel.")
101 Picture details VMH3 & VMH3 (M) The VMH3 (M) looks identical to the VMH3, the only difference being the colour (green) and more LEDs on the control panel. 101
102 9 Lessons learned The logistical organisation of a detector trial can be quite complicated. When detectors are to be sent to several different locations in turn to be tested, the project schedule is vulnerable to any unforeseen delays. An on-site update of the political, social, meteorological and logistical situation is necessary and may reduce the risk of a project failing. For example, this present trial was affected by a strike of deminers due to financial difficulties at ADP. We recommend that all steps are planned as thoroughly as possible, preparations begun and, if possible, contracts signed, about two months in advance of a field trial. Manufacturers should be informed as soon as it is certain the trial will go ahead. Key things to be arranged are: visas, vaccinations and security briefings for personnel; money transfers for contracted organisations including shippers and a cash reserve for contingencies; transport to country, transport in country and accommodation for personnel; safety precautions on site; communications with home base; insurance, customs permits, packing and storage for equipment. Planning of personnel should include a reserve for sickness or absence, especially when the overall numbers are small and the impact of an absence is greater. All this is in addition to the technical organisation of the trial, which is a quite separate question. 102
103 10 Conclusions Included CWA tests: CWA Test 8.4 Fixed depth detection tests in soil CWA Test 6.5 Minimum detectable target as a function of height CWA Test 6.6 Detection capability for specific targets in air The sensitivity loss from L1 to L7 for the detectors without GC was so large that some targets which could be comfortably detected to the required depth of 130mm in L1 could not be detected even much nearer to the surface in the higher numbered lanes. Therefore we would recommend not allowing the use of them where the soil properties are worse than L3. For detectors with very substantial sensitivity loss from L1 to L7, it is important that the users are aware about the ground conditions and check the reliability of the detector s detection ability to the expected mines in the working area. Even for the other detectors, the same precaution rules should be similar because the metal content and the reaction of the ground may be different to the conditions we could investigate here. The selected tests allowed a direct comparison of the sensitivity of the detectors to the chosen targets in seven different soil types. The in-air measurements with the set-up to all lanes, the measurement of the maximum height/depth to all targets in both media gave a set of data which raise some unexplained phenomenon, they are: The significant increase of sensitivity in other lanes, in comparison to the electromagnetically nearly neutral Lane 1, mainly for the second and third lane for eight detectors, with the exception of Minelab detectors that have increased sensitivity in all lanes excluding L4. Examples of opposing trends across the lanes in the in-air data and the in-soil data. For most targets and detectors, there are cases where a loss of sensitivity in-air coincides with an increase of sensitivity in-soil. Both results concern detectors of different technical design: continuous wave and pulse induction, frequency and time domain. All targets show generally higher sensitivity when measured in-soil than when measured in-air, with the detector set up to the soil, across all the lanes. The increase is not restricted to certain induction or detection principles (pulsed, CW etc.) but seems to be connected with the ground properties and/or the metal content of the used targets. Four detectors (MIL D1, 421 GC, ATMID, VMH3) show the increase of sensitivity only for two or three targets: the PMN2, Mo, and T72. In general, in-air maximum detection heights, measured with the detectors set-up to a particular ground, are not equal to the in-soil maximum detection depth in the same ground. There did not seem to be any simple and direct way to predict in-soil performance from the in-air measurements. At the time of writing, it appears that it is necessary to carry out in-soil measurements to obtain reliable in-soil data. Accordingly, this should be considered during the next CWA review along with the ground reference height technique described before (section 6.2). 103
104 11 Recommendations regarding detector use Based on the data measured during the trial and the difficulties experienced during use, we recommend that the detectors without GC are deployed only in ground conditions which are no more severe than those of L1 to L3. For those detectors it is very important to know what are the ground conditions in the area of deployment and which targets are expected. Of the detectors tested, both Minelabs, the EBEX 421GC and both Vallons have superior ground compensation abilities. For the Vallons, some loss of sensitivity with soil properties can still be discerned with the smaller targets. Minimum metal mines are still the main detection problem. Even the detectors with good soil compensation could not always detect the smaller targets to the required depth in all lanes. Ground magnetic properties (magnetic susceptibility, GRH) o These should be measured and recorded as a survey task because it has to be known for planning and proper use of the detector fleet (see decrease in detection capability with growing magnetic response in the test lanes). o Existing geological and soil maps should also be consulted. o It is also desirable for GRH data to be collated internationally. Training o Deminers should be trained to understand that the detector could detect only to a limited depth. The concept of the sensitivity cone, the idea that the footprint is narrower at greater depths, should be explained to them. o They should also understand that the orientation, size and shape of the target affect the signal strength. 104


105 12 Annexes 12.1 ANNEX A Additional Training Exercises One of the objectives of the trial was to train the local staff in the use of the CWA. To this end, training was also included in sensitivity profile measurement and pinpointing precision measurement, which were not themselves performed in the trial. These two tests are intended for evaluation of detectors and are included in the CWA for that reason. But they also are very useful as training exercises in detector handling, because they reveal the spatial behaviour of the detector i.e. how it responds to targets at different locations in the neighbourhood. The exercises were therefore also helpful to ensure the operators knew how to handle the detectors in the trial. Sensitivity Profile (CWA Test 6.7) The sensitivity profile (also named sensitivity cone or area, footprint ) is the region within which a detector can detect a particular object. Unfortunately, this concept is not familiar to many people working in the field. The practical importance of the footprint for establishing the advance of the search head during the search for mines, or the ability to detect a target or not are often not known to deminers or their supervisors. The three main factors determining the profile are: the sensitivity of the detector (technical solutions), the metal content of the target, the ground compensation ability of the detector. Plate 12-1 Determination of the cone s width / depth Plate 12-2 The same but with a dynamic detector difficult ground conditions surprised most of the participants. The establishment of the sensitivity profile gave a threedimensional understanding about the detection ability to different targets. By using a 5mm steel ball, the fuze of the R2M2 (Plate 12-1), or the PMN mine and repeating it in the different soil types, the deminers were able to see for themselves that not all detectors can deal with all types of ground. The reduction of the sensitivity to the targets in the more 105
106 Pinpointing (CWA Test 9.2 Target location accuracy) Pinpointing the source of the detector signal was demonstrated to the participants of the training and the main attention focused to the differences in pinpointing between a Double-D search head and other detectors. Pinpointing the source of the signal increases efficiency and safety of the deminers, but the accuracy of pinpointing is not just dependent on the deminer s skills. The metal content of the target and depth of it, the particular detector, and the operator s ability all affect the potential for accuracy. In laboratory conditions a well-trained technician may achieve an accuracy of a few millimetres but it may not be realistic to pinpoint with an accuracy greater than 40mm with the same detector in the field. This level of accuracy is usually still acceptable because it is within the radius of the smallest mine. A double D search-head can increases pinpointing accuracy. The zero line in the middle of the search head allows an easy and accurate pinpointing from two directions. With other detectors, approaching from each side is usually enough to allow the centre of the target to be determined as shown below. Figure 12-3: Pinpointing with simple search head (a), and double-d (b) 106
 Weight (g): Explosive (g): Expl.")
 Weight (g): Explosive (g): Expl.")
: Operating pressure (kg): Diameter (mm): Height (mm): Operating pressure (kg): 112 56")
: Height (mm): Operating pressure (kg): 78 38 5-10 AP R2M1 (2), (AT No.")
 Diameter (mm): Height (mm): Operating pressure(kg): 69 57 3-7 Weigh")
 : Height(mm) : Operating pressure(kg) : 56 40 9-16 AP PMA-3")
 : Height (mm): Operating pressure(kg): 111 40 8-20 AT VS-1.")
107 12.2 ANNEX B - Mines and simulated mines 6 Used Target Type Mines Rendered safe Local Technical Information AP PMN (Russia) Weight (g): Explosive (g): Expl.Type: TNT AP PMN-2 (Russia) Weight (g): Explosive (g): Expl.Type: TNT/ RDX AP Gyata-64 (Hungary) Weight (g): Explosive (g): Expl.Type: AP T72 (China) TNT Diameter (mm): Height (mm): Operating pressure (kg): Diameter (mm): Height (mm): Operating pressure (kg): Diameter (mm): Height (mm): Operating pressure (kg): Weight (g): Explosive (g): Expl.Type: TNT Diameter (mm): Height (mm): Operating pressure (kg): AP R2M1 (2), (AT No.8 same fuze) (RSA) Simulants Industrial Weight (g): Explosive (g): Expl.Type: RDX/wax AP M14 (USA) Diameter (mm): Height (mm): Operating pressure(kg): Weigh (g)t: Explosive (g): Expl.Type: Tetryl Diameter(mm) : Height(mm) : Operating pressure(kg) : AP PMA-3 (Yugoslavia) ITOP (inserts) Io Weight (g): Explosive (g): Expl.Type: Tetryl Diameter (mm) : Height (mm): Operating pressure(kg): AT VS-1.6 (Italy) Weight (kg): Explosive (kg): Expl.Type: TNT/ RDX Diameter (mm): Height (mm): Operating pressure:(kg) The technical data about the mines were taken from Jane s Mines and Mine Clearance Sixth Edition ; the pictures of the mines are from ORDATA Online James Madison University 107
: Height (mm): Operating pressure (kg): 78 38 5-10 AT TMA-4 (Yugoslavia) Ko Weight (kg): Explosive (kg): Expl.Type: 6 5.")
: Height (mm): Operating pressure (kg): 332 94 332 Mo AT Vs-2.2 (Italy) Weight (kg): Explosive (kg): Expl.Type: 3.5 2.")
: Height (mm): Operating pressure (kg): 330 101 200-450 South Africa Used Fuze Assembly Datasheet Used in mine types: AP R2M1 (2), AT")

108 Used Target Type Technical Information AP T72 (China) Weight (g): Explosive (g): Expl.Type: TNT Diameter (mm): Height (mm): Operating pressure (kg): AT TMA-4 (Yugoslavia) Ko Weight (kg): Explosive (kg): Expl.Type: TNT Diameter (mm): Height (mm): Operating pressure (kg): AT M19 (USA) Simulants ITOP (inserts) Weight (kg): Explosive (kg): Expl.Type: TNT/ RDX Diameter(mm): Height (mm): Operating pressure (kg): Mo AT Vs-2.2 (Italy) Weight (kg): Explosive (kg): Expl.Type: TNT/ RDX AT Pt MiBa-III (Czechoslovakia) Diameter (mm): Height (mm): Operating pressure (kg): Weight (kg): Explosive (kg): Expl.Type: TNT Diameter (mm): Height (mm): Operating pressure (kg): South Africa Used Fuze Assembly Datasheet Used in mine types: AP R2M1 (2), AT No.8 Fuze mechanism type Spring-driven, ball retained Item Description Quantity Dimensions (mm) Material Mass (mg) Diameter Length 1 Ball bearing 3 3,2 Chrome steel Spring (outer) 1,0 (wire) 12,5 normal 9,5 (compressed) Spring steel Striker pin 1 0,5 (tapered) 10,0 316 Stainless 187 steel 4 Detonator tube 1 7,0, 0,5 wall thickness 7,5 Aluminium 217 Total metal content 1,582g 108
SUMMARY OF METAL DETECTOR TRIAL REPORT UN MINE ACTION PROGRAMME AFGHANISTAN February - March 2002
 SUMMARY OF METAL DETECTOR TRIAL REPORT UN MINE ACTION PROGRAMME AFGHANISTAN February - March 2002 The SPD-Mine Action Unit of UNOPS conducted a tender for metal detectors in February 2002 for the procurement
Final Business Plan for a CEN Workshop on
 1/6 Final for a CEN Workshop on Humanitarian Mine Action - Test and evaluation - Metal detectors - Part 2: Soil characterisation for metal detector and ground penetrating radar performance TABLE OF CONTENTS
FIELD USER GUIDE CEN WORKSHOP AGREEMENT 14747:2003. Berlin August 2008
 FIELD USER GUIDE CEN WORKSHOP AGREEMENT 14747:2003 Berlin August 2008 Dieter Guelle, Mate Gaal Foreword The document has been written as a standard like document for supporting persons working in the field.
Technical Note No. I Development of Tests for Measuring the Detection Capabilities of Metal-Detectors
 Technical Note No. I.03.168 Development of Tests for Measuring the Detection Capabilities of Metal-Detectors T.J. Bloodworth November 2003 i Distribution List Internal (Humanitarian Security Unit) Sieber
Advances in Multisensor Mine Detectors. A presentation for the UN Workshop, GICHD Geneva, February 2006
 Advances in Multisensor Mine Detectors A presentation for the UN Workshop, GICHD Geneva, February 2006 Ian Dibsdall Overview 2 Background to multisensor detectors ITEP History Development Advantages /
A CEN Workshop Agreement on soil characterisation for metal detector and ground penetrating radar performance. Test and evaluation
 A CEN Workshop Agreement on soil characterisation for metal detector and ground penetrating radar performance Yann Yvinec Chair of CEN Workshop 7 Royal Military School, Belgium Yvinec@elec.rma.ac.be Test
English version. Humanitarian mine action - Test and evaluation - Part 1: Metal Detectors
 CEN WORKSHOP CWA 14747-1 June 2003 AGREEMENT ICS 95.020 English version Humanitarian mine action - Test and evaluation - Part 1: Metal Detectors This CEN Workshop Agreement has been drafted and approved
DETECTOR SYSTEMS METAL DETECTORS
 DETECTOR SYSTEMS METAL DETECTORS BGIF GTL115-2 Beijing Geological Instrument Factory China GENERAL DESCRIPTION The Beijing Geological Instrument Factory (BGIF) has manufactured precision instruments for
Quest metal detector intermediate tests
 UNCLASSIFIED Quest metal detector intermediate tests Ian M Dibsdall, David J Allsopp and Steven M Bowen QinetiQ/FST/TR042527 May 2004 Copyright QinetiQ ltd 2004 Administration page Customer Information
IMAS nd Edition Director, United Nations Mine Action Service (UNMAS), DC2 0650, United Nations, New York, NY 10017, USA
, DC2 0650, United Nations, New York, NY 10017, USA") 2 nd Edition 2003-01-01 Marking Mine and UXO hazards Director, United Nations Mine Action Service (UNMAS), DC2 0650, United Nations, New York, NY 10017, USA E-mail: mineaction@un.org Telephone: (1 212)
2 nd Edition 2003-01-01 Marking Mine and UXO hazards Director, United Nations Mine Action Service (UNMAS), DC2 0650, United Nations, New York, NY 10017, USA E-mail: mineaction@un.org Telephone: (1 212)
Geneva. International Centre. for Humanitarian. Demining
 Geneva International Centre for Humanitarian Demining The GICHD is an international expert organisation, legally based in Switzerland as a nonprofit foundation. It was established by Switzerland and several
English version. Humanitarian Mine Action - EOD Competency Standards - Part 4: Competency for EOD level 4
 CEN WORKSHOP CWA 15464-4 December 2005 AGREEMENT ICS 95.020 English version Humanitarian Mine Action - EOD Competency Standards - Part 4: Competency for EOD level 4 This CEN Workshop Agreement has been
SYSTEMS FOR UXO AND LANDMINE DETECTION
 SYSTEMS FOR UXO AND LANDMINE DETECTION FOERSTER THE COMPANY FOERSTER THE COMPANY FOERSTER is Non-Destructive Testing, Metal Detection, Magnetics FOERSTER stands for the highest quality standards. For precision
FINAL REPORT ON THE 4 TH JOINT CROSS-BORDER EMC MARKET SURVEILLANCE CAMPAIGN (2011) LED LIGHTING PRODUCTS
 LED LIGHTING PRODUCTS") FINAL REPORT ON THE 4 TH JOINT CROSS-BORDER EMC MARKET SURVEILLANCE CAMPAIGN (2011) LED LIGHTING PRODUCTS 1 CONTENTS S/N ITEM PAGE A. EXECUTIVE SUMMARY 3 B. ELEMENTS OF THE CAMPAIGN 5 1. Reasons for the
FINAL REPORT ON THE 4 TH JOINT CROSS-BORDER EMC MARKET SURVEILLANCE CAMPAIGN (2011) LED LIGHTING PRODUCTS 1 CONTENTS S/N ITEM PAGE A. EXECUTIVE SUMMARY 3 B. ELEMENTS OF THE CAMPAIGN 5 1. Reasons for the
THE ALBANIAN MINE ACTION PROGRAMME
 THE ALBANIAN MINE ACTION PROGRAMME Clearance of mine/uxo contaminated areas in Northeast Albania Presented by Arben Braha, AMAE Director MINE CONTAMINATED AREAS The threat emanated from the Kosovo conflict;
Mine Action Technologies
 Mine Action Technologies 11 May 2006 Report of Expert Working Group Outline Introduction Mine Action Technology news Importance of Publications Current issues Key challenges Useful information 1 Some thoughts
C-NRPP Quality Assurance Guidance for Radon Test Devices
 C-NRPP Quality Assurance Guidance for Radon Test Devices Table of Contents: 1. Purpose 2. Definitions 3. Quality Assurance Plan 4. Calibration 5. Spikes/Performance Tests 6. Duplicates 7. Blanks 8. Cross-Checks
This document is a preview generated by EVS
 INTERNATIONAL STANDARD ISO 18738-2 First edition 2012-10-15 Measurement of ride quality Part 2: Escalators and moving walks Mesure de la qualité de déplacement Partie 2: Escaliers mécaniques et trottoirs
ELECTRICAL IMPEDANCE TOMOGRAPHY
 Appendix I ELECTRICAL IMPEDANCE TOMOGRAPHY Philip Church, Neptec Design Group BASIC PRINCIPLES Electrical impedance tomography (EIT) is a technology developed to image the electrical conductivity distribution
Estimating the Level of Free Riders in the Refrigerator Buy-Back Program
 Estimating the Level of Free Riders in the Refrigerator Buy-Back Program Diane M. Fielding, B.C. Hydro An impact evaluation, conducted in 1993 on B.C. Hydro s Refrigerator Buy-Back Program, employed an
Securing Your World. Who we are. What we do
 Securing Your World G4S Risk Management is a leading provider of risk mitigation, secure support services and integrated solutions to governments, international agencies and multinational corporations,
Reported Fires in High-Rise Structures in Selected Occupancies with and without Automatic Extinguishing Systems by Extent of Smoke Damage
 Reported Fires in High-Rise Structures in Selected Occupancies with and without Automatic Extinguishing Systems by Extent of Smoke Damage Marty Ahrens Fire Analysis and Research Division National Fire
IMAS Marking mine and ERW hazards
 01 January 2003 Amendment 4, June 2013 Marking mine and ERW hazards Director, United Nations Mine Action Service (UNMAS), 380 Madison Avenue, M11023, New York, NY 10017 USA Email: mineaction@un.org Telephone:
INTERNATIONAL STANDARD
 INTERNATIONAL STANDARD IEC 60533 Second edition 1999-11 Electrical and electronic installations in ships Electromagnetic compatibility Installations électriques et électroniques à bord des navires Compatibilité
PROM 1 anti-personnel landmines Possibility of activation by physical contact with a metal detector
 EUROPEAN COMMISSION DIRECTORATE GENERAL JRC JOINT RESEARCH CENTRE Technical note N S.P.I.01.29 PROM 1 anti-personnel landmines Possibility of activation by physical contact with a metal detector Authors:
TESTS OF ADSIL COATING
 TESTS OF ADSIL COATING Test B - Long Term Test FSEC-CR-1259-01 July 11, 2001 Prepared for: Bob Suggs Florida Power & Light Company 9250 W. Flagler Street Miami, Florida 33174 Principal Investigator Dr.
BUSINESS PLAN CEN/TC 249 PLASTICS
 Page: 1 BUSINESS PLAN CEN/TC 249 PLASTICS 1 BUSINESS ENVIRONMENT OF THE CEN/TC 1.1 Description of the Business Environment The following political, economic, technical, regulatory, legal, societal and/or
Living with World Heritage in Africa
 INTERNATIONAL CONFERENCE Living with World Heritage in Africa [26 26-29 September 2012] South Africa BACKGROUND DOCUMENT The Government of the Republic of South Africa, in collaboration with the African
Remote Monitoring of Offshore Structures using Acoustic Emission.
 11th European Conference on Non-Destructive Testing (ECNDT 2014), October 6-10, 2014, Prague, Czech Republic Remote Monitoring of Offshore Structures using Acoustic Emission. More Info at Open Access Database
Brine Generation Study
 DOE/WIPP 00-2000 Brine Generation Study April 2000 Waste Isolation Pilot Plant Carlsbad, New Mexico Processing and final preparation of this report was performed by the Waste Isolation Pilot Plant Management
PRESSURE-ENTHALPY CHARTS AND THEIR USE By: Dr. Ralph C. Downing E.I. du Pont de Nemours & Co., Inc. Freon Products Division
 INTRODUCTION PRESSURE-ENTHALPY CHARTS AND THEIR USE The refrigerant in a refrigeration system, regardless of type, is present in two different states. It is present as liquid and as vapor (or gas). During
Tests and Evaluation of Dual Sensor Mine Detectors based on a Combination of Metal Detector and Ground Penetrating Radar (TEDS)
") AIDCO-JRC Administrative Arrangement No.: MAP/2004/078-257 Tests and Evaluation of Dual Sensor Mine Detectors based on a Combination of Metal Detector and Ground Penetrating Radar (TEDS) Adam M Lewis Institute
AIDCO-JRC Administrative Arrangement No.: MAP/2004/078-257 Tests and Evaluation of Dual Sensor Mine Detectors based on a Combination of Metal Detector and Ground Penetrating Radar (TEDS) Adam M Lewis Institute
CEE:3371 Principles of Hydraulics and Hydrology Project #2 Flow Measurement with a Weir
 CEE:3371 Principles of Hydraulics and Hydrology Project #2 Flow Measurement with a Weir Problem Statement The Iowa DNR plans to monitor a proposed prairie restoration project in eastern Iowa as an experiment.
Fire Sprinklers Working Group Final Report
 Introduction The Building Act received Royal Assent on March 25, 2015. The Act aims to establish more consistent building requirements across British Columbia and create a more robust and modern building
Quality Assurance/ Quality Control. Topic 4 - Audio 46. Key Points
 Topic 4 - Audio 46 Key Points : Measures taken to increase confidence in results. Quality Assurance: Program that assures that measures are being done and in a timely manner. Precision: How close measurements
DRAFT Subject to Modifications
 TREASURE COAST REGIONAL PLANNING COUNCIL M E M O R A N D U M To: Council Members AGENDA ITEM 8 From: Date: Subject: Staff May 19, 2017 Council Meeting Florida Department of Transportation Complete Streets
Video Smoke Detection using Deep Domain Adaptation Enhanced with Synthetic Smoke Images
 Video Smoke Detection using Deep Domain Adaptation Enhanced with Synthetic Smoke Images Gao Xu, Qixing Zhang, Gaohua Lin, Jinjun Wang, Yongming Zhang State Key Laboratory of Fire Science, University of
Functional Safety: the Next Edition of IEC 61511
 HazAus2015/1507 Functional Safety: the Next Edition of IEC 61511 Mirek Generowicz Engineering Manager I&E Systems Pty Ltd Level 2, 445 Hay Street Perth WA 6000 Abstract The functional safety standard IEC
Grower Summary PO 005
 Grower Summary PO 005 Column stocks (cut-flowers): An Investigation into the cause(s) of poor establishment, growth and flower uniformity in commercial crops. Annual 2011 Disclaimer AHDB, operating through
Cotswolds AONB Landscape Strategy and Guidelines. June 2016
 Cotswolds AONB Landscape Strategy and Guidelines June 2016 Cotswolds AONB Landscape Strategy and Guidelines Introduction The evolution of the landscape of the Cotswolds AONB is a result of the interaction
PD240 NEW GENERATION WIDE SEARCH AREA HAND HELD METAL DETECTION SET
 PD20 NEW GENERATION WIDE SEARCH AREA HAND HELD METAL DETECTION SET NIJ-0602.02 Compliant Certified according to EU Regulation on Civil Aviation Security NSN: 666515011797 FEATURES NIJ-0602.02 Standard
PD240 NEW GENERATION WIDE SEARCH AREA HAND HELD METAL DETECTION SET FEATURES
 PD240 NEW GENERATION WIDE SEARCH AREA HAND HELD METAL DETECTION SET FEATURES NIJ-0602.02 Standard Compliant Wide Search Area for Faster and Accurate Screening Operations Elegant, Robust and Ergonomic High
Link loss measurement uncertainties: OTDR vs. light source power meter By EXFO s Systems Engineering and Research Team
 Link loss measurement uncertainties: OTDR vs. light source power meter By EXFO s Systems Engineering and Research Team INTRODUCTION The OTDR is a very efficient tool for characterizing the elements on
Metal Detectors. and PPE. Catalogue 2007
 Metal Detectors and PPE Catalogue 2007 The Geneva International Centre for Humanitarian Demining (GICHD) strives for a world free of antipersonnel mines and from the threat of other landmines and explosive
Model Number Structure
 Element Burnout Detector Accurate Detection of Element Burnout Regardless of Capacities Accurately detects a burned heater element or elements incorporated by a molding machine or packing machine and outputs
Consolidated Workshop Proceedings Report
 Consolidated Workshop Proceedings Report Regional Workshop on Urban Risk Damascus, Syria, November 4. 5. 2009 UNISDR, the Global Facility for Disaster and Recovery (GFDRR) of the World Bank, UNDP Syria
INTERNATIONAL STANDARD
 INTERNATIONAL STANDARD IEC 61511-2 First edition 2003-07 Functional safety Safety instrumented systems for the process industry sector Part 2: Guidelines for the application of IEC 61511-1 Reference number
RaySense. Fiber Optic Distributed Acoustic Sensing for Pipeline Security and Leak Detection
 RaySense Fiber Optic Distributed Acoustic Sensing for Pipeline Security and Leak Detection 1 PIPELINE MONITORING AND SECURITY The oil & gas industry is currently facing a serious challenge in assuring
INTERNATIONAL STANDARD
 INTERNATIONAL STANDARD IEC 61508-2 First edition 2000-05 BASIC SAFETY PUBLICATION Functional safety of electrical/electronic/ programmable electronic safety-related systems Part 2: Requirements for electrical/electronic/
Official Journal of the European Union. (Non-legislative acts) REGULATIONS
 REGULATIONS") 19.6.2015 L 154/1 II (Non-legislative acts) REGULATIONS COMMISSION DELEGATED REGULATION (EU) 2015/942 of 4 March 2015 amending Delegated Regulation (EU) No 529/2014 supplementing Regulation (EU) No 575/2013
19.6.2015 L 154/1 II (Non-legislative acts) REGULATIONS COMMISSION DELEGATED REGULATION (EU) 2015/942 of 4 March 2015 amending Delegated Regulation (EU) No 529/2014 supplementing Regulation (EU) No 575/2013
Real Time Pipeline Leak Detection on Shell s North Western Ethylene Pipeline
 Real Time Pipeline Leak Detection on Shell s North Western Ethylene Pipeline Dr Jun Zhang & Dr Ling Xu* REL Instrumentation Limited ABSTRACT In the past ten years, a number of pipeline leak detection systems
Consolidated Workshop Proceedings Report
 United Nations International Strategy for Disaster Reduction Regional Office for Arab States THE WORLD BANK Syrian Ministry of Local Administration Consolidated Workshop Proceedings Report Regional Workshop
API MANUAL OF PETROLEUM MEASUREMENT STANDARDS
 API MANUAL OF PETROLEUM MEASUREMENT STANDARDS Chapter 22 Testing Protocols Section 1 General Guidelines for Developing Testing Protocols for Devices Used in the Measurement of Hydrocarbon Fluids Type Testing
Commission Working Document on possible Ecodesign Requirements for domestic ovens, hobs and range hoods
 Commission Working Document on possible Ecodesign Requirements for domestic ovens, hobs and range hoods (1) Under Directive 2009/125/EC ecodesign requirements should be set by the Commission for energy-related
ISO/TS TECHNICAL SPECIFICATION
 TECHNICAL SPECIFICATION ISO/TS 10811-1 First edition 2000-06-01 Mechanical vibration and shock Vibration and shock in buildings with sensitive equipment Part 1: Measurement and evaluation Vibrations et
BUSINESS PLAN CEN/TC 250 STRUCTURAL EUROCODES EXECUTIVE SUMMARY
 Page: 1 BUSINESS PLAN CEN/TC 250 STRUCTURAL EUROCODES EXECUTIVE SUMMARY Scope CEN/TC 250 covers the standardization of structural and geotechnical design rules for building and civil engineering works
RaySense. Fiber Optic Distributed Vibration Sensing (DVS) for Pipeline Security and Leak Detection
 for Pipeline Security and Leak Detection") RaySense Fiber Optic Distributed Vibration Sensing (DVS) for Pipeline Security and Leak Detection 1 PIPELINE MONITORING AND SECURITY The oil & gas industry is currently facing a serious challenge in assuring
RaySense Fiber Optic Distributed Vibration Sensing (DVS) for Pipeline Security and Leak Detection 1 PIPELINE MONITORING AND SECURITY The oil & gas industry is currently facing a serious challenge in assuring
Request for tender regarding the validation of ammonia testing methods as supplement to pren 16516
 Secretariat: Nederlands Normalisatie-instituut doc.nr. Vlinderweg 6 P.O. Box 5059 2623 AX DELFT 2600 GB DELFT date The Netherlands The Netherlands 2015-10-01 Telephone: +31 15 2 690 280 CEN/TC 351 N 0644
Optical Time-Domain Reflectometry for the Transport Spatial Filter on the OMEGA Extended Performance Laser
 Optical Time-Domain Reflectometry for the Transport Spatial Filter on the OMEGA Extended Performance Laser Troy Thomas Webster Thomas High School Advisor: Dr. Brian Kruschwitz Laboratory for Laser Energetics
DoD Humanitarian Demining Research and Development Program
 DoD Humanitarian Demining Research and Development Program Prepared By U.S. Army Communications Electronics Command Night Vision and Electronic Sensors Directorate Department of Defense Humanitarian Demining
Lakanal House inquest: Statement from the Fire Sector Federation
 Lakanal House inquest: Statement from the Fire Sector Federation The Fire Sector Federation (FSF) wishes to express profound sadness for the tragic loss of life that occurred at Lakanal House on the 3
BUSINESS PLAN CEN/TC 162 PROTECTIVE CLOTHING INCLUDING HAND AND ARM PROTECTION AND LIFEJACKETS EXECUTIVE SUMMARY
 BUSINESS PLAN CEN/TC 162 Business Plan Page: 1 CEN/TC 162 PROTECTIVE CLOTHING INCLUDING HAND AND ARM PROTECTION AND LIFEJACKETS EXECUTIVE SUMMARY Business Environment CEN/TC 162 is preparing standards
Information and Project Plan Proposal for Home Depot Renovation Library
 Information and Project Plan Proposal for Home Depot Renovation Library Writing Sample Libby Graham TABLE OF CONTENTS Purpose of the Project... 1 Purpose of the Publications... 2 Usability Goals for the
Fire Performance of external thermal insulation for walls of multistorey buildings
 Fire Performance of external thermal insulation for walls of multistorey buildings third edition Sarah Colwell and Tony Baker fire performance of external thermal insulation for walls of multistorey buildings
Connect North and South Korean Separated Families Higher Comfort Lower Energy
 Transsolar Academy 2016-2017 Final Project Summary Connect North and South Korean Separated Families Higher Comfort Lower Energy SUIN KIM 1, ELMIRA REISI 2 1 Transsolar Academy, Transsolar Energietechnik
WIDE SEARCH AREA HAND-HELD METAL DETECTION SET
 NSN: 6665150114797 WIDE SEARCH AREA HAND-HELD METAL DETECTION SET Wide Search Area for Faster and Accurate Screening Operations Search operations allowed even in close proximity of metal reinforced floors
Australian/New Zealand Standard
 AS/NZS 3200.2.4:2006 IEC 60601-2-4:2005 AS/NZS 3200.2.4:2006 Australian/New Zealand Standard Medical electrical equipment Part 2.4: Particular requirements for safety Cardiac defibrillators AS/NZS 3200.2.4:2006
This document is a preview generated by EVS
 CEN WORKSHOP CWA 15627 December 2007 AGREEMENT ICS 77.040.10 Supersedes CWA 15627:2006 English version Small Punch Test Method for Metallic Materials This CEN Workshop Agreement has been drafted and approved
INTERNATIONAL STANDARD
 INTERNATIONAL STANDARD IEC 61508-1 First edition 1998-12 BASIC SAFETY PUBLICATION Functional safety of electrical/electronic/ programmable electronic safety-related systems Part 1: General requirements
JOINT DECLARATION BETWEEN THE EUROPEAN UNION AND THE REPUBLIC OF INDIA ON A PARTNERSHIP FOR SMART & SUSTAINABLE URBANISATION. New Delhi, 6 Oct 2017
 JOINT DECLARATION BETWEEN THE EUROPEAN UNION AND THE REPUBLIC OF INDIA ON A PARTNERSHIP FOR SMART & SUSTAINABLE URBANISATION New Delhi, 6 Oct 2017 The Republic of India and the European Union, CONSIDERING
Itron Water Loss Management Solutions. Advanced Digital Leak Detection Overview Session
 Itron Water Loss Management Solutions Advanced Digital Leak Detection Overview Session Pipeline Assessment Management The Hidden/Aware/Locate/Repair cycle of a leak can cause extensive water loss The Conventional
Structure Fires in Hotels and Motels
 Structure Fires in Hotels and Motels John Hall Fire Analysis and Research Division National Fire Protection Association October 2006 National Fire Protection Association, 1 Batterymarch Park, Quincy, MA
A Notification under Article 12 of Regulation (EU) No 1025/2012 1
 No 1025/2012 1") EUROPEAN COMMISSION ENTERPRISE AND INDUSTRY DIRECTORATE-GENERAL Sustainable Growth and EU 2020 Standards for Boosting Competitiveness Brussels, 02/07/2014 A Notification under Article 12 of Regulation
EUROPEAN COMMISSION ENTERPRISE AND INDUSTRY DIRECTORATE-GENERAL Sustainable Growth and EU 2020 Standards for Boosting Competitiveness Brussels, 02/07/2014 A Notification under Article 12 of Regulation
Session Four Functional safety: the next edition of IEC Mirek Generowicz Engineering Manager, I&E Systems Pty Ltd
 Abstract Session Four Functional safety: the next edition of IEC 61511 Mirek Generowicz Engineering Manager, I&E Systems Pty Ltd The functional safety standard IEC 61511 provides a framework for managing
INTERNATIONAL STANDARD
 INTERNATIONAL STANDARD IEC 60601-2-2 Third edition 1998-09 Medical electrical equipment Part 2-2: Particular requirements for the safety of high frequency surgical equipment Appareils électromédicaux Partie
METAL DETECTOR MODEL NO: MD1000 OPERATION & MAINTENANCE INSTRUCTIONS PART NO: /08
 METAL DETECTOR MODEL NO: MD1000 PART NO: 4501200 OPERATION & MAINTENANCE INSTRUCTIONS 05/08 INTRODUCTION Thank you for purchasing this CLARKE Metal Detector. Before you try to use this product, read this
AN ANALYSIS OF THE PERFORMANCE OF RESIDENTIAL SMOKE DETECTION TECHNOLOGIES UTILIZING THE CONCEPT OF RELATIVE TIME
 AN ANALYSIS OF THE PERFORMANCE OF RESIDENTIAL SMOKE DETECTION TECHNOLOGIES UTILIZING THE CONCEPT OF RELATIVE TIME Elizabeth L. Milarcik, Stephen M. Olenick*, and Richard J. Roby Combustion Science & Engineering,
DESIGN FOR ELDERLY EGRESS IN FIRE SITUATIONS
 DESIGN FOR ELDERLY EGRESS IN FIRE SITUATIONS Lauren Folk i, John Gales ii, Steven Gwynne iii and Michael Kinsey iv i Research Student, Architectural Conservation and Sustainability Engineering, Carleton
BUSINESS PLAN CEN/TC 231 MECHANICAL VIBRATION AND SHOCK EXECUTIVE SUMMARY
 Business Environment BUSINESS PLAN CEN/TC 231 MECHANICAL VIBRATION AND SHOCK EXECUTIVE SUMMARY CEN/TC 231 Business Plan Page: 1 In Europe, a large number of machines generating exposure to mechanical hand-arm-vibration
Technology, expertise, quality, and service. Slickline. Measurement and activation services
 Technology, expertise, quality, and service Slickline Measurement and activation services Applications n Time-lapse distributed temperature logging n Three-phase production logging n Casing or tubing corrosion
A Cost Effective Multi-Spectral Scanner for Natural Gas Detection
 A Cost Effective Multi-Spectral Scanner for Natural Gas Detection Semi-Annual Progress Report No. 1 Reporting Period Start Date: October 1, 2003 Reporting Period End Date: March 31, 2004 Principal Authors:
Temperature Distribution of Rotary Heat Recovery Units
 Temperature Distribution of Rotary Heat Recovery Units Bjørn R. Sørensen, dr.ing. Narvik University College, P.O.Box 385, N-8505 Narvik, Norway Corresponding email: brs@hin.no SUMMARY This paper deals
(Non-legislative acts) REGULATIONS
 REGULATIONS") 9.5.2012 Official Journal of the European Union L 123/1 II (Non-legislative acts) REGULATIONS COMMISSION DELEGATED REGULATION (EU) No 392/2012 of 1 March 2012 supplementing Directive 2010/30/EU of the
9.5.2012 Official Journal of the European Union L 123/1 II (Non-legislative acts) REGULATIONS COMMISSION DELEGATED REGULATION (EU) No 392/2012 of 1 March 2012 supplementing Directive 2010/30/EU of the
Y003 Multi-offset Seismic Acquisition Using Optical Fiber Behind Tubing
 Y003 Multi-offset Seismic Acquisition Using Optical Fiber Behind Tubing C. Barberan* (Total E&P), C. Allanic (Total E&P), D. Avila (Total E&P), J. Hy- Billiot (Total E&P), A. Hartog (Schlumberger), B.
6 th Pipeline Technology Conference 2011
 6 th Pipeline Technology Conference 2011 Pipeline Leak Detection and Theft Detection Using Rarefaction Waves Authors: Dr Alex Souza de Joode, VP International Operations; ATMOS International, UK. Andrew
TSP-6: Solar Water Heater
 TSP-6: Solar Water Heater Introduction A company called SmartOptions has developed a rugged, cheap solar hot water system for use in dry, remote areas such as outback Australia and the Solomon Islands.
ISO 6393 INTERNATIONAL STANDARD. Earth-moving machinery Determination of sound power level Stationary test conditions
 INTERNATIONAL STANDARD ISO 6393 Third edition 2008-03-15 Earth-moving machinery Determination of sound power level Stationary test conditions Engins de terrassement Détermination du niveau de puissance
Procedure for the Approval of New Fire Detection and Alarm Technologies
 VdS Guidelines for Automatic Fire Detection and Fire Alarm Systems VdS 3469en Procedure for the Approval of New Fire Detection and Alarm Technologies VdS 3469en : 2016-01 (01) Publisher and publishing
Australian Standard. Functional safety Safety instrumented systems for the process industry sector
 AS IEC 61511.2 2004 IEC 61511-2:2003 AS IEC 61511.2 Australian Standard Functional safety Safety instrumented systems for the process industry sector Part 2: Guidelines for the application of AS IEC 61511.1
Davis Soil Moisture and Temperature Station Protocol
 Davis Soil Moisture and Temperature Station Protocol Purpose To log soil data using a Davis soil moisture and temperature station Overview Soil moisture and temperature sensors are installed at multiple
DOCUMENT CREASING MACHINE
 DOCUMENT CREASING MACHINE OPERATORS MANUAL Morgana Systems Limited Snowdon Drive Winterhill Milton Keynes Buckinghamshire MK6 1AP United Kingdom Telephone: ( 01908 ) 608888 Facsimile: ( 01908 ) 692399
The Train Now Arriving At... Harmonised Fire Safety For European Rolling Stock
 The Train Now Arriving At... Harmonised Fire Safety For European Rolling Stock Beth Dean beth.dean@exova.com : The Role of Accredited Laboratories in Regulation and Market Surveillance 10 th October 2012
BUSINESS PLAN. CEN/TC 336 BITUMINOUS BINDERS Version 2018 EXECUTIVE SUMMARY
 Page: 1 BUSINESS PLAN CEN/TC 336 BITUMINOUS BINDERS Version 2018 EXECUTIVE SUMMARY BUSINESS ENVIRONMENT The parties interested in the bituminous binder market are the following industries: - the bituminous
Remarks by Mr. Ladsous Under-Secretary-General for Peacekeeping Operations Meeting of the Mine Action Support Group (MASG) 11 October 2016
 11 October 2016") Excellencies, Ladies and gentlemen, Remarks by Mr. Ladsous Under-Secretary-General for Peacekeeping Operations Meeting of the Mine Action Support Group (MASG) 11 October 2016 Please check against delivery
Excellencies, Ladies and gentlemen, Remarks by Mr. Ladsous Under-Secretary-General for Peacekeeping Operations Meeting of the Mine Action Support Group (MASG) 11 October 2016 Please check against delivery
WG Buried Cable Perimeter Detection System
 Telephone : +44 (01295 756300 Fax : +44 (0)1295 756302 E-Mail : info@wi-ltd.com Website : www.wi-ltd.com WG Buried Cable Perimeter Detection System The WG Cable Detection Sensor is a covert outdoor perimeter
Chapter 1 Introduction
 Chapter 1 Introduction This chapter presents an introductory background to the research work undertaken, the problem statement, research issues involved and objectives of the research work. The contribution
Research on Decision Tree Application in Data of Fire Alarm Receipt and Disposal
 Research Journal of Applied Sciences, Engineering and Technology 5(22): 5217-5222, 2013 ISSN: 2040-7459; e-issn: 2040-7467 Maxwell Scientific Organization, 2013 Submitted: October 09, 2012 Accepted: December
INTERNATIONAL STANDARD
 INTERNATIONAL STANDARD IEC 60770-3 First edition 2006-04 Transmitters for use in industrial-process control systems Part 3: Methods for performance evaluation of intelligent transmitters IEC 2006 Copyright
(Non-legislative acts) REGULATIONS
 REGULATIONS") 12.10.2012 Official Journal of the European Union L 278/1 II (Non-legislative acts) REGULATIONS COMMISSION REGULATION (EU) No 932/2012 of 3 October 2012 implementing Directive 2009/125/EC of the European
12.10.2012 Official Journal of the European Union L 278/1 II (Non-legislative acts) REGULATIONS COMMISSION REGULATION (EU) No 932/2012 of 3 October 2012 implementing Directive 2009/125/EC of the European
Gambling with your fire security?
 Gambling with your fire security? Service Agreement for Fire Safety Building Technologies 11 No need to take risks Fire safety is elementary. Nobody doubts this. However, some people believe that a well-designed