Water Master Plan. March Prepared by: Prepared for:
|
|
|
- Nancy Dickerson
- 6 years ago
- Views:
Transcription

1 Water Master Plan March 2016 Prepared by: Prepared for:

2 WATER MASTER PLAN March 2016 Prepared for: Prepared by:
3 WATER MASTER PLAN TABLE OF CONTENTS Page No. CHAPTER 1 INTRODUCTION Introduction Scope of Services Acknowledgements Project Staff CHAPTER 2 EXISTING SYSTEM FEATURES Introduction Service Area Topography Supply Sources Wells Springs Utah Valley Water Treatment Plant Storage Facilities Pumping Facilities Distribution Piping Pressure Zones CHAPTER 3 FUTURE GROWTH AND DEMAND PROJECTIONS Introduction Water Demand Study Area Traffic Analysis Zones Orem City Residential and Non-Residential Populations Orem City Projections from Present to Orem City Projections from 2040 to Build-Out Residential Orem City Projections from 2040 to 2060 Non-Residential Vineyard City Projections from Present to 2060 Residential Vineyard City Projections from Present to 2060 Nonresidential Historical Water Use Seasonal Water Use Water Conservation Future Production Requirements Peak Day Production CHAPTER 4 WATER SUPPLY EVALUATION Introduction Historic Source Utilization Annual Source Capacity Springs Wells BOWEN COLLINS & ASSOCIATES i OREM CITY
4 WATER MASTER PLAN TABLE OF CONTENTS (continued) Page No. Utah Valley Water Treatment Plant Surface Water Storage Provo River Direct Flow Rights Total Supply Comparison of Annual Source Yield to Projected Demand Requirements Additional Sources Peak Day Production Capacity Springs Wells Surface Water Treated at the UVWTP Comparison of Peak Source Production to Projected Demand Requirements CHAPTER 5 STORAGE CAPACITY EVALUATION Storage Evaluation Criteria Equalization Storage Fire Flow Storage Emergency Storage Combined Emergency/Equalization Storage Total Existing and Future Storage Requirements Conclusions and Recommendations CHAPTER 6 HYDRAULIC MODELING Introduction Water System Model GIS Data Calibration Model Demands and Demand Distribution CHAPTER 7 DISTRIBUTION SYSTEM EVALUATION Model Scenarios Source Failure Scenarios Evaluation Criteria System Evaluation Results Existing System with Current Development Conditions Existing System with Buildout Development Conditions Recommended Distribution System Improvements Major Conveyance Improvements Improvements to Increase Fire Flows Additional Improvement Projects Recommended PRV Settings Modifications BOWEN COLLINS & ASSOCIATES ii OREM CITY
5 WATER MASTER PLAN TABLE OF CONTENTS (continued) Page No. CHAPTER 8 CAPITAL IMPROVEMENT PLAN Recommended Capital Improvement Budget Capital Improvement Plan Summary Year Capital Improvements Schedule LIST OF APPENDICES APPENDIX A TECH MEMO: ALTA SPRING HYDROELECTRIC EVALUATION APPENDIX B TECH MEMO: SOURCE OPTIMIZATION APPENDIX C TECH MEMO: WRF REUSE APPENDIX D WATER MODEL HISTORY APPENDIX E TECH MEMO: ADVANCED METERING INFRASTRUCTURE BOWEN COLLINS & ASSOCIATES iii OREM CITY
6 WATER MASTER PLAN TABLE OF CONTENTS (continued) LIST OF TABLES No. Title Page No. 2-1 Existing Wells and Springs System Storage Orem City Booster Pump Stations Water Distribution Pipe Pressure Zones Residential Population Projections Nonresidential Population Projections Historic Water Production from Projected Water Production Requirements through Buildout Peak Day Water Use by User Type Projected Peak Day Water Use Historical Source Utilization (acre-ft) Source Summary of Existing Springs Summary of Surface Water Storage Reservoirs Current Usable Yield of Existing Orem City Culinary Water Sources Usable Yield of Existing Orem City Culinary Water Sources in Future Annual Source Yield Source Summary of Existing Springs Existing Wells Reliable Peak Capacity Peak Day Production Capacity of Current Orem City Future Peak Day Source Capacity Storage Facilities Evaluation Storage Facilities Evaluation Recommended Storage Tank Improvements Projected Peak Demands Major Conveyance System Improvements Summary Summary of Recommended Fire Flow Improvements Summary of Condition Related Improvement Projects Identified by Orem City Pressure Reducing Valve Settings Existing Settings and Proposed Future Settings Orem City Water System Capital Improvement Projects Year Capital Improvement Plan Scenario 1, 5-Year Phase in Plan Year Capital Improvement Plan Scenario 2, 7-Year Phase in Plan BOWEN COLLINS & ASSOCIATES iv OREM CITY
7 WATER MASTER PLAN TABLE OF CONTENTS (continued) LIST OF TABLES No. Title Page No Year Capital Improvement Plan Scenario 3, 10-Year Phase in Plan Year Capital Improvement Plan Scenario 4, with Bonding BOWEN COLLINS & ASSOCIATES v OREM CITY
8 WATER MASTER PLAN TABLE OF CONTENTS (continued) LIST OF FIGURES No. Title On or Following Page No. 2-1 Existing Water System Orem City Distribution System Orem City General Plan and Special Growth Areas Development Density Indoor ERCS per Acre Orem City Seasonal Demand Projected Annual Water Production Requirements with and without Conservation Projected Peak Day Demand Historical Source Utilization Projected Annual Production Requirements with and without Conservation Projected Peak Day Demand and Available Supplies Orem City Diurnal Pattern Static Demand Pressures for Existing Conditions Peak Hour Demand for Existing Conditions - System Pressure Peak Day Demand Fire Flow for Existing Conditions Peak Hour Demand for Future Conditions Pressure and Velocity Peak Hour Demand for Future Conditions Pressures Buildout Water System Improvements Peak Day Demand fire Flow for Existing Conditions Recommended Water Fund Expenditures, Scenario 1 5-Year Phase In Recommended Water Fund Expenditures, Scenario 2 7-Year Phase In Recommended Water Fund Expenditures, Scenario 3 10-Year Phase In Recommended Water Fund Expenditures, Scenario 4 With Bonding BOWEN COLLINS & ASSOCIATES vi OREM CITY
9 WATER MASTER PLAN CHAPTER 1 INTRODUCTION INTRODUCTION Orem City has retained Bowen Collins & Associates (BC&A) to prepare a master plan for the City s water production and distribution system. The purpose of this water master plan report is to identify recommended improvements that will resolve existing and projected future deficiencies in the water system throughout the City s service area. The results of this study will be incorporated into a Rate Study that will be used to establish water user rates for the City. SCOPE OF SERVICES The general scope of this project involved a thorough analysis of the City s water production and distribution system and its ability to meet the present and future water needs of its residents. As part of the Water Master Plan, BC&A completed the following tasks. Task 1: Task 2: Task 3: Task 4: Task 5: Task 6: Task 7: Task 8: Task 9: Collected information as needed to develop the water master plan based on the City s general plan and existing facilities. Updated population projections and estimated water demand to evaluate future growth needs. Evaluated Orem City source and storage requirements for existing and future development conditions. Developed and calibrated a hydraulic computer model of the Orem City distribution system to evaluate existing and projected future system deficiencies. This included developing and calibrating the model using data from the City s existing GIS database and historical water use data on water system performance and pressures. Identified existing operating deficiencies. Identified projected future operating deficiencies. Evaluated alternative improvements for resolving deficiencies identified in Tasks 5 and 6. Developed a water system capital facilities plan identifying a plan for budgeting and planning system improvements. Documented results of the previous tasks in a report with additional memoranda as needed. Technical memoranda included at the end of this report cover the following topics related to master planning activities: An Alta Springs power generation evaluation An Automatic Meter Reading (AMR) technology evaluation to determine the feasibility and costs of various metering technologies A water source optimization evaluation based on seasonal use for the water system including source costs, operating considerations, and best practices BOWEN COLLINS & ASSOCIATES 1-1 OREM CITY
10 WATER MASTER PLAN A reuse plan to implement reuse of the water reclamation facility s sewer effluent As part of the master plan, BC&A made presentations to the City s Public Works Advisory Commision and City Council in meetings throughout the project. In conjunction with the tasks completed as part of the master plan, a water rate analysis was produced for the project by BC&A sub consultant (Lewis Young Robertson & Burningham). The results of their activities are documented in a separate report. This document is a working document. Some of the recommended improvements identified in this report are based on the assumption that development and/or potential annexation will occur in a certain manner. If future growth or development patterns change significantly from those assumed and documented in this report, the recommendations may need to be revised. The status of development should be reviewed at least every five years. This report and the associated recommendations should also be updated every five years. ACKNOWLEDGMENTS The BC&A team wishes to thank the following individuals from Orem City for their cooperation and assistance in working with us in preparing this report: Chris Tschirki Neal Winterton Lane Gray Quinn Fenton Layne Batty Tom Phelps Public Works Director Water Resources Division Manager Water Section Manager Water Supply Field Supervisor Engineering Specialist Information Technology PROJECT STAFF The project work was performed by the BC&A s team members listed below. Team member s roles on the project are also listed. The project was completed in BC&A s Draper, Utah office. Questions may be addressed to Keith Larson, Project Manager at (801) Mike Collins Keith Larson Andrew McKinnon Aaron Anderson Mike Hilbert Principle in Charge Project Manager Project Engineer Project Engineer Clerical BOWEN COLLINS & ASSOCIATES 1-2 OREM CITY
11 WATER MASTER PLAN CHAPTER 2 EXISTING SYSTEM FEATURES INTRODUCTION As part of this Master Plan, BC&A has assembled an inventory of existing infrastructure within the water distribution system. The purpose of this chapter is to present a summary of the inventory of Orem City s existing water distribution system and provide a quick reference for City personnel regarding components of the system. SERVICE AREA Orem City provides water for residents within its corporate boundaries as shown in Figure 2-1. Its service area is approximately 20 square miles and is bordered by the following: The Wasatch Mountain Range to the east, Utah Lake and Vineyard to the west, Lindon City to the north, and Provo City to the south and east. In 2014, this equated to an approximate Orem City service population of 92,500 permanent residents. In addition to permanent residents, the City also serves the Utah Valley University student and faculty population along with many other commercial, industrial, and institutional entities. The east side of the City is largely residential and is mostly built out. The west side of the City is mostly commercial/industrial, with some large areas still available for future development. In June 2011, the City amended an interlocal agreement with the Town of Vineyard to provide Vineyard with up to 3,500 acre-ft of water per year through three meters along Geneva Road (at 400 North, Center Street, and 400 South). The agreement permits Vineyard to draw flows up to 6,300 gpm (2,100 gpm per master meter connection averaged over a month) from the Orem system. Orem City currently provides water for approximately 1,400 equivalent residential connections in Vineyard. TOPOGRAPHY The topography of the City generally slopes from northeast to southwest with the City s primary source of water (Utah Valley Water Treatment Plant) located at the northeast corner of the City. Most of the City s storage reservoirs are also located in the northeast corner of the City to provide adequate pressure to lower pressure zones served through pressure regulating stations. Figure 2-2 shows a basic hydraulic schematic of how the City s distribution system functions. SUPPLY SOURCES Orem City has nine wells in its water supply system along with two spring sources. The City is also supplied with treated surface water from water rights to natural runoff in the Provo River and reservoir storage in Deer Creek Reservoir and Jordanelle Reservoir. The City has agreements with the Metropolitan Water District of Orem to purchase additional water. Facilities associated with supply are summarized in the following sections. A more detailed discussion of each source and its yield can be found in Chapter 4 Water Supply Evaluation. BOWEN COLLINS & ASSOCIATES 2-1 OREM CITY


12 L E G E N D UT Tank ³ P.R.V.s ÍÎ$ Orem Source "M Pump Station AltaSpringsLine Water Lines Diameter 6" or less 8" 10" 12" 14" 16" 20" 24" 30" 36" Pressure Zones Zone ALTA CARTERVILLE CASCADE CENTRAL CHERAPPLE EASTSIDE LAKEVIEW NORTHRIDGE SPRINGWATER TIMPANOGOS TREATMENT PLANT WESTSIDE State St 400 W CASCADE Main St ALTA 400 E UT Canyon Spring Wet Well 800 E Canyon Spring CHARAPPLE UT NORTHRIDGE See Appendix A for Alta Springs Info CHERAPPLE CHERRAPPLE 1600 N 1200 N Geneva Road 1200 W TIMPANOGOS ALTA UPPER TANKS TREATMENT_PLANT UT TREATMENT PLANT UT UT 1300 E LOWER TANKS CASCADE WELL#6 800 N WELL#2 WELL#7 400 N WESTSIDE WELL#3 EASTSIDE Center St WELL#5 WELL#4 CENTRAL NEW WELL #1 400 S WELL#8 WELLl#9 800 S SPRINGWATER CARTERVILLE 1200 S University Pkwy WELL# S LAKEVIEW OREM CITY WATER MASTER PLAN EXISTING WATER SYSTEM NORTH: NORTH SCALE: 0 1,250 2,500 Feet FIGURE NO. 2-1 P:\Orem City\2013 Master Plans\4.0 GIS\4.1 Projects\WaterMap\Water-Figure Existing Facilities.mxd amckinnon 3/18/2016
13 WATER MASTER PLAN WELLS Orem City currently operates nine wells, the locations of which are shown in Figure 2-1. The majority of wells are located on the east side of the City and provide flow to the Central, Eastside, and Treatment Plant Pressure Zones. Table 2-1 summarizes the characteristics of each well source. Table 2-1 Existing Wells and Springs Name Address Size (inches) Zone Capacity (mgd) 1 Capacity (gpm) Well # S 800 E 14 Central ,160 Well #2 710 N 980 W 12 Central ,670 Well #3 479 N 400 E 10 Eastside ,350 Well #4 65 S 1000 E 14 Eastside/Central ,710 Well #5 56 N State St. 14 Central ,570 Well #6 950 N 1000 E 12 Treatment Plant ,390 2 Well #7 665 N Palisade Dr. 8 Eastside Well #8 701 S State St. 12 Central ,780 Well #9 800 S 900 E 14 Central ,140 Subtotal Wells ,270 Alta Springs 2.9 2,000 Canyon Springs Subtotal Springs 3.6 2,500 Total ,770 1 Based on maximum production from dry year data (2013) 2 Well No. 6 is in need of maintenance and is currently operating at a reduced capacity. Orem City is planning to carry out a rehabilitation project on Well No. 6 in the near future. SPRINGS Orem City operates two spring sources located in Provo Canyon: Alta Springs and Canyon Springs. Alta Springs is located about 3 miles northeast from the mouth of the canyon. Approximately 18,000 feet of pipe connect the spring to two tanks situated on the east bench of the City. Alta produces about 3,000 acre feet of water per year on average and also represents a potential hydroelectric source for the City because of its relatively high elevation and supply (see Appendix A). Canyon Springs is located closer to the City near Mount Timpanogos Park. A small tank and booster pump operate in conjunction with Canyon Springs, providing flow to the Eastside pressure zone. Canyon Springs has a much lower yield than Alta, producing approximately 800 acre feet per year. UTAH VALLEY WATER TREATMENT PLANT The Utah Valley Water Treatment Plant (UVWTP) is owned and operated by the Central Utah Water Conservancy District (CUWCD) and is located at approximately 1120 East Cascade Drive on Orem City s east bench. The UVWTP treats water for Orem City and many others, and has an BOWEN COLLINS & ASSOCIATES 2-2 OREM CITY
14 WATER MASTER PLAN existing capacity of approximately 80 mgd, with the potential to expand to 100 mgd. The plant is a direct filtration water plant, which means water passes through filters to remove sediment and potentially harmful pathogens. The plant also includes sedimentation basins and ozone and chlorine disinfection. Orem City is currently working with CUWCD to formalize an agreement regarding capacity at the plant. Based on historic practices, this master plan assumes that the City currently has 42 mgd (29,170 gpm) of available supply from the plant. STORAGE FACILITIES Figure 2-1 indicates the location of storage facilities for Orem City, and Table 2-2 summarizes the characteristics of each storage facility. Tank Name Volume (million gallons) Upper Tank Upper Tank Canyon Springs 0.05 Lower Tank Lower Tank Cherapple 0.4 Dimensions Table 2-2 System Storage Bottom Elevation (ft) Overflow Elevation 100 Diameter 5, ,263.5 (ft) Source Description Alta Springs/WTP/ Buried Concrete Wells Circular 100' Diameter 5, ,263.5 Alta Springs/WTP/ Wells Buried Concrete Circular 30' Canyon Buried Concrete Diameter 4,928 4,938 Springs Circular 160' Diameter 4,936 4,967 WTP/Wells Steel Tank 125' Diameter 4,936 4,967 WTP/Wells Steel Tank Alta Springs/WTP/ Wells 75 Diameter 5, , Diameter* 5,084 5,102 WTP Buried Concrete Circular Buried Concrete Circular WTP* 9.5 Total *The WTP has a total storage capacity of 37 MG. Only 9.5 MG of the storage at the treatment plant is available to Orem City. Remaining storage is dedicated to CUWCD operations and/or for other municipalities. It will be noted that there is a greater amount of storage located at the CUWCD treatment plant than reported in the table (37 million gallons). Of this total, Orem City has rights to only 9.5 million gallons of capacity. In the past, because Orem has been the plant s largest customer, the City has enjoyed access to nearly all of the storage at the treatment plant. However, as new customers are added at the plant, the availability of storage to the City will decrease until it reaches its contractual level of 9.5 million gallons. BOWEN COLLINS & ASSOCIATES 2-3 OREM CITY
15 WATER MASTER PLAN PUMPING FACILITIES Since the majority of the sources and storage for the water system reside at a high elevation on the east side of Orem, the water distribution system requires a minimal number of booster stations, which are summarized in Table 2-3. The location of each booster pump facility is shown in Figure 2-1. The Canyon Springs Booster Station draws water from the Canyon Springs Tank to provide additional flow to the Eastside Pressure Zone. The Cherapple Booster Station pumps water from the Alta Pressure Zone up to the Cherapple Tank. Booster stations located at the UVWTP and lower tanks are designed to supply flow to the upper tanks in the case that demand in the Alta, Cherapple, and Northridge Pressure Zones exceeds the capacity of Alta Springs (see Figure 2-2). It should be noted that the Orem City upper tanks provide backwash water for the CUWCD plant. Table 2-3 Orem City Booster Pump Stations Design Name Address Size (inches) Zone From Zone To Capacity (gpm) Canyon Springs Mt. Timpanogos Park 12 Canyon Springs Eastside 1,000 Cherapple 1945 Skyline Dr. 8 Alta Cherapple 900 Lower Tank 10 Eastside Alta 3,600 Treatment Plant Cascade Dr. Treatment Plant Alta 4,040 Total 9,540 1 data unavailable DISTRIBUTION PIPING Table 2-4 lists the reported pipe diameters and corresponding lengths in the Orem City distribution system. Pipe materials include PVC, ductile iron, cast iron, and steel. Location and sizing of distribution pipes are shown in Figure 2-1. BOWEN COLLINS & ASSOCIATES 2-4 OREM CITY
16 WATER MASTER PLAN Table 2-4 Water Distribution Pipe Diameter (inch) Length (ft) Length (mi) Percentage Unknown 21, % 4 85, % 6 749, % 8 547, % 10 25, % , % 14 37, % 16 81, % 20 22, % 24 31, % 30 13, % 36 12, % % 60 7, % Total 1,867, % PRESSURE ZONES The Orem City water distribution system is divided into 12 major pressure zones as shown in Figure 2-1. Table 2-5 lists the approximate hydraulic grade setting for each pressure zone along with the approximate service percentage of the zone. It is important to note that the majority of the Springwater Pressure Zone is within Orem City boundaries, with a limited number of connections to existing customers in the Town of Vineyard. BOWEN COLLINS & ASSOCIATES 2-5 OREM CITY
17 WATER MASTER PLAN Approximate Static Hydraulic Grade Line (ft) Table 2-5 Pressure Zones Existing Peak Day Demand (gpm) 1 Existing Percentage of Demand 2060 Peak Day Demand (gpm) 1 Percentage of 2060 Demand Pressure Zone Cherapple 5,316 5, % % Alta 5, , % % Northridge 5, % % Timpanogos 5,046 2, % 2, % Treatment Plant 5,084 5,102 2, % 2, % Cascade 5, % 1, % Eastside 5,030 6, % 6, % Central 4,936 4,967 24, % 31, % Carterville 4, % % Lakeview 4,824 1, % 3, % Westside 4,860 1, % 3, % Springwater 4,747 1, % 5, % Southwest Annex 2 4, % 2, % Total 3 42,716 60,330 1 Development of peak day demand estimates is discussed in Chapter 3. 2 Note that the Southwest Annexation area will likely fall within the Spingwater pressure zone. It has been separated here for information purposes. 3 Vineyard City demands (up to 6,300 gpm at 2060) are not included in total. BOWEN COLLINS & ASSOCIATES 2-6 OREM CITY
18 WATER MASTER PLAN INTRODUCTION CHAPTER 3 FUTURE GROWTH AND DEMAND PROJECTIONS Before attempting to hydraulically model and evaluate the City s water distribution facilities, one must first have an accurate understanding of water demands. This includes an estimate of both the quantity and distribution of existing and future demands. The purpose of this chapter is to summarize the results, assumptions, and process of calculating both existing and future water production requirements. Production requirements are evaluated in terms of annual and peak day production. WATER DEMAND There are several methods that can be used to estimate water demands. This study develops water production requirements based on three factors: population, employment, and industrial development. The methodology of this study can be summarized as follows: 1. Define the service area. 2. Divide the service area into a number of smaller sub-areas using geographical information system (GIS) mapping. Traffic analysis zones developed by MAG were the primary unit for subdividing the City. 3. Project residential population for each sub-area based on existing and projected patterns of development. 4. Project non-residents for each sub-area based on existing and projected patterns of development. 5. Adjust projections as required to accommodate areas of special growth consideration including planned development zones (PD Zones), Utah Valley University, University Place Redevelopment, and the Southwest Annexation Area. 6. Estimate the water production requirements from each factor (residential and nonresidential) based on a statistical analysis of existing levels of development and historic water use. 7. Convert projections of residential and non-residential development to future water demands based on their historic contributions. Each step of this process is summarized in the sections below. STUDY AREA The study area for this analysis is generally the same as the City s municipal boundary as shown in Figure 3-1 with three wholesale connections to the Town of Vineyard at 400 South, Center Street, and 400 North. It is expected that the water distribution system will continue to expand into the Lakeview Annex Area in the near future as discussed in the Orem City 2011 General Plan. BOWEN COLLINS & ASSOCIATES 3-1 OREM CITY


19 Geneva Road State St 800 E 400 E Main St 400 W 1200 W 1300 E 1600 N Treatment Plant 1200 N Well N Well 2 Well 7 Well N Center St Well 5 Well S Well 8 Well S University Pkwy 1200 S Well S L E G E N D Orem Water Source Water Lines Diameter <12-inch 12-inch and Above Planned Development Zones Special Growth Areas Southwest Annexation Area University Utah Valley University Lindon City Boundary General Plan Land Use Type Open Space Community Commercial Regional Commercial Rural Density Residential Low Density Residential Medium Density Residential High Density Residential Light Industrial Industrial Professional Services Future Orem City Boundary OREM CITY WATER MASTER PLAN OREM CITY GENERAL PLAN & SPECIAL GROWTH AREAS NORTH: NORTH SCALE: 0 1,500 3,000 Feet FIGURE NO. 3-1 P:\Orem City\2013 Master Plans\4.0 GIS\4.1 Projects\WaterMap\Water-Figure general plan.mxd amckinnon 3/18/2016
20 WATER MASTER PLAN TRAFFIC ANALYSIS ZONES Division of the service area into smaller sub-areas is important for two reasons. First, it increases the accuracy of the population and flow projections by examining land use and development patterns at a smaller scale. Second, it yields projections that are distributed spatially across the service area, an important requirement for water system modeling efforts. For this study, sub-areas were defined based on Traffic Analysis Zones (TAZ). A TAZ is the smallest geographic unit used for residential and non-residential population projections developed by the Mountainland Association of Governments (MAG). Non-residential population data includes employees, retail, industrial, and other non-residents. TAZ boundaries are established on an arbitrary basis by the MAG for travel demand modeling. TAZ boundaries were used for this analysis because population projections have already been developed from census data for TAZ areas by the MAG. The projections are provided every 5- years starting in 2010 and continuing to TAZ boundaries were also used because they are small enough to give an adequate distribution of flow across the service area for use in modeling. The TAZ boundaries used in this analysis are shown on Figure 3-2. As can be seen in the figure, TAZ boundaries are not always consistent with the City s service area boundaries. If a TAZ was only partially in the study area boundary, then the percentage inside the boundary was determined. MAG projections were multiplied by this percentage to determine the portion of the TAZ projection within the study area boundary. OREM CITY RESIDENTIAL AND NON-RESIDENTIAL POPULATIONS Service area population growth for Orem City and the Town of Vineyard were estimated independently. Residential and non-residential projections for Orem were developed for two periods: Present to 2040, and 2040 to The methodology varies slightly for each period. Service area projections for Vineyard were developed from present to 2060 based on available water supply from Orem City as per the City of Orem Agreement No. A This agreement stipulates that the maximum peak day production that Vineyard can use from Orem City is 6,300 gpm. The sections that follow describe in greater detail how the projections for each of these situations were developed. Orem City Projections from Present to 2040 The population projections, from present to 2040, were initially taken from the MAG Population Projection Report, 2011 Baseline. The MAG projections were then adjusted with input from City personnel for the special areas of consideration noted above and for key planned development zones (PD Zones). PD Zones are identified separately because of the relatively wide variability in types of development that may be incorporated into a PD Zone (including commercial, industrial, mixed use development, student housing). In general, PD Zones are intended to be consistent with the underlying General Plan designation, but may include other development types in the zone in accordance with City and developer interests for the site. The modified MAG projections were used to estimate where growth will occur in the City. MAG will be updating its projections in the near future, but for the purpose of this study, the distributions used from the 2011 baseline were considered adequate with modifications by City personnel to BOWEN COLLINS & ASSOCIATES 3-2 OREM CITY
21 WATER MASTER PLAN reflect City estimates. Residential and non-residential populations were treated separately and independently for these projections. The Southwest Annexation Area was treated somewhat independently for these projections. This area of the City has its own planning documents. An equivalent residential population for this area was developed using the 2015 Impact Fee Facilities Plan (IFFP) prepared by Lewis, Young, Robertson and Burningham, Inc. This area is shown to be completely built out by the Year Orem City Projections from 2040 to Build-out - Residential The detailed MAG projections only extend to Because this does not cover the full planning window of this water master plan, growth beyond the year 2040 needed to be examined and incorporated into this study. A build-out estimate of growth was developed for each area of the City by extrapolating the population from 2040 to 2060 using the final growth rate in the MAG projections for all areas with a positive growth rate (some areas have a negative growth rate associated with declining population). This estimate was compared to the overall GOMB projection for 2060 and adjustments were made within the special areas of consideration or PD Zones so that the 2060 population distribution matched the 2060 GOMB population estimate. Orem City Projections from 2040 to 2060 Nonresidential For non-residential growth, a build-out estimate of growth was estimated by extrapolating from 2040 to 2060 using the final growth rate in the MAG projections for all areas with a positive growth rate. No other adjustments were made for non-residential growth. Town of Vineyard Projection from Present to 2060 Residential Vineyard service area population growth was determined using the available residential water supply from Orem City as per City of Orem Agreement No. A (ratio of residential to non-residential water use estimated using the same ratio as observed in the current system). Using the residential peak day per capita demand for the current water system, the 2060 service area population was estimated by dividing the total available residential water supply to Vineyard by the per capita demand. A growth trend between present population and buildout was determined using the GOMB projections for the Town of Vineyard through 2013 and applying a logistic equation of growth up to In essence, this estimate reflects an effective population of Vineyard which will be dependent on the Orem City water system. Town of Vineyard Projection from Present to 2060 Nonresidential. A similar method to that used to determine residential service area population growth for Vineyard was used to estimate non-residential growth. Using the available non-residential water supply from Orem and the estimated per capita demand, the 2060 non-residential population was estimated. Using GOMB and MAG projections, the growth trend was predicted using a logistic equation of growth. The results of the residential and non-residential projections described above are summarized in Tables 3-1 and 3-2. BOWEN COLLINS & ASSOCIATES 3-3 OREM CITY
22 WATER MASTER PLAN Orem Residential Population Table 3-1 Residential Population Projections Vineyard 1 Residential Population Southwest 2 Annexation Population Total Residential Population Year , , , , ,227 1,903 1, , ,321 9,990 5, , ,288 13,663 5, , ,900 13,989 5, , ,600 14,010 5, ,221 1 The estimated maximum service area population from Vineyard is based on available peak day residential water supply from Orem City as per City of Orem Agreement No. A Service area population growth was estimated using the 2010 and 2013 GOMB population projections and a logistic growth equation. 2 The residential population indicated area was determined based on the IFFP s prepared for the Orem City Southwest Annexation Area. For simplicity, all water use from the Southwest Annexation Area is being represented as residential. Table 3-2 Nonresidential Population Projections Orem Non- Residential Population Vineyard 1 Non- Residential Population Total Non- Residential Population Year , , , , ,643 1, , ,318 10, , ,309 19, , ,401 20, , ,552 20, ,202 1 The estimated maximum non-residential service area population from Vineyard is based on available peak day non-residential water supply from Orem City. Service area population growth was determined using GOMB and MAG projections with a logistic growth equation. HISTORICAL WATER USE In order to predict future water production requirements for Orem City, historical water use data was used to determine per capita demands. Table 3-3 contains the historic production data provided by Orem City from the period of 2009 to This table includes: Annual Production and Annual Sales Annual production is the actual quantity of water which the City distributed into the system, while annual sales refers the quantity that was actually charged to customers. As shown in Table 3-3, annual water sales for Orem were estimated based on total annual water sales revenue, the number of water service connections, and the respective water rates for each year. The difference between production and sales is described as system loss. System loss can be attributed to two BOWEN COLLINS & ASSOCIATES 3-4 OREM CITY
23 WATER MASTER PLAN factors: leaks and unmetered water. Unmetered water typically makes up the majority of system losses, and includes unmetered connections, inaccurate meter reads, system maintenance, water for construction, firefighting, incidental line breaks, or theft. In general, the City appears to be experiencing substantial system losses, at least in recent years. Ideally, system loss would be less than 6 percent. Average Day Production and Sales Average day production refers to the total volume of production divided by the numbers of days in the year, generally presented in terms of a volumetric flow rate (million gallons per day or gallons per minute). Average day production is useful for estimating future production demands of the system by expressing the production in terms of a per capita demand. Peak Day Production For the purposes of planning and computer modeling, it is important to not only estimate the average daily production requirements for the system, but also the production required during the peak water use day of the year (the day with the highest demands on the system). Modeling peak day demands provides useful information regarding system capacity and potential deficiencies. Table 3-3 Historic Water Production from Average Annual Production (acre-ft) 26,050 27,184 24,902 30,273 27,641 27,210 Annual Sales (acre-ft)* 23,807 25,380 18,301 21,652 22,930 22,414 System % Loss* 9% 7% 27% 28% 17% 17% Residential Population Served 88,059 88,467 89,544 90,646 91,778 89,699 Non-Residential Population Served 129, , , , , ,128 Average Day Production (mgd) Average Day Production (gpcd) Peak Day Jul 20 Jul 21 Jul 22 June 25 July 3 N/A Peak Day Production (mgd) Peak Day Production (gpcd) Peak Day Peaking Factor *Estimated based on total water sale revenue and the associated number of water connections and water rates for each year BOWEN COLLINS & ASSOCIATES 3-5 OREM CITY
24 WATER MASTER PLAN Seasonal Water Use Water use in a water system varies significantly as a function of time. Demands change throughout the day as well as through different times of the year. While indoor water use patterns tend to remain relatively constant throughout the year, seasonal effects have a large impact on outdoor water use. Figure 3-3 shows the typical water use pattern over the period of 2009 to Outdoor Indoor Figure 3-3 Orem City Seasonal Demand Water Production (mgd) Water Conservation The City currently has a water conservation goal consistent with the State of Utah conservation goal. This goal is to reduce per capita water usage by 25 percent by the year 2025 (based on water use as measured in the year 2000 as the starting point). Generally speaking, the majority of conservation will occur through the reduction of outdoor water use. However, as the City strives to meet the State conservation goal, significant reduction of indoor use is also possible. Water conservation has not only an environmental impact, but can also benefit the City financially. Reducing the volume of water consumed across the City can delay or potentially eliminate the need for expensive improvement projects. FUTURE PRODUCTION REQUIREMENTS Future production requirements for the water system were estimated by multiplying per capita demands by the population projections. Table 3-4 shows the projected production requirements for BOWEN COLLINS & ASSOCIATES 3-6 OREM CITY
25 WATER MASTER PLAN the water system through build-out. Note that Table 3-4 presents projections of water production for two different water use scenarios: Without Conservation The first set of projections in Table 3-4 are based on per capita water use as measured in the year Per capita demand for 2000 was chosen because it was the initial year for the implementation of the State of Utah s conservation goal. With State Conservation Goal As part of its overall supply plan (and consistent with the State of Utah s conservation goal), the City is encouraging conservation to reduce per capita water use in its service area by 1% each year through the year 2025, where the goal is to reach a 25% total reduction in per capita water use. This projection represents projected demands if the City achieves this goal. Table 3-4 Projected Water Production Requirements Through Buildout Average Annual Production without Conservation (acre-ft) 33,408 40,419 44,488 46,721 48,240 Average Annual Production with Conservation (acre-ft) 26,727 30,314 33,366 35,041 36,180 Peak Day Demand (mgd) Figure 3-4 provides a visual representation of the projected annual water demand for the City through build-out. BOWEN COLLINS & ASSOCIATES 3-7 OREM CITY
26 WATER MASTER PLAN 60,000 Figure 3-4 Projected Annual Water Production Requirements With and Without Conservation 50,000 Annual Production (acre-ft) 40,000 30,000 20,000 10,000 Annual Production Requirement Without Conservation State Conservation Goal PEAK DAY PRODUCTION For planning and modeling purposes, it is valuable to not only have an estimate of average production requirements for the system, but also to estimate peak day demands. From 2009 to 2013, the highest peak day demand was MGD. Meter data acquired from the City was then used to estimate the percentage of water use attributed to residents, non-residents, and parks. These estimates show that Orem residents account for approximately 73% of water use, with nonresidents and parks at 23% and 4%, respectively. Using the GOMB/MAG population projections for the Orem City service area in 2012, a residential and non-residential peak day per capita demand was calculated. These demands are summarized in Table 3-5. BOWEN COLLINS & ASSOCIATES 3-8 OREM CITY
27 WATER MASTER PLAN 120 Figure 3-5 Projected Peak Day Demand 100 Peak Day Demand (mgd) Projected Peak Day Demand Table Peak Day Water Use by User Type Component Total Peak Day Demand (gallons/day) 2012 Population Estimate Per Capita Peak Day Demand (gallons/cap/day) Residential Population 44,666,805 90, Non-Resident Population 14,023, , Parks 2,820,000 Total 61,510,000 It will be noted that, unlike annual demands, no reduction in projected peak day demands have been shown in association with conservation. Past studies have shown that most initial conservation activities are focused on reducing outdoor use by adjusting watering schedules to better match evapotranspiration. Correspondingly, most of the conservation observed in the state in recent years has been achieved through the reduction of outdoor water use in the spring and fall. In the heat of the summer, initial conservation efforts have been inconsistent in reducing demands. As a result, peak day demands have been less affected by conservation than annual water use. While more aggressive future conservation efforts may do better at reducing peak demands, this master plan will conservatively base all peak day demand projections on recent historical use without reductions associated with conservation. BOWEN COLLINS & ASSOCIATES 3-9 OREM CITY
28 WATER MASTER PLAN Using the per capita demand estimates shown in Table 3-5, future demands were estimated using the population projections for future growth leading up to the buildout population in The results are shown in Table 3-6. Table 3-6 Projected Peak Day Water Use Orem/Vineyard Residential Population Total Peak Day Demand (gallons/day) Orem/Vineyard Non- Year Residential Population , ,994 69,650, , ,904 82,263, , ,732 90,048, , ,966 93,911, , ,202 96,577,780 BOWEN COLLINS & ASSOCIATES 3-10 OREM CITY
29 WATER MASTER PLAN CHAPTER 4 WATER SUPPLY EVALUATION INTRODUCTION The purpose of this chapter is to evaluate the adequacy of Orem City s sources to meet projected future production requirements. This evaluation considers supply capacity in terms of reliable annual yield, peak day production, and seasonal availability. This includes consideration of the water sources that Orem City is currently utilizing, as well as additional sources which the City has already planned to acquire (i.e. Jordanelle (CUP) Project water). It should be noted that this chapter will focus exclusively on the adequacy of City sources to meet projected annual and peak day demand requirements for the City. In addition to making sure it has enough water, it is also important for the City to consider how it uses this water throughout the year. Optimizing the use of existing sources will not be considered in this chapter, but has been addressed in a separate technical memorandum located in Appendix B. HISTORIC SOURCE UTILIZATION Orem City obtains its water from a combination of municipal sources including two springs in Provo Canyon, nine City wells, and surface water treated at the Utah Valley Water Treatment Plant (which is a combination of reservoir storage and natural river flow). Historic use of these sources since 2009 is summarized in Table 4-1 and Figure 4-1. Table 4-1 Historical Source Utilization (acre-ft) Source Springs 4,777 4,107 5,076 3,900 2,958 Wells 6,161 6,331 4,888 7,733 6,935 UVWTP 15,112 16,747 14,938 18,640 17,747 Total 26,050 27,184 24,902 30,273 27,641 BOWEN COLLINS & ASSOCIATES 4-1 OREM CITY
30 WATER MASTER PLAN Figure 4-1 Historical Source Utilization Annual Production (acre ft) Springs Wells UVWTP ANNUAL SOURCE CAPACITY Utah Administrative Code R requires that municipal water sources physically and legally meet water demands under two separate conditions. First, source capacity must be adequate to provide one year s supply of water, which is the average annual production requirement. Second, source capacity must be adequate to meet peak day production requirements. The following sections discuss the average annual production capacity of each of Orem s sources. Included in this discussion is the consideration of how the yield of each source might vary during different climatic conditions (dry and average water years). For purposes of evaluating source production capacity, Orem City sources have been grouped into three categories; springs, wells, and surface water treated at the UVWTP. Springs A portion of Orem City s municipal water originates from Alta Springs and Canyon Springs located in Provo Canyon. Springs are an ideal choice for culinary water due to their low cost of production and high quality of water. Alta Springs is located at a high elevation and supplies water to the Upper Tanks without any required pumping, while Canyon Springs requires a booster station to supply flow to the system. The springs produce very clean water and do not require treatment, except for the addition of chlorine. The spring yield varies seasonally, and the production is dependent on soil moisture and yearly snowpack, in addition to other hydrologic factors. Yields under varying climate conditions were determined by looking at past extremes in available historical water production records and discussions with City personnel. Dry year production for spring sources has been estimated based on metered production during the dry water year of Average year spring production is BOWEN COLLINS & ASSOCIATES 4-2 OREM CITY
31 WATER MASTER PLAN estimated based on average metered production during the period of (from Orem City Water Supply and Demand Model, 2006). The average water yield of developed Orem City springs is 3,838 acre-ft. Reliable yield during dry years is estimated to be 2,958 acre-ft per year. Table 4-2 summarizes the contribution from each spring source. Wells Table 4-2 Source Summary of Existing Springs Average Yearly Yield (acre-ft) Dry Year Yield Source (acre-ft) Alta Spring 3,012 2,321 77% Canyon Spring % Total 3,838 2,958 77% Dry Year Yield Percentage Orem City has a total of 9 municipal groundwater wells which operate under several different water rights. The wells vary in capacity as summarized in Table 2-1 of Chapter 2. As of 2006, Orem City s water right allows for a maximum sustained pumping rate of mgd ( cfs), with a maximum allowable yearly removal of 18,306 acre-ft. Over the past 5 years, the maximum annual volume of groundwater removed via wells was 7,730 acre-feet, leaving more than half of the water right remaining. Although the City s paper water rights designate the City has a right to 18,306 acre-feet, in reality, the volume which could actually be extracted annually without negatively impacting the aquifer(s) is likely less. For this analysis, it has been assumed that the available yield for Orem City wells will be the same in both dry and average years. Utah Valley Water Treatment Plant The majority of water used by Orem City is treated surface water from the UVWTP. Water treated at this location can come from either Provo River direct flow rights or from storage rights in several different mountain reservoirs in the Provo River Drainage via the Metropolitan Water District of Orem. Surface Water Storage The Metropolitan Water District of Orem, through various canal companies, currently maintains the rights to a total of 13,861 acre-ft per year of surface water from mountain storage reservoirs. The breakdown of reservoir storage is shown in Table 4-3. While Orem currently has the right to 6,520 acre-feet of storage from the Bonneville (CUP) Project, this allotment increases by 500 acrefeet each year until 2017 when the total available volume will be 7,520 acre-feet. Table 4-3 provides a summary of Orem City s surface water storage reservoirs. BOWEN COLLINS & ASSOCIATES 4-3 OREM CITY
32 WATER MASTER PLAN Table 4-3 Summary of Surface Water Storage Reservoirs Reservoir Name Description* Storage Quantity (acre-ft) Jordanelle Upper Lakes 1,161 Jordanelle Bonneville (CUP) Project 6,520 Deer Creek DC Project Issue 1 1,300 Deer Creek DC Project Issue Deer Creek DC Project Issue Deer Creek Dixon Irrigation Co. 300 Deer Creek Provo Bench Canal Co. 900 Deer Creek PRWUCO 3,246 Total 14,381 *Source: Orem City Water Supply and Demand Model, 2006 Provo River Direct Flow Rights As of 2006, Orem City maintains a Class A Provo River direct flow right of mgd ( cfs) during the period of April 20 th to October 15 th. However, this allotment decreases to 84% of the original value on June 21 th each year (down to 24.4 mgd/45.5 cfs), with another reduction on July 21 th which further reduces the right to 79% of the original value (27.7 mgd/42.8 cfs). In average water years, the total yield is approximately 16,812 acre-ft, with a peak day demand production of mgd (42.8 cfs). During dry years, water yields from the Provo River can be significantly reduced. In the City s 2006 Supply and Demand model, it was estimated that dry year yields could be as little as 20 percent of average year flows. Total yield during a dry year (assuming 20 percent of average year yield) is estimated to be 3,706 acre-ft with an approximate peak day production of 5.53 mgd (8.56 cfs). Total Supply Tables 4-4 and Table 4-5 summarize the amount of water available to Orem City currently and in 2060, respectively. Estimated usable yield is provided for both average and dry years. Table 4-4 Current Usable Yield of Existing Orem City Culinary Water Sources Usable Yield in Average Year (acre-ft) Usable Yield in Dry Year (acre-ft) Water Source Springs 3,837 2,958 Wells 18,306 18,306 Provo River Rights 16,812 3,706 Deer Creek Storage 6,700 6,700 Jordanelle Storage 1,161 1,161 CUP Water 6,520 6,520 Total 53,336 39,351 BOWEN COLLINS & ASSOCIATES 4-4 OREM CITY
33 WATER MASTER PLAN Table 4-5 Usable Yield of Existing Orem City Culinary Water Sources in 2060 Usable Yield in Average Year (acre-ft) Usable Yield in Dry Year (acre-ft) Water Source Springs 3,837 2,958 Wells 18,306 18,306 Provo River Rights 16,812 3,706 Deer Creek Storage 6,700 6,700 Jordanelle Storage 1,161 1,161 CUP Water 7,520 7,520 Total 54,336 40,351 Comparison of Annual Source Yield to Projected Demand Requirements Figure 4-2 compares the available annual water supply for the City with the predicted annual system demand through build-out. Annual source yield in the figure is presented in terms of dry year yield in order to provide the City with a conservative comparison of supply and demand. Included in the figure are two sets of demand projections: 1. Required production without conservation This projection is based on per capita water use measured in Required production with conservation In this projection, per capita water use has been reduced to meet the State s conservation goal of a 25 percent reduction by 2025 (as discussed in Chapter 3). As shown in Figure 4-2, the City is projected to have sufficient annual water supply if the State Conservation goal is met. However, without conservation, Orem may approach an annual supply deficit by the year 2030 and will need to acquire an additional 8,000 acre-feet worth of supply to meet annual demands at build-out. Figure 4-2 indicates that, while the City has reduced water consumption on average since the year 2000, water use in 2013 exceeded 2000 baseline demands. Thus, the City will likely need to place increased emphasis on conservation if it wants to meet City and State-wide long-term goals. It should be noted that the conclusions above are based on a number of assumptions relative to future yields associated with each source. Any changes to the yields assumed here will require reconsideration of City water needs. Of specific concern are annual groundwater yields. While the City has water rights to the volume of water shown, the amount of water that is physically available or restrictions associated with State of Utah groundwater management efforts could result in actual yields that are less than the amounts shown. It is recommended that the City continue to monitor production from its several sources and revisit projected yields periodically. BOWEN COLLINS & ASSOCIATES 4-5 OREM CITY
34 WATER MASTER PLAN 60,000 Figure 4-2 Projected Annual Production Requirements With and Without Conservation 50,000 Annual Production (acre-ft) 40,000 30,000 20,000 10,000 Additional Supply WRF Effluent Reuse Storage Provo River Natural Flow Well Sources Springs Demand Without Conservation State Conservation Goal Historical Production Notes: Well capacity based on maximum water rights. Storage and natural flow capacity based on Orem City Supply Report (2006), Spring capacity based on dry year yield (2013). BOWEN COLLINS & ASSOCIATES 4-6 OREM CITY
35 WATER MASTER PLAN Additional Sources If reductions in water use associated with conservation are less than expected, or if existing source yields are restricted for any reason, the City may need to consider pursuing additional sources to meet annual demands. If this becomes necessary, the most likely sources of future water for Orem City based on current information are as follows: Wastewater Reuse One source the City could add to its water portfolio is effluent reuse from the Water Reclamation Facility (WRF). A technical memorandum on reusing WRF effluent is located in Appendix C. Projected yield associated with this source based on the recommended alternative identified in this memorandum is 516 acre-ft. Additional Surface Water Supply Any additional source capacity needed beyond existing supplies and reuse would most likely need to come from additional surface water sources. This would likely come in the form of additional Provo River water purchased from existing irrigation shareholders. This water could then be treated at the UVWTP. Table 4-6 lists the estimated additional source yield required to meet future annual production requirements if the City does not reduce its per capita water use through conservation. Table 4-6 Future Annual Source Yield Additional Source Yield for Annual Demands Source (acre-feet/year) Reuse 516* Additional supply 7,484** Total 8,000** *Based on recommended reuse system to Sleepy Ridge Golf Course and Lakeside Sports complex. See WRF Reuse Evaluation memo in Appendix C. **Additional annual supply needed only if the City doesn t achieve its conservation goals PEAK DAY PRODUCTION CAPACITY To this point in the report, only the annual yield of each source has been considered. The following sections discuss the peak production capacity of each of Orem s sources. Springs The total reliable production from the springs is 2,985 acre-feet during dry years and 3,838 acrefeet during average years. Since peak production requirements have historically occurred in July, peak day spring production is estimated based on historical data from this month. Peak day production during average years is estimated based on historical spring production data from , while the peak day production capacity during dry years is estimated from metered data for the dry year of 2013, both evaluated for the month of July. Peak day capacity of the City s spring sources is summarized in Table 4-7. BOWEN COLLINS & ASSOCIATES 4-7 OREM CITY
36 WATER MASTER PLAN Table 4-7 Source Summary of Existing Springs Average Water Year Peak Day Yield (mgd) Dry Water Year Peak Day Yield (mgd) Dry Water Year Peak Day Yield Percentage Source Alta Spring % Canyon Spring % Total % Wells As mentioned in the discussion of annual source production, the City has a total of 9 municipal groundwater wells with varying capacity. From a water rights stand point, the maximum allowable sustained pumping rate for the wells is mgd ( cfs). However, historical data indicates that the City has at times exceeded this pumping rate for a short duration. Peak day capacity for each well was estimated based on actual well production data from It is recommended that the assumed reliable peak production of the wells be reduced for planning purposes to account for potential problems that may arise regarding water quality, pump maintenance at individual wells, or lower aquifer levels during dry periods. This considered, the reliable peak day capacity for each well is estimated as 80% of the recorded maximum daily flow during the year of Table 4-8 presents the location, size, pressure zone, and estimated reliable peak day capacity of each well. Table 4-8 Existing Wells Reliable Peak Capacity Name Address Size (inches) Zone Reliable Capacity (mgd) Well # S 800 E 14 Central 3.64 Well #2 710 N 980 W 12 Central 4.23 Well #3 479 N 400 E 10 Eastside 1.56 Well #4 65 S 1000 E 14 Eastside/Central 4.28 Well #5 56 N State St. 14 Central 4.11 Well #6 950 N 1000 E 12 Central 1.6* Well #7 665 N Palisade Dr. 8 Eastside 0.58 Well #8 701 S State St. 12 Central 4.35 Well #9 800 S 900 E 14 Central 4.77 Total *Well No. 6 is in need of maintenance and is currently operating at a reduced capacity. Orem City is planning to carry out a rehabilitation project on Well No. 6 in the near future to bring well production up to the reliable capacity shown. As shown in Table 4-7, the reliable peak day capacity from Orem s wells is approximately 29 mgd (54 cfs). BOWEN COLLINS & ASSOCIATES 4-8 OREM CITY
37 WATER MASTER PLAN Surface Water Treated at the UVWTP Water treated at the UVWTP is the combination of direct flow from the Provo River and surface water stored in Deer Creek and Jordanelle Reservoir. As has been discussed previously, Orem City has historically been the primary water user at the plant. As a result, it has always had adequate treatment capacity to meet its needs. As additional users begin to take more water from the plant, it seems prudent for the City to formalize its use of peak day production capacity at the plant. This needs to be negotiated between Orem and CUWCD. For the purposes of this analysis, Orem City s portion of the plant capacity has been assumed to be 42 mgd. Comparison of Peak Source Production to Projected Demand Requirements Figure 4-3 compares the projected peak day demand requirement for the Orem City distribution system through build-out (as calculated in Chapter 3) against the available peak day capacity of Orem s current sources. Since dry year conditions are of the greatest concern, only the estimated reliable production during a dry year is shown. Projected peak day production capacities for each of Orem City s current sources are summarized in Table 4-9. Table 4-9 Peak Day Production Capacity of Current Orem City Peak Production during Average Year (mgd) Peak Production during Dry Year (mgd) Source Springs Wells UVWTP Total BOWEN COLLINS & ASSOCIATES 4-9 OREM CITY
38 WATER MASTER PLAN 120 Figure 4-3 Projected Peak Day Demand And Available Supplies 100 Peak Day Demand (mgd) Additional Supply New Well Sources WRF Reuse Existing Well Sources Existing Springs Existing UVWTP Projected Peak Day Demand Historic Production Notes: Existing Well capacity based on 80% of max 2013 production, Spring capacity based on dry year yield (2013), Existing UVWTP capacity based on available data (42 mgd) BOWEN COLLINS & ASSOCIATES 4-10 OREM CITY
39 WATER MASTER PLAN If Orem continues to grow as projected in Chapter 3 of this report, peak day demand on the system will continue to increase and will likely exceed the peak day capacity of the City s existing sources within the next 10 years. The City has already planned on adding approximately 7 mgd of additional groundwater capacity with 1.5 mgd of additional supply via reuse water. However, there will still eventually be a deficit in peak day supply without additional sources. To satisfy future peak day demands on the system, it is recommended that the City develop additional source capacity at the UVWTP or in additional groundwater wells. Figure 4-3 shows the required increases in peak day source capacity to meet future system deficiencies, with a summary of the additional source capacity summarized in Table Table 4-10 Future Peak Day Source Capacity Additional Source Capacity for Peak Day Demands Source (mgd) Wells 7 Reuse 1.48* UVWTP 14.5 Total *Based on recommended reuse system to Sleepy Ridge Golf Course and Lakeside Sports complex. See WRF Reuse Evaluation memo in the Appendix C. While the actual necessity of additional source capacity to meet average annual demands is uncertain at this point in time, additional peak day source capacity will almost certainly be required in the coming years. BOWEN COLLINS & ASSOCIATES 4-11 OREM CITY
40 WATER MASTER PLAN CHAPTER 5 STORAGE CAPACITY EVALUATION The purpose of this chapter is to evaluate Orem City s water storage capacity. This chapter provides an overview of State rules and regulations pertaining to public water system storage facilities. As part of this evaluation, the size and location of existing storage reservoirs was analyzed to determine if the City has sufficient storage to adequately meet peak demands and to provide emergency and fire flow storage. STORAGE EVALUATION CRITERIA Regulations regarding required system storage are found in Section R of the Utah Administrative Code. The first portion of the code outlines the types of storage required: (1) General. Each public water system, or storage facility serving connections within a specific area, shall provide: (a) equalization storage volume, to satisfy average day demands for water for indoor use and irrigation use, (b) fire flow storage volume, if the water system is equipped with fire hydrants intended to provide fire suppression water or as required by the local fire code official, and (c) emergency storage, if deemed appropriate by the water supplier or the Director. Each of these storage components is discussed below. Equalization Storage Equalization storage is the water needed to supply the system for periods when demands exceed the supply. Equalization storage requirements are defined in the code as follows: (2) Equalization Storage. (a) All public drinking water systems shall provide equalization storage. The amount of equalization storage varies with the nature of the water system, the extent of irrigation use, and the location and configuration of the water system. (b) Table lists required equalization storage for indoor use. Storage requirements for non-community systems not listed in this table shall be determined by calculating the average day demands from the information given in Table BOWEN COLLINS & ASSOCIATES 5-1 OREM CITY
41 WATER MASTER PLAN Type TABLE Storage Volume for Indoor Use Volume Required (gallons) Community Systems Residential; per single resident service connection 400 Non-Residential; per Equivalent Residential Connection (ERC) 400 Non-Community Systems Modern Recreation Camp; per person 30 Semi-Developed Camp; per person a. with Pit Privies 2.5 b. with Flush Toilets 10 Hotel, Motel and Resort; per unit 75 Labor Camp; per unit 25 Recreational Vehicle Park; per pad 50 Roadway Rest Stop; per vehicle 3.5 Recreational Home Development (i.e., developments with limited water use); per connection (See Note 2 in Table 510-1) 400 (c) Where a drinking water system provides water for irrigation use, Table shall be used to determine the minimum equalization storage volumes for irrigation. The procedure for determining the map zone and irrigated acreage for using Table is outlined in R (3). TABLE Storage Volume for Irrigation Use Map Zone Volume Required (gallons/irrigated acre) 1 1, , , , , ,964 BOWEN COLLINS & ASSOCIATES 5-2 OREM CITY
42 WATER MASTER PLAN Calculated Need for Equalization Storage From this section of code, there are two important issues to highlight. The first is described in the following sentence: The amount of equalization storage varies with the nature of the water system, the extent of irrigation use, and the location and configuration of the water system. Staff at the Division of Drinking Water have interpreted this to mean that the need for equalization storage will vary between systems. This means that, where reliable water use data exists, the volume of equalization storage needed should be calculated based on actual water use patterns. Because Orem City has a good database of water use records, BC&A prepared a City specific calculation of equalization storage for the master plan. Figure 5-1 shows the dominant demand pattern for Orem City based on measured flows through the Alpine IIB and Reach II flow meters during the peak week of demand in As can be seen in the figure, water demands peak in the early morning hours when most people are irrigating their lawns. Demand then drops off significantly during the day as water use is primarily limited to smaller indoor uses. While demands vary significantly during the day, the same is not true for most supplies. It is usually most economical to size sources, major conveyance pipelines, and pump stations to produce water at a relatively constant rate. This is especially true for major surface water treatment facilities that have a difficult time changing production rates rapidly. As a result, most systems (Orem City s included) are designed supply to water at a relatively constant rate throughout the day. Storage is then used to satisfy any demands above the rate of supply. With this in mind, Figure 5-1 shows the difference between demand and supply throughout a peak day of demand. During the hours of greatest demand, water from storage is used to meet demand in excess of supply (as shown in red). During periods of lower demand, supply continues at its steady pace to refill storage reservoirs in preparation for peak demands the next day (as shown in blue). Based on the measured flows and as shown in the figure, the required equalization storage for the City was calculated to be approximately 25 percent of average peak day demands. Using this approach, the calculated existing equalization storage requirement for the City is 15.4 million gallons. This is 25 percent of the City s existing peak day demand of 61.5 million gallons (42,720 gallons per minute). BOWEN COLLINS & ASSOCIATES 5-3 OREM CITY
43 WATER MASTER PLAN Figure 5-1 Orem City Diurnal Pattern Peak Hour Demand Equalization Storage ~ 25% 1.4 Peaking Factor Peak Day Demand Storage Draining Storage Filling Hour BOWEN COLLINS & ASSOCIATES 5-4 OREM CITY
44 WATER MASTER PLAN Minimum Requirement for Equalization Storage As noted previously, there is a second important issue in the section of the Utah Administrative Code regarding equalization storage that needs to be discussed. This is highlighted in the following section of the code: Table lists required equalization storage for indoor use. Storage requirements for noncommunity systems not listed in this table shall be determined by calculating the average day demands from the information given in Table This section is then followed by a series of tables that can be used to estimate average demands if a system does not have reliable flow data. While the tables provide some interesting information regarding typical average day water demands, the most important issue to note is that the minimum equalization storage allowed by the State is equal to the average day demand. Where reliable data exists, the entity is not required to use the values in the table (which are conservatively high in most cases), but may use actual average day demands. Based on historic use patterns, the expected average day demand for the City (existing, without conservation) is 26.8 million gallons (30,000 acre-ft/year). This means that Orem City must have a minimum of 26.8 million gallons of equalization storage in its system. It will be noted that this is significantly more storage than the 15.4 million gallons needed for equalization purposes based on actual measured variations in demands. However, the State does allow for emergency storage to be counted against this minimum requirement as will be discussed subsequently. Fire Flow Storage Fire flow storage requirements are defined in the code as follows: (3) Fire Flow Storage. (a) Fire flow storage shall be provided if fire flow is required by the local fire code official or if fire hydrants intended for fire flow are installed. (b) Water systems shall consult with the local fire code official regarding needed fire flows in the area under consideration. The fire flow information shall be provided to the Division during the plan review process. (c) When direction from the local fire code official is not available, the water system shall use Appendix B of the International Fire Code, 2015 edition, for guidance. Unless otherwise approved by the local fire code official, the fire flow and fire flow duration shall not be less than 1,000 gallons per minute for 60 minutes. As stated in the code, the primary authority responsible for establishing needed fire flows and fire flow storage is the local fire code official. As established by Orem City s fire marshal in a recent ISO survey, the maximum fire flow requirements varies by development type and size and ranges from 1,500 gpm in predominantly residential areas to 4,000 gpm in commercial areas. For the purposes of the master plan, fire flows in residential areas have been established at 2,000 gpm for 2 hours, while commercial areas require 4,000 gpm for 4 hours. Although not specifically outlined in the code, State Division of Drinking Water officials have historically allowed for fire flow for BOWEN COLLINS & ASSOCIATES 5-5 OREM CITY
45 WATER MASTER PLAN individual water pressure zones to come from storage within the zone itself or from storage in higher zones in the system. This is a positive for Orem because it means that the City does not have to build fire flow storage in every zone (e.g. fire suppression storage in the Cherappple Pressure Zone can also be counted as available fire suppression storage for all the regulated zones below Cherapple). For the system as a whole, the required fire flow volume is equal to the largest single fire flow demand. In the case of Orem City, this is 4,000 gpm for 4 hours (960,000 gallons). Emergency Storage Emergency storage is the volume of water required to meet water demand during an emergency situation. Emergency storage requirements are defined in the code as follows: (4) Emergency Storage. Emergency storage shall be considered during the design process. The amount of emergency storage shall be based upon an assessment of risk and the desired degree of system dependability. The Director may require emergency storage when it is warranted to protect public health and welfare. It will be noted that no specific requirement is given for emergency storage in the code. The determination of required emergency storage is left largely to the entity designing and operating the water system. In Orem City, the most common water supply emergencies relative to storage analysis are power outages. During power outages, water supplies are unable to produce needed water. In the event of an extended citywide outage, all wells and the treatment plant would not be able to operate. While some water delivery during a power outage can be accomplished through auxiliary power to selected water system facilities, it is also wise to include some additional emergency water at storage reservoirs. This also gives system operators the benefit of a little extra buffer for system operations. Orem City s water supply is also heavily dependent on water from the UVWTP. If the treatment plant were to go offline unexpectedly, it would be difficult for Orem to meet citywide demands. In the short-term, Orem could satisfy critical indoor demands with its wells and spring water under this type of scenario. However, in the long-term, this would create a major problem for water deliveries to the City. Based on conversations with City personnel and common practice in the industry, it is recommended that all zones include emergency storage adequate to supply the system during a 6 hour power outage during peak day demands (or roughly 25 percent of peak day demand). This results in an existing emergency storage need of 15.4 million gallons for existing conditions. Combined Emergency/Equalization Storage With the volume of recommended emergency storage identified above, the combined equalization/emergency storage required for Orem City is 30.8 million gallons (existing conditions). Since the State does not specifically require emergency storage, this full volume can be compared against the State s minimum equalization storage requirement based on average day demand (26.8 million gallons). For Orem City, it appears that the recommended volume with both equalization and emergency storage is adequate to meet State minimum requirements. BOWEN COLLINS & ASSOCIATES 5-6 OREM CITY
46 WATER MASTER PLAN It should be noted that Orem City could modify its emergency storage criteria to reduce the total amount of storage required. As long as the combined emergency/equalization storage is above 26.8 million gallons (existing conditions), it would meet the minimum requirements of the State. However, this would leave the City with less than desired protection during emergency events and would reduce the available buffer it has for operations. As a result, a reduction in emergency storage is not recommended. TOTAL EXISTING AND FUTURE STORAGE REQUIREMENTS The evaluation of City water storage facilities for existing and future conditions is shown in Tables 1 and 2. As can be seen in the tables, the analysis indicates there is an existing storage shortage of almost 10 million gallons. By 2060, the shortage increases to approximately 22.5 million gallons. It should be emphasized that these tables reflect Orem City demands only; Vineyard demands have not been included in the tables. Note that storage at Canyon Springs (50,000 gal) has been included in the WTP storage because it flows to the same tank service area. Up to this point, these deficiencies have likely not caused any operational issues due to the fact that Orem currently has access to unused storage at the UVWTP. However, as demands increase in the City and storage from the plant is allocated to additional entities, this buffer will shrink and storage will become much more important for satisfying peaks in demand. BOWEN COLLINS & ASSOCIATES 5-7 OREM CITY
47 WATER MASTER PLAN Tank Service Area Peak Day Summer Demand (gpm) Peak Day Summer Equalization Storage (gallons) Emergency Storage (gallons) Table Storage Facilities Evaluation Fire Flow Storage (gallons) Total Required Storage (gallons) Available Storage (gallons) Equalization Storage Surplus by Service Area (deficit) (gallons) Total Storage Surplus by Service Area (deficit) (gallons) Storage Surplus Total (deficit) (gallons) Cherapple 71 25,560 25, , , , , , ,880 Upper Tanks 4,709 1,695,240 1,695,240-3,390,480 4,000,000 2,304, , ,400 WTP 8,056 2,900,160 2,900, ,000 6,520,320 9,550,000 6,649,840 3,029,680 3,748,080 Lower Tanks 29,885 10,758,600 10,758,600-21,517,200 8,000,000 (2,758,600) (13,517,200) (9,769,120) Total 42,721 15,379,560 15,379, ,000 31,719,120 21,950,000 (9,769,120) Tank Service Area Peak Day Summer Demand 1 (gpm) Peak Day Summer Equalization Storage (gallons) Emergency Storage (gallons) Table Storage Facilities Evaluation Fire Flow Storage (gallons) Total Required Storage (gallons) Available Storage (gallons) Equalization Storage Surplus by Service Area (deficit) (gallons) Total Storage Surplus by Service Area (deficit) (gallons) Storage Surplus Total (deficit) (gallons) Cherapple 74 26,640 26, , , , , , ,720 Upper Tanks 5,174 1,862,640 1,862,640-3,725,280 4,000,000 2,137, , ,440 WTP 8,573 3,086,280 3,086, ,000 6,892,560 9,550,000 6,463,720 2,657,440 3,038,880 Lower Tanks 46,439 16,718,040 16,718,040-33,436,080 8,000,000 (8,718,040) (25,436,080) (22,397,200) Total 60,260 21,693,600 21,693, ,000 44,347,200 21,950,000 (22,397,200) 1 Does not include peak day summer demands for Town of Vineyard; Orem City will not provide storage to Town of Vineyard. BOWEN COLLINS & ASSOCIATES 5-8 OREM CITY
48 WATER MASTER PLAN CONCLUSIONS AND RECOMMENDATIONS The following conclusions can be made regarding storage in the Orem City water distribution system: 1. Total Storage The Orem City water system currently has a total of million gallons of storage. Based on the criteria established previously, the water system currently has a deficiency of 9.8 million gallons of storage. By 2060, the system will have a storage deficiency of 22.4 million gallons if additional storage facilities are not constructed. It should be noted that these totals only reflect the system as a whole. 2. Storage deficiencies in the system affect the Lower Tanks, which provide storage to the Central pressure zone and zones below the Central zone. These zones represent the majority of the Orem City service area. Up to this point, these deficiencies have likely not caused any operational issues due to the fact that current source capacities exceed peak system demands and also because Orem currently has access to unused storage in the UVWTP. However, as demands increase in the City and storage from the plant is allocated to additional entities, this buffer will shrink and storage will become much more important for satisfying peaks in demand. Fortunately, because the storage deficiencies occur at the lower portions of the system, the City will have more options with respect to the site location of a new storage facility. 3. While Orem currently only has 9.5 million gallons of dedicated storage at the UVWTP, the plant has a total combined volume of 37 million gallons of storage. Rather than constructing an additional storage tank, it may be cost-effective for the City to look into acquiring additional storage capacity at the plant. While there is likely not enough available storage at the plant to cover all storage needs for the City through build-out, it may provide sufficient storage to delay and reduce the size of new tank construction. Coordination with CUWCD will help the City coordinate the timing of when additional storage may need to be constructed. Based on these conclusions, BC&A would recommend the following actions: 1. Construct a New 10 Million Gallon Storage Reservoir To remediate the current storage deficiency in the water system, BC&A recommends that the City construct a new 10 million gallon storage facility. As soon as possible, the City should initiate a tank siting study to locate an ideal location for construction. As discussed previously, because the storage deficiencies exist in the lower pressure zones, the City has the liberty of looking at a variety of tank locations which would provide adequate elevation for the system. 2. Consider Options for Future Storage Requirements While a new 10 MG water storage facility will help alleviate the existing storage deficiencies in the system, the City will still face an additional 12.7 million gallon storage deficit between now and projected build-out in While additional storage improvements will likely not be included in the 10-year capital facilities plan, the City should begin to consider options to meet future storage needs. Options may include constructing additional storage facilities or acquiring additional storage capacity at the UVWTP. Table 5-3 displays the timing and estimated cost of the recommended storage improvements for the City. BOWEN COLLINS & ASSOCIATES 5-9 OREM CITY
49 WATER MASTER PLAN Table 5-3 Recommended Storage Tank Improvements Project Project Year Estimated Cost (2015 Dollars) 10 Million Gallon Storage Tank Siting Study 2015 $100, Million Gallon Storage Facility* 2018 $10,322, Million Gallon Storage Facility* (With Study) 2030 $12,960,000 TOTAL COST $23,382,000 *Does not include the potential cost of land acquisition BOWEN COLLINS & ASSOCIATES 5-10 OREM CITY
50 WATER MASTER PLAN CHAPTER 6 HYDRAULIC MODELING INTRODUCTION A critical component in evaluating the performance of the Orem City water system is the development of a hydraulic computer model. A hydraulic model was developed using Innovyze s InfoWater software. The purpose of this chapter is to present a summary of the methodology used to develop this model. WATER SYSTEM MODEL A hydraulic computer model is a digital representation of physical features and characteristics of the water system, including pipes, valves, storage tanks and pumps. Key physical components of a water system are represented by a set of user-defined parameters that represent the characteristics of the system. The computer model utilizes the digital representation of physical system characteristics to mathematically simulate operating conditions of a water distribution system. Computer model output includes pressures at each node, flow rate for each pipe in the water system, and water surface levels in storage tanks. There are several well-known computer programs for modeling water distribution systems. InfoWater 10.2 developed by Innovyze was used for this Master Plan. This program uses the EPANET computing engine. The City s existing water system hydraulic model was updated by Bowen, Collins & Associates for this study using available GIS data in conjunction with historic demand and production data provided by Orem City personnel. The model was set up to run a steady state simulation, and is primarily intended to identify pressure and pipe deficiencies in the distribution system, such as undersized water lines. The steady state model does not track dynamic, time-dependent variables, such as the depth of water in a storage tank throughout the course of a day. Additional information regarding the history and calibration of the model is discussed in Appendix D. GIS DATA The GIS data used to update the water system model included: Pipeline locations, diameters, and lengths Water system valves, pumps, and water tanks Elevation contours CALIBRATION Calibration is the task of adjusting hydraulic model parameters so that model output results correlate with actual observed conditions in the water system. Model calibration was achieved by checking model pressure outputs against field measured pressure readings at a number of PRV s throughout the system as well as through communication with City personnel. A few assumptions regarding the calibration of the model are listed below: BOWEN COLLINS & ASSOCIATES 6-1 OREM CITY
51 WATER MASTER PLAN Pipe Roughness Pipe roughness in the distribution system varies between 110 and 130 with an average of approximately 115. Pipe Size Data Pipe diameters and locations in the model were determined based on the available GIS data from the City. The diameters assigned in the City s existing model were checked against updated GIS information and updated or revised where necessary. Pipe Depth Junction elevations in the model were extracted from a Digital Elevation Model which represents the elevation of the ground surface throughout the City. In reality, pipes sit 4 to 5 feet below the ground surface, but the relative model elevations are the same. Pump Curves Model pump curves remained the same as they were input into the City s original model. Pump curve data for Well #9, which was installed relatively recently, was provided by City personnel and updated in the model. MODEL DEMANDS AND DEMAND DISTRIBUTION A key component in hydraulic modeling is the development of system demands. There are two components to consider when developing the demands for the model: total system demands and distribution of demands. Total system demands are discussed in Chapter 3 of this report. For modeling purposes, the demand scenarios of most concern are those that represent the highest flow demands on the system. These scenarios are peak hour demand and peak day demand with a simultaneous fire flow event. A peak hour to peak day factor of 1.8 was used in the model simulations. This value was calculated using flow meter data for the peak week of demand in Total model flows for peak day and peak hour demands are summarized in Table 6-1. Table 6-1 Projected Peak Demands Year Peak Day Demand (mgd) Peak Hour Demand (mgd) Existing It should be noted that demands in the table include Orem City demands as well as contractual demands to Vineyard. In the case of Vineyard, Orem City is only required to satisfy peak day demands with Vineyard providing its own storage to meet peak hour demands. Thus, actual demand on the City s transmission and distribution system will be lower than the values contained in the table. The interaction of Vineyard s storage on overall demands is an issue that will need to be considered closely as future plans for storage are finalized. BOWEN COLLINS & ASSOCIATES 6-2 OREM CITY
52 WATER MASTER PLAN The distribution of system demands was accomplished with the aid of meter data provided by the City. Metered water usage data from June and July of 2013 which contained metered flows and geospatial references were imported into the model and assigned to a model junction based on the geographic coordinate. Meter data for municipal meters was then assigned to the model based on the service area of each meter. Since not all meters had a corresponding geospatial location and meters do not account for system losses, model demands were then scaled to appropriately match the total peak day demand for the system. Demand distribution for future system model scenarios, such as the build-out demand scenario, were developed using the MAG TAZ growth projections across the City as discussed in Chapter 3. BOWEN COLLINS & ASSOCIATES 6-3 OREM CITY
53 WATER MASTER PLAN CHAPTER 7 DISTRIBUTION SYSTEM EVALUATION The purpose of this chapter is to document the results of the hydraulic modeling evaluation of the Orem City distribution system. MODEL SCENARIOS As discussed in Chapter 6, the Orem City model is set up to run a steady state flow simulation. This provides a snapshot of the system under steady state conditions. The steady state conditions that were modeled represent the most extreme demand conditions that the system will experience including peak hour demands and peak day demands with fire flow. The following is a description of each model scenario simulated in the hydraulic model: Peak Day Demand This scenario represents the average demands on the system during the peak usage day for existing conditions (2014) Peak Hour Demands The purpose of this scenario is to identify existing deficiencies under peak hour demand conditions. For this simulation, a peak hour factor of 1.8 was used based on flow meter data provided by the City Peak Day Demand with Fire Flow This scenario identifies potential deficiencies in the system under existing peak day demand conditions with fire flow demands Winter Demand Set This scenario identified locations with potentially high system pressures during low demands when pipe friction losses are minimal. Winter demands were developed by multiplying summer demands by approximately 0.05 to represent winter nighttime demands Peak Day Demand This scenario represents the average demands on the system at build-out (2060) during the projected peak usage day during the year Peak Hour Demand The purpose of this scenario is to identify potential deficiencies under peak hour demand conditions in the year This scenario was developed by applying a 1.8 peaking factor to the 2060 peak day demand Peak Day Demand with Fire Flow This scenario was used to identify potential fire flow deficiencies at build-out. Since fire flow deficiencies are usually the result of locally undersized pipes, buildout fire flow deficiencies closely match existing fire flow deficiencies Peak Hour Demand This scenario was developed in order to aid in the timing of future system improvements between the current system and the system at build-out Peak Hour Demand This scenario was developed to help determine the timing on pipeline improvements between now and build-out. BOWEN COLLINS & ASSOCIATES 7-1 OREM CITY
54 WATER MASTER PLAN Source Failure Scenarios Along with the model scenarios outlined above, additional model scenarios were simulated to determine the ability of the system to deliver water to customers during a source failure. The following source failure scenarios were evaluated. UVTWP Failure The most impactful source failure scenario for the City of Orem involves the complete shutdown of the UVWTP. Under such a scenario, the system would not be capable of supplying peak day demands once emergency storage has been depleted. In the case of a treatment plant failure, well and spring water would become the primary sources for the City. Under this scenario, sources would only have the capacity to satisfy indoor (winter) demands. From a distribution stand point, spring flow would be utilized in the upper zones (Alta, Cherapple, Northridge, Timpanogos, Cascade, and Treatment Plant) while well flow would satisfy remaining demands. Individual Well Failure The hydraulic model was used to evaluate the system pressures with each well turned off one by one. This is done to verify that there are no portions of the system that are dependent on the operation of a particular well to provide adequate pressure during peak demands. EVALUATION CRITERIA The performance of the system was evaluated using the following criteria: Pressure within the system during peak demands - The State of Utah requires that a public water system maintain a minimum pressure standard of 30 psi during peak hour demands and 40 psi during peak day demands. Orem City personnel have indicated its design criteria is to keep pressures above 50 psi during peak hour demands with a maximum pressure of 150 psi for static demand conditions. For most parts of the City, the City tries to maintain pressures between 60 psi and 120 psi. Pressure within the system during peak day demands with fire flow The State of Utah requires that a public water system be capable of conveying the required fire flow with a residual pressure of 20 psi. Any node in a residential area incapable of supplying 1,500 gpm with a 20 psi residual was identified as deficient. Commercial areas were evaluated with a fire flow of up to 4,000 gpm with a 20 psi residual pressure (including areas around University Place). Maximum pipe velocities While high instantaneous velocities in a pipeline are not generally as much of a concern to the system as low pressures, they can cause damage to pipes and potentially lead to pipe failure. High velocities alone do not generally require improvements to eliminate the velocity issues, but indicate areas where additional conveyance improvements will have the most benefit. Pipelines with velocities above 7 ft/sec indicated areas where additional conveyance improvements would be beneficial. Any pipeline which displayed a maximum velocity greater than 10 ft/sec was flagged as a deficient pipe. BOWEN COLLINS & ASSOCIATES 7-2 OREM CITY
55 WATER MASTER PLAN SYSTEM EVALUATION RESULTS Existing System with Current Development Conditions The hydraulic computer model was used to simulate system conditions for the 2014 Winter (Static), 2014 Peak Day, 2014 Peak Hour, and 2014 Fire Flow (with PDD) demand scenarios. Model results for critical model scenarios under existing demands are included in the following figures: 1. Figure 7-1 shows pressures for the 2014 Winter Demand Scenario 2. Figure 7-2 shows pressures for the 2014 Peak Hour Demand Scenario 3. Figure 7-3 the available fire flow in conjunction with 2014 Peak Day Demands As shown in Figure 7-1, the majority of the system pressures under a winter demand scenario range from 50 to 120 psi. However, a limited number of locations in the system, namely at the lower end of the Alta, Timpanogos, and Westside pressures zones, display relatively high pressures above 120 psi. These are locations that the City should be aware of in case maintenance is needed, but do not require any specific remedies. As can be seen in Figure 7-2, all areas of the City s system currently meet State of Utah guidelines for pressure, but there are many areas in the Central pressure zone that fall below the City s preferred criteria of 50 psi during peak hour demands, with some areas in the Central pressure zone dropping below 40 psi. Figure 7-3 indicates the results of the fire flow simulation during peak day demands. As shown in the figure, there are a number of model junctions with available fire flow less than the recommended 1,500 gpm. The deficient nodes are a result of undersized water lines or long dead ends. Many of these deficiencies can be remedied by upsizing or looping existing waterlines. Existing System with Buildout Development Conditions Model results for critical model scenarios under buildout demands are included in the following figures: 1. Figure 7-4 shows pressures for the 2060 Peak Hour Demand scenario without improvements. 2. Figure 7-5 shows pressures for the 2060 Peak Hour Demand scenario with improvements. With the existing infrastructure in the model, buildout peak hour demands drop pressures significantly throughout the system as shown in Figure 7-4. Velocities through system pipes also exceed 10 ft/sec in many locations. In order to remedy deficiencies in the system, new pipes were added to the build-out model until pressures across the system were at or above the City evaluation criteria as shown in Figure 7-5. Recommended improvements to satisfy the City s evaluation criteria are discussed below. BOWEN COLLINS & ASSOCIATES 7-3 OREM CITY
56 WATER MASTER PLAN RECOMMENDED DISTRIBUTION SYSTEM IMPROVEMENTS Based on the results of the computer model evaluation and input from City personnel, several system improvements have been identified through build-out. Once these improvements are completed, the Orem City transmission and distribution system will be capable of meeting the performance criteria outlined previously. It should be noted that the build-out model demand inputs take into account a reduction in demand at the Sleepy Ridge Golf Course and Lakeside Sports Complex as a result of the Water Reclamation Facility Reuse plan discussed in the technical memorandum located in Appendix C. This is an essential project to the long-term conveyance plan of the City. If reuse does not occur for any reason, the modeling results and subsequent improvements identified in this master plan will need to be re-evaluated. Major Conveyance Improvements As the City of Orem continues to grow, improvements will need to be made to the water conveyance system to keep up with increasing demands. Since the majority of the east side of the City has already reached or is approaching build-out development conditions, new development is mostly occurring in the western region of the City. However, the bulk of Orem s sources are located in the northeast region of the City. This will require major conveyance improvements from east to west and north to south to meet the increased water demands in the west/southwest regions of the City. Because replacing large transmission lines can be difficult and expensive, the majority of major conveyance improvements involve the installation of parallel water lines to meet the required capacity. The following is a description of each recommended major conveyance improvement. Figure 7-6 shows the location and size of proposed projects, and Table 7-1 provides an overall summary of the projects. Note that many of the projects are shown as parallel pipelines. During the design process, the alignments for proposed projects should be evaluated to determine the best route to provide conveyance to intended destinations. Factors that may affect alignments include traffic, existing utility congestion, right-of-way width, easements, and other special considerations. In some cases, a parallel pipeline may not be the best option and the City may end up replacing an existing pipeline at a larger diameter. It should also be noted that a significant number of the recommended improvement projects for the City are a result of growth occurring in areas to the west of Orem, including the Town of Vineyard. Cost share for improvements which provide benefit for both the City of Orem and the Town of Vineyard should be evaluated in the next Impact Fee Facility Plan and Impact Fee Analysis. During this evaluation, the City should develop a pro rata cost share using the hydraulic model to allocate costs to each entity. Since the City of Orem cannot collect impact fees directly from new development in the Town of Vineyard, developing a cost share plan for improvement projects will require coordination and specific agreements between each municipality. C South Transmission Line. To address low pressure issues in the Central Pressure Zone at build-out, a new water line is recommended to be installed in the vicinity of 400 South running parallel to the existing 16-inch water pipe. The new line begins with a 30-inch pipe connected to the existing Reach II Pipeline, ends with a 12-inch diameter pipe at 800 West, and has intermediate diameters of 24-inch and 20-inch along the stretch of pipe. This pipeline will serve as primary BOWEN COLLINS & ASSOCIATES 7-4 OREM CITY


57 L E G E N D Junctions Pressure <=30 psi Water Lines Diameter 6" or less psi 8" psi 10" psi 12" >120 psi ³ P.R.V.s UT ModelTanks ÍÎ$ "M Wells 14" 16" 20" 24" 30" ALTA Canyon Spring Wet Well UT 1600 N 36" Pressure Zones Pressure Zones 1200 W State St 400 W CASCADE Main St TIMPANOGOS 400 E NORTHRIDGE 800 E CHARAPPLE CHERAPPLE CHERRAPPLE ALTA UPPER TANKS TREATMENT_PLANT Geneva Road 1300 E LOWER TANKS 1200 N TREATMENT PLANT CASCADE WELL#6 800 N WELL#2 WELL#7 WELL#3 400 N WESTSIDE EASTSIDE Center St WELL#5 WELL#4 CENTRAL 400 S WELL#8 WELLl#9 800 S SPRINGWATER CARTERVILLE 1200 S University Pkwy WELL# S LAKEVIEW OREM CITY WATER MASTER PLAN STATIC DEMAND FOR 2014 CONDITIONS NORTH: NORTH SCALE: 0 1,250 2,500 Feet FIGURE NO. 7-1 P:\Orem City\2013 Master Plans\6.0 Reports and Memos\6.2 Draft Report\Water Report - Neal's Corrections\GIS Figures\Water-Figure 7-1-Static-b.mxd amckinnon 3/18/2016


58 L E G E N D Junctions PRESSURE <=30 psi Water Lines Diameter 6" or less psi 8" psi 10" psi 12" >120 psi ³ P.R.V.s UT ModelTanks ÍÎ$ "M Wells 14" 16" 20" 24" 30" ALTA Canyon Spring Wet Well CS UT 1600 N 36" Pressure Zones Pressure Zones 1200 W State St 400 W CASCADE Main St TIMPANOGOS 400 E NORTHRIDGE 800 E CHARAPPLE CHERAPPLE CHERRAPPLE ALTA UPPER TANKS TREATMENT_PLANT Geneva Road 1300 E LOWER TANKS 1200 N TREATMENT PLANT CASCADE WELL#6 800 N WELL#2 WELL#7 WELL#3 400 N WESTSIDE EASTSIDE Center St WELL#5 WELL#4 CENTRAL 400 S WELL#8 WELLl#9 800 S SPRINGWATER CARTERVILLE 1200 S University Pkwy WELL# S LAKEVIEW OREM CITY WATER MASTER PLAN PEAK HOUR DEMAND FOR 2014 CONDITIONS NORTH: NORTH SCALE: 0 1,250 2,500 Feet FIGURE NO. 7-2 P:\Orem City\2013 Master Plans\6.0 Reports and Memos\6.2 Draft Report\Water Report - Neal's Corrections\GIS Figures\Water-Figure 7-2-Ex PHD.mxd amckinnon 3/18/2016


59 L E G E N D Junctions Flow 20 psi <500 Water Lines Diameter 6" or less " " " > " UT ModelTanks ³ P.R.V.s ÍÎ$ "M Wells 16" 20" 24" 30" 36" Pressure Zones 1600 N 1200 N Geneva Road Pressure Zones 1200 W State St 400 W Main St 800 E 400 E NORTHRIDGE TIMPANOGOS CHARAPPLE UT CHERRAPPLE UT CHERAPPLE ALTA TREATMENT PLANT UPPER TANKS TREATMENT_PLANT UT UT 1300 E LOWER TANKS CASCADE WELL#6 800 N WELL#2 WELL#7 WELL#3 400 N WESTSIDE EASTSIDE Center St WELL#5 WELL#4 CENTRAL 400 S WELL#8 WELLl#9 800 S SPRINGWATER CARTERVILLE 1200 S University Pkwy WELL# S LAKEVIEW OREM CITY WATER MASTER PLAN PEAK DAY DEMAND WITH FIRE FLOW 2014 CONDITIONS NORTH: NORTH SCALE: 0 1,250 2,500 Feet FIGURE NO. 7-3 P:\Orem City\2013 Master Plans\6.0 Reports and Memos\6.2 Draft Report\Water Report - Neal's Corrections\GIS Figures\Water-Figure Available FF.mxd amckinnon 3/18/2016


60 L E G E N D Junctions PRESSURE <=30 psi psi psi psi >120 psi ³ P.R.V.s "M Wells UT ModelTanks ÍÎ$ Velocity (fps) Canyon Spring Wet Well CS "MUT >10.0 Pressure Zones 1200 W State St 400 W Main St 400 E NORTHRIDGE 800 E CHARAPPLE CHERAPPLE CHERRAPPLE 1600 N TIMPANOGOS ALTA UPPER TANKS TREATMENT_PLANT Geneva Road 1300 E LOWER TANKS 1200 N TREATMENT PLANT CASCADE WELL#6 800 N WELL#2 WELL#7 WELL#3 400 N WESTSIDE EASTSIDE Center St WELL#5 WELL#4 CENTRAL 400 S WELL#8 WELLl#9 800 S SPRINGWATER University Pkwy CARTERVILLE 1200 S WELL# S LAKEVIEW OREM CITY WATER MASTER PLAN PEAK HOUR DEMAND FOR FUTURE CONDITIONS WITH EXISTING PIPES NORTH: NORTH SCALE: 0 1,250 2,500 Feet FIGURE NO. 7-4 P:\Orem City\2013 Master Plans\6.0 Reports and Memos\6.2 Draft Report\Water Report - Neal's Corrections\GIS Figures\Water-Figure 7-4- BoPHD-Pressure No Improvements.mxd amckinnon 3/18/2016

61 L E G E N D Junctions PRESSURE <=30 psi psi psi psi >120 psi UT ModelTanks ³ P.R.V.s "M Wells ÍÎ$ Pressure Zones 1600 N 1200 W State St 400 W Main St 800 E 400 E NORTHRIDGE TIMPANOGOS CHARAPPLE CHERAPPLE CHERRAPPLE ALTA UPPER TANKS TREATMENT_PLANT Geneva Road 1300 E LOWER TANKS 1200 N TREATMENT PLANT CASCADE WELL#6 800 N WELL#2 WELL#7 WELL#3 400 N WESTSIDE EASTSIDE Center St WELL#5 WELL#4 CENTRAL 400 S WELL#8 WELLl#9 800 S SPRINGWATER CARTERVILLE 1200 S University Pkwy WELL# S LAKEVIEW OREM CITY WATER MASTER PLAN PEAK HOUR DEMAND FOR FUTURE CONDITIONS WITH IMPROVEMENTS NORTH: NORTH SCALE: 0 1,250 2,500 Feet FIGURE NO. 7-5 P:\Orem City\2013 Master Plans\6.0 Reports and Memos\6.2 Draft Report\Water Report - Neal's Corrections\GIS Figures\Water-Figure 7-5- BoPHD-Pressure with Improvements.mxd amckinnon 3/18/2016
62 WATER MASTER PLAN means of conveyance from the Reach II Pipeline to new development in the western region of the City. C North Transmission Line (To Murdock Canal). Build-out model simulations indicate future pressure deficiencies in the Northridge, Timpanogos, and northern region of the Central Pressure Zones due to inadequate transmission line capacity. To remedy these future deficiencies, it is recommended that a new parallel waterline be installed at approximately 1600 North starting at 800 East. The first phase of this project would extend a new 30-inch/24-inch pipe from 800 East down to the PRV fault located near Murdock Canal. C-3. South Orem Boulevard between 800 South and 1200 South Transmission Line. Model outputs indicated pressure deficiencies in the south region of the Central Pressure Zone near the Orem/Provo city border. To provide adequate system pressures and reduce high pipe velocities, a new 12-inch waterline is recommended as approximately 800 South parallel to the existing 24- inch pipe starting near State Street then heading west and turning down at approximately South Orem Boulevard to 1200 South (following the alignment of the Reach II Pipeline). C East from 1200 South to 1400 South Transmission Line. This project is the continuation of Project C-3. It is intended to increase the capacity of the water transmission line carrying water from the Reach II Pipeline to the southern portion of the Central Pressure Zone and the Lakeside Pressure Zone. Existing pipes at the end of Project C3 have reduced diameters. To maintain adequate conveyance, this project includes the installation of a new 24-inch waterline running parallel to the existing water lines along 1200 South from South Orem Boulevard to 200 East and then turning south down 200 East and ending at 1400 South. Because the existing roadway has parallel 16-inch pipes for a portion of the roadway, the alignment for this project may need to vary from the alignment shown in Figure 7-6. C South Transmission Line. As the final portion of Projects C-3 and C-4 designed to improve system pressures and address undesirably high pipe velocities caused by development, it is recommended that an 20-inch/16-inch parallel pipe be installed at approximately 200 East beginning at 1400 South and following the existing pipeline which runs behind the existing shopping center (Jo-Ann Fabric) and continuing on along 1450 south and ending at South Main Street. C-6. Reach II Parallel Transmission Line. The largest recommended improvement project for the City is the installation of a new parallel waterline to the Reach II Pipeline. This project involves the installation of a new 48-inch pipeline from the UVWTP to the intersection of 1600 North and 800 East, followed by a 42-inch pipeline from the intersection of 1600 North and 800 East to the intersection of 400 East and 400 South. This large improvement is driven by the fact that future development in Orem will occur in the western portion of the City, particularly in the Southwest Annexation and the Town of Vineyard. This improvement will provide the necessary capacity to serve future development through build-out. C North Transmission Line. A continuation of Project C-2, Project C-7 will extend the parallel water line further west with 24-inch, 20-inch and 16-inch pipe. This project will provide BOWEN COLLINS & ASSOCIATES 7-5 OREM CITY
63 L E G E N D Buildout Pipe Improvements 8 inch 10 inch 12 inch 14 inch 16 inch 20 inch 24 inch 30 inch 42 inch 48 inch Future Orem City Boundary State St 400 W Main St 400 E 800 E C N 1200 W 1200 N C E 800 N Geneva Road 400 N C C Center St C S SW Annex Improvements C C University Pkwy C S 1200 S C C C S OREM CITY WATER MASTER PLAN BUILD-OUT WATER SYSTEM IMPROVEMENTS NORTH: NORTH SCALE: 0 1,500 3,000 Feet FIGURE NO. 7-6 P:\Orem City\2013 Master Plans\6.0 Reports and Memos\6.2 Draft Report\Water Report - Neal's Corrections\GIS Figures\Water-Figure 7-6- BO Improvements.mxd aanderson 3/18/2016
64 WATER MASTER PLAN the necessary system pressure and remediate potentially high pipe velocities which will come as a result of development. C-8. Reach II Parallel Transmission Line (Continued). Continuing the improvements carried out in Project C-6, this system improvement extends a 12-inch parallel water line along the Reach II alignment on 400 East from 400 South to 700 South, eliminating pressure and velocity deficiencies caused by a lack of capacity in the existing line. This project serves as another component in connecting sources in the northeast with users in the southwest. C-9. University Parkway Transmission Line. To meet the anticipated demands from future development, it is recommended that additional capacity be added to the existing 12-inch waterline by adding a new 14-inch waterline parallel to the existing line. The proposed water line will run along the south side of University Parkway starting at 400 West and running due west in front of the Wal-Mart and tying into the existing line at Sandhill Road. C West Transmission Line. To eliminate excessively high peak flow velocities, it is recommended that a 12-inch waterline be installed parallel to the existing waterline on 400 West between 1200 South and University Parkway. C North Transmission Line. This project was included in the recommended improvements due to high velocities in the build-out model simulation. The improvement is not particularly necessary to address a pressure deficiency, but an additional 12-inch parallel waterline would reduce these potentially harmful pipe velocities. BOWEN COLLINS & ASSOCIATES 7-6 OREM CITY
65 WATER MASTER PLAN Table 7-1 Major Conveyance System Improvements Summary Project Identifier Project Description Estimated Project Year Construction Cost Estimate* (2015 Dollars) C South Transmission Line (30, 24, 20, 12 inch) 2024 $1,686,000 C North Transmission Line (30, 24 inch) 2026 $661,000 C-3 South Orem Blvd between 800 South and 1200 South (12 inch) 2028 $562,000 C East from 1200 South to 1400 South Transmission Line (24 inch) 2029 $409,000 C South Transmission Line (20, 16 inch) 2031 $297,000 C-6 Reach II Parallel Transmission Line (48, 42 inch) 2034 $7,351,000 C-7 Continue 1600 North Transmission Line (24, 20, 16 inch) 2036 $1,184,000 C-8 Continue Reach II Parallel Transmission Line (12 inch) 2038 $287,000 C-9 University Parkway Transmission Line (14 inch) 2040 $362,000 C West Transmission Line (12 inch) 2042 $98,000 C North Transmission Line (12 inch) 2045 $194,000 TOTAL $13,091,000 *Does not include engineering/administrative costs BOWEN COLLINS & ASSOCIATES 7-7 OREM CITY
66 WATER MASTER PLAN Improvements to Increase Fire Flows Figure 7-7 shows pipelines that should be upsized to a minimum diameter of 8 to increase fire flows to required levels. Fire flow projects are summarized in Table 7-2. Projects are prioritized into 3 different categories based on the severity of the deficiency. Priority 1 These projects primarily resolve fire flow deficiencies where current available flow is less than 500 gpm. This includes areas with undersized pipes or inadequate looping. Priority 2 These projects primarily resolve fire flow deficiencies where current available flow is less than 1,000 gpm. Priority 3 Priority 3A and 3B projects include all other fire flow deficiencies where current available flows are less than 1,500 gpm. Phase A projects are generally considered to be higher priority than Phase B projects, but the exact timing of these projects is flexible. The City can complete phase these projects in any order desired to reduce overall construction costs (e.g. match timing of projects with road reconstruction activities, etc.). Additional Improvement Projects In addition to the capacity related system improvements identified through system modeling, the City has provided a list of condition related maintenance and renewal improvements that need to be completed. These projects include new pipelines, pipeline replacements, PRV replacements, and security upgrades. A summary of these projects is contained in Table 7-3. It is recommended that all projects contained in this list be included in the 10-year capital facilities plan in order to prevent existing system deficiencies from becoming more serious. The 10-year capital facilities plan is discussed in Chapter 8 of this report. BOWEN COLLINS & ASSOCIATES 7-8 OREM CITY
67 Main St State St 400 W 400 N 800 N 1600 N 1200 N 800 N 400 N Center St 400 S 800 S 1200 S 1600 S L E G E N D Priority 1 Projects Priority 2 Projects Priority 3 Projects Future Orem City Boundary OREM CITY WATER MASTER PLAN PEAK DAY DEMAND FIRE FLOW FOR EXISTING CONDITIONS NORTH: NORTH SCALE: 0 1,500 3,000 Feet FIGURE NO. 7-7 P:\Orem City\2013 Master Plans\6.0 Reports and Memos\6.2 Draft Report\Water Report - Neal's Corrections\GIS Figures\Water-Figure 7-7-FF Improvements.mxd aanderson 3/18/2016
68 WATER MASTER PLAN Table 7-2 Summary of Recommended Fire Flow Improvements Project Identifier Project Description Estimated Project Year Construction Cost Estimate* (2015 Dollars) FF-1 Priority 1 - Replace 6,300 feet of undersized waterlines (8 inch) $871,000 FF-2 Priority 2 - Replace 24,170 feet of undersized waterlines (8 inch) $3,336,000 FF-3A Priority 3 (Phase 1) - Replace 38,950 feet of undersized waterlines (8 inch) $5,375,100 FF-3B Priority 3 (Phase 2) - Replace 38,950 feet of undersized waterlines (8 inch) $5,375,100 *Does not include engineering/administrative costs TOTAL $14,957,200 BOWEN COLLINS & ASSOCIATES 7-9 OREM CITY
69 WATER MASTER PLAN Table 7-3 Summary of Condition Related Improvement Projects Identified by Orem City Priority Rank Project Project Description Length (Feet) Construction Cost Estimate* (2015 Cost) 1 New Water Line 400 West, Center Street to 1200 South - 12" old cast 8,000 $1,208,000 2 Replace Water Line Main Street, 1880 North to 2000 North 1,130 $155,940 3 Replace PRVs Reach II PRV's 1200 N. 600 E., 1200 N. 400 E., 200 N. 400 E., 710 S. 400 E., 1200 S. Orem Blvd. NA $250,000 4 Security System Install security system at all water sources. NA $35,000 5 Meter Replacement Upgrade all 3" and larger meters as needed (Commercial and City owned) NA $800,000 6 Replace Water Line 980 West, 400 North to 675 North (Designed, 2013 Slurry) 1,800 $37,950 7 Replace Water Line Replace with new 8" main line on 800 East, 1600 South to 1700 South. Master Plan project. 670 $92,460 8 New Water Line Install new main line on 1400 South, 800 East to 950 East 820 $113,160 9 Replace Water Line Replace 4" main line on Memo Drive loop off of 75 East, 840 North to 885 North. 830 $114, Replace Water Line Replace Alta Springs water line from Johnson's Hole turnout to old head house. 8,400 $2,000, Replace Water Line Replace water line on 600 East, 200 North to 400 North. 1,350 $186, New Water Line Install new main line 1800 South, 400 East to 250 East & 250 East, 1800 South to 2000 South 2,300 $317, Replace Water Line Replace main line on State Street, 1600 North to 2000 North on the Westside. Master Plan project. 3,040 $419, Replace Water Line Replace main line on State Street, 100 North to 1200 North on the Westside. Master Plan project. 5,000 $690, Replace Water Line Replace with 12" main line on 1600 North, 1330 West to 1430 West. 1,240 $171, Replace Water Line Replace main line on Geneva Road, 1000 North to 800 North. Master Plan project. 2,640 $193, Replace Water Line Replace water line on 1500 South, State to 400 E. & 400 East, 1500 S. to 1800 S. 2,640 $392, Replace Water Line Replace old cast main line on 200 North, Palisade Drive to 400 West. 10,565 $1,785, Replace Water Line Replace water line on State Street, 800 North to 2000 North on the eastside. Master Plan project. 8,300 $1,253, Replace Water Line Replace shot coat steel main line on State Street, 1120 South to 1400 South on the eastside. 1,400 $211,400 *Does not include engineering/administrative costs TOTAL $10,427,375 BOWEN COLLINS & ASSOCIATES 7-10 OREM CITY
70 WATER MASTER PLAN Recommended PRV Settings Modifications As system growth occurs gradually over the next several years, demand patterns and demand distribution will vary. In addition to pipeline improvements intended to remediate low system pressures, PRV settings may also be modified to aid in maintaining adequate system pressures. Table 7-4 provides a list of the PRV s which were adjusted in the build-out model to help improve system pressures. The table displays the original setting as well as the adjusted valve setting. Valves not shown in the table maintained the same setting as currently reported for the existing system. As shown in Figure 7-4, peak flows at build-out with the existing infrastructure will likely result in substantial pressure deficiencies across the majority of the system. In some cases, PRV settings were adjusted in the build-out model in order to better provide flow where it is anticipated to be needed. The list of proposed future valve settings represents one of many possible sets of PRV settings, and the City will be able to more accurately determine the best valve regime as the system continues to grow in the future. Hence, while the PRV settings proposed for the future system are beneficial in helping to remediate predicted low pressures at build-out, the proposed PRV settings may ultimately be changed depending on the needs of future growth. BOWEN COLLINS & ASSOCIATES 7-11 OREM CITY
71 WATER MASTER PLAN Table 7-4 Pressure Reducing Valve Settings Existing Settings and Proposed Future Settings Existing System PRV Setting (psi) Build-Out System PRV Setting (psi) Address Home Base W 2000 N W 1890 N W 1600 N N 290 W N Main St E 1225 N N Palisade Dr N Palisade Dr N 800 E E 600 N N 400 E RII N 400 E RII N 400 E RII E 500 N E 400 N E 200 N E 200 N E 200 N RII N 400 E E Center St S Campus Dr S Palisade Dr S Palisade Dr S 900 E S 800 E S 400 E RII S 400 E RII S 400 E RII S 400 E RII S 200 E RII E 950 N BOWEN COLLINS & ASSOCIATES 7-12 OREM CITY
72 WATER MASTER PLAN CHAPTER 8 CAPITAL IMPROVEMENT PLAN In coordination with Orem City personnel, a capital facilities plan has been developed to serve as a guideline for the budgeting and implementation of recommended system improvements over the next 10 years. The purpose of this chapter is to present recommendations regarding levels of funding for system maintenance, renewal, and capital improvement projects. RECOMMENDED CAPITAL IMPROVEMENT BUDGET Before establishing a 10-year capital improvement plan, it is necessary to determine how much funding should be set aside each year for capital improvements. One of the best ways to identify a recommended level of funding is to consider system service life. As with all utilities, each component of a water system has a finite service life. If adequate funds are not set aside for regular system renewal, the collection system will fall into a state of disrepair and be incapable of providing the level of service that Orem City customers expect. To determine the target level of yearly spending on the system, the replacement value of the current system was evaluated. The total cost to replace all pipes, pump stations, and wells in the City would be approximately $300,000,000. Based on the assumption that most water system components have an average service life of about 50 years, the City should plan to spend about 2% of the total system value per year in order to prevent utilities from falling into disrepair. Based on this assumption, it is recommended that the City plan to spend $6,000,000 per year for the water system. In addition to the water system improvements, the City has an annual budget item assigned for fleet replacement and repair, which is approximately $300,000 per year. This considered, the recommended level of investment for capital improvements in the water fund is $6,300,000. This number represents a significant increase in annual investment compared to the City s actual level of investment in the system in recent years. CAPITAL IMPROVEMENT PLAN SUMMARY The recommended capital improvements for Orem s water system are summarized in Table 8-1. Included in the table is a summary of each project along with the estimated construction cost. The table includes improvements to the conveyance system, storage facilities, a new water reuse system, development of new groundwater sources, automated metering infrastructure, and other improvements. Not included in the table is routine rehabilitation and replacement of system components that will also need to be accounted for in future budgets. BOWEN COLLINS & ASSOCIATES 8-1 OREM CITY
73 WATER MASTER PLAN Table 8-1 Orem City Water System Capital Improvement Projects Project type Project Identifier Project Description Estimated Project Year Estimated Cost (2014 Dollars) Major Conveyance C South Transmission Line (30, 24, 20, 12 inch) 2024 $1,686,000 Major Conveyance C North Transmission Line (30, 24 inch) 2026 $661,000 Major Conveyance C-3 South Orem Blvd between 800 South and 1200 South (12 inch) 2028 $562,000 Major Conveyance C East from 1200 South to 1400 South Transmission Line (24 inch) 2029 $409,000 Major Conveyance C South Transmission Line (20, 16 inch) 2031 $297,000 Major Conveyance C-6 Reach II Parallel Transmission Line (48, 42 inch) 2034 $7,351,000 Major Conveyance C-7 Continue 1600 North Transmission Line (24, 20, 16 inch) 2036 $1,184,000 Major Conveyance C-8 Continue Reach II Parallel Transmission Line (12 inch) 2038 $287,000 Major Conveyance C-9 University Parkway Transmission Line (14 inch) 2040 $362,000 Major Conveyance C West Transmission Line (12 inch) 2042 $98,000 Major Conveyance C North Transmission Line (12 inch) 2045 $194,000 Fire Flow FF-1 Replace 6,300 feet of undersized waterlines (8 inch) $871,000 Fire Flow FF-2 Replace 24,170 feet of undersized waterlines (8 inch) $3,336,000 Fire Flow FF-3A Replace 38,950 feet of undersized waterlines (8 inch) $5,375,100 Fire Flow FF-3B Replace 38,950 feet of undersized waterlines (8 inch) $5,375,100 Storage ST-1a 10 million gallon storage reservoir siting study 2016 $100,000 Storage ST-1 10 million gallon storage reservoir $10,322,000 Storage ST million gallon storage reservoir 2030 $12,960,000 Reuse Water RW-1 Tertiary wastewater treatment improvements 2016 $1,200,000 Reuse Water RW-2 Reuse waterline to Lakeside Sports Complex (12 inch) 2016 $189,000 Reuse Water RW-3 Booster Station from WRF to Sleepy Ridge Golf Course 2016 $150,000 Reuse Water RW-4 Booster Station from Sleepy Ridge Golf Course to Lakeside Sports Complex 2016 $650,000 Southwest Annex SW-1 Install 18,775 feet of waterlines in the SW Annex (paid for by developer) $1,735,000 Wells W-1 Develop New Well Source 2017 $3,000,000 Wells W-2 Develop New Well Source 2020 $3,000,000 Automated Metering AMI Install new automated meter infrastructure $8,300,000 Misc. Replacement R-1 Miscellaneous Replacements/Improvements Identified from Previous Plans $10,427,375 TOTAL $80,081,575 BOWEN COLLINS & ASSOCIATES 8-2 OREM CITY
74 WATER MASTER PLAN 10-YEAR CAPITAL IMPROVEMENTS SCHEDULE While Table 8-1 displays all projects needed to serve the system through build-out, of particular interest is the development of a project schedule over the next 10 years. Based on the City s identified project needs and recommended level of capital investment, BC&A has developed four potential capital improvement scenarios covering the next 10 years. These scenarios are shown in Figures 8-1 through 8-4 and detailed in Tables 8-2 through 8-5. The process of developing the several scenarios was as follows: Identify the Revenue Available for CIP Based on Current Rates Each of the figures show the revenue that is projected to be available for capital improvement projects based on current water rates charged to customers. This represents the revenue the City would have available for capital improvements over the next 10 years if it does not make any changes to its existing rates. It will be noted that this revenue increases gradually over time as additional users join the system. Identify the Recommended CIP Funding Level Based on System Value Each of the figures also show the recommended capital improvement project funding level for the water system. This is the level of funding sufficient to perform maintenance related projects and system renewal as discussed previously. This level of funding increases over time to keep up with both system growth and inflation. Develop a Transition Plan between the Current and Recommended Levels of Funding From the several figures, it is apparent that the projected revenue associated with existing rates will be woefully inadequate to implement the capital improvement projects needed in the City s water system. Because of the dramatic difference between existing revenue and recommended CIP funding, a budget plan is needed to gradually transition between the two. The several scenarios look at different ways to reach the recommended level of funding: o Scenario 1, 5-year Phase In (Figure 8-1, Table 8-2): As a starting point, BC&A looked at the immediate needs of the City and identified a transition plan that would address all the most pressing needs while limiting annual rate increases. This resulted in the development of Scenario 1. This scenario includes transitioning to the recommended long-term level of funding over a period of 5 years. This scenario would allow the City to construct all of the recommended projects identified in the planning window and begin to implement additional maintenance and renewal projects. o Scenario 2, 7-year Phase In (Figure 8-2, Table 8-3): To minimize the required annual increases to the rates, BC&A also looked at slower implementation options. Scenario 2 includes a transition from current to recommended levels of funding over a period of 7 years. While this would reduce rate increases and would allow the City to complete several of its very highest priority projects, it would require the City to postpone a number of projects. Most notably, the 7-year phase in would delay the completion of the City s meter replacement and AMI project by three years. It would also postpone several recommended maintenance and renewal projects. While it may be possible to delay some of these projects for a short period of time, neglect to these areas for any extended period of time will result in a reduced level of service and lead to more frequent and costly emergency repairs. BOWEN COLLINS & ASSOCIATES 8-3 OREM CITY
75 WATER MASTER PLAN Selection of Scenario 2 over Scenario 1 would result in the deferment of $5.6 million in system maintenance improvements. o Scenario 3, 10-year Phase In (Figure 8-3, Table 8-4): This scenario is similar to Scenario 2, but would transition from current to recommended levels of funding over a period of 10 years. Selection of Scenario 3 over Scenario 1 would result in delaying a number of important projects. Compared to Scenario 1, this scenario delays the meter replacement and AMI project by 4 years, completion of the highest priority fire flow improvements by 4 years, and defers $10.7 million in system maintenance improvements. o Scenario 4, Bonding (Figure 8-4, Table 8-5): The previous three scenarios have looked at funding capital improvements on a pay as you go basis. As has been discussed previously, Scenarios 2 and 3 result in the delay of some important project components that may not be acceptable to the City. As an alternative to delaying these projects, the City could consider using bond funding as a way to accomplish more of the recommended projects without increasing rates as dramatically up front. Bond funding would also allow some of the costs incurred today to be paid for by future users that will benefit from the improvements. Scenario 4 includes funding all of the same projects as identified in Scenario 1, but uses bond funding to limit rate increases to levels slightly below those identified in Scenario 3. To accomplish this plan, the City would need to take out bonds of $12.5 million in 2018 and The first bond would be used to pay for fire flow improvements, a new well, reuse water facilities at the WRF, and some of the highest priority maintenance related improvements. The second bond would be used to pay for a new storage reservoir. Normal rate revenue could then be used for system maintenance and renewal, as well as the other scheduled improvement projects. Tables 8-2 through 8-5 list the improvement projects that could be completed within the next 10- years for Scenarios 1 through 4, respectively. Figures 8-1 through 8-4 show this same information graphically. For comparison purposes, Figure 8-1 includes the total level of funding for all four of the scenarios. System improvement projects have been grouped into the following major budget categories: Fire Flow Fire flow projects included in the 10-year plan include areas of the City with the most severe fire flow deficiencies (Priority 1 and Priority 2 deficiencies). While it would be ideal to eliminate all fire flow deficiencies over the next 10 years, consideration must also be given to available budget and other system priorities. Under the current plan, the most urgent fire flow improvements would be completed within this planning window, with the remaining improvements completed thereafter as quickly as budget allows. Storage Storage projects include the cost of adding water storage in the City to alleviate equalization deficiencies. The City does not have a current storage deficiency because the City currently has access to storage at the water treatment plant beyond its contractual agreement with CUWCD. While access to this storage will not be eliminated immediately, it is likely to be curtailed over the next several years as other communities begin to pull more water from the plant. For this reason, storage has been worked into the improvement plan as soon as available budget allows. WRF Reuse This item includes the cost to install facilities to implement reuse of effluent water from the City s water reclamation facility for irrigation purposes (see Appendix C for BOWEN COLLINS & ASSOCIATES 8-4 OREM CITY
76 WATER MASTER PLAN further discussion). This project is a high priority because it will allow the City to postpone many other costlier conveyance projects. Wells Well projects include the installation of new wells to expand the City s peak day supply. Because these improvements are driven by projected growth in demand, there is little flexibility in when they can be completed. AMI The AMI item includes the cost to install new water meters in the City to more accurately account for water used and to improve operation efficiencies through smart meter technology. Because of this nature of this project, it is expected that it will be completed in phases over a period of about four years. There is some flexibility in when this project occurs. However, the sooner the meters are replaced, the sooner the City will start realizing increased water sales and savings associated with reduced meter reading costs (see Appendix E for further discussion). As a result, it is recommended that this project be completed as early as funding allows. Maintenance Related Replacement This budget item includes those specific maintenance related projects already identified by City personnel. Major Conveyance This item includes large diameter pipelines intended to bring flow from the northeast end of the City south and west to areas of high demand and help relieve pressure deficiencies under existing conditions or that may occur as a result of growth within the next 10-years. Because these improvements are driven by projected growth, there is little flexibility in when they can be completed. Fortunately, completion of the reuse project identified above will allow nearly all major conveyance projects to be pushed outside the 10-year planning window. Only one major conveyance project is included in the 10-year plan. Unplanned Repairs This budget category includes funds which should be reserved in order to cover the potential cost of unexpected system failures, such as pipe breaks. Fleet Replacement City personnel have developed a schedule for vehicle replacement based on approximate use, depreciation, and reliability for maintenance vehicles in the City. Because the City has been behind on its replacement schedule over the last several years, the first two years of the recommended water budget include a larger proportion of total capital costs for vehicle replacement as the City replaces some of its vehicles that are already beyond their useful service life. However, these costs should decrease and then remain relatively constant as the City replaces vehicles at more regular intervals in the future. System Replacement After accomplishing all of the specific improvements identified above, any remaining capital improvement budget would be dedicated to system replacement. System replacement costs indicated in Figures 8-1 through 8-4 and Tables 8-2 through 8-5 are based on identifying those areas of the City s water system that appear to be aging and in need of repair or replacement. Ultimately, selection of an implementation scenario has been left up to the City s discretion. All of the scenarios will accomplish the City s most pressing capital improvement projects and will fund the system at the long-term recommended level of funding by the end of the 10-year planning window. Selection of a more or less aggressive implementation plan will ultimately depend on the City s desire to proactively invest in its system versus its tolerance for rate increases. In general, it is recommended that the City implement the transition as quickly as possible since system investment to protect existing assets has been consistently shown to reduce total long-term costs BOWEN COLLINS & ASSOCIATES 8-5 OREM CITY
77 WATER MASTER PLAN Project Identifier FF 1 FF 2 Table Year Capital Improvement Plan Scenario 1, 5-Year Phase In Plan Estimated Total Cost (2016 Dollars) FY 2017 FY 2018 FY 2019 FY 2020 FY 2021 FY 2022 FY 2023 FY 2024 FY 2025 FY 2026 Project Description Replace 6,306 feet of existing 2 and 4 inch pipe with 8 inch pipe $871,000 $299,043 $308,015 $317,255 Replace 24,173 feet of existing 4 inch pipe with 8 inch pipe $3,336,000 $1,025,715 $1,056,486 $1,088,181 $1,120,826 ST 1 Construct 10 million gallon storage reservoir $10,422,000 $100,000 $4,650,000 $7,189,454 RW 1 Tertiary wastewater treatment improvements $1,200,000 $1,273,080 RW 2 12 inch pipe extending existing reuse line to RW 3 RW 4 SW 1 Lakeside Sports Complex $189,000 $200,510 Booster Station from WRF to Sleepy Ridge Golf Course Pond $150,000 $159,135 Booster Station at Sleepy Ridge Golf Course Pond $650, Install 18,774 feet of pipe for SW Annex (Paid for by developer) $1,735,000 W 1 Drill a new well in Orem Water System $3,000,000 $3,278,181 W 2 Drill a new well in Orem Water System $3,000,000 $3,582,157 AMI Install new automated meter infrastructure $8,300,000 $2,343,250 $2,201,368 $2,267,409 $2,110,329 R 1 Maintenance related replacement/improvement projects $10,427,375 $3,206,089 $3,302,272 $3,401,340 $3,503,380 Major Conveyance 400 South pipe replacement $1,686,000 $2,199,848 System Replacement Replace system where needed $14,098,004 $210,979 $429,488 $442,373 $29,826 $8,866 $3,876,845 $3,489,588 $3,627,836 $1,575,701 $3,888,910 Repairs Unplanned repair fund $750,000 $77,250 $79,568 $81,955 $84,413 $86,946 $89,554 $92,241 $95,008 $97,858 $100,794 Fleet Replacement Fleet maintenance and replacement $2,629,045 $498,016 $375,444 $343,157 $320,340 $272,917 $235,171 $235,970 $242,954 $245,969 $253,253 TOTAL $62,443,423 $3,528,538 $5,716,192 $6,730,329 $7,194,908 $7,558,183 $7,783,727 $8,049,602 $8,324,555 $8,608,896 $8,867,163 BOWEN COLLINS & ASSOCIATES 8-6 OREM CITY
78 WATER MASTER PLAN Project Identifier FF 1 FF 2 Table Year Capital Improvement Plan Scenario 2, 7-Year Phase In Plan Estimated Total Cost (2016 Dollars) FY 2017 FY 2018 FY 2019 FY 2020 FY 2021 FY 2022 FY 2023 FY 2024 FY 2025 FY 2026 Project Description Replace 6,306 feet of existing 2 and 4 inch pipe with 8 inch pipe $871,000 $299,043 $308,015 $317,255 Replace 24,173 feet of existing 4 inch pipe with 8 inch pipe $3,336,000 $1,025,715 $1,056,486 $1,088,181 $1,120,826 ST 1 Construct 10 million gallon storage reservoir $10,422,000 $100,000 $4,306,073 $3,309,746 $3,988,676 RW 1 Tertiary wastewater treatment improvements $1,200,000 $1,236,000 RW 2 12 inch pipe extending existing reuse line to RW 3 RW 4 SW 1 Lakeside Sports Complex $189,000 $194,670 Booster Station from WRF to Sleepy Ridge Golf Course Pond $150,000 $154,500 Booster Station at Sleepy Ridge Golf Course Pond $650,000 $669,500 Install 18,774 feet of pipe for SW Annex (Paid for by developer) $1,735,000 W 1 Drill a new well in Orem Water System $3,000,000 $3,182,700 W 2 Drill a new well in Orem Water System $3,000,000 $3,582,157 AMI Install new automated meter infrastructure $8,300,000 $2,335,431 $2,405,494 $2,477,659 $2,551,988 R 1 Maintenance related replacement/improvement projects $10,427,375 $3,206,089 $3,302,272 $3,401,340 $3,503,380 Major Conveyance 400 South pipe replacement $1,686,000 $2,199,848 System Replacement Replace system where needed $9,007,320 $0 $200,000 $0 $0 $100,000 $1,200,000 $937,599 $3,627,836 $1,575,701 $3,888,910 Repairs Unplanned repair fund $750,000 $77,250 $79,568 $81,955 $84,413 $86,946 $89,554 $92,241 $95,008 $97,858 $100,794 Fleet Replacement Fleet maintenance and replacement $2,629,045 $498,016 $375,444 $343,157 $320,340 $272,917 $235,171 $235,970 $242,954 $245,969 $253,253 TOTAL $57,352,739 $3,228,979 $4,145,726 $5,048,439 $6,049,930 $6,854,032 $7,584,540 $8,049,602 $8,324,555 $8,608,896 $8,867,163 BOWEN COLLINS & ASSOCIATES 8-7 OREM CITY
79 WATER MASTER PLAN Project Identifier FF 1 FF 2 Table Year Capital Improvement Plan Scenario 3, 10-Year Phase In Plan Estimated Total Cost (2016 Dollars) FY 2017 FY 2018 FY 2019 FY 2020 FY 2021 FY 2022 FY 2023 FY 2024 FY 2025 FY 2026 Project Description Replace 6,306 feet of existing 2 and 4 inch pipe with 8 inch pipe $871,000 $336,576 $346,673 $357,073 Replace 24,173 feet of existing 4 inch pipe with 8 inch pipe $3,336,000 $1,025,715 $1,056,486 $1,088,181 $1,120,826 ST 1 Construct 10 million gallon storage reservoir $10,422,000 $100,000 $3,978,255 $4,772,908 $2,829,402 RW 1 Tertiary wastewater treatment improvements $1,200,000 $1,236,000 RW 2 12 inch pipe extending existing reuse line to RW 3 RW 4 SW 1 Lakeside Sports Complex $189,000 $194,670 Booster Station from WRF to Sleepy Ridge Golf Course Pond $150,000 $154,500 Booster Station at Sleepy Ridge Golf Course Pond $650,000 $669,500 Install 18,774 feet of pipe for SW Annex (Paid for by developer) $1,735,000 W 1 Drill a new well in Orem Water System $3,000,000 $3,182,700 W 2 Drill a new well in Orem Water System $3,000,000 $3,582,157 AMI Install new automated meter infrastructure $8,300,000 $2,405,494 $2,477,659 $2,551,988 $2,628,548 R 1 Maintenance related replacement/improvement projects $10,427,375 $3,206,089 $3,302,272 $3,401,340 $3,503,380 Major Conveyance 400 South pipe replacement $1,686,000 $2,199,848 System Replacement Replace system where needed $4,557,605 $0 $0 $0 $0 $0 $0 $0 $700,000 $1,450,000 $3,888,910 Repairs Unplanned repair fund $750,000 $77,250 $79,568 $81,955 $84,413 $86,946 $89,554 $92,241 $95,008 $97,858 $100,794 Fleet Replacement Fleet maintenance and replacement $2,629,045 $498,016 $375,444 $343,157 $320,340 $272,917 $235,171 $235,970 $242,954 $245,969 $253,253 TOTAL $52,903,025 $2,929,936 $3,637,712 $4,403,366 $5,177,661 $5,931,334 $6,731,214 $7,469,076 $8,025,268 $8,483,195 $8,867,163 BOWEN COLLINS & ASSOCIATES 8-8 OREM CITY
80 WATER MASTER PLAN Project Identifier FF 1 FF 2 Table Year Capital Improvement Plan Scenario 4, With Bonding Project Description Replace 6,306 feet of existing 2 and 4 inch pipe with 8 inch pipe $871,000 $924,044 Replace 24,173 feet of existing 4 inch pipe with 8 inch pipe $3,336,000 $3,539,162 Estimated Total Cost (2016 Dollars) FY 2017 FY 2018 FY 2019 FY 2020 FY 2021 FY 2022 FY 2023 FY 2024 FY 2025 FY 2026 ST 1 Construct 10 million gallon storage reservoir $10,422,000 $100,000 $11,966,027 RW 1 Tertiary wastewater treatment improvements $1,200,000 $1,273,080 RW 2 12 inch pipe extending existing reuse line to RW 3 RW 4 SW 1 Lakeside Sports Complex $189,000 $200,510 Booster Station from WRF to Sleepy Ridge Golf Course Pond $150,000 $159,135 Booster Station at Sleepy Ridge Golf Course Pond $650,000 $689,585 Install 18,774 feet of pipe for SW Annex (Paid for by developer) $1,735,000 W 1 Drill a new well in Orem Water System $3,000,000 $3,182,700 W 2 Drill a new well in Orem Water System $3,000,000 $3,477,822 AMI Install new automated meter infrastructure $8,300,000 $2,137,250 $2,201,368 $2,267,409 $2,335,431 R 1 Maintenance related replacement/improvement projects $10,427,375 $2,212,480 $569,714 $1,173,610 $604,409 $1,867,625 $1,923,653 $1,320,909 $1,360,536 $1,401,352 Major Conveyance 400 South pipe replacement $1,686,000 $2,199,848 System Replacement Replace system where needed $14,098,004 $30,670 $273,853 $57,531 $165,457 $23,981 $2,350,474 $3,072,408 $4,277,203 $2,424,071 $5,226,232 Repairs Unplanned repair fund $750,000 $77,250 $79,568 $81,955 $84,413 $86,946 $89,554 $92,241 $95,008 $97,858 $100,794 Fleet Replacement Fleet maintenance and replacement $2,629,045 $498,016 $375,444 $343,157 $320,340 $272,917 $235,171 $235,970 $242,954 $245,969 $253,253 TOTAL $62,443,423 $2,843,186 $15,110,929 $3,319,765 $4,079,251 $16,432,102 $4,542,823 $5,324,272 $5,936,074 $6,328,281 $6,981,631 BOWEN COLLINS & ASSOCIATES 8-9 OREM CITY
81 WATER MASTER PLAN Cost Per Year $10,000,000 $9,000,000 $8,000,000 $7,000,000 $6,000,000 $5,000,000 Major Conveyance Fire Flow Storage WRF Reuse Wells Maintenance Related Replacement System Replacement Budget AMI Unplanned Repair Fund Vehicle Replacement Revenue for CIP Based on Current Rates Budget Plan with Bonding 10-year Phase In Budget Plan 7-Year Phase In Budget Plan 5-year Phase In Budget Plan Recommended CIP Funding Level Figure 8-1 Recommended Water Fund Expenditures, Scenario 1-5-Year Phase In $4,000,000 $3,000,000 $2,000,000 $1,000,000 $ Year BOWEN COLLINS & ASSOCIATES 8-10 OREM CITY
82 WATER MASTER PLAN Cost Per Year $10,000,000 $9,000,000 $8,000,000 $7,000,000 $6,000,000 Major Conveyance Fire Flow Storage WRF Reuse Wells Figure 8-2 Recommended Water Fund Expenditures, Scenario 2-7-Year Phase In Maintenance Related Replacement System Replacement Budget AMI Unplanned Repair Fund Vehicle Replacement Revenue for CIP Based on Current Rates 7-Year Phase In Budget Plan Recommended CIP Funding Level $5,000,000 $4,000,000 $3,000,000 $2,000,000 $1,000,000 $ Year BOWEN COLLINS & ASSOCIATES 8-11 OREM CITY
83 WATER MASTER PLAN Figure 8-3 Recommended Water Fund Expenditures, Scenario 3-10-Year Phase In $10,000,000 $9,000,000 $8,000,000 $7,000,000 $6,000,000 Major Conveyance Fire Flow Storage WRF Reuse Wells Maintenance Related Replacement System Replacement Budget AMI Unplanned Repair Fund Vehicle Replacement Revenue for CIP Based on Current Rates 10-Year Phase In Budget Plan Recommended CIP Funding Level Cost Per Year $5,000,000 $4,000,000 $3,000,000 $2,000,000 $1,000,000 $ Year BOWEN COLLINS & ASSOCIATES 8-12 OREM CITY
84 WATER MASTER PLAN $20,000,000 Figure 8-4 Recommended Water Fund Expenditures, Scenario 4 - With Bonding Cost Per Year $18,000,000 $16,000,000 $14,000,000 $12,000,000 $10,000,000 Major Conveyance Fire Flow Storage WRF Reuse Wells Maintenance Related Replacement System Replacement Budget AMI Unplanned Repair Fund Vehicle Replacement Bond Payments Revenue for CIP Based on Current Rates Budget Plan With Bonding Recommended CIP Funding Level $8,000,000 $6,000,000 $4,000,000 $2,000,000 $ Year BOWEN COLLINS & ASSOCIATES 8-13 OREM CITY
85 APPENDIX A TECH MEMO: ALTA SPRING HYDROELECTRIC EVALUATION
86 T E C H N I C A L M E M O R A N D U M DATE: September 9, 2014 TO: Neal Winterton Orem City Municipal Corp 1450 W 550 N Orem, Utah FROM: PROJECT: SUBJECT: Andrew McKinnon, Keith Larson Bowen, Collins & Associates 154 East South Draper, Utah Water Master Plan Alta Springs Hydroelectric Evaluation INTRODUCTION Orem City has two significant spring sources above the City on the foothills of Mt Timpanogos (Alta Springs and Canyon Springs). Alta Springs represents the higher of the two sources and could potentially be a source to generate hydroelectricity for the City. The City would like to consider alternatives for micro-hydroelectric turbines to utilize this source. The purpose of this memo is to summarize the types of turbine technology that would be available for the Alta Springs Pipeline and types of improvements that might be needed to construct micro-hydro. PIPELINE PLAN AND PROFILE Figure TM 1-1 indicates the location of Alta Springs along with the Alta Springs pipeline. The pipeline currently supplies the Upper Tanks in the City s water distribution system. Figure TM 1-2 shows the estimated profile for the pipeline based on digital elevation data obtained from the Utah Automated Geographic Reference Center (AGRC) and some survey data provided by Orem City personnel. The actual profile may be slightly different. The maximum potential hydraulic grade line is also shown in Figure TM 1-2 based on an assumed Hazen-Williams roughness of 110. Under current conditions, the Alta Springs waterline mostly runs less than full down to the City s Upper Tanks; so it is unclear if the City s existing pipeline is rated for the potential pressures indicated in Figure TM 1-2. The system curve and power curve shown in Figure TM 1-3 are based on the maximum potential pressures available from Alta Springs. Included in Figure TM 1-3 is information regarding average flows from the springs based on historic records. BOWEN, COLLINS & ASSOCIATES 1 OREM CITY
 Land Owner Type Federal")


87 L E G E N D Structure KJ Treatment Plant "! Alta Spring UT "!±b Gerber Tank Possible Turbine Location Station Point (ft) Land Owner Type Federal "! Private State 9000 Tribal KJ 0 b UT "!± OREM CITY WATER MASTER PLAN ALTA SPRING HYDROELECTRIC ALTA SPRING PIPELINE NORTH: NORTH SCALE: ,500 Feet TM1-1 FIGURE NO. P:\Orem City\2013 Master Plans\4.0 GIS\4.1 Projects\WaterMap\Water-AltaSprings.mxd amckinnon 9/23/2014
88 5,600 Figure TM1-2 Alta Springs Pipeline 200 5, Elevation (ft) 5,500 5,450 5,400 5,350 5,300 5,250 5,200 5,150 Tank Elevations Maximum HW=110@ 2500 gpm Ductile Iron Pipe Steel Pipe Potential Pressure from Spring Box Potential Pressure from Alta Spring Box (psi) 5, ,000 4,000 6,000 8,000 10,000 12,000 14,000 16,000 18,000 20,000 Distance from Gerber Tank
89 Figure TM 1-3 Potential Power Production for Turbine Head (ft) Power (kw) System Curve for Alta Pipeline at Pipe Roughness = 110 Average Flow ( ) Average + 2 Standard Deviations ( ) Average - 2 Standard Deviations ( ) Power kw Flow (gpm)
90 MICRO-HYDRO TURBINE SELECTION TURBINE TECHNOLOGIES There are a number of different types of technology used for hydroelectric turbines. Generally, turbine technologies can be separated into two categories: reaction turbines and impulse turbines. The following paragraphs describe each type of turbine in more detail. Reaction turbines - Reaction turbines are used to convert pressure and flow into energy and are generally fully enclosed (pressurized) systems. In general, a reaction turbine should be thought of as a pump in reverse. A reaction turbine produces energy using pressure and flow, rather than producing pressure and flow using energy (as a pump does). Reaction turbines generally include the following categories: Francis Kaplan, Propeller, Bulb, Tube, Straflo Tyson Gorlov Custom (Includes energy recovery pressure reducing valves) Impulse turbines Impulse turbines use the velocity of moving water on blades or bowls to perform work. As a result, these types of turbines generally discharge to atmospheric conditions. Impulse turbines include: Waterwheel Pelton Turgo Crossflow (also known as the Michell-Banki or Ossberger turbine) Jonval turbine Reverse overshot water-wheel Archimedes' screw turbine Custom Most of the turbine technologies listed are not appropriate for micro hydroelectric turbine applications. Figure TM 1-4 illustrates the suitability of some turbine technologies for various flow conditions. The Figure also shows the Alta Springs Pipeline system curve in black. BOWEN, COLLINS & ASSOCIATES 2 OREM CITY
91 MICRO-HYDRO TURBINE SELECTION Head (ft) 100 Figure TM 1-4 Turbine Technology For Various Heads and Flow Rates Pelton Turgo Kaplan Cross Flow Francis Alta Springs Pipeline Flow (cfs) Based on the available head, flow, and discharge characteristics of the Alta Springs Pipeline, the most appropriate turbine type to use would be an impulse style Pelton turbine. Impulse turbines are generally much more efficient over a wider range of flows if it is possible for the pipeline to discharge to atmosphere. Because Alta Springs is the primary feed for City s Upper Tanks, a turbine site could be constructed to discharge to atmosphere at an elevation somewhat above the tank overflow elevation. If site constraints cannot accommodate an impulse turbine, a reaction style Francis turbine may be a better fit. However, reaction turbines would not likely be able to accommodate the full range of flow from Alta Springs and would result in somewhat less power production compared to a Pelton turbine. This is because reaction turbines function much like pumps in reverse and usually function over a limited range of flow and head. Just as pumps can use variable frequency drives to adjust flow rates to some extent, there are methods to adjust the flow range for turbines. However, the range of flow is still more limited compared to impulse turbines. Rentricity, an energy recovery system manufacturer that has had some concept discussions regarding its custom reaction turbine with Orem City, would have similar constraints. BOWEN, COLLINS & ASSOCIATES 3 OREM CITY
92 MICRO-HYDRO TURBINE SELECTION Efficiencies for impulse turbines are highest at their maximum design flow rate and decline gradually as flows decrease. Efficiencies for reaction turbines are highest at a specific design flow and decline as flow increases or decreases from the design flow. OTHER CONSIDERATIONS Land Ownership Potential sites for a Pelton Turbine would likely border on State of Utah owned land managed by the Division of Wildlife Resources. The precise location will be driven by the pipeline elevation and discharge requirements. Most reaction turbine sites could be constructed on City owned land closer to the Upper tanks. Existing Pipeline Air Vents The hydraulics of the existing Alta Pipeline may need to be modified somewhat to improve hydraulics for a turbine application. The pipeline currently uses air vents to prevent vacuum pressures in the pipeline for changing flow rates. These vents can overflow under some flow conditions and may need to be replaced with air vacuum valves to allow the pipeline to provide the most power production. Permitting The Hydropower Regulatory Efficiency Act of 2013 will likely apply to any turbine constructed on the Alta Pipeline or other Orem City pipelines. The hydropower act is intended to streamline processing of hydropower applications for sites similar to the Alta Pipeline. The Hydropower Act condenses the application process to a single Notice of Intent application with a maximum 60- day review period. This new legislation should expedite review and reduce design costs for the turbine. Net Metering Rocky Mountain Power has a net metering program that allows power users to subtract any power produced from their power bill. This is often the most cost effective method of obtaining a return on investment with regards to renewable energy sources. This is because the cost of buying power from Rocky Mountain Power is usually higher than the rebate from selling power to Rocky Mountain Power. However, because of the location of the hydroelectric turbine site, it will not likely qualify for Rocky Mountain Power s Net Metering program. Key requirements to utilize net metering require the Net Meter to be contiguous to the site of power use, with the same rate schedule, and same account. If Orem City wanted to sell power produced by the turbine to Rocky Mountain Power, the City would have to meet more stringent review requirements by Rocky Mountain Power and would also only receive the deferred power rebate payments from Rocky Mountain Power (which are roughly 50 percent or less of typical power costs). At deferred power cost rates (~$0.03/kWh - $0.04/kWh), it is unlikely that the turbine will pay for itself within the turbine s life cycle. BOWEN, COLLINS & ASSOCIATES 4 OREM CITY
93 MICRO-HYDRO TURBINE SELECTION An alternative to selling power to Rocky Mountain Power would be to lease a turbine site to the Central Utah Water Conservancy District (CUWCD) which owns and operates the nearby Utah Valley Water Treatment Plant. CUWCD could qualify as a net metering customer relatively easily because of the proximity of the potential Alta Spring turbine sites. Instead of using the power directly, Orem City may be able to reduce its treatment costs from CUWCD at a rate of approximately $0.09/kWh (the estimated cost of power for CUWCD). Additional information regarding CUWCD s existing power costs would need to be investigated and an agreement would need to be negotiated with CUWCD regarding use of the turbine site. However, this would likely result in the best return on investment for the City. Note that this principal applies to any other potential hydroelectric site in the City. If hydropower is constructed, Orem City will need to be able to use the power itself or obtain a lease agreement from an entity that can. 3-Phase Power Because of the constraints of net metering, 3-phase power would likely need to be run from the turbine site to the Utah Valley Water Treatment Plant. The estimated distance from the treatment plant would be 1,800 feet for a Pelton Turbine site and 1,200 feet for a Francis Turbine site. Note that a Francis turbine could be constructed closer to the City s existing Upper Tanks than a Pelton Turbine because of different discharge requirements (a Francis is a fully enclosed and pressurized turbine). This will primarily affect the cost of conduit and conductor to the turbine location. Other Turbine Sites Note that there may be potential for energy recovery at other sites in the City. However, a site above the Upper Tanks will likely provide the largest net power savings. Any other site would likely require a reaction style turbine to be installed, and would face some of the same hurdles with regards to net metering as the Alta Springs site. TURBINE COMPARISON Table TM 1-1 shows a cost comparison for a Pelton style turbine and for two parallel reaction style turbines for a 25-year standard operating life (the turbine industry standard). BOWEN, COLLINS & ASSOCIATES 5 OREM CITY
94 MICRO-HYDRO TURBINE SELECTION Table TM 1-1 Turbine Conceptual Cost Estimate Project Technical Data Pelton Turbine Reaction Turbine Effective Hydraulic Head at Turbine (feet) 185 (80 psi) 185 (80 psi) Average Flow Rate (gpm) 2,047 a 1,825 a Turbine Efficiency 94% 90% Generator Efficiency 90% 85% Average Power Output (kw) Annual Energy Production (kwh) 521, ,080 Hydro Equipment Cost (turbine, generator, switchgear/controls, drive components, etc.) $430,000 $328,000 Building Cost ($300/sqft, 170 sqft) $51,000 $51,000 Installation/Construction Cost $30,000 $30,000 Total Project Construction Cost $511,000 $409,000 Total Project Design/Permitting/Management Cost $97,531 b $82,231 b Total Project Cost $608,531 $491,231 Project Life Cycle Annual O&M Cost (2014 Dollars) $3,000 $3,000 Present Value Cost (25 year Standard Operation Life) $660,770 $543,470 Commercial Energy Cost ($/kwh) - assuming all power qualifies for Net Metering Program $0.090 c $0.090 c Average Annual Energy Escalation Rate 3.00% 3.00% Average Annual Inflation Rate 3.00% 3.00% Discount Rate 5.00% 5.00% Present Value Energy Savings (25 year Operation) $921,869 $743,199 Project Net Present Value (2014 Dollars) $261,099 $199,729 a The average flow is based on 7-years of historic dedspring flow and represents the assumed average flow that the turbines can utilize efficiently. b Note that design/permitting costs can be highly variable depending on agency availability and review requirements (which change from time to time). c This assumes all power can be used by Orem City. If power is sold back to Rocky Mountain Power, the reimbursement rate from Rocky Mountain Power is not as high (~$0.03/kWh - $0.04/kWh) BOWEN, COLLINS & ASSOCIATES 6 OREM CITY
95 MICRO-HYDRO TURBINE SELECTION CONCLUSIONS AND RECOMMENDATIONS Based on the comparison discussed above, the following conclusions and recommendations can be made: Net Metering To make any return on investment for Alta Springs, the City will need to arrange for power to be used by a single customer that uses more power than is generated by the turbine. If the City opts to pursue hydropower, it is recommended that the City investigate a lease agreement with Central Utah Water Conservancy District to utilize the hydroelectric potential. o On a general basis, any other potential hydroelectric sites (at pressure reducing valves) in the City would face a similar challenge. Any power generated should be used by a single user to maximize the return on investment. Turbine Technology An impulse style Pelton turbine would provide the best return on investment for the City based on the available head and flow from the Alta Springs Pipeline. However, a reaction style turbine may provide a better fit for site conditions (depending on land ownership). A decision on which technology to use can be made once preliminary layout of the turbine location is refined. Return on Investment A hydroelectric turbine would represent a green form of energy production that could be utilized by the City. However, the payback period for hydroelectric power at Alta Springs is nearly 20 years based on existing power rates. Permitting Permitting for the turbine should be simpler than past permitting efforts as a result of the Hydropower Regulatory Efficiency Act of BOWEN, COLLINS & ASSOCIATES 7 OREM CITY
96 APPENDIX B TECH MEMO: SOURCE OPTIMIZATION
97 T E C H N I C A L M E M O R A N D U M TO: COPIES: FROM: Neal R. Winterton Public Works, Water Resource Division Manager City of Orem 56 North State Street Orem, Utah Chris Tchirki/Orem City Michael Collins/BC&A Andrew McKinnon/BC&A File Keith Larson, Andrew McKinnon, Aaron Anderson DATE: May 2015 SUBJECT: Source Optimization JOB NO.: BC&A # INTRODUCTION AND PURPOSE Orem City has a variety of water sources with different costs, source availability, and water quality. Accordingly, the City would like to be able to identify methods that will help its water system operators use each source as efficiently as possible. This includes balancing costs of productions, conveyance, treatment and water source availability and water quality. The purpose of this technical memorandum is to document methods to optimize use of Orem City water sources. This memorandum is organized into five sections: Section I - Supply Availability Identifies the annual availability of each Orem City water source. Section II - System Operation Provides a discussion of system operation, including where each source enters the system and what areas are served by each source. Section III - Source Costs Discusses the costs associated with operating each source throughout the year.
98 SOURCE OPTIMIZATION Section IV - Water Quality Identifies water quality of the City s sources and how they influence source utilization. Section V Other Optimization Considerations Other optimization considerations that may help overall system operation. Section V - Conclusions and Recommendations Provides conclusions and recommendations on how to optimize Orem s culinary water sources. SECTION I - SOURCE AVAILABILTY In the discussion of water source operation, the first point to consider is the availability of sources. Water is supplied to the Orem City culinary water system via 3 types of sources: springs, wells, and the Utah Valley Water Treatment Plant. The production capabilities of each source varies seasonally as well as from year to year. This section provides an overview of the annual availability of each source and how the availability will influence source utilization. Springs A spring is essentially the location at which the elevation of the water table intersects the ground surface elevation. Since the production of springs is directly related to the elevation of the water table, there is seasonal variation of availability based on hydrologic conditions, exemplified by a typical increase in yield during runoff season. To illustrate this concept, Figure 1 displays the 5- year average spring production for Orem s 2 spring sources, Alta Springs and Canyon Springs. Million Gallons Per Day Figure 1 5-year Average Spring Production 0 1-Jan 14-Mar 26-May 7-Aug 19-Oct 31-Dec Date As shown in the figure, peak production from springs occurs during the summer months, with decreased yield during the winter. There is no way to store spring water over an extended period. It must either be used when it is available or lost. Because springs are high quality, low cost sources, Orem City should fully utilize its springs to the extent possible. BOWEN COLLINS & ASSOCIATES 2 OREM CITY
99 SOURCE OPTIMIZATION Wells The City has a total of 9 groundwater wells operating under a number of water rights. The combined allowable removal of all groundwater rights is 18,306 acre-feet per year, with a maximum sustained pumping rate of 33.5 cfs. From a water rights perspective, the City has the ability to use groundwater at any time of the year. However, from a watershed management perspective, groundwater wells come from an aquifer with limited recharge. As a result, it is uncertain whether or not the City could actually pump 18,000 acre-feet per year of groundwater without dramatically drawing down the aquifer over time. This considered, it would be wise to prioritize other available sources such as flow from the UVWTP, especially if direct river flows are available during runoff season. Utah Valley Water Treatment Plant The source with the largest capacity is the UVWTP. The UVWTP can treat both direct flows and storage in the Provo River Water System: Direct Flows Storage water can generally be used anytime it is needed, subject only to conveyance and treatment capacity limitations. Orem City currently holds the rights to 54 cfs from the Provo River from April 20 th to October 15 th. However, this right decreases to 84 percent of the total right on June 20 th and is reduced again to 79 percent of the original right on July 20 th, resulting in a right of 42 cfs for the remainder of the year. Although Orem City maintains these Provo River rights, the actually yield is volatile from year to year. The City has conservatively estimated a direct annual yield from the Provo River of approximately 3,700 AF. From a supply availability perspective, the City should utilize direct Provo River rights whenever available. Since direct river rights cannot be stored, any unused water is essentially lost. Storage Storage water supplied to Orem from the treatment plant is categorized as Central Utah Project" storage and non-central Utah Project (non-cup) storage. Table 1 provides a summary of the available storage supply to the treatment plant. BOWEN COLLINS & ASSOCIATES 3 OREM CITY
100 SOURCE OPTIMIZATION Table 1 Orem City Available Reservoir Storage Description Type Volume (AF) Jordanelle Upper Lakes Non-CUP 1161 Deer Creek Dixon Irrigation Co. Non-CUP 300 Deer Creek Provo Bench Canal Co. Non-CUP 900 Deer Creek Provo Reservoir Water Users Co. Non-CUP 3246 Jordanelle Bonneville Project 1 CUP 6520 Deer Creek Project Issue 1 CUP 1300 Deer Creek Project Issue 2 CUP 200 Deer Creek Project Issue 3 CUP This allotment increases by 500 AF each year until 2017 (Total of 7520 AF) Summary of Source Priority Based on Availability Although other factors such as cost will influence how the system should be optimized, source availability is arguably the most important component. From this perspective, sources should be used as follows: Alta Springs and Canyon Springs Use all available spring water as first priority source. Provo River Natural Flow Rights Use the maximum volume available during usage period. Second in priority only to spring water. CUP/Non-CUP Storage and Wells Use as needed to satisfy demands throughout the year. Selection between individual sources within this category to be based on factors other than supply availability. The bullets above provide a general guideline for source utilization based solely on availability. Additional factors such as system operation and source costs in the following sections provide more detail for recommended source utilization. SECTION II - SYSTEM OPERATION In addition to understanding the availability of various sources, it is important to understand which sources are needed to supply water to the various parts of the City s water system. Figure 2 shows a schematic of the Orem City water system. From this schematic, it is possible to identify where sources enter the Orem City water system and which areas they serve. The following paragraphs outline the key aspects of each source from an operational stand point. BOWEN COLLINS & ASSOCIATES 4 OREM CITY
101 SOURCE OPTIMIZATION Alta Springs During an average water year, Alta Springs can provide all of the water needed for winter day demands in the Cherapple, Alta, and Northridge pressure zones. Flow enters the Upper Tanks and can flow by gravity to any pressure zone in the City except for the Cherapple pressure zone (which has its own booster pump station). Under extreme drought conditions, it is also possible to pump water into these higher elevation pressure zones using the Treatment Plant Pump Station and the Lower Tank Pump Station. However, this would be a relatively costly way to provide water for these upper pressure zones because of the associated power and energy costs. Alta Springs represents a high quality, low cost source that should be fully utilized within the City, and especially to satisfy demands in these upper pressure zones. Central Wells Well Nos. 1, 2, 5, 6, 8, and 9 all deliver flow to the Central Pressure Zone which is provided pressure via the Lower Tanks. Wells can potentially operate 24-hours a day in this pressure zone because the storage tanks can fill and drain based on system demands. This makes optimization of well sources easier in this pressure zone because it is possible to run wells longer and reduce overall unit costs for each well. In addition to being able to pump into the Lower Tanks, Well 5 is gas powered, hence no power charges are incurred if the City operates it infrequently. This provides a little more flexibility in terms of use. In the event of a problem at the treatment plant, a booster station located at the Lower Tanks can pump water to the Upper Tanks. Eastside Pressure Zone Sources Wells Nos. 3, 4, and 7 pump into the Eastside pressure zone along with the Canyon Spring. This is a regulated or closed pressure zone which means demands within the pressure zone must always be equal to the supply into the pressure zone. If supply exceeds demand, pressures within the distribution system could spike and cause pipe ruptures. This makes optimization of sources for this pressure zone more challenging because sources must be shut off if demands drop below source capacity. If possible, all of the water available from Canyon Spring should be used within the Orem City water system. The spring has a small tank that can be used to equalize the difference between daily demands. However, if necessary, a pressure relief valve could be used to convey excess flows in the Eastside pressure zone into the Central Pressure Zone. Because the spring is a relatively small source, it appears that situations in which demand is lower than the supply from the spring will be rare (during the night in the winter). Treatment Plant The Treatment Plant provides the largest potential peak source capacity within the City and also holds the largest amount of storage available within the City that may fill or drain depending on the demands within Orem City and demand on the treatment plant from other CUWCD customers. The treatment plant can also provide service to the majority of the City via gravity, with the exception of the upper pressure zones serviced by the Upper Tanks. BOWEN COLLINS & ASSOCIATES 5 OREM CITY
102 SOURCE OPTIMIZATION During the winter, there are sufficient other sources within the City to be able to avoid using any water from the treatment plant. However, a contract with the treatment plant requires Orem City to use a minimum of 10 cfs (6.46 mgd) throughout the year. Summary of Source Priority Based on System Operation The majority of water sources in the Orem City system are capable of supplying water to any point in the system, although not all sources can do so cost effectively. For example, while Well #2 could in theory serve the Cherapple pressure zone, it would need to flow through 2 booster pumps stations (a high energy cost to serve Cherapple). As noted in the previous section, Orem should generally utilize the springs and Provo River direct flows as much as possible. Operationally, Wells Nos. 1, 2, 5, 6, 8, and 9 are simpler to operate because the Lower Tanks are available to fill or drain depending on system demands. Wells Nos. 3, 4, and 7 which pump directly into the Eastside zone must be closely monitored in order to match demands and prevent over pressurization of the system. Because the majority of sources can supply water to the entire system, the City has some flexibility as to how sources are utilized relative to system operation. SECTION III - SOURCE COSTS Thus far, it has been concluded that Orem should utilize spring sources and Provo River direct runoff to the full extent possible because these sources are wasted otherwise. This is not true of surface water storage (Deer Creek Reservoir or Jordanelle Reservoir) and groundwater storage. To optimize use of groundwater storage versus surface water storage, understanding costs for each source is an important factor. Orem City water system operators maintain records of the cost of water in the City per acre-ft based on power costs, storage costs, treatment costs, and maintenance costs. Based on data assembled for the 2014 water year, Table 1 summarizes the cost of the different sources used by the City. BOWEN COLLINS & ASSOCIATES 6 OREM CITY
103 SOURCE OPTIMIZATION Table 2 Summary of Water Production and Power Costs for 2014 Winter Use (acre-ft) Summer Use (acre-ft) Winter a Average Cost ($/acre-ft) Summer a Average Cost ($/acre-ft) Total Use (acreft) Alta Spring b 903 1,100 $11 $22 2,002 Canyon Springs b $17 $ Well 1 b $0 $ Well 2 b $175 $ Well 3 b $89 $ Well 4 b $61 $ Well 5 b $49 $45 1,691 Well 6 b $910 2 Well 7 b $60 $ Well 8 b 230 1,295 $338 $62 1,524 Well 9 b $71 $60 1,523 TP Water c 6,567 12,009 $63 $74 18,576 10,903 18,184 29,087 a Summer includes May September corresponding to winter/summer power and energy costs for Rocky Mountain Power Schedule 6. b primarily includes power costs for operation. No O&M costs or replacement costs are included. c costs do not include some of the fixed costs associated with Jordanelle and treatment plant capital costs. These costs are not reduced through reduced use, and consequently do not represent an equivalent comparison to well costs. Using Table 2 as a reference, the cost associated with operating each source is discussed in the following sections: Winter vs. Summer Cost In some cases, the average cost per acre-ft of water produced in the winter is higher than the cost per acre-ft in the summer. This is true even though Rocky Mountain Power (RMP) costs are higher in the summer (for May to September), and is related to how RMP charges for electricity: Power Costs ($/kw) Power costs are those costs associated with how much horsepower may be required for a motor. If a motor is not operated during a month, no power charge is incurred. However, whether a pump is turned on for 1 hour or 700 hours, the same power charge is incurred for a month. For example, the costs for Well 6 shown in Table 2 are extraordinarily high per acre-ft of water produced. This is a result of operating the well for a very short period of time to take water samples for testing. A full power charge for the month was incurred for the month of July even though the well was operated for less than a day. Power charges for winter and summer months are $10.65/kW and $14.27/kW respectively (Schedule 6). Energy Costs ($/kwh) Energy costs are those costs associated with both power and duration of use. Energy costs are similar to fuel costs for a car engine. A higher BOWEN COLLINS & ASSOCIATES 7 OREM CITY
104 SOURCE OPTIMIZATION horsepower engine will consume more fuel than a lower horsepower engine and the cost of fuel (energy) is directly proportional to the duration and intensity of use. Energy costs for winter and summer months are cents/kwh and cents/kwh respectively (Schedule 6). Total Unit Costs ($/acre-ft) Because of the high power cost associated with wells and other facilities, unit costs to produce water are cheaper when wells or sources are operated constantly over a month than if they are operated for short periods or intermittently. The relatively high unit costs for some sources in the winter are related to operating those sources intermittently during the winter because of reduced wintertime demand. Spring Costs As shown in Table 2, Alta Springs and Canyon Springs are by far the cheapest water sources utilized by the City. This is because the spring sources do not require treatment and only require minimal power costs to deliver flow to the City storage tanks. Treatment Plant Costs In addition to power and energy costs associated with operating the Utah Valley Water Treatment Plant shown in Table 2, Orem City is also responsible for Jordanelle storage costs and other costs associated with maintaining the conveyance facilities needed to deliver water to the treatment plant. Note that to develop a fair comparison of costs of service for each source type, Table 2 excluded fixed costs for the treatment plant. These costs include annual contractual costs Orem is required to pay CUWCD regardless of how much water is used. The decision to use or not to use water should therefore be based on the costs that can be controlled by Orem. The cost associated with treatment at the UVWTP varies slightly by source. Sources for the treatment plant consist of direct flows from the Provo River and surface storage of the Provo River from Jordanelle and Deer Creek Reservoirs, which is categorized as Project (CUP) Water and Non-Project Water. These sources represent high quality water sources in terms of taste and hardness, but require treatment to culinary water standards. The cost of treatment plant water can be divided as follows: Project Water costs Project Water costs are those costs associated with project water that has been appropriated or acquired by the Bureau of Reclamation for the Central Utah Project (CUP). o Operation, Maintenance & Replacement Costs (OM&R) These costs are associated with operation, maintenance, and replacement planning costs for CUP facilities. CUWCD charges $10.14/acre-ft for OM&R for Project Water o OM&R Reserve These costs are for unforeseen or unplanned events such as costs incurred from interruption of water, extraordinary repair and replacement costs, extraordinary O&M costs, or other emergency/contingency costs. Costs are $2.40/acre-ft. BOWEN COLLINS & ASSOCIATES 8 OREM CITY
105 SOURCE OPTIMIZATION Non-Project Water Non-Project Water include all other water not reserved or withdrawn by Bureau of Reclamation Facilities. o OM&R, Reserve Costs include the cost of operating and maintaining facilities that convey non-project water through CUP facilities. Costs are approximately $5.80/acre-ft for OM&R and $1/acre-ft for reserve costs. o Carriage Costs Carriage costs are fees paid to use excess capacity in Bureau of Reclamation conveyance facilities when the full capacity is not being used by Project Water. This is in essence a fee to rent capacity in facilities when they are underutilized. Carriage costs are approximately $3/acre-ft for non-project water conveyed through CUP facilities. Project vs Non-Project Project water O&M costs are roughly $12.50/acre-ft compared to approximately $9.80/acre-ft for non-project water costs. Therefore, Orem City should prioritize using Non-Project water over Project water if capacity is available in the Olmsted/Alpine System. Note that this is only possible when excess capacity is available in conveyance and treatment systems to the UVWTP. If no excess capacity is available, the City would be required to use Project water only. Well Costs The costs for wells shown in Table 2 are primarily the power costs of operation for the wells and do not include life cycle costs of the well which include pump replacement costs, rehabilitation and/or replacement costs. These costs can be difficult to estimate without detailed investigation, but can be approximated as $10/acre-ft based on average costs for well OM&R around the Wasatch Front and CUWCD s standard OM&R rate for Project Water. The unit cost of well water is usually cheaper than the cost of treatment plant water if wells are operated for a certain amount of time during the month. Table 4 shows the approximate unit cost to operate each well. Costs in the table indicate costs if wells using RMP Power Schedule 6A are only operated during off-peak hours. BOWEN COLLINS & ASSOCIATES 9 OREM CITY
106 SOURCE OPTIMIZATION Table 4 Approximate Unit Costs to Operate Wells Based on Existing Use Patterns Approximate Power Requirement a (kw) Approximate Winter Power Charge ($/month) Approximate Summer Power Charge ($/month) Winter Energy Cost ($/acreft) b Summer Energy Cost ($/acre-ft) b Well No $6,272.6 $7,872.4 $43.86 $ $6,816.2 $8,549.8 $39.20 $ $2,997 $3,789 $48.96 $ $7,698 $9,648 $46.12 $ c 453 NA c NA c NA c NA c $3,041 $3,844 $49.17 $ $1,351 $1,739 $58.49 $ $6,493 $8,147 $38.35 $ $6,669 $8,367 $38.03 $43.60 a power requirement for wells 4, 5, and 6 were estimated based on pump curves. All other power requirements come from RMP power bills for b Based on assumption operators use wells for 24 hours/day under Schedule 6. c Well 5 is gas operated. Table 5 displays the approximate number of days of required well operation to be more cost efficient than using treatment plant water. Table 5 Required Days of Full-Time Well Usage to Break Even with UVWTP Costs Well No. Minimum Days of Winter Operation a Minimum Days of Summer Operation a NA b NA b a based on assumption operators use wells 80 percent of every day under schedule 6. b Well 5 is gas operated, gas costs for Well 5 were not available for this study. As shown in the table, most wells become more cost efficient than the treatment plant with a reasonable amount of usage. However, some wells are not as cost efficient. For example, Wells 7 needs to operate for more days in a month to be less expensive than treated water from the City s BOWEN COLLINS & ASSOCIATES 10 OREM CITY
107 SOURCE OPTIMIZATION treatment plant because of a relatively low capacity and high unit cost ($/acre-ft). However, there may be some improvements the City could implement to reduce unit costs such as changing power rate schedules, improving well efficiency, or installing a variable frequency drive. Note that if the City were to switch to Schedule 6A at wells 3, 6, and 7; it may be possible to reduce unit costs to less than the City s treatment plant. However, this would require reducing use to off-peak hours between 11pm and 7am. Based on current demands, this may be possible to do in the short term until production requirements in the City are high enough to require more full time operation. Although it may be less expensive to operate wells compared to using water from the treatment plant, it is important to consider the long-term effects of pumping groundwater on source availability. While not as apparent as Deer Creek Reservoir and Jordanelle Reservoir, the reservoir of storage in the aquifers serving Orem City wells can be drawn down over time. This is one reason why it is recommended to use direct runoff from the Provo River as much as possible even though treatment plant water may be slightly more expensive than groundwater. In addition, the volume of surface water available in Deer Creek or Jordannelle reservoirs is much easier to quantify than the available water in a groundwater aquifer. It should also be noted that uncertainties exist in groundwater sources such as aquifer recharge rates. SECTION IV - WATER QUALITY Orem City utilizes a combination of groundwater and surface water sources in the distribution system. According to the 2013 Consumer Confidence Report, Orem City as a whole produces high quality water. Since water quality from each individual source is not available at this time, it is difficult to discuss the influence of water quality on source optimization quantitatively. However, from a qualitative stand point, there are some components of water quality worthy of consideration. One aspect of water quality in the City s water system is water age, which is correlated to other important water quality constituents such as chlorine residual and disinfection by-products. This particularly applies to Orem due to the fact that the majority of sources are concentrated in the northeast part of the City, and depending on demands, water may take a longer time to reach customers to the west. Issues regarding water age are most significant during winter months when the minimum treatment plant flow and spring flows are sufficient to satisfy nearly all of the City s demand. While these are points of consideration, it is likely not ideal to operate sources purely from a water quality stand point. For example, frequently turning on wells in the winter to provide a source within closer proximity of users may quickly become expensive and inefficient. SECTION V OTHER OPTIMIZATION CONSIDERATIONS In general, Orem City s water system is relatively simple. Water flows from higher to lower pressure zones with only minimal pumping required to deliver water to higher pressure zones. Even so, there are a number of ways that Orem City may be able to improve energy efficiency and reduce overall operating costs. PRV Settings BOWEN COLLINS & ASSOCIATES 11 OREM CITY
108 SOURCE OPTIMIZATION In general, PRV settings in the City do not produce looping of flow through pump stations and PRVs. However, BC&A has made some recommendations regarding PRV settings to reduce or eliminate unnecessary looping of flow through pump stations and PRVs. Rocky Mountain Power Power Rate In some cases, significant savings can be realized by selecting a different power rate for various well sites. Note that for Rocky Mountain Power s Energy Time-of-Day billing option (Schedule 6A), it is possible to significantly reduce overall power/energy costs by committing to shutting pumps off between 7am and 11pm (on-peak hours). In some cases, power/energy costs can be cut roughly by one-third (for 8 hours of operation for 30 days). This is because the power cost under this option is significantly less (65% less) while the energy cost is higher for on-peak hours (300% higher) and slightly less (7% less) during off-peak hours. Currently, only Wells 1, 2, and 6 use the energy time-of-day billing option, with the majority of wells using the distribution voltage billing schedule (Schedule 6). To demonstrate the potential savings from operating wells, a side by side comparison for power and energy costs to operate Well 9 was analyzed under different usage scenarios. Table 6 provides a summary of the comparison. Rocky Mountain Power - Bill Schedule Operating Time (Hours per Day) Table 6 Well 9 Monthly Power/Energy Cost Comparsion Monthly Winter Charges ($/acre-ft) Monthly Summer Charges ($/acre-ft) 6 8 $65.83 $ A 8 $35.90 $ Produced Volume (acre-ft) Monthly Winter Charges ($/acre-ft) Monthly Summer Charges ($/acre-ft) Produced Volume (acre-ft) 6 20 $40.81 $ A 20 $54.84 $ Monthly Winter Charges ($/acre-ft) Monthly Summer Charges ($/acre-ft) Produced Volume (acre-ft) 6 24 $38.03 $ A 24 $56.94 $ As can be seen in the table, Schedule 6A and Schedule 6 are cheapest for opposite conditions. If a well has a long run time during a month, Schedule 6 will be cheaper. If a well only operates on average 8 hours per day during off-peak hours (11 p.m. 7 a.m.), Schedule 6A is cheaper. Based on this rough evaluation, it is recommended that Orem City consider changing the power schedule for some less used wells to Schedule 6A (except for the gas powered Well 5) and that system BOWEN COLLINS & ASSOCIATES 12 OREM CITY
109 SOURCE OPTIMIZATION operators make a conscious effort to shut down well operation during on-peak hours (7 am to 11 pm). Based on typical water demand patterns, City source capacity, and current storage availability at the UVWTP, the City should be able to do so under most operating conditions for existing demands. This may change as the City s demands increases. However, the City is allowed to modify its rate schedule once per year. As a result, as demands increase and wells are needed for more capacity; it may be possible to change power schedules again as needed. Variable Frequency Drives or Pump Sizing None of the cities pump stations are equipped with variable frequency drives. The City may be able to qualify for funding opportunities to install variable frequency drives at some pump stations through Rocky Mountain Power s Wattsmart program. Because these would potentially be custom incentives, the City would need to file an application with Rocky Mountain Power to determine if projects could be partially funded with energy efficiency incentive funds (see form in Appendix). The Cherapple pump station may be a prime location to begin investigating potential energy savings through RMP s Wattsmart program. This pump station could potentially use a smaller pump to reduce power costs as well. Note that power savings do not qualify for RMP s Wattsmart program, but could represent significant long term savings from reduced power charges. Wells 3 and 4 also represent ideal locations for VFDs because there is no storage tank for these wells to pump to. Well Efficiency In addition to improving energy efficiency, it is important to consider the efficiency of the wells themselves. Wells can become less productive over time if improperly maintained. This results in higher energy costs with reduced water production. In relation to using well sources, the following best management practices are recommended for Orem City wells to maintain production efficiency and minimize operation costs: Develop/Implement a Well Operations and Maintenance Plan Maintain consistent well records, including General Site Security - daily Check for unusual noises, vibrations or leaks - daily Record sand level readings - daily Inspect oil levels - daily Measure Chlorine levels - daily Check Chemical supplies - weekly Record static and pumping water levels - weekly Record instantaneous pumping rate - weekly Record totalized pumping - weekly Sample/analyze for Coliform Bacteria - monthly Sample/analyze for Iron Bacteria (or suspected water quality problems) semiannual, if appropriate Sample/analyze for Drinking Water Parameters - annual Record and monitor specific capacity and pump yield BOWEN COLLINS & ASSOCIATES 13 OREM CITY
110 SOURCE OPTIMIZATION Consider redevelopment when specific capacity decline exceeds 10-15% - this practice often pays for itself through increased power/energy efficiency Collect and analyze water samples at least annually Perform video inspections whenever the pump is out Watch for early warning signs of drawdown or other well problems Many of these practices may have already been implemented by Orem City personnel. If not currently being practiced, it is recommended that Orem City consider adding these best management practices to their routine O&M plan for each well. With these best management practices in place, it may be possible to identify signs of over withdrawal or other problems at wells before groundwater conditions or wells are impacted long term. SECTION VI CONCLUSIONS AND RECOMMENDATIONS The process of source optimization is a function of several components, including source availability, system operation, cost, and water quality. While some components may carry more weight than others, it is important to consider the different aspects. Ultimately, Orem City personnel will decide how to best utilize water resources based on whichever criteria the City deems most important. Because cost is always important, Figure 3 displays an annual source optimization scenario focused only on minimizing operation costs. Although it would be less expensive to operate wells during the winter, the agreement with Central Utah Water Conservancy District (CUWCD) requires Orem to use a minimum of 10 cfs (6.46 mgd) throughout the year. As shown in the figure, winter demands can be almost entirely satisfied by spring flows and treatment plant flows. As winter demands fluctuate and exceed the combined capacity of springs and the minimum treatment plant flow of 10 cfs (6.46 mgd), the City can either begin to operate a well or increase flows from the treatment plant. Note that Well 7 is not shown on the figure because in an average water year, the well would not normally be needed to operate full time for a full month (as needed to be more cost competitive than the treatment plant). As mentioned previously, Figure 3 prioritizes sources based on costs, and because most wells are generally cheaper to operate (for some operating conditions), they take precedence over treatment plant flows. The total volume of groundwater used annually by the City under the scenario shown in Figure 3 is approximately 15,225 acre-feet, which is twice the amount which has been used historically. Although the City owns sufficient water rights to remove this much water from aquifers, it is not prudent from a water resource management perspective. Although operational costs are important to consider, it is recommended that the City first consider available water supplies and how to best manage supplies. Figure 4 shows one scenario the City could use to manage available water supplies. A few guidelines were used to develop this scenario: Spring Flow All available spring flow is used within the City. CUWCD o Storage The minimum amount of treatment plant flow needed during winter months is used (10 cfs or 6.5 mgd). This flow would primarily be taken from Deer Creek Reservoir. For brief intervals in the summer, storage is used rather than turning on a well for a minimal amount of time. BOWEN COLLINS & ASSOCIATES 14 OREM CITY
111 SOURCE OPTIMIZATION o River When natural river flows become available, all available natural flow is used within the City. Flow shown in Figure 4 is for an average water year. Well 5 Well 5 is used as the primary well to meet fluctuating demands in the winter. This well was used because it is gas operated and has no power demand charge associated with turning the well on and off. Other Wells The priority for wells shown in the figure includes using wells in the Central Zone because of the available storage reservoirs in the Central Zone. This provides more flexibility in operating wells. Where possible, wells are prioritized based on using wells with the lowest unit cost. August For the month of August, other wells are turned down so that Well 6 and 7 are operated at full capacity for the month of August. To be cost effective, Wells 3, 6, and 7 needs to be operated as long as possible during a month. In addition, exercising wells at least once a year is recommended as part of well best management practices. Off-peak It is recommended that Wells are only operated during off-peak hours as would be required if the City switches to RMP Schedule 6A. On-peak hours are from 7 a.m. to 11 p.m and have higher energy costs. Figure 4 shows a water management scenario for an average water year. During a dry water year, the City would need to rely on more water from storage sources (including groundwater or surface water at Deer Creek Reservoir or Jordanelle Reservoir). The storage source the City should utilize during dry weather conditions will depend on climatic conditions and the City s interest in balancing water quality within the City (which is subjective to City preferences). In general, surface water storage will provide higher water quality within the City compared to groundwater storage. However, groundwater storage will continue to remain the lower operational cost in the City. If the City developed a preferred water quality standard (perhaps developed based on hardness), it would be possible to create another supply scenario to optimize water supply based on water quality standards. However, the balance between surface water and groundwater would likely vary on a year to year basis and would require water quality sampling at sources and at various locations in the City to calibrate the water model. BOWEN COLLINS & ASSOCIATES 15 OREM CITY
112 APPENDIX C TECH MEMO: WRF REUSE
113 T E C H N I C A L M E M O R A N D U M TO: COPIES: FROM: Neal R. Winterton Public Works, Water Resource Division Manager City of Orem 56 North State Street Orem, Utah Chris Tchirki/Orem City Michael Collins/BC&A Andrew McKinnon/BC&A File Aaron Anderson/Keith Larson, P.E. DATE: June 4, 2015 SUBJECT: WRF Reuse Evaluation JOB NO.: BC&A # INTRODUCTION AND PURPOSE Orem City desires to look into the feasibility of a secondary water system designed to utilize effluent from the Water Reclamation Facility for outdoor watering purposes. As development occurs in the western region of Orem and in the Town of Vineyard, water demand is predicted to increase substantially. A secondary water system would help supplement outdoor water use in these growing areas, helping alleviate the stress on the water distribution system in years to come. Bowen, Collins & Associates (BC&A) has been tasked with evaluating the available supply, required storage, and potential demand for a secondary system. The purpose of this study is to determine the required water system improvements and associated costs needed to develop the system. This Technical Memorandum (TM) has been developed to document the approach and assumptions of this evaluation and to summarize the findings, cost estimates, and recommendations.
114 WRF REUSE EVALUATION This memorandum is organized into six sections: Supply Analysis Addresses the assumptions and methods used to determine the available supply of secondary water on a yearly basis, with and without storage. Potential Demand Identifies areas where secondary water could be used and quantifies the maximum demand for secondary water associated with each area. Required Improvements Discusses the alternatives for the required water system improvements, including storage and conveyance. Water Quality Evaluation Discusses State of Utah requirements for Type I reuse water and the necessary improvements to meet the required water quality levels set by the State, as well as an evaluation of the water quality constituents which influence the feasibility of reuse (water quality parameters which are not governed by State regulations, but that could potentially affect turf grass and trees) Cost Evaluation Contains an analysis of the costs associated with development of a reuse system. Conclusions and Recommendations Provides final conclusions and recommendations based on the results of the analysis. SECTION I SUPPLY ANALYSIS Interest in the implementation of a secondary water system in Orem City is predicated upon the recent approval from the State of Utah for the reuse of up to 9,634 acre-feet per year of effluent from the Water Reclamation Facility (WRF). This water right allocation is governed by the available flow into the WRF. Using historical data for inflow at the Orem WRF as well as estimates for inflow at buildout developed in the 2014 Orem City Sewer Master Plan, the useable volume of available reuse water supply was determined. Determining Available Supply Flow monitoring data from 2013 shows that the Orem WRF treats between 8 and 10 million gallons of wastewater per day, which is a combination of domestic water, infiltration (groundwater entering the system), and inflow (surface water associated with precipitation events entering the system). Due to the absence of a water right to use infiltration and inflow, along with the seasonality and uncertainty associated with these components of the wastewater, they cannot be considered as sources of water for potential reuse. For this reason, only domestic wastewater production is taken into account in this analysis. BOWEN COLLINS & ASSOCIATES 2 OREM CITY
115 WRF REUSE EVALUATION Based on an estimate of population growth over the next 46 years in Orem, Lindon, and Vineyard, Table 1 displays the predicted total domestic wastewater flows to the WRF through Residential Domestic Wastewater Flow (mgd) Table 1 Projected Total Domestic Wastewater Flows Non-Residential Domestic Wastewater Flow (mgd) UVU Domestic Wastewater Flow (mgd) Total Domestic Wastewater Flow (mgd) Year Useable Volume with No Storage for the Existing System Due to the seasonal climate in Northern Utah, outdoor water use is limited to the warmer months of the year, typically from the middle of April to the middle of October. Figure 1 displays the demand pattern for the Orem City water system observed in Water Production (mgd) Outdoor Indoor Figure 1 Orem City Seasonal Demand BOWEN COLLINS & ASSOCIATES 3 OREM CITY
116 WRF REUSE EVALUATION Without facilities to store treated effluent during the winter months, the useable volume of reuse water will be limited to the available flow in the summer months. Additionally, without storage, the combined peak day demand of all secondary water users cannot exceed the available flow from the plant. Based on these limitations, the maximum usable volume without storage will be as illustrated in Figure 2. The quantity of secondary water that could be used in the existing system without storage is 3,078 acre-ft per year. This is obviously only a fraction of the total available effluent. Figure 2 Estimated Useable Volume of WRF Effluent Without Storage Useable Flow from WRF WRF Average Inflow Volume (MG) Apr 15-May 15-Jun 15-Jul 15-Aug 15-Sep 15-Oct It should be noted that the reference to without storage contained in this section refers to storage capable of storing water produced in the winter for use later in the summer. While this alternative does not include a storage reservoir of this nature, a small equalization reservoir would still be required in order to deal with daily fluctuations in demand. Available Volume with Storage for the Existing System By adding a large storage reservoir to the secondary water system, water that would otherwise not be used during winter months could be stored for later use during summer months with high outdoor water demands. Theoretically, storage would allow the use of 100% (not accounting for losses associated with a storage reservoir, such as evaporation and infiltration) of the WRF effluent for secondary water needs. As shown in Figure 3, the blue area represents the total volume of water into the plant over 365 days, but modified to resemble the outdoor use pattern for the City. The BOWEN COLLINS & ASSOCIATES 4 OREM CITY
117 WRF REUSE EVALUATION red line shows the average daily inflow to the plant. The area of the blue region located above the red line is the storage required in order to reuse all of the water into the plant. While the total estimated yearly volume of water treated by the WRF for the existing system is 9,902 acre-feet, the water right limits use to 9,634 acre-feet per year. With storage, the secondary water system would have an available supply of 9,634 acre-feet per year, but would require 4,928 acre-feet of storage. Figure 3 Estimated Useable Volume of WRF Effluent With Storage Useable Flow from WRF WRF Average Inflow Volume (MG) Apr 15-May 15-Jun 15-Jul 15-Aug 15-Sep 15-Oct Available Supply for the System at Buildout At the estimated buildout year of 2060, average domestic wastewater flows are predicted to increase to MGD. Using the same method of analysis adopted for existing wastewater flow rates, Table 1 contains a summary of the available secondary water supply with and without storage. BOWEN COLLINS & ASSOCIATES 5 OREM CITY
118 WRF REUSE EVALUATION Table 1 Estimated Available Supply for the Orem Secondary Water System Total Domestic Wastewater Flow (mgd) Available Yearly Supply Without Storage (acre-ft) Available Yearly Supply With Storage (acre-ft) Total Required Storage (acre-ft) Year ,078 9,634* 4, ,589 9,634* 3,010 * Limited by existing water rights. SECTION II POTENTIAL DEMAND Due to the high amount of predicted growth on the west side of Orem City and Vineyard, water demand will continue to increase in the upcoming years. BC&A has identified the following areas as potential locations for secondary water use: Sleepy Ridge Golf Course Lakeside Sports Complex Orem City Southwest Annex Town of Vineyard Sleepy Ridge Golf Course/Lakeside Sports Complex Sleepy Ridge Golf Course and Lakeside Sports Complex are two locations that could immediately benefit from a secondary water connection. Demands for both locations were calculated by measuring their area of irrigable land and assuming an irrigation rate of 3 acre-feet per acre per year. This is lower than the historic average for outdoor irrigation in Orem City, but is consistent with conservation goals and actual turf water needs. Based on these assumptions, projected demand is 381 and 135 acre-feet per year for the Golf Course and Sports Complex, respectively. Southwest Annex The Southwest Annex currently does not have any outdoor water demand to benefit from a secondary water system. At buildout, however, there will be signficant demand in the area that could be satisfied from a secondary system fed with reuse water. Buildout demands were developed conservatively using observed irrigation rates for medium to low density residential areas (55 percent irrigated, 3 acre-feet/acre/year). The total area of the Southwest Annex is approximately 500 acres, which equates to a yearly demand volume of 825 acre-feet at buildout. Town of Vineyard The Town of Vineyard is another area that doesn t current have substantial outdoor demands but will at buildout. According to agreement No. A , Orem City has agreed to provide culinary water at a rate of up to 6,300 gpm averaged over the course of a day to Vineyard. This is based on the assumption that Orem City will supply culinary water for both indoor and outdoor water demands. BOWEN COLLINS & ASSOCIATES 6 OREM CITY
119 WRF REUSE EVALUATION If Vineyard were to install a secondary system, a large portion of the 6,300 gpm demand on Orem City could be satisfied from reuse water. Dividing by the peak day factor for the City of Orem of 2.27, average day demand for Vineyard off of the Orem culinary water connection is estimated to be 2,775 gpm at buildout, or 4,476 acre-feet per year. If it is assumed that 56 percent of total water use in Vineyard will be used outdoors (the percentage for the current Orem City water system), the estimated outdoor water demand at buildout for Vineyard is 2,507 acre-ft. This has been assumed to be the potential demand for reuse water in Vineyard. In reality, there will probably be more outdoor water demand in Vineyard at buildout based upon the fact that this analysis considers only the demand in the City to be satisfied with water from Orem City. It is our understanding that Vineyard will ultimately have other water demands that are to be satisfied from other sources, but could potentially be satisfied from Orem reuse. Table 2 summarizes demands for each location identified in the analysis. Table 2 Potential Demand Locations for Orem City Secondary Water System at Buildout Demand Location (acre-ft/yr) Vineyard 2,507 Southwest Annex 825 Sleepy Ridge GC 381 Lakeside Sports Complex 135 TOTAL 3,848 Comparison of Potential Demands to Available Supply Based on these estimations, it is clear that available supply is far greater than the potential demands identified here. Even without a signficantly storage reservoir, reuse water would be capable of satisfying all identified potential outdoor demands at buildout. To use more reuse water, the City would need to signficantly increase its potential reuse service area. This might include extending secondary facilties into currently developed areas of Orem City or extending further into Vineyard as previously mentioned. BOWEN COLLINS & ASSOCIATES 7 OREM CITY
120 WRF REUSE EVALUATION SECTION III REQUIRED IMPROVEMENTS The implementation of a reuse water system in Orem would require two types of improvements. First, improvements would be required at the Water Reclamation Facility to bring the effluent up to State standards required for reuse. Second, a secondary water system would need to be constructed to convey and deliver the reuse water to the various points of use. Treatment Improvements BC&A has not been tasked with a detailed review of required improvements at the Water Reclamation Facility to meet reuse standards. Orem City personnel indicate that improvements required for this purpose were designed and bid as part of a 2011 improvement project at the facility. Althought the improvements were eventually dropped from the project for budgetary reasons, the City had a competetive bid of approximately $1,000,000 for the required improvements. Updating this to 2014 dollars and adding 10 percent for a separate mobilization results in a budgetary number of $1,200,000 for required treatment improvements associated with reuse. Conveyance Improvements In terms of conveyance, BC&A examined required improvments to serve demands to the Sleepy Ridge Golf Course, Lakeside Sports Complex, and Southwest Annex. Supplying secondary water to Vineyard has not been included in this improvement analysis because there are currently no plans for secondary water use in Vineyard. While it would be prudent for Orem City to discuss this alternative with Vineyard, no plans for this service have been included in this analysis. Orem City currently has in place aproximately 6,500 feet of pipeline intended for reuse water use. This pipeline extends from near the reclamation facility to the Sleepy Ridge Golf Course. Some additional improvements will be required in order to serve the Golf Course, Lakeside Sports Complex, and the Southwest Annex. As shown in Figure 4, the system would consist of 2 booster pump stations to pump water to two separate storage reservoirs, one at the Golf Course and one in the Southwest Annex. From the storage reservoirs, two additional booster pump stations would pump water up to service pressure in each area. Tables 3 and 4 provide a summary of required pipe and pump improvements for the system, respectively. It should be noted that Table 3 includes only the major conveyance pipelines in the system. It has been assumed that additional distribution pipelines in the Southwest Annex would be installed by each individual development. Table 3 Secondary Water System Pipe Improvements Diameter (inches) Length (ft) 8 1, , , ,590 TOTAL 23,195 BOWEN COLLINS & ASSOCIATES 8 OREM CITY
121 WRF REUSE EVALUATION Table 4 Secondary Water System Booster Station Improvements Booster Station Capacity (gpm) Lift (feet) Required Horsepower WFR # WRF # Sleepy Ridge SW Annex To satisfy fluctuations in demand, particularly during the peak hour demand on the system, equilization storage would be provided at each of the storage locations shown in Figure 4. Table 5 summarizes the required volume for each reservoir. Table 5 Required Volume of Equalization Storage Required Location Volume (MG) Sleepy Ridge* GC 0.64 SW Annex 1.91 TOTAL 2.55 *There is an existing pond at Sleepy Ridge Golf Course. Existing volume is unknown. Conveyance Improvements Golf Course and Sports Complex Only Orem City may decide that they are not interested in installing and operating a secondary service area inside the Southwest Annexation Area. If Orem City decides to only provide reuse water to Sleepy Ridge Golf Course and Lakeside Sports Complex, the required system improvements will decrease substantially. Table 6 summarizes of the required improvements under this scenario. Table 6 Required System Improvements for Sleepy Ridge/Lakeside Sports Complex Component Pipes Booster Pumps Storage Quantity 12 inch diameter, 2,070 linear feet 2 booster pumps, 175 hp total 0.64 MG BOWEN COLLINS & ASSOCIATES 9 OREM CITY
122 WRF REUSE EVALUATION SECTION IV WATER QUALITY EVALUATION Utah Administrative Code R provides the general requirements for land application of treated effluent. The code differentiates between Type I and Type II reuse water, which have different allowable uses. In order to provide reuse water for Sleepy Ridge Golf Course, Lakeside Sports Complex, and to potentially expand reuse to residential use, the City will need to meet requirements for Type I, which is categorized as likely coming into direct human contact. The requirements for Type I reuse as outlined in R (C) are as follows: 1. The monthly arithmetic mean of BOD shall not exceed 10 mg/l as determined by composite sampling conducted once per week. Composite samples shall be comprised of at least six flow proportionate samples taken over a 24- hour period. 2. The daily arithmetic mean turbidity shall not exceed 2 NTU, and turbidity shall not exceed 5 NTU at any time. Turbidity shall be measured continuously. The turbidity standard shall be met prior to disinfection. If the turbidity standard cannot be met, but it can be demonstrated to the satisfaction of the Director that there exists a consistent correlation between turbidity and the total suspended solids, then an alternate turbidity standard may be established. This will allow continuous turbidity monitoring for quality control while maintaining the intent of the turbidity standard, which is to have 5 mg/l total suspended solids or less to assure adequate disinfection. 3. The weekly median E. coli concentration shall be none detected, as determined from daily grab samples, and no sample shall exceed 9 organisms/100 ml. 4. The total residual chlorine shall be measured continuously and shall at no time be less than 1.0 mg/l after 30 minutes contact time at peak flow. If an alternative disinfection process is used, it must be demonstrated to the satisfaction of the Director that the alternative process is comparable to that achieved by chlorination with a 1 mg/l residual after 30 minutes contact time. If the effectiveness cannot be related to chlorination, then the effectiveness of the alternative disinfection process must be demonstrated by testing for pathogen destruction as determined by the Director. A 1 mg/l total chlorine residual is recommended after disinfection and before the treated effluent goes into the distribution system. 5. The ph as determined by daily grab samples or continuous monitoring shall be between 6 and 9. In order to meet these water quality standards, Orem City s WRF will need to construct tertiary effluent filters as well as a small chlorination system which can provide the required contact time and line residual. Aqua Engineering recently completed the design of a tertiary filtration system at the plant, an improvement which was estimated to cost approximately $1 million dollars. However, this design did not include the necessary chlorine disinfection improvements which are required to meet Type 1 reuse standards. This considered, the estimated cost to complete the necessary water treatment improvements at the WRF have been estimated at $1.2 million. In addition to meeting standards set by the Utah Administrative Code, it is also important to evaluate other water quality components which will influence the feasibility of a reuse system. Excessively high concentrations of particular compounds can introduce a risk of damaging plant life when used in irrigation. Table 8 provides a summary of water quality guidelines for irrigation water along with the results of a grab sample from the WRF effluent. BOWEN COLLINS & ASSOCIATES 10 OREM CITY
123 WRF REUSE EVALUATION Restriction on Use Table 8 Irrigation Water Report and Quality Guidelines for Orem City ph Sodium meq/l Bicarbonate meq/l Chloride meq/l Nitrates mg/l Sulfates mg/l Boron mg/l TDS mg/l None <3 <1.5 <4 < <0.7 <450 Slight to Moderate Severe <6.5, >8.4 >9 >7.5 >10 >30 >400 >3.0 >2000 Orem City Samples * ** 104 < From Guidelines for Interpretation of Water Quality for Irrigation, Oregon State University, Irrigation Water Quality Criteria, Colorado State University, and Irrigation Water Quality, University of Minnesota. Compiled by Von Isaman, QA Consulting and Testing, LLC *From effluent data provided by Orem City personnel from Jan ** From effluent data provided by Orem City personnel from Jan March 2015 As can be seen in Table 8, the water quality of current Orem City effluent is relatively good for reclaimed water. Restrictions for irrigation purposes based on the quality of the effluent range from none (ph, Nitrates, Sulfates, and Boron) to slight (Sodium, Bicarbonate, Chloride, and TDS). This means that, in general, the effluent likely has a relatively low risk of damaging plant life. Unfortunately, predicting the suitability of reuse water use for irrigation is affected by more factors than just the effluent quality. Issues such as the type of landscaping (turf grass vs. broadleaf plants), soil characteristics, and irrigation practices can all affect how a landscape responds to any given irrigation water. Since the reuse water will be used predominantly for turf grass (generally more salt tolerant than other types of plants) and water quality is relatively good, it seems likely that the City will be able to use the reuse water for irrigation at the golf course and sports park without additional blending. If any quality issues do arise, the City could explore several different solutions such as: irrigating more frequently and deeply to maintain a higher soil moisture content and leach excess salts, or blending the treatment plant effluent with culinary or canal water in order to lower salt concentrations. Additional information is contained in a publication attached at the end of this memorandum. SECTION V COST EVALUATION This section considers the cost of development of a reuse system. This will include both capital costs and ongoing operation and maintenance costs. While identifying the absolute costs of reuse is useful, it is also necessary to evaluate the costs of the alternative in order to evaluate if reuse is cost effective. In this case, the alternative to reuse is to supply potential reuse demands from culinary sources. Thus, this section includes projected costs for development of a reuse sytem and projected costs for serving the same area using culinary water. BOWEN COLLINS & ASSOCIATES 11 OREM CITY
124 WRF REUSE EVALUATION Reuse System Costs Costs associated with a reuse system can be grouped into three categories: capital costs, operation and maintenance costs, and water purchase costs. Capital Costs There are two likely scenarios for providing secondary water service in Orem: Alternative #1 - Provide service to Sleepy Ridge Golf Course, Lakeside Sports Complex, and extend a full secondary system using reuse water to the Southwest Annex Alternative #2 - Provide service to only Sleepy Ridge Golf Course and Lakeside Sports Complex The capital costs associated with the construction of these alternatives have been estimated based on historic construction costs for simliar facilities. Table 7 shows the cost estimate for the construction of Alternative #1 in 2014 dollars. Table 8 shows the same information for Alternative #2. BOWEN COLLINS & ASSOCIATES 12 OREM CITY
125 WRF REUSE EVALUATION Table 7 Alternative #1 Cost Estimates System Component Unit Cost Cost (2014 Dollars) Water Reclamation $1,200,000 Facility Improvements* NA 8 inch pipe $138/foot $228, inch pipe $151/foot $1,959, inch pipe $169/foot $1,180, inch pipe $190/foot $302,000 WRF Booster Station #1 $3,650/hp $91,000 WRF Booster Station #2 $3,650/hp $146,000 Sleepy Ridge GC $608,000 Booster Station and Pond Modifications $3,650/hp Southwest Annex $2,048,000 Booster Station $3,150/hp Southwest Annex $764,000 Storage Pond $0.40/gal TOTAL $8,526,000 *Cost based on a 2011 price quote to Orem for these improvements Table 8 Alternative #2 Cost Estimates System Component Unit Cost Cost (2014 Dollars) Water Reclamation $1,200,000 Facility Improvements* NA 12 inch pipe $138/foot $286,000 WRF Booster Station #1 $3,650/hp $91,000 Sleepy Ridge GC $608,000 Booster Station and Pond Modifications $3,650/hp TOTAL $2,185,000 *Cost based on a 2011 price quote to Orem for these improvements Operations and Maintenance. Construction of a reuse system will result in additional operation and maintenance costs beyond what would be required for servicing demands from a culinary system alone. BC&A has conducted a number of studies on the cost of operating and maintaining water distribution system. Based on those studies, the average costs of O&M in a culinary only system is approximately $200/connection/year. When a secondary system is added, the average O&M costs for both systems increases to $280/connection/year. Thus, the differential cost of adding a secondary system is about $80/connection/year or about $165/acre-ft/year based on average outdoor water use per connection. It should be emphasized that this is based on O&M costs associated with secondary water sytems providing residential service. As a result, it is probably an accurate representation of the costs of BOWEN COLLINS & ASSOCIATES 13 OREM CITY
126 WRF REUSE EVALUATION serving the Southwest Annex area. Because service to the Golf Course and Sports Complex include few facilities (less potential maintenance), the cost of O&M to these areas will likely be signficantly less. For the purpose of this analysis, the costs of servicing these areas has been estiamated at $60/acre-ft/year, with the majority of this total being associated with power costs for pumping. Based on these estimates, total annual O&M costs are summarized in Table 9. Table 9 Estimated Annual O&M Costs for Reuse Service Service Area Annual Water Use (acre-ft) O&M Cost ($/acre-ft) Total Annual Cost Sleepy Ridge Golf Course/ 516 $60 $31,000 Lakeside Sports Complex Southwest Annex 825 $165 $136,000 Total 1,341 $167,000 Water Purchase Costs. One benefit of reuse water is that it would use water rights already owned by the City. As a result, there would be no purchase costs associated with this water source. Costs Associated With Supplying the Potential Reuse Demand Areas with Culinary Water Costs associated with this alternative have been organized into the same three categories used for the reuse system: capital costs, operation and maintenance costs, and water purchase costs. Capital Costs. As will be detailed in the Orem City Water System Master Plan, there are a significant number of projects needed to the City s culinary water system to convey water from where it is produced (primarily in the northeast corner of the City) to where it is needed in the future (primarily in the southwest corner of the City). Anything that can be done to reduce demand in the southwest of the City will reduce the conveyance requirements and potentially reduce or eliminate improvements in the culinary system. BC&A examined the culinary water system model both with and without outdoor demands associated with potential reuse. Using the model results, we identified how culinary water system improvements could be modified between the two scenarios. Figure 5 shows projected major conveyance system improvements without reuse. Figure 6 shows the same information with resue. For the purpose of this analysis, the capital cost of supplying potential reuse demand areas with culinary water includes the differential cost between the two improvement scenarios. The results of this analysis are summarized in Table 10. BOWEN COLLINS & ASSOCIATES 14 OREM CITY
127 WRF REUSE EVALUATION Table 10 Additional Capital Costs of Supplying Potential Reuse Demand Areas with Culinary Water Cost (2014 Dollars) Alternative #1 Additional Conveyance Improvements $3,252,000 Additional Culinary Storage $1,764,000 Total $5,016,000 Alternative #2 Additional Conveyance Improvements $332,591 Additional Culinary Storage $453,600 Total $786,191 Operations and Maintenance. The only additional operation and maintenance cost of using culinary water is the actual cost of treatment. Orem City costs for treatment from the UVWPP vary significantly depending on a number of factors (source of water being used, time of year, etc.). For the purposes of this analysis, it has been estimated that future treatment of water that could otherwise be satisfied from reuse sources will cost the City approximately $125/acre-ft. Water Purchase Costs. As will be detailed in the Orem City Water System Master Plan, the City has existing water rights that could potentially be used to satisfy projected demands if reuse water is not used. As a result, it is unlikely that the City would need to expend money to purchase additional water rights for this scenario. However, all the City water rights that could potentially be used for satisfying these demands would need to be treated before being used in the culinary water system. Estimating the cost of obtaining additional treatment capacity is difficult because of the City s current relationship with the Utah Valley Water Purification Plant (UVWPP). This plant is owned and operated by Central Utah Water Conservancy District (CUWCD). The City has traditionally been the primary user of water from the plant and has been able to receive all the water it needs. However, CUWCD is currently in the process of completing the Central Water Project. This project will connect several potential additional users to the plant that may complete for capacity with Orem City. The City is currently working to formalize agreements associated with their treatment capacity, but there is still uncertainty regarding how much plant capacity will be available to them in the future. For the purposes of this analysis, it has been assumed that the City will need additional treatment capacity at some point in the future and will be responsible to pay the full cost of its development. This will likely include not only the cost of actual treatment facilities, but also the cost of conveying additional water to and from the point of treatment. Estimating a cost for these types of improvements is difficult because they can vary signficantly depending the location of source and treatment facilities. Based on the cost of developing treatment in other communities, it has been assumed that this will cost somewhere between $300 and $500/acre-ft. It should be emphasized that this is annualized cost for capital improvements associated with capacity. It is not the annual O&M cost of treatment (as discussed in the previous section). BOWEN COLLINS & ASSOCIATES 15 OREM CITY
128 WRF REUSE EVALUATION One final consideration relative to water development costs is the timing of expenditures. Orem City currently has treatment capacity to meet projected needs through approximately As a result, no savings in treatment development costs will be realized for at least the next ten years. Unfortunately, the window of opportunity to develop reuse may be limited, at least relative to reuse in the Southwest Annexation area. If the City does not act now to install the required infrastructure, it will likely be too disruptive and/or expensive to try and add facilities through developed areas later. Comparison of Alternatives A cost comparsion of the alternatives is summarized in Tables 11 and 12. Table 11 compares costs for servicing the Golf Course, Sports Park and Southwest Annex area. Table 12 does the same for the Golf Course and Sports Park only. For the purposes of comparison, all costs have been represented as present value costs. O&M costs include 40 years of system operation. Water purchase/acquisition costs assume that, without the development of reuse water, additional capacity will be needed starting in 10 years. Table 11 Cost Comparison of Supplying Reuse to Golf Course, Sports Park, and Southwest Annex (Alternative #1) Cost Category Reuse Alternative Culinary Alternative Additional Cost/ (or Savings) of Reuse Capital Costs $8,526,000 $5,016,000 $3,510,000 Water Purchase/Acquisition $0 $6,470,000* ($6,470,000) O&M $4,029,000 $4,044,000 ($15,000) Total $12,555,000 $15,530,000 ($2,975,000) *Based on lower end estimate of water development/treatment costs of $300/acre-ft/year. Table 12 Cost Comparison of Supplying Reuse to Golf Course and Sports Park Only (Alternative #2) Cost Category Reuse Alternative Culinary Alternative Additional Cost/ (or Savings) of Reuse Capital Costs $2,185,000 $786,191 $1,398,809 Water Purchase/Acquisition $0 $2,489,000* ($2,489,000) O&M $748,000 $1,556,000 ($808,000) Total $2,933,000 $4,831,191 ($1,898,191) *Based on lower end estimate of water development/treatment costs of $300/acre-ft/year. BOWEN COLLINS & ASSOCIATES 16 OREM CITY
129 WRF REUSE EVALUATION SECTION VI CONCLUSIONS AND RECOMMENDATIONS A number of conclusions can be made from the analysis presented in the previous sections: 1. Overall, reuse appears to be a cost effective alternative to satisfy future water demands. This is true for either a small system that delivers water to only the Sleepy Ridge Golf Course and Lakeside Sports Complex (Alternative #2), or a larger system that also includes secondary service to the Southwest Annex area (Alternative #1). 2. The cost effectiveness of reuse will depend on the cost of securing future treatment capacity. The conclusions of this memorandum are based on an estimated cost of $300/acre-ft for the development of future treated capacity. This represents the lower end of expected future water development costs. If costs are higher, reuse would be more cost advantageous. If costs are lower, reuse would become less cost effective. The break even point where reuse is no longer cost effective based on treatment development costs is $160/acre-ft for Alternative #1 and $70/acre-ft for Alternative #2. 3. The conclusions above are based on the present value cost of reuse over the long run. Unfortunately, most of the costs of reuse are associated with capital costs incurred at the beginning of the planning window, while most of the savings are realized slowly over time. Based on the numbers above, the time required to recover the initial investment is 23 years for Alternative #1 and 17 years for Alternative #2. Payback would be much quicker if development of reuse could be postponed until the City runs out of culinary capacity. However, because of development pressure in the Southwest Annex, the window of opportunity for developing reuse in this area is limited. Based on these conclusions, the following is recommended: 1. Since the results of this analysis are highly dependent on the status of Orem City capacity at the UVWPP, it is recommended that the City continue to pursue a formal agreement regarding capacity at the plant. Once the City better understands their existing capacity and the potential costs associated with future capacity, it can revisit the results of this analysis. 2. Even though it is recommended that the City pursue formalization of future capacity development costs, it seems very unlikely these costs will be less than the break even cost of $160/acre-ft. Thus, it is recommended that the City pursue development of reuse. 3. As a first step, it is recommended that the City consider requiring installation of secondary water facilities as part of development in the Southwest Annex. If the City decides to use reuse water in the Southwest Annex, development of the system will need to begin immediately while the area is still relatively undeveloped. 4. It is recommended that the City develop facilties for reuse on the Sleepy Ridge Golf Course and Lakeside Sports Complex. This is necessary to help the City postpone some costly culinary system improvements. It will also help the City develop some experience with reuse water which will facilitate further development of this resource. BOWEN COLLINS & ASSOCIATES 17 OREM CITY
130 WRF REUSE EVALUATION 5. It is recommended that the City pursue discussions with Vineyard or other potential reuse water customers to increase the amount of reuse water that can be used to offset culinary water demands. BOWEN COLLINS & ASSOCIATES 18 OREM CITY


131
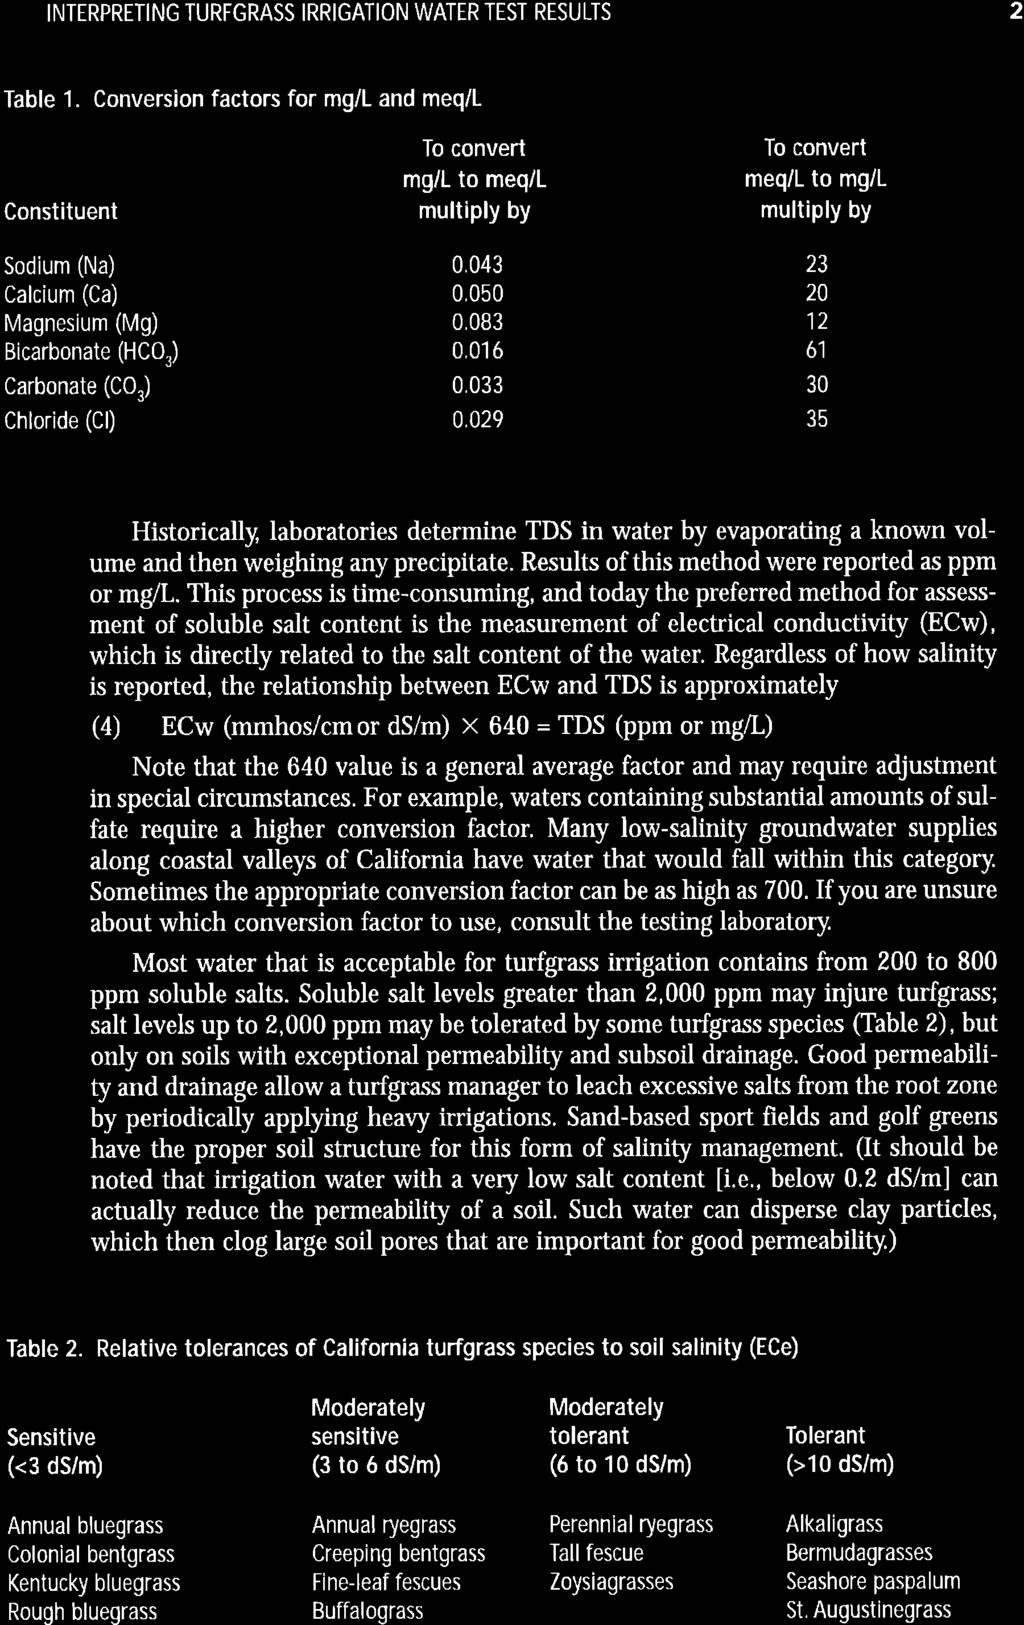
132
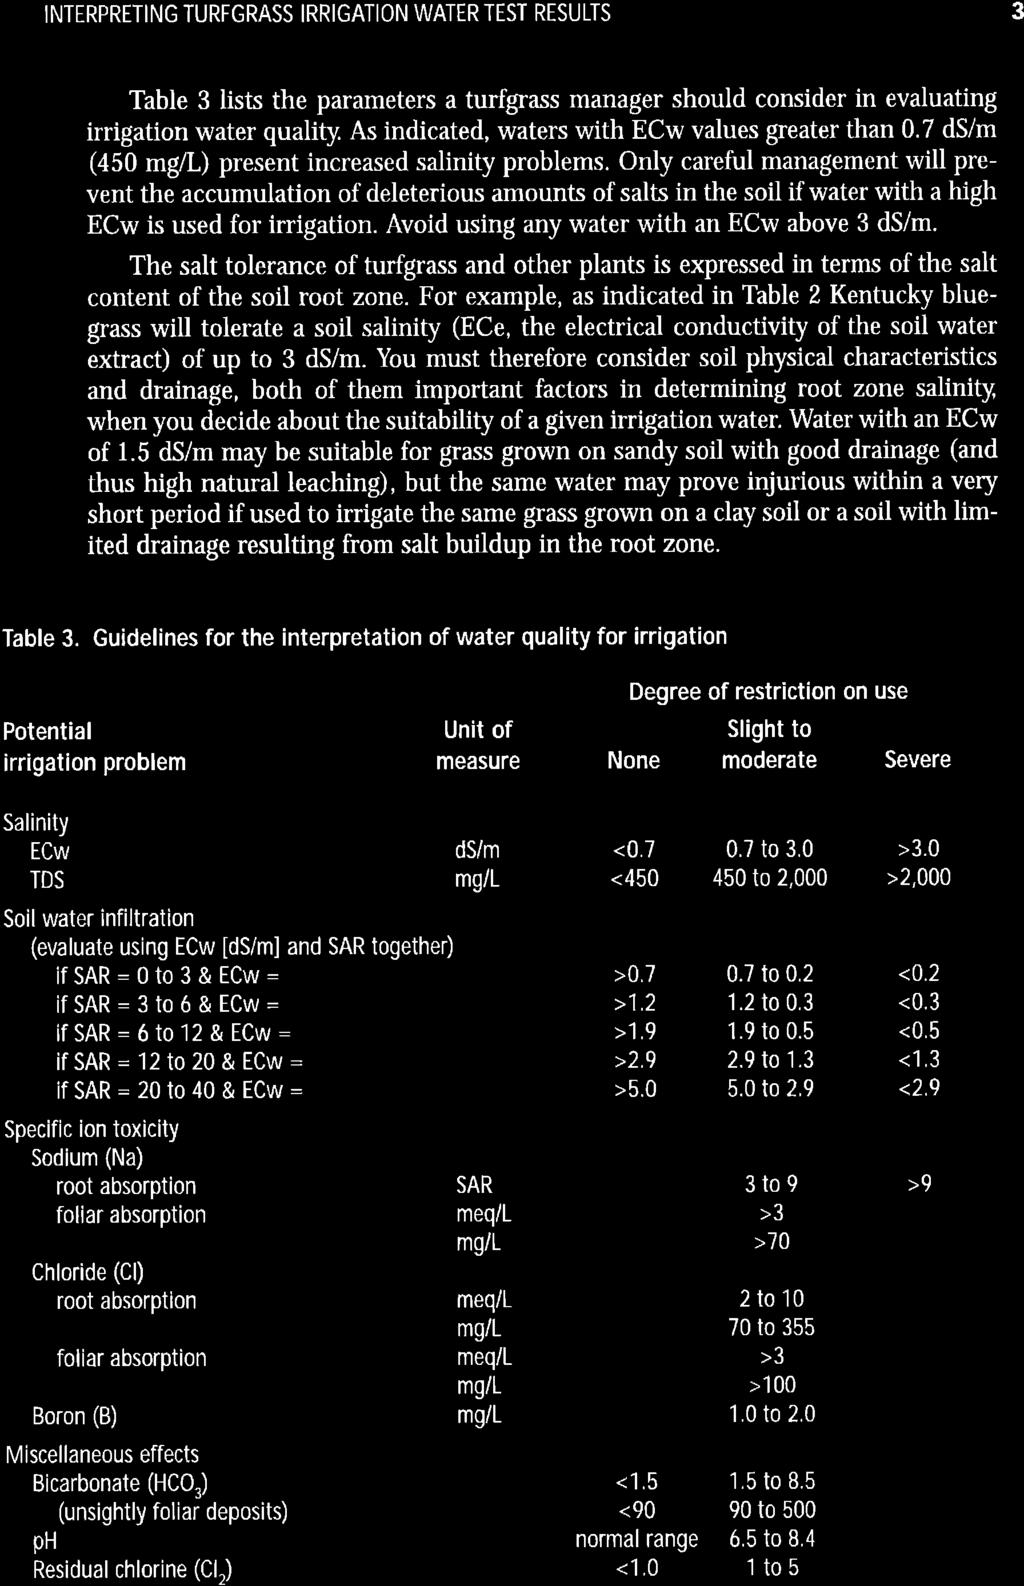
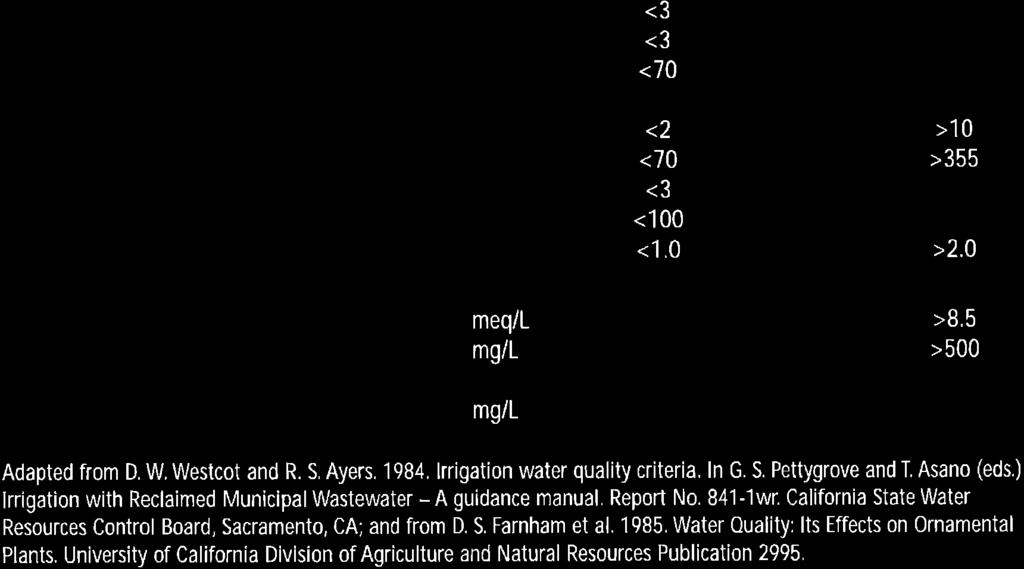
133

134

135

136

137

138

139
140 APPENDIX D WATER MODEL HISTORY

141 WATER MODEL HISTORY MODEL NOTES History Physical Components - The model was originally developed from the City s GIS data by JUB Engineers. The junctions, pipes, pumps, sources, tanks, were setup in the hydraulic model primarily by JUB, but with the aid of Orem City personnel. The model was developed as an extended period simulation with controls used to turn wells off and on based on tank elevations. See These controls were left in the model, but were disabled for most of the steady-state scenarios developed as part of the water master plan so that pumps remained off. This was done for a few reasons: 1. Ease of Use. City personnel would like to use the model on a continuing basis. While it is possible to learn how extended period simulation (EPS) function, it requires a lot of experience to know how to modify the model and work with the model once running as an EPS. The primary use of the model will be to identify low system pressures and fire flow results for operation personnel. Steady state models are much simpler to use and modify. 2. Simplicity. EPS models cannot be calibrated for buildout conditions. The steady state model therefore provides required results without added complexity. 3. Calibration. EPS models require a great deal of data to be calibrated correctly and operators often adjust how the system operates such than EPS would have difficulty keeping up with operator modifications. The model was therefore calibrated as a steady state model to provide required results while keeping it simple for operator use Updates BOWEN COLLINS & ASSOCIATES 1 OREM CITY
142 WATER MODEL HISTORY Physical Components - As part of the 2014 master plan, few modifications were made to the physical model. Well #9 was added to the model using data provided by Orem City personnel. A flow control valve was also added in association with this well. Demand Allocation The original model developed by JUB Engineers used a land use approach for distributing demands. This approach is adequate when no other data is available. However, to facilitate a higher level of system calibration, BC&A followed the following steps to input existing demands into the hydraulic model. 1. Identified Peak Day Demand Production BC&A used historic flow records from the City s treatment plant and wells to estimate the peak day of production for the City. For the period of record (approximately 5-years of historic records), June 25 th, 2012 was the highest peak day demand. Peak Day Production was equal to 61.5 mgd for June 28 th, Identified sales and useage data a. Unbilled records were assembled for all of This included data from park strips, parks, and other City facilities. The majority of demand in this category includes City parks. Demands are only tracked on an annual basis. i. Developed a seasonal peaking factor for the City to approximate what the seasonal peaking factor would be for park irrigation demands. Irrigation Peaking Factor = Peak Day Demand / Average Demand During Irrigation Season = The estimated peak day demand from City parks, etc was approximately 3.8 mgd. b. Orem City assembled July 2013 billing records in the City. i. These demands were assigned to each meter record in the City s GIS. Using this approach, BC&A was able to distribute approximately 90% of billed demands to the correct geospatial location in the City. ii. Because total water use sales is usually less than recorded production because of meter inaccuracies & system leakage, billed demands were then adjusted to match the overall water production record for the City. For peak day demand, this was equal to 61.7 mgd (the total peak day production) 3.8 mgd (the peak day demand at parks) = 57.9 mgd. iii. In the database editor, see BOWEN COLLINS & ASSOCIATES 2 OREM CITY
 Demand Patterns The demand pattern for all junctions in the City is primarily based off the diurnal pattern observed for flow meter records from the Reach II Transmission Line.")
 Peaking Factor 0 1.65 1 1.669 2 1.")
143 WATER MODEL HISTORY Demand 1 - Metered demands are listed under Demand 1 Demand 2 Park demands are listed under Demand 2 Demand 3 Future Demands or growth in demands (zero for existing scenarios) Demand Patterns The demand pattern for all junctions in the City is primarily based off the diurnal pattern observed for flow meter records from the Reach II Transmission Line. Demand or useage fluctuations for several locations in the City were collected for the peak week of demand (June 22, 2012 June 28, 2012). This data was then used to estimate a representative pattern for the entire City as shown in the table below. Reach II Demand Pattern Time (from start) Peaking Factor BOWEN COLLINS & ASSOCIATES 3 OREM CITY
144 WATER MODEL HISTORY Time (from start) Peaking Factor This demand pattern is important to understand because the demand patterns in the model are based off the peak factor developed from the Reach II transmission line. SCENARIO EXPLORER Data Sets The scenario explorer as seen below has a number of different data sets in it. The Demand Set category includes different demands for each scenario that apply different peaking factors among the different sets. BOWEN COLLINS & ASSOCIATES 4 OREM CITY

145 WATER MODEL HISTORY Peak Day Demand In general, peak day demand conditions apply a peaking factor of 1.0 to demands in the model. This is because we only want to simulate average daily demands on the peak day of demand. This is the required condition used for fire flow simulations. Peak Hour Demand Peak hour demands apply a peaking factor of 1.8 to demands in the model because this is the peak demand observed around 5 A.M. in the Reach II diurnal pattern. Vineyard Demands in Vineyard have been assumed to be constant under both peak day and peak hour demand conditions. This assumes that Vineyard will have storage facilities internal to their City or that they will fund any storage facilities required in Orem City. Data Sets Data sets in the different scenarios keep track of changes between scenarios. For example, under existing conditions, the BASE pipe set includes all existing pipe diameters in the City s GIS. However, the buildout condition scenarios use a buildout pipe set that may have larger diameters compared to existing conditions. This is to simulate the effect of improvements made to City distribution system as needed to alleviate pressure deficiencies. Facility Sets In addition to the data sets in the Scenario Explorer, there is also a tab called Facility that helps define what active elements are in the model for different scenarios. See below. BOWEN COLLINS & ASSOCIATES 5 OREM CITY


146 WATER MODEL HISTORY The scenarios in the hydraulic model have query sets for the different scenarios that help define what elements of the model are active under existing and future conditions. For example the Southwest Annexation area includes a large number of pipes that are included as part of the future model, but are not active in the existing model. This is controlled using a query like the following: For existing conditions, if the installation year for a pipe is 2014 or older, the pipe is active. If the Install year for the pipe is 2020 or greater, then the pipe does not exist in the existing model. This is important to understand as the model is edited in the future. An install year should be assigned to all pipes so that they turn on or off as appropriate for each scenario in the model. If a pipe is not assigned an installation year, the assumed year of installation is 0 years so that it will be active in both existing and future scenarios. BOWEN COLLINS & ASSOCIATES 6 OREM CITY
4. UTILITIES ELEMENT.
 4. UTILITIES ELEMENT. The purpose of this element is to provide for necessary public facilities and services correlated to future land use projections and population demand. Utilities Sub-Elements (A)
PREPARED FOR: PLATTEVIEW ROAD CORRIDOR STUDY EXECUTIVE SUMMARY
 PREPARED FOR: PLATTEVIEW ROAD CORRIDOR STUDY EXECUTIVE SUMMARY SEPTEMBER 2016 Introduction The Platteview Road Corridor Study was led by the Metropolitan Area Planning Agency (MAPA) with assistance from
U.S. Fire Department Profile 2015
 U.S. Fire Department Profile 2015 April 2017 Hylton J.G. Haynes Gary P. Stein April 2017 National Fire Protection Association Abstract NFPA estimates there were approximately 1,160,450 firefighters in
I. INTRODUCTION. identify long-term capital improvements and rehabilitation measures for the existing drainage system;
 I. INTRODUCTION The Town of Windsor, Colorado is presently experiencing rapid growth and development within the boundaries of several of its major drainage basins. As growth continues within these basins,
2.6 Pawtucket. Pawtucket Impervious Cover Map (61.4% Impervious)
") 2.6 Pawtucket Pawtucket Impervious Cover Map (61.4% Impervious) The City of Pawtucket is approximately 8.7 square miles and is heavily residential with some commercial and industrial land. Table 2.14 below
2.6 Pawtucket Pawtucket Impervious Cover Map (61.4% Impervious) The City of Pawtucket is approximately 8.7 square miles and is heavily residential with some commercial and industrial land. Table 2.14 below
Chapter 4 - Preparation of Stormwater Site Plans
 Chapter 4 - Preparation of Stormwater Site Plans The Stormwater Site Plan is the comprehensive report containing all of the technical information and analysis necessary for the City to evaluate a proposed
Potential Outdoor Water Savings of Los Angeles Abstract Introduction
 Potential Outdoor Water Savings of Los Angeles Tsukiko Jerger, Nicole Puma, Andrew Tom, Nargis Walai Section A02 Abstract In Southern California, water is in short supply and in high demand. This is sharply
COLVER ROAD INDUSTRIAL CONCEPT PLAN
 COLVER ROAD INDUSTRIAL CONCEPT PLAN A CONCEPTUAL LAND USE AND TRANSPORTATION PLAN FOR TA-4 AN URBAN RESERVE AREA OF THE CITY TALENT City of Talent Adopted by City Council Resolution No., June, 2015 PART
Table of Contents G.1.a Water Resources - Surface Water - Drainage
 Table of Contents G.1.a Water Resources - Surface Water - Drainage 1. INTRODUCTION... 1335 2. ENVIRONMENTAL SETTING... 1335 a. Regional Hydrology... 1335 b. Local Hydrology... 1337 c. On-site Hydrology...
CHECKLIST FOR PHASE II DRAINAGE REPORT
 I. COVER SHEET CHECKLIST FOR PHASE II DRAINAGE REPORT A. Name of Project B. Address C. Owner D. Developer E. Engineer F. Submittal date and revision dates as applicable II. GENERAL LOCATION AND DESCRIPTION
5.8 PUBLIC SERVICES FIRE PROTECTION AND EMERGENCY SERVICES
 5.8 PUBLIC SERVICES FIRE PROTECTION AND EMERGENCY SERVICES 5.8.1 INTRODUCTION This section assesses the proposed projects potential impacts on fire protection services. Information for the following analysis
REGION-WIDE BUILDOUT IMPACT ANALYSIS
 REGION-WIDE BUILDOUT IMPACT ANALYSIS Nashua Regional Planning Commission Nashua Regional Planning Commission October 24, 2005 2 Nashua Regional Planning Commission REGION-WIDE BUILDOUT IMPACT ANALYSIS
Exhibit A Comprehensive Plan Amendments
 Exhibit A Comprehensive Plan Amendments May 2010 Draft Chapter One - Introduction Chapter One INTRODUCTION NOTE: For brevity and ease in viewing the proposed changes, portions of chapter one that are not
East Corridor Final Environmental Impact Statement
 East Corridor Final Environmental Impact Statement Alternatives Considered Operating Plan The requirements for opening day operations versus year 2030 are based on ridership and operations. Opening day
NEORSD Green Infrastructure Grant (GIG) Program Opening Remarks
 Program Opening Remarks") NEORSD Green Infrastructure Grant (GIG) Program Opening Remarks 2019 NEORSD GIG Eligibility and Technical Requirements Project must be located in the Sewer District s combined sewer area Location Applicant
NEORSD Green Infrastructure Grant (GIG) Program Opening Remarks 2019 NEORSD GIG Eligibility and Technical Requirements Project must be located in the Sewer District s combined sewer area Location Applicant
Land Use Amendment in Southwood (Ward 11) at and Elbow Drive SW, LOC
 at and Elbow Drive SW, LOC") 2018 November 15 Page 1 of 10 EXECUTIVE SUMMARY This land use amendment application was submitted by Rick Balbi Architect on 2017 August 31 on behalf of Sable Developments Ltd, and with authorization from
2018 November 15 Page 1 of 10 EXECUTIVE SUMMARY This land use amendment application was submitted by Rick Balbi Architect on 2017 August 31 on behalf of Sable Developments Ltd, and with authorization from
HEALTH SCIENCES BUILDING REDEVELOPMENT PROJECT
 INTRODUCTION In recent years, the University of Cincinnati (University) has demonstrated a commitment to identifying and implementing sustainable goals and objectives throughout University s Uptown Campuses.
Table of Contents SASD SEWER SYSTEM CAPACITY PLAN 2010 UPDATE EXECUTIVE SUMMARY
 SASD SEWER SYSTEM CAPACITY PLAN 2010 UPDATE EXECUTIVE SUMMARY Table of Contents 1. Objectives and Scope...1 2. Land Use Update...1 Study Area...1 Planning Updates...2 Land Use Map and Projections...2 3.
South Bismarck Watershed Model Update and Stormwater Improvement Project
 Preliminary Engineering Report Bismarck Tribune South Bismarck Watershed Model Update and Stormwater Improvement Project City of Bismarck, ND January 2017 14.105.0046 1.0 Executive Summary The focus of
CITY OF COLWICH COMPREHENSIVE PLAN LAND USE LAND USE 1
 LAND USE LAND USE 1 WHAT YOU WILL FIND IN THIS CHAPTER: Discussion of today s conditions and tomorrow s projections Discussion of challenges and opportunities Discussion of the environmental quality goals,
SECTION ONE: INTRODUCTION. introduction
 introduction 1 INTRODUCTION Since it was first established in 1843 as a trading post for the Hudson s Bay Company, Victoria has evolved into a Provincial capital city that is recognized across Canada and
Chapter 10 IMPLEMENTATION RECOMMENDATIONS
 Chapter 10 IMPLEMENTATION RECOMMENDATIONS The recommended land use plan presented in the previous chapter provides a design for the attainment of the urban and rural development and open space preservation
Appendix E Preliminary Location Hydraulic Study
 Appendix E Prepared for: State of Alaska Department of Transportation and Public Facilities Prepared by: HDR Alaska, Inc. 2525 C Street, Suite 305 Anchorage, Alaska 99503 February 2014 This page intentionally
South Davis County COMMUNITY SPOTLIGHT
 South Davis County COMMUNITY SPOTLIGHT Davis/SLC Community Connector Bus Rapid Transit line connecting SLC & Davis County RTP Phase 1 Project Generate 3,100 average weekday riders Relieve congestion on
Planning Commission Staff Report Project Plan Approval Hearing Date: June 14, 2017
 Planning Commission Staff Report Project Plan Approval Hearing Date: June 14, 2017 ITEM 3 Peter Matson requests Project Plan Approval for an 80-acre mixed-use plan that includes 220 residential units and
October 7, City of Thornton 9500 Civic Center Drive Thornton, CO (303) RE: Maverik Thornton, CO - Drainage Report
 RE: Maverik Thornton, CO - Drainage Report") October 7, 2016 City of Thornton 9500 Civic Center Drive Thornton, CO 80229 (303) 538-7295 RE: Maverik Thornton, CO - Drainage Report As per your request, we are submitting to you the drainage report and
October 7, 2016 City of Thornton 9500 Civic Center Drive Thornton, CO 80229 (303) 538-7295 RE: Maverik Thornton, CO - Drainage Report As per your request, we are submitting to you the drainage report and
STORMWATER FACILITIES OPERATION AND MAINTENANCE PLAN. Example Commercial Project. February 21, 2018
 STORMWATER FACILITIES OPERATION AND MAINTENANCE PLAN for Example Commercial Project February 21, 2018 XYZ Corporation Jane Jones, 925-555-1212 This example prepared by Dan Cloak Environmental Consulting
495/MetroWest Development Compact Plan Citizen Planner Training Collaborative Conference. March 17, 2012
 495/MetroWest Development Compact Plan Citizen Planner Training Collaborative Conference March 17, 2012 Project Process Local and Regional Priority Areas Growth Scenarios Transportation Investment Categories
LU Encourage schools, institutions, and other community facilities that serve rural residents to locate in neighboring cities and towns.
 Application No. 891627: Comprehensive Plan Text Amendment - Rural School Policies - Amend policies consistent with State Legislation allowing schools in the rural area and extension of sewer service to
EXHIBIT A. Tax Increment Reinvestment Zone No. 1 (Town Center) First Amended Project Plan 1
 First Amended Project Plan 1") EXHIBIT A Tax Increment Reinvestment Zone No. 1 (Town Center) First Amended Project Plan 1 1 As amended by Resolution No. 2008-02-001(TR1R) of the Tax Increment Reinvestment Zone No.1, and approved to
EXHIBIT A Tax Increment Reinvestment Zone No. 1 (Town Center) First Amended Project Plan 1 1 As amended by Resolution No. 2008-02-001(TR1R) of the Tax Increment Reinvestment Zone No.1, and approved to
USF System Campus Master Plan Updates Goals, Objectives and Policies
 2015-2025 USF System Campus Master Plan Updates Goals, Objectives and Policies Tampa Goals, Objectives, and Policies Table of Contents Executive Summary 2015 2025 USF Campus Master Plan Update Introduction
STORM WATER UTILITY FREQUENTLY ASKED QUESTIONS
 STORM WATER UTILITY FREQUENTLY ASKED QUESTIONS In 2007, the City Council adopted Ordinance No. 1155 establishing a storm water utility in the City. No fee structure was adopted at that time. The idea of
Cumberland Comprehensive Plan Town Council adopted August 2003, State adopted June 2004 TABLE OF CONTENTS
 TABLE OF CONTENTS I. Executive Summary A. Scope of the Comprehensive Plan I-2 B. Plan Development Process I-3 C. Plan Format I-3 D. Acknowledgements I-4 II. Demographic Analysis A. Introduction II-1 B.
Draft Rhode Island Stormwater Design and Installation Standards Manual
 Draft Rhode Island Stormwater Design and Installation Standards Manual Summary The May 2009 Public Review Draft version of the RI Stormwater Design and Installation Standards Manual consists of approximately
Alternative Crop Suitability Methodology
 Alternative Crop Suitability Methodology The Alternative Agriculture in Missouri Hub on Community Commons includes model-based ratings of natural suitability for selected alternative crops. These ratings
Chapter 5. Editor. Ted W. van der Gulik, P.Eng. Senior Engineer. Authors. Stephanie Tam, P.Eng. Water Management Engineer
 B.C. SPRINKLER IRRIGATION MANUAL Chapter 5 Editor Ted W. van der Gulik, P.Eng. Senior Engineer Authors Stephanie Tam, P.Eng. Water Management Engineer Andrew Petersen, P.Ag. Regional Resource Specialist
Outflow to Saw Mill Run
 Dormont Stormwater Fee Frequently Asked Questions What is stormwater, and why is it a problem in Dormont? Stormwater is runoff from rain or snow that falls and flows to Little Saw Mill Run or McNeilly
City of Norfolk Coastal Flood Mitigation Program. March 13, 2013
 City of Norfolk Coastal Flood Mitigation Program March 13, 2013 Topics Brief overview of Norfolk s Coastal Flood Program Data-driven analysis and decision making City-wide vulnerability, project concepts,
Applicant Name Phone / Fax / Address City State Zip Code . Property Owner Phone / Fax / Address City State Zip Code
 Master Development Plan Application Community Development Department City of Redmond 411 SW 9 th Street Redmond, Oregon 97756 541-923-7721 541-548-0706 FAX Master Development Plan Fee $38,862.52 File Number
FY Capital Improvement Program Arroyo Projects
 FY 219-223 Capital Improvement Program FY 218 FY 219 FY 22 FY 221 FY 222 FY 223 1 2 3 4 5 6 7 8 9 1 Hahamongna - Implement Master Plan - Oak Grove Area Improvements (7756) Hahamongna - Implement Master
Appendix G Response to Comments
 Appendix G Response to Comments This appendix contains the comments received during the public circulation and comment period (May 27, 2008 to July 11, 2008). The comments have been numbered (Comment Set
U.S. FIRE DEPARTMENT PROFILE THROUGH 2009
 U.S. FIRE DEPARTMENT PROFILE THROUGH 2009 Michael J. Karter, Jr. Gary P. Stein October 2010 National Fire Protection Association Fire Analysis and Research Division U.S. FIRE DEPARTMENT PROFILE THROUGH
Appendix F PENNSYLVANIA LOCAL PARKS AND THE COMMUNITIES THEY SERVE
 Appendix F PENNSYLVANIA LOCAL PARKS AND THE COMMUNITIES THEY SERVE August 8, 2014 By The Center for Rural Pennsylvania Profile Data Profiles and Analysis Introduction To assist in the development of the
Ten Mile Creek Planning Area
 PLANNING AREA POLICIES TEN MILE CREEK Ten Mile Creek Planning Area Location and Context The Ten Mile Creek Planning Area ( Ten Mile Creek area ) is located south of the current Boise AOCI, generally south
CHAPTER 1 Introduction
 CHAPTER 1 Introduction From sea to summit, Lane County covers almost 4,800 square miles of diverse Oregon landscape. Stretching from the Pacific Ocean through the Coastal Range, the Willamette Valley to
USA Addition of South & East Side Residential Parcels. USA Deletion of a Town of Christiana Parcel. Conversion from USA to Limited Service Area
 Village of Rockdale Village of Rockdale 148 Water Street Cambridge, WI 53523 Phone 608.423.1497 Fax 608.423.9694 Urban Service Area (USA) Amendment USA Addition of South & East Side Residential Parcels
Natomas Joint Vision Open Space Plan
 Natomas Joint Vision Open Space Plan First Workshop series The City of Sacramento The County of Sacramento LAFCo ERA Economic Research Associates EIP Associates a Division of PBS & J Natomas Joint Vision
MEMORANDUM. September 10, 2018
 September 10, 2018 MEMORANDUM TO: Chad Bird, City of Decorah FROM: Larry Weber and Dan Gilles, Iowa Flood Center, IIHR Hydroscience & Engineering COPY TO: Dana Werner, St. Paul District Corps of Engineers,
STORMWATER REPORT FOR WALMART SUPERCENTER STORE # SIOUX FALLS, LINCOLN COUNTY, SOUTH DAKOTA BFA PROJECT NO
 STORMWATER REPORT FOR WALMART SUPERCENTER STORE # 2443-00 SIOUX FALLS, LINCOLN COUNTY, SOUTH DAKOTA BFA PROJECT NO. 3286 March 1, 2012 I hereby certify that this engineering document was prepared by me
Presentation Item C Annotated Model Outline for a Framework for a Green Infrastructure Plan
 Date: August 17, 2016 To: From: Subject: Management Committee Dan Cloak, Consultant Presentation Item C Annotated Model Outline for a Framework for a Green Infrastructure Plan Recommendation: Receive the
[TEMPLATE FOR] STORMWATER FACILITIES OPERATION AND MAINTENANCE PLAN. [date] [revision date]
![[TEMPLATE FOR] STORMWATER FACILITIES OPERATION AND MAINTENANCE PLAN. [date] [revision date]](/thumbs/90/103282929.jpg "[TEMPLATE FOR] STORMWATER FACILITIES OPERATION AND MAINTENANCE PLAN. [date] [revision date]") Instructions to preparer: This template provides instructions, format, organization, and some recommended content for your O&M Plan. Instructions and notes in yellow highlight should be deleted prior to
Instructions to preparer: This template provides instructions, format, organization, and some recommended content for your O&M Plan. Instructions and notes in yellow highlight should be deleted prior to
CITY COUNCIL AGENDA REPORT
 CITY COUNCIL AGENDA REPORT Subject: DESIGNATED FLOOD LINE CARROT CREEK Recommendation(s) That Administration bring forward a Land Use Bylaw amendment in October 2014 establishing the Designated Flood Line
STORM WATER MANAGEMENT SYSTEMS
 STORM WATER MANAGEMENT SYSTEMS MichiganReportCard.com 38 GRADE D+ STORM WATER MANAGEMENT SYSTEMS OVERVIEW Michigan s storm water management system provides flood protection, makes development possible,
Presentation Outline. Southwest Area Plan. Slide 1. Slide 2. Presentation to the Committee of the Whole. September 20, 2011
 Slide 1 Southwest Area Plan Presentation to the Committee of the Whole September 20, 2011 Slide 2 Presentation Outline City-Wide Growth Planning Link Official Plan Policies Current Situation and Projections
MEMORANDUM AGENDA ITEM #6c
 South Florida Regional Planning Council MEMORANDUM AGENDA ITEM #6c DATE: FEBRUARY 1, 2010 TO: FROM: SUBJECT: COUNCIL MEMBERS STAFF CITY OF PARKLAND PROPOSED COMPREHENSIVE PLAN AMENDMENT (ALTERNATIVE REVIEW)
GIS-Enabled Rain Garden Design: A Case Study in Austin, Texas. GIS in Water Resources (C E 394K-3) Clint Smith, E.I.T.
 Clint Smith, E.I.T.") GIS-Enabled Rain Garden Design: A Case Study in Austin, Texas GIS in Water Resources (C E 394K-3), E.I.T., MSCE 12/07/2018 Table of Contents: 1. Abstract 3 2. Introduction 4 2.1 Background 4 2.2 Project
GIS-Enabled Rain Garden Design: A Case Study in Austin, Texas GIS in Water Resources (C E 394K-3), E.I.T., MSCE 12/07/2018 Table of Contents: 1. Abstract 3 2. Introduction 4 2.1 Background 4 2.2 Project
City of Grande Prairie Development Services Department
 City of Grande Prairie Development Services Department ROYAL OAKS NORTH OUTLINE PLAN OP-07-03 NW 35-71-6 W6M May 7, 2007 Royal Oaks North Outline Plan TABLE OF CONTENTS 1.0 INTRODUCTION........ 3 1.1 Purpose
Town of Vershire Road Erosion Inventory Report
 Town of Vershire Road Erosion Inventory Report Taylor Valley Road. Photo taken by TRORC staff. Prepared by: 128 King Farm Road Woodstock, VT 05091 Inventory and report funded by the Vermont Agency of Transportation
Stormwater Fee Credit Manual
 NORTHEAST OHIO REGIONAL SEWER DISTRICT Stormwater Fee Credit Manual June 30, 2010 NEORSD Stormwater Fee Credit Manual June 30, 2010 Table of Contents I. Introduction 1 What is a Stormwater Fee? 2 What
TENNESSEE GAS PIPELINE COMPANY, L.L.C.
 TENNESSEE GAS PIPELINE COMPANY, L.L.C. HYDROLOGIC AND HYDRAULIC CALCULATIONS FOR ACCESS ROADS ALONG THE CONNECTICUT PIPELINE EXPANSION PROJECT CONNECTICUT LOOP Submitted by: Tennessee Gas Pipeline Company,
S o u t h C e n t r a l O u t l i n e P l a n. Leduc Business Park. North Leduc Industrial Area Structure Plan C it y of Led u c.
 Leduc Business Park North Leduc Industrial Area Structure Plan C it y of Led u c Prepared for Farm Air Properties Inc. January, 2007 Table of Contents Page Number 1.0 Purpose of Plan and Definition of
TABLE OF CONTENTS. Transportation Chapter 1 - Introduction and Purpose of Planning to 1-3. Utilities
 Chapter 1 - Introduction and Purpose of Planning... 1-1 to 1-3 Pennsylvania Municipalities Planning Code (Act 247)...1-1 Previous County Planning Activities...1-1 Objectives of the Plan...1-2 Elements
City of Elmhurst. City of Elmhurst. Storm Sewer System Workshop November 22, 2010
 City of Elmhurst City of Elmhurst Storm Sewer System Workshop November 22, 2010 1 City of Elmhurst Watershed divide (green dashed line) through Elmhurst Area east of divide drains to Addison Creek Area
SECTION 1 Introduction...1. SECTION 2 Regional Context Criteria for Planning Districts Description of Planning District...
 Table of Contents SECTION 1 Introduction...1 SECTION 2 Regional Context...2 2.1 - Criteria for Planning Districts...2 2.2 - Description of Planning District...2 SECTION 3 Goals & Objectives...5 SECTION
FIRE DEPARTMENT FIRE CHIEF. Deputy Fire Chief Operations Section. Assistant Fire Chief Planning & Budget Section
 FIRE DEPARTMENT FIRE CHIEF Deputy Fire Chief Operations Section Battalion Chiefs A-1, A-2, B-1, B-2, C-1, C-2 Risk Management Supervisor Training Group Support Staff Supervisor Assistant Fire Chief Logistics
3. Are there any projects exempt from the definition of Regulated Projects?
 STORMWATER REQUIREMENTS: OVERVIEW OF PROVISION C.3 Background: On October 14, 2009, the Regional Water Quality Control Board, San Francisco Bay Region, issued a municipal regional stormwater permit (MRP)
CHAPTER 2 SUMMARY 1. PROJECT SUMMARY DATA
 CHAPTER 2 SUMMARY This is an Initial Study format used to determine, pursuant to CEQA Guidelines Section 15177, whether a project 1) is within the scope of a Master EIR (MEIR), 2) may result in additional
Village of Forest Park. July 27, Sewer Separation Evaluation
 Village of Forest Park July 27, 2015 Sewer Separation Evaluation Presentation Overview Study Background Historic Nature of Forest Park Drainage Scale of Flooding Problem Forest Park Sewer System Background
7.0 OPEN SPACE 7.1 OPEN SPACE DEDICATION CHAPTER 7: OPEN SPACE
 7.0 OPEN SPACE The intent of these requirements is to allow for the usage of centrally located unencumbered land as neighborhood open spaces and not to permit the use of leftover or otherwise unusable
Three Rivers Park District Administration Center Rain Garden
 Three Rivers Park District Administration Center Rain Garden Introduction There are significant changes to the hydrologic regime and nutrient loading following urban and industrial development. The post-development
Development and Design of Cost-Effective, Real-Time Implementable Sediment and Contaminant Release Controls
 Development and Design of Cost-Effective, Real-Time Implementable Sediment and Contaminant Release Controls Richard Warner, Ph.D. Biosystems and Agricultural Engineering Department University of Kentucky
Joint Study Session of the Sutter County. March 2, 2009
 Joint Study Session of the Sutter County Board of Supervisors and Planning Commission March 2, 2009 CURRENT APPLICATION General Plan Amendment Specific Plan Specific Plan Appendices Utility Plans Transit/AQ
Glenborough at Easton Land Use Master Plan
 Implementation 114 9.0 IMPLEMENTATION 9.1 OVERVIEW This chapter summarizes the administrative procedures necessary to implement the proposed land use plan, infrastructure improvements, development standards,
City of Yorba Linda Memorandum
 City of Yorba Linda Memorandum Date: June 15, 2011 Date: To: From: Honorable Chairman and Members of the Parks and Recreation Commission Mike Kudron, Acting Director of Parks and Recreation SUBJECT: BACKGROUND
E X E CU T IV E SUMMARY: OUR FUTURE. Recreation & Conservation Choices for Northern Colorado
 E X E CU T IV E SUMMARY: OUR LANDS OUR FUTURE Recreation & Conservation Choices for Northern Colorado Cover images (clockwise from top): photo by David Coulson; photo by Harry Strharsky; photo by Walt
Roof Runoff Harvesting Benefits for Regional Conditions in Low Density and Medium Density Residential Areas. Leila Talebi 1 and Robert Pitt 2
 Roof Runoff Harvesting Benefits for Regional Conditions in Low Density and Medium Density Residential Areas Leila Talebi 1 and Robert Pitt 2 1Graduate Student, Department of Civil, Construction, and Environmental
BUILDER LOTS FOR SALE
 BUILDER LOTS FOR SALE NORTHERN CULPEPER - 135 ACRES RESIDENTIAL DEVELOPMENT 1256 Old Bridge Road, Amissville, VA 20106 SALE PRICE: $995,000 LOT SIZE: 135+ Acres APN #: Tax Map 2 Parcel 23 ZONING: R-1 ACCESS:
GENERAL PLAN UPDATE ISSUES MEETING. January 21, 2010 City Hall Mitchell Room 6:00 pm 9:00 pm
 GENERAL PLAN UPDATE ISSUES MEETING January 21, 2010 City Hall Mitchell Room 6:00 pm 9:00 pm WELCOME! Introductory Comments Continued Review of Quality of Life Standards, Growth Management, Proposition
Figure 1 Cypress Street Study Area Location Map
 July 20, 2016 TO: FROM: Jim Massarelli Director of Engineering Jeff Julkowski, PE Michael Burke, PE SUBJECT: Cypress Street Study Area Stormwater Analysis (CBBEL Project No. 16-0058) At the request of
Illustration of Eastlake Farmer s Cooperative Grain Elevator. Chapter 5: implementation 5-1
 Illustration of Eastlake Farmer s Cooperative Grain Elevator Chapter 5: implementation 5-1 chapter 5: implementation Introduction The Eastlake Subarea Plan includes a wide range of recommendations intended
The Corporation of Delta. COUNC~L REPORT Regular Meeting. Burnsview Secondary School/Chalmers Park Memorandum of Understanding
 The Corporation of Delta COUNC~L REPORT Regular Meeting Fa 13 To: Mayor and Council File No.: 14035-20/ChaP From: Parks, Recreation & Culture Department Date: June 19, 2015 Burnsview Secondary School/Chalmers
GREATER NEW HAVEN WPCA. GREEN REDEVELOPMENT REDUCES CSOs IN NEW HAVEN. Tom Sgroi, P.E. Director of Engineering, GNHWPCA
 1 GREATER NEW HAVEN WPCA GREEN REDEVELOPMENT REDUCES CSOs IN NEW HAVEN Tom Sgroi, P.E. Director of Engineering, GNHWPCA Bruce Kirkland, P.E. Senior Engineer, GNHWPCA 2 1975 GREEN INFRASTRUCTURE BACKGROUND
STORMWATER UTILITY FREQUENTLY ASKED QUESTIONS
 STORMWATER UTILITY FREQUENTLY ASKED QUESTIONS What is Stormwater? Stormwater is water that falls to the ground during a precipitation event. When land is undeveloped or covered with vegetative surface,
Huntington Stormwater Utility
 Huntington Stormwater Utility Stormwater Management & Sediment and Erosion Control Requirements for Construction Sites Authorized by Huntington City Code Articles: 971, 970, 930, 935, 955, Revised April
March 30, 2017
 March 30, 2017 2 municipal examples of GI installments: Lancaster, PA (population: 60,000) Dover, NH (population 31,000) The City of Lancaster: Overview Incorporated in 1742 as a borough and in 1818
Evaluating Low Impact Development Practices for Stormwater Management on an Industrial Site in Mississippi
 Evaluating Low Impact Development Practices for Stormwater Management on an Industrial Site in Mississippi Dennis S. Painter, Tennessee Valley Authority, Nashville, Tennessee Donald Becker, Tennessee Valley
Trunk Infrastructure and Urban Growth Managing Rapid Urbanization in Poverty in Dar es Salaam, Tanzania
 Kick-off Meeting, February 22th, 2006 1 Trunk Infrastructure and Urban Growth Managing Rapid Urbanization in Poverty in, Tanzania Federal Ministry of Education and Research Prof. Dr.-Ing. H.-P. Tietz University
Preface. Erie. Scranton. Allentown. Pittsburgh. Harrisburg. Philadelphia
 The Southern Alleghenies Region The Southern Alleghenies Region spans the Laurel Highlands and Allegheny Front in the west across the Appalachians to the east. It is comprised of Blair, Bedford, Cambria,
Chapter Master Planned Communities (MPC) District
 District") Sections 14.53.010 Purpose and Intent 14.53.020 Applicability 14.53.030 Procedure 14.53.040 MPC Standards 14.53.050 Required Findings 14.53.010 Purpose and Intent Chapter 14.53 Master Planned Communities
Sections 14.53.010 Purpose and Intent 14.53.020 Applicability 14.53.030 Procedure 14.53.040 MPC Standards 14.53.050 Required Findings 14.53.010 Purpose and Intent Chapter 14.53 Master Planned Communities
DRAFT SCOPE FOR THE DRAFT ENVIRONMENTAL IMPACT STATEMENT FOR HUDSON HIGHLANDS RESERVE TOWN OF PHILIPSTOWN, NEW YORK June 5, 2018
 DRAFT SCOPE FOR THE DRAFT ENVIRONMENTAL IMPACT STATEMENT FOR HUDSON HIGHLANDS RESERVE TOWN OF PHILIPSTOWN, NEW YORK June 5, 2018 Project Name: Project Location SEQRA Classification of Project: Lead Agency:
Modeling Rain Garden LID Impacts on Sewer Overflows
 7 Modeling Rain Garden LID Impacts on Sewer Overflows Uzair (Sam) M. Shamsi In September 2010, the U.S. Environmental Protection Agency (USEPA) released a new version (5.0.021) of Storm Water Management
Shoreline Master Program Town of La Conner, Washington
 Shoreline Master Program Town of La Conner, Washington Department of Ecology approval effective Adopted September 24, 2013 by Town of La Conner Ordinance No.1106 Amended May 13, 2014 by Town of La Conner
The Benefits and Challenges Associated with Green Infrastructure Practices
 The Benefits and Challenges Associated with Green Infrastructure Practices Thomas M. Evans ASLA, LEED AP Regional Green Infrastructure Design Services Director OWEA Technical Conference, June 20, 2013
A Feasibility Study of Replacing Manual Dishwashing with a Mechanical Dishwasher at Taco Bell
 A Feasibility Study of Replacing Manual Dishwashing with a Mechanical Dishwasher at Taco Bell Prepared for: John *****, Owner Taco Bell #4788 and Paul Kellermann, Professor English 202C By: Andrew *****
Silver Line CPAM UPDATE. Transportation and Land Use Committee October 14, 2016
 Silver Line CPAM UPDATE Transportation and Land Use Committee October 14, 2016 Purpose Recap Project History and Map Changes Provide Overview of CPAM Components Discuss Transportation Impacts Discuss Fiscal
Baumgarten MPUD. Exhibit 3 Evaluation Criteria
 Pursuant to LDC subsections 10.02.13 B, 10.02.08 F and Chapter 3 G. of the Administrative Code, staff s analysis and recommendation to the Planning Commission, and the Planning Commission s recommendation
Post - Construction Hydromodification Development Requirements
 Condensed Version - Interim Low Impact Development / Hydromodification Guidelines, City of Lompoc 1 Post - Construction Hydromodification Development Requirements I. PURPOSE A. The purpose of these requirements
Riparian Buffer on the Bushkill Creek. Policies
 Riparian Buffer on the Bushkill Creek Riparian buffers provide numerous benefits to landowners and the community by protecting groundwater recharge areas, providing flood control, providing stormwater
Joint Meeting City Council and the Plan Commission. September 1st, 2015
 Joint Meeting City Council and the Plan Commission September 1st, 2015 1 The City Plan Commission shall recommend a City Plan for the physical development of the City Article IX Section 2 of the City of
DISCUSSION ON VACAVILLE S2 INVESTORS PROPERTY IN URBAN RESERVE
 Agenda Item No. 9C April 25, 2017 TO: FROM: SUBJECT: Honorable Mayor and City Council Attention: Jeremy Craig, Interim City Manager Barton Brierley, AICP, Community Development Director (Staff Contact: