REGION-WIDE BUILDOUT IMPACT ANALYSIS
|
|
|
- Anissa Meredith Copeland
- 5 years ago
- Views:
Transcription


1 REGION-WIDE BUILDOUT IMPACT ANALYSIS Nashua Regional Planning Commission Nashua Regional Planning Commission October 24, 2005
2 2 Nashua Regional Planning Commission
3 REGION-WIDE BUILDOUT IMPACT ANALYSIS October 24, 2005 Prepared by Nashua Regional Planning Commission With Financial Assistance from the NH Office of Energy and Planning Nashua Regional Planning Commission 115 Main Street P.O. Box 847 Nashua, NH Phone: (603) Fax: (603) Stephen Williams, Executive Director Steve Schaffer, GIS Manager Ryan Friedman, GIS Planner Sam Lingeman, GIS Planner Special Thanks to Julie Esp Nashua Regional Planning Commission 3
4 Table of Contents CHAPTER Page CHAPTER 1: INTRODUCTION 8 CHAPTER 2: METHODOLOGY 11 CHAPTER 3: REGION-WIDE BUILDOUT IMPACTS 17 A. Developable Acres 17 B. Housing Units at Buildout 18 C. Population at Buildout 22 D. Residential Growth at Buildout 24 E. Students at Buildout 26 F. Traffic at Buildout 27 G. Water Demand at Buildout 29 H. Solid Waste at Buildout 30 I. Emergency Services at Buildout 31 J. Region-wide Buildout Summary 32 CHAPTER 4: COMMUNITY BUILDOUT RESULTS 35 A. Amherst 36 B. Brookline 38 C. Hollis 40 D. Hudson 42 E. Litchfield 44 F. Lyndeborough 46 G. Merrimack 48 H. Milford 50 I. Mont Vernon 52 J. Nashua 54 K. Pelham 56 L. Wilton 58 APPENDIX A: DETAILED BUILDOUT METHODOLOGY 62 A. Description of Model 62 B. Methods Developable Parcels Absolute s Partial s 65 C. Model Assumptions/Interpretations Multi-scale Inputs Zoning Code Interpretation Land Use Type Ratios Multi Family Units per Lot Residential Building Size 67 APPENDIX B: DETAILED BUILDOUT PROCESS TABLES BY COMMUNITY 68 Amherst 68 Brookline 70 4 Nashua Regional Planning Commission
5 Table of Contents cont. CHAPTER Page APPENDIX B: DETAILED BUILDOUT PROCESS TABLES BY COMMUNITY cont. 65 Hollis 71 Hudson 73 Litchfield 74 Lyndeborough 76 Merrimack 77 Milford 78 Mont Vernon 79 Nashua 80 Pelham 82 Wilton 83 FIGURE Page Figure 1-1: Region-wide Population Growth Figure 2-1: Step-by-Step Buildout Process 13 Figure 2-2: Automated Model 15 Figure 3-1: Developable Acres 17 Figure 3-2: Estimated Housing Units at Buildout by Type 18 Figure 3-3: Estimated Housing Units at Buildout by Community 19 Figure 3-4: Estimated Population at Buildout 22 Figure 3-5: Estimated Employees at Buildout by Community 25 Figure 3-6: Estimated Public School Students at Buildout 26 Figure 3-7: Estimated Water Demand at Buildout 29 Figure 3-8: Estimated Solid Waste Disposal at Buildout 30 Figure 3-9: Estimated Police Response Calls per Year at Buildout 31 Figure 3-10: Estimated Emergency Service Calls per Year at Buildout 32 Figure A-1: The Buildout Model Step-by-Step 61 MAP Page Map 1-1: NRPC Region 9 Map 2-1: Region-wide Generalized Land Use 12 Map 2-2: Region-wide Environmental s 14 Map 3-1: Estimated New Lots at Buildout 20 Map 3-2: Estimated Development Footprint at Buildout 21 Map 3-3: Estimated Additional Persons at Buildout 23 Map 3-4: Estimated Percent Population Increase at Buildout 23 Map 3-5: Estimated Residential Lots at Buildout 24 Map 3-6: Estimated Percent Increase in Traffic Volume at Buildout 27 Map 3-7: Estimated Street Segments Over Capacity at Buildout 28 Map 4-1: Communities in the NRPC Region 35 Map 4-2: Amherst-Estimated New Lots at Buildout 37 Map 4-3: Brookline-Estimated New Lots at Buildout 39 Map 4-4: Hollis-Estimated New Lots at Buildout 41 Map 4-5: Hudson-Estimated New Lots at Buildout 43 Map 4-6: Litchfield-Estimated New Lots at Buildout 45 Map 4-7: Lyndeborough-Estimated New Lots at Buildout 47 Map 4-8: Merrimack-Estimated New Lots at Buildout 49 Nashua Regional Planning Commission 5
6 Table of Contents cont. MAP Page Map 4-9: Milford-Estimated New Lots at Buildout 51 Map 4-10: Mont Vernon-Estimated New Lots at Buildout 53 Map 4-11: Nashua-Estimated New Lots at Buildout 55 Map 4-12: Pelham-Estimated New Lots at Buildout 57 Map 4-13: Wilton-Estimated New Lots at Buildout 59 TABLE Page Table 2-1: Generalized Land Use 11 Table 3-1: Average Residential Square Feet per Lot 24 Table 3-2: Students per Housing Unit 26 Table 3-3: Solid Waster Disposal per Capita 30 Table 3-4: Police and Emergency Services Annual Responses per Capita 31 Table 4-1: Amherst-Town-wide Buildout Results 36 Table 4-2: Amherst-Buildout Results by Zoning District 37 Table 4-3: Brooklinet-Town-wide Buildout Results 38 Table 4-4: Brookline-Buildout Results by Zoning District 39 Table 4-5: Hollis-Town-wide Buildout Results 40 Table 4-6: Hollis-Buildout Results by Zoning District 41 Table 4-7: Hudson-Town-wide Buildout Results 42 Table 4-8: Hudson-Buildout Results by Zoning District 43 Table 4-9: Litchfield-Town-wide Buildout Results 44 Table 4-10: Litchfield-Buildout Results by Zoning District 45 Table 4-11: Lyndeborough-Town-wide Buildout Results 46 Table 4-12: Lyndeborough-Buildout Results by Zoning District 47 Table 4-13: Merrimack-Town-wide Buildout Results 48 Table 4-14: Merrimack-Buildout Results by Zoning District 49 Table 4-15: Milford-Town-wide Buildout Results 50 Table 4-16: Milford-Buildout Results by Zoning District 51 Table 4-17: Mont Vernon-Town-wide Buildout Results 52 Table 4-18: Mont Vernon-Buildout Results by Zoning District 53 Table 4-19: Nashua-Town-wide Buildout Results 54 Table 4-20: Nashua-Buildout Results by Zoning District 55 Table 4-21: Pelham-Town-wide Buildout Results 56 Table 4-22: Pelham-Buildout Results by Zoning District 57 Table 4-23: Wilton-Town-wide Buildout Results 58 Table 4-24: Wilton-Buildout Results by Zoning District 59 Table A-1: GIS Datasets used in the Buildout Analysis 62 Table A-2: Average Residential Square Feet per Lot 67 6 Nashua Regional Planning Commission
7 This page left intentionally blank Nashua Regional Planning Commission 7


8 INTRODUCTION CHAPTER 1 INTRODUCTION The Nashua Regional Planning Commission region is typically characterized as a small urban center (Nashua) surrounded by suburban communities of varying degrees of density. From moderately mixed-use communities such as Hudson and Milford to traditionally single family residential communities such as Hollis and Brookline, the region is comprised of a diverse and multi-faceted landscape. From the spruce fir forests adorning the highest hills in Lyndeborough, to the urban landscape of Nashua, the colonial villages of Hollis and Amherst, and the prime farmland along the Merrimack River in Litchfield, the landscape of the NRPC region is perhaps the most varied in the state. The region is located in the Merrimack River Valley. The river runs from north to south through the region and its major tributaries in the region include the Nashua River, the Souhegan River, Salmon Brook and Pennichuck Brook. The NRPC region, located in Southern New Hampshire, consists of the City of Nashua and the 11 towns of Amherst, Brookline, Hollis, Hudson, Litchfield, Lyndeborough, Merrimack, Milford, Mont Vernon, Pelham and Wilton. The region is facing development pressure due to its proximity to metropolitan Boston, and as a whole has experienced rapid population growth over the last forty years as depicted in Figure 1-1. The regional population grew from 63,216 in 1960 to 195,788 in the year 2000, an increase of 210% and a 53% average growth rate every ten years. This growth has resulted in a loss of natural resources and open space, and increased costs of providing public services. Major impacts on public services offered by communities include schools, roads and emergency services, and impacts on natural resources include water demand and solid waste disposal. Effective land use planning with a goal of long-term sustainability is essential to confront the pressures of development growth. Decisions on how to effectively plan and manage growth are often difficult because of the complexity and longevity of the land development process. Figure 1-1: Region-wide Population Growth Source: U.S. Census and New Hampshire Historical Society 8 Nashua Regional Planning Commission


9 Map 1-1: NRPC Region INTRODUCTION Source: NRPC GIS Database and University of New Hampshire Complex Systems GRANIT Database August 2005 Buildout is a theoretical condition and exists when all available land suitable for residential and nonresidential construction has been developed. Within the set parameters and under a particular set of adopted policies, buildout represents the carrying capacity of an area, community or region. Through an application of development requirements and past development patterns, combined with an inventory of developable space, a community can produce an estimate of the type and amount of future growth. This buildout project is an attempt at a region-wide scale to approximate that process and forecast growth into the future. Buildout estimates are determined for the maximum number of single Nashua Regional Planning Commission 9
10 INTRODUCTION family and multiple family housing units that will result when all of the available developable land is consumed; an estimate of the maximum square footage and number of employees for commercial, office and industrial developments at buildout; and the spatial location of potential new developments at the parcel level. These values are calculated for each of the twelve communities in the NRPC region and for the region as a whole. Finally, these estimates are used to determine the impacts of buildout including: housing and population, employment, non-residential square footage, traffic, the number of school children, demand for water and solid waste disposal, and the buildout demand for public safety services. The most unique aspect of the buildout is that once all of the basic information is input into the system the individual parameters can be changed to assess the development impacts to the community; for example, the minimum lot size in the residential district could be increased/decreased or developable land could be designated as conservation land. Buildout is a theoretical condition and exists when all available land suitable for residential and nonresidential construction has been developed. The primary goal of the buildout analysis is to provide policy makers and the public with the information needed to make informed choices regarding the future growth of the region. Understanding what the region will look like at buildout is critical to the evaluation of current land use policies, including zoning and growth management ordinances and open space acquisition. A better understanding of the growth potential for a municipality can be a valuable resource for planners and elected officials struggling with land use decisions. A further purpose of this analysis is to explore how current regulations set the blueprint for future growth. Zoning regulations pertaining to allowable uses and allowable densities are an indication of the desired type and amount of growth that will occur in currently undeveloped areas. Finally, the purpose of the buildout analysis is to explore the relationship between buildout population and infrastructure and the demands on resources that will be produced. Values for Impacts of buildout are identified for the following categories: 1. Housing 2. Population 3. residential employment and square footage 4. Students 5. Traffic 6. Water Demand 7. Solid Waste 8. Emergency Services This study was funded by the NH Office of Energy and Planning (OEP) in support of regional land use planning. 10 Nashua Regional Planning Commission
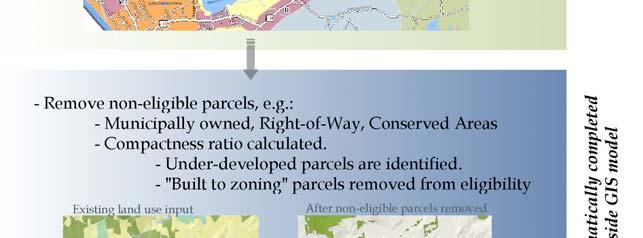
11 CHAPTER 2 METHODOLOGY This buildout analysis is performed using an automated Geographic Information System (GIS). Inputs, such as housing, population, non-residential uses and constraints, are loaded into the computer model which produces estimated buildout results. Because regulations differ between communities, twelve separate buildout analyses were conducted, one for each municipality in the NRPC region. The NRPC has completed buildout studies for several communities in the past. These studies were completed at different times, and used widely divergent methods. This project standardizes methods and approaches across the entire region producing a coherent, holistic and highly comparable picture of buildout growth. METHODOLOGY A more in-depth analysis regarding land use type distributions is provided in this study than is typically assessed in other buildout methods, resulting in multiple residential and non-residential land use type estimates. Residential land use is classified as being Single family or Multi family and nonresidential land use is classified as being Commercial (defined as retail, service and health related), Office and Industrial. The existing land use classifications identified as developable include Agricultural and Vacant. All other current land uses, including Municipal Facilities, Conserved Lands, Institutional, Other Government, Rights-of-Way are considered non-eligible for development. The land use classifications and codes used in this study are listed in Table 2-1. Table 2-1: Generalized Land Use Land Use Code SF MF Land Use Description Single family Residential Multi family Residential Comm Commercial Off Ind Agr Office Industrial Agricultural Vacant Vacant Eligible Includes Municipal Facilities, Conserved Lands, Institutional, Other Government, Right-of-Way A parcel-based buildout analysis offers several advantages over lump-sum or gross-area studies that have been done in the past. First, it estimates the number of new lots at buildout for each developable parcel in the region. This allows for a very explicit and accurate identification of where and how much growth will occur. Second, it accounts for the ownership, configuration and size of each lot region-wide. Parcels that are prohibited from further development can be immediately removed from the process such as municipally owned parks, facilities, street and utility rights-of-way and those parcels that are permanently protected as conservation lands. The process is illustrated in Step 2 of figure 2-1. This analysis also accounts for under-developed parcels or those properties that are currently built on, but because of their size and shape, have the potential to be further developed. The buildout analysis is based on the zoning regulations for each community in effect in The zoning regulations are interpreted for each parcel region-wide as stated in Step 3 of Figure 2-1. A list of minimum lot sizes and permitted uses is then created for each individual parcel. Where more than one type of use is allowed, a ratio of uses is applied based on the current development pattern in that zoning district. Nashua Regional Planning Commission 11


12 Map 2-1: Region-wide Generalized Existing Land Use Source: NRPC GIS Database Nashua Regional Planning Commission


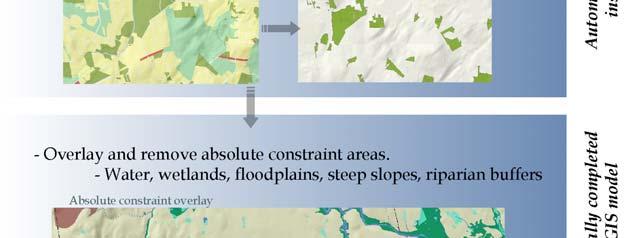
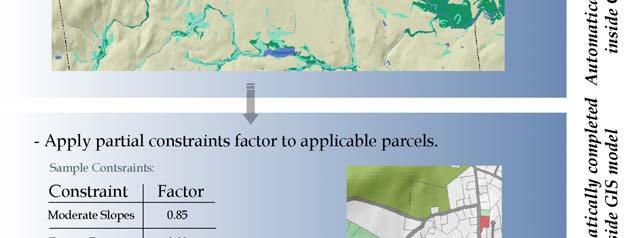
13 Figure 2-1: Step-by-Step Buildout Process All buildout analyses remove certain constraint areas from the land available for development. For this buildout, these are called Absolute s and they include: Water Wetlands 100 year floodplain Steep slopes >25% Riparian Buffers required by regulation METHODOLOGY Using the GIS process, these constraint areas are removed from the acreage of developable land as shown in Step 5 of Figure 2-1. In addition to the absolute constraints this analysis accounts for partial constraints. These are features that may limit the amount of development that could occur on a parcel but do not absolutely restrict development. The application of partial constraints factors is illustrated in Step 4 of Figure 2-1. Partial constraints include: Moderate slopes 15-25% Design features on large parcels: factors such as new subdivision roads, right-of-way areas, and other site-specific constraints that are difficult to calculate in a general way and may limit the number of new lots that could be created on a parcel. Nashua Regional Planning Commission 13
14 Map 2-2: Region-wide Environmental s Source: NRPC GIS Database and University of New Hampshire Complex Systems GRANIT Database October Nashua Regional Planning Commission
15 The buildout study is designed as an automated GIS based computer model. Current condition variables such as population, housing units, non-residential development and zoning are needed as inputs to the model. These quantitative measurements serve as baseline figures for the model s estimated output buildout values. The automated process permits step-by-step changes of the assumptions and input values such as zoning, allowable uses or densities. This process also allows for ease of updating when land use inputs change such as when land is purchased for conservation and no longer developable or changes to the zoning that increase or decrease the density of development. The model is designed to be highly tunable and repeatable. Figure 2.2 illustrates the basic inputs and outputs of the model. METHODOLOGY Figure 2-2 Automated Model Input Data Land Use, Zoning, s Automated Model Output Population, Housing, Residential, Impacts Nashua Regional Planning Commission 15

16 16 Nashua Regional Planning Commission

17 380 CHAPTER 3 REGION-WIDE BUILDOUT IMPACTS The buildout study estimates the maximum scale and type of growth that can be reasonably expected if the region s municipalities current planning policies and regulations are continued into the future. The buildout model estimates IMPACTS the developable acreage and number of new lots that can be expected at buildout conditions for residential and non-residential development. From these values, impacts are calculated for housing units, population, commercial, office and industrial development, employees, school enrollment, traffic, water demand, solid waste, and emergency services. In this chapter, these impacts are reviewed on a community by community basis and as region-wide totals. Buildout totals region-wide can be represented as the number of new lots on developable areas and visually depicted as the development footprint at buildout. For more detailed buildout values for individual communities, refer to chapter 4. The impacts derived from this study are illustrative only. The buildout analysis is not a prediction or forecast of growth in the region and there is no timeline attached. The study is a planning tool that attempts to recognize the maximum potential for growth under current land use regulations. It is not appropriate for budgeting, capital improvement plans or growth management purposes, except as a general guide. The best available local and state data was used in the analysis. In some cases specific data was not available. The impacts derived from this study are illustrative only. The buildout analysis is not a prediction or forecast of growth in the region and there is no timeline attached. The study is a planning tool that attempts to recognize the maximum potential for growth under current land use regulations. It is not appropriate for budgeting, capital improvement plans or growth management purposes, except as a general guide. The best available local and state data was used in the analysis. In some cases specific data was not available. A. DEVELOPABLE ACRES After the removal of non-eligible parcels, absolute constraints and partial constraints, the remaining land is the developable acreage. Figure 3-1 shows the total developable acreage for each community and the region as a whole. Developable acreage for each zoning district is included in Chapter 4 with individual community results. Map 3-1 depicts new lots in the region by parcel. Nashua Regional Planning Commission 17


18 IMPACTS Figure 3-1: Developable Acres Source: NRPC Buildout Analysis August 2005 B. HOUSING UNITS AT BUILDOUT The buildout analysis estimates 98,995 housing units region-wide at buildout. This represents a 30% increase, or 22,853 units, from the base year (2003 NHOEP estimates) amount of 76,142 housing units. The majority of this new housing, 82%, is estimated to be detached single family housing units, with only 18% estimated to be multi family units. This is indicative of exclusive single family zoning districts and the continuation of existing land use trends in the buildout model. The buildout housing estimates are included in Figure 3-2 and 3-3 and depicted on Maps 3-1 and 3-2. Figure 3-2: Estimated Housing Units at Buildout by Type Source: NRPC Buildout Analysis October Nashua Regional Planning Commission


19 IMPACTS Single Family Housing accounts for 82% of the new estimated housing units region-wide at buildout. Figure 3-3: Estimated Housing Units at Buildout by Community Source: NRPC Buildout Analysis October 2005 Nashua Regional Planning Commission 19


20 IMPACTS Map 3-1: Estimated New Lots at Buildout Source: NRPC Buildout Analysis October Nashua Regional Planning Commission


21 Map 3-2: Estimated Development Footprint at Buildout IMPACTS Source: NRPC Buildout Analysis October 2005 Nashua Regional Planning Commission 21

 to buildout for the NRPC communities.")
22 IMPACTS C. POPULATION AT BUILDOUT Buildout population is derived for each community by multiplying the U.S. Census 2000 value of persons per household by the estimated number of housing units at buildout. Individual community values are added together to derive region-wide totals. Population is estimated to be 267,734 persons region-wide at buildout. This represents a 32% increase, or 64,857 additional persons, from the base year (2003) population of 202,877. Figure 3-4 shows the increase in population from the 2003 base year (NHOEP Estimates) to buildout for the NRPC communities. Maps 3-3 and 3-4 illustrate the actual growth and the percent growth in each community in the region. Figure 3-4: Estimated Population at Buildout Source: NRPC Buildout Analysis October Nashua Regional Planning Commission


23 Map 3-3: Estimated Additional Persons at Buildout IMPACTS Source: NRPC Buildout Analysis October 2005 Map 3-4: Estimated Percent Population Increase at Buildout Source: NRPC Buildout Analysis October 2005 Nashua Regional Planning Commission 23

24 IMPACTS D. NON-RESIDENTIAL GROWTH AT BUILDOUT The buildout estimates the amount of non-residential growth in the following three classes: commercial, office and industrial. Impacts are also measured by the number of employees and the square footage of non-residential space available at buildout. Based on the 2004 zoning regulations for each community, region-wide, non-residential land use is expected to increase by 71%, or 2,042 new lots, at buildout. Map 3-5 illustrates the total increase in the number of non-residential lots estimated for each community. Commercial, office and industrial square footage at buildout is estimated using a region-wide average square foot per lot value derived from GIS and assessing data. Different values were applied to the City of Nashua due to its role as the urban center for the region and to Merrimack for commercial because of pending development. Applying the average value figures in Table 3-1 to the new lot calculations indicates that the region can expect an additional 45,927,984 square feet of non-residential development at buildout. Through data gathered for the regional travel demand model, NRPC can estimate for each municipality the number of employees per business for commercial, office and industrial business types by community. The expected number of employees region-wide can be calculated by applying these ratios to the estimates for non-residential development at Table 3-1: Average Residential Square Feet per Lot Land Use Average Square Feet/Lot Nashua Average Square Feet/Lot Commercial* 6,240 17,196 Office 7,819 18,687 Industrial 23,618 51,785 Source: Municipal Assessing Data * Merrimack Average Commercial Square Foot: 18,720 Per Town Request to include several planned large developments Map 3-5: Estimated Residential Lots at Buildout Source: NRPC Buildout Analysis October Nashua Regional Planning Commission


25 Figure 3-5: Estimated Employees at Buildout by Community IMPACTS Source: NRPC Buildout Analysis October 2005 buildout. The total number of employees region-wide is estimated to grow by 84%, or 77,723, to a buildout total of 170,661. Figure 3-5 compares the current employee estimates to the buildout estimates for each community. The 71% growth in nonresidential lots region-wide indicate a large amount of developable land in commercial, office or industrial zoning districts. Nashua Regional Planning Commission 25


26 IMPACTS E. STUDENTS AT BUILDOUT Estimates are calculated for the total number of students, kindergarten through high school, that are expected to be enrolled in public schools at buildout conditions. Current enrollment figures for each community in the region were gathered from community Table 3-2: Students Per Housing Unit Municipality Students Per- Housing Unit Amherst 0.67 Brookline 0.76 Hollis 0.62 Hudson 0.49 Litchfield 0.64 Lyndeborough 0.32 Merrimack 0.51 Milford 0.46 Mont Vernon 0.71 Nashua 0.37 Pelham 0.50 Wilton 0.39 Source: NHOEP and Individual School Districts Figure 3-6: Estimated Public School Students at Buildout profiles and directly from school districts. These values represent the number of students enrolled in public school who live in the community. Using the 2003 base year housing figures, a students per housing unit ratio was derived for each community by dividing total enrollment by total number of housing units. The student per housing unit figures for each community are included in Table 3-2. This ratio is then applied to the total number of housing units at buildout to calculate total students expected at buildout. As indicated in Figure 3-6, an additional 11,091 students can be expected at buildout for a total of 46,052 students region wide, an increase of 32% over the 2003 base year of 34,961 students. Buildout values estimate an additional 11,091 public school students. * Source: NRPC Buildout Analysis October 2005 * See Pelham Buildout - Page Nashua Regional Planning Commission
 version of the traffic model contains current road networks and current housing and non-residential information.")

 percent of road segments are estimated to increase in volume by 300% or more at buildout.")
27 F. TRAFFIC AT BUILDOUT NRPC maintains a sophisticated Regional Travel Demand Model to predict traffic patterns and volumes on road segments region-wide. The base year (2000) version of the traffic model contains current road networks and current housing and non-residential information. A buildout version of the traffic model was created by applying the estimated buildout totals. This was done using the base year road network without any improvements or new roads that may be built. The traffic volumes and conditions are compared between the base year model and the buildout model. According to the model, the mean percent volume increase in traffic for road segments region-wide, shown in Map 3-6, is 55%. Buildout values estimate an additional 43,673 vehicles in the region. Three (3) percent of road segments are estimated to increase in volume by 300% or more at buildout. Fifteen (15) percent are estimated to increase by 100% or more and 30% are estimated to increase by 50% or more. The transportation model includes only major routes. It does not include every street in the region. IMPACTS Road segments that are at or over capacity can also be identified by the transportation model. Road capacity is based on standards that account for the number of lanes and the type of road. A road segment is over capacity when the volume is greater than the capacity. The base year (2000) model Map 3-6: Estimated Percent Increase in Traffic Volume at Buildout Source: NRPC Buildout Analysis October 2005 Nashua Regional Planning Commission 27


28 IMPACTS Map 3-7: Estimated Street Segments Over Capacity at Buildout Source: NRPC Buildout Analysis October 2005 indicates that 7% of the roadway network is operating at or above capacity. After applying the buildout totals, approximately 12% of the roadway network would be operating at or above capacity. The comparison of the base year with the buildout values is illustrated on Map 3-7. According to U.S. Census 2000 figures, there is an average of 1.9 vehicles per household in the region. Applying this value to estimated housing units at buildout provides an estimate of 43,421 additional vehicles region-wide at buildout. 28 Nashua Regional Planning Commission


29 G. WATER DEMAND AT BUILDOUT As the amount of housing and non-residential development grows in the region, the demand for fresh water will increase proportionately. In the NRPC region, water is supplied through a combination of private and public wells, and private and public water systems, with the biggest water system being Pennichuck Water Works. Water demand is often estimated using gallons per day per capita values. Using system-wide Pennichuck Water Works measurements, gallons per day per capita averages were derived for the region. An average of 161 gallons per day per capita value is applied to communities with a mix of residential and non-residential development and an average of 75 gallons per day per capita value is applied to largely suburban, residential communities. The larger (161 gpd) value accounts for the generally higher water use of commercial, office and industrial businesses. IMPACTS Values for regional water demand at buildout are calculated by applying the buildout population estimates to the average per capita water use figures. These values assume that households using wells have the same average water demand as households on water systems. Based on these calculations the region will need an additional 7.3 million gallons per day (mgd) of water for a total of 35.6 mgd to accommodate the estimated buildout demand for water use. Figure 3-7 shows current water demand and buildout water demand for the NRPC communities. It should be noted that there are several very large water users in the region, with the biggest being the Anheuser-Busch plant in Merrimack. The plant uses approximately 1.8 million gallons per day of water that is not included in the per capita averages. Figure 3-7: Estimated Water Demand at Buildout Source: NRPC Buildout Analysis and Pennichuck Water Works - August 2005 Nashua Regional Planning Commission 29


30 IMPACTS H. SOLID WASTE AT BUILDOUT The amount of solid waste, or trash, that is contributed to landfills by the region is another important consideration of buildout. The New Hampshire Department of Environmental Services, Bureau of Solid Waste, tracks the tonnage of trash per year contributed from each municipality. Using the 2003 base year population figures and the 2003 tonnage information, a tons per year per capita value is calculated for each community in the region as indicated in Table 3-3. This value is then applied to the estimated buildout population figures to derive an estimate of region-wide tonnage per year at buildout. Based on these calculations, an increase of 23,462 tons of solid waste can be expected region-wide at buildout for a total of 104,323 tons per year. Figure 3-8 compares the 2003 solid waste generation figures with the buildout generation figures for the NRPC communities. These values do not Table 3-3: Solid Waste Disposal per Capita Tons per Municipality Capita Amherst 0.34 Brookline 0.39 Hollis 0.39 Hudson 0.47 Litchfield 0.14 Lyndeborough 0.66 Merrimack 0.30 Milford 0.23 Mont Vernon 0.38 Nashua 0.47 Pelham 0.26 Wilton 0.70 Source: NHDES 2003 include recycling or certain building construction materials that are usually not disposed of in a local landfill. Figure 3-8: Estimated Solid Waste Disposal at Buildout Source: NRPC Buildout Analysis October Nashua Regional Planning Commission


31 I. EMERGENCY SERVICES AT BUILDOUT As the region grows, communities will need to plan for the increased resources needed to provide police, fire and ambulance protection at buildout populations. Each municipality in the region tracks the number of police and fire/ emergency calls that are handled in a year. Annual per capita service responses are calculated using the 2003 base year population figures and the call data for 2003 and are indicated in Table 3-4. These values were then applied to population estimates at buildout to derive estimated yearly police and emergency service calls expected at buildout. As shown in Figures 3-9 and 3-10, police calls are expected to increase by 93,928 calls region-wide for a total of 342,339 calls annually and fire/emergency calls are expected to increase by 5,806 calls region wide for a total of 23,391 calls annually at buildout. Tracking fire/ambulance estimates is complicated by the use of private ambulance services and by support often provided across municipal borders. Table 3-4: Police and Emergency Service Annual Responses per Capita Police Responses per Capita Fire Responses per Capita Municipality Amherst Brookline Hollis Hudson Litchfield Lyndeborough Merrimack Milford Mont Vernon Nashua Pelham Wilton Source: Municipal Annual Reports IMPACTS Figure 3-9: Estimated Police Response Calls per Year at Buildout Source: NRPC Buildout Analysis October 2005 Nashua Regional Planning Commission 31

32 IMPACTS Figure 3-10: Estimated Emergency Service Calls per Year at Buildout Source: NRPC Buildout Analysis - October 2005 J. REGION-WIDE BUILDOUT SUMMARY Continued growth to buildout conditions would have significant impacts on resources and services in the region. A summary of the region-wide buildout results includes: Housing units region-wide are estimated to increase by 30%, from 76,142 in 2003, to 98,995 at buildout; an increase of 22,853 housing units. 82% of the housing unit growth is estimated to be single family houses. Population region-wide is estimated to increase by 32%, from 202,877 persons in 2003, to 267,735 persons at buildout; an increase of 64,857 persons. residential lots region-wide are estimated to increase by 71%, with an additional 2,042 new non-residential lots at buildout. An additional 11,091 public school students are estimated region-wide at buildout. An additional 43,421 automobiles are estimated region-wide at buildout. 32 Nashua Regional Planning Commission
33 According to the NRPC transportation model, an estimated 12% of road segments region-wide would be operating over capacity at buildout, compared with 7% in 2000 operating over capacity. IMPACTS Water demand is estimated to increase by 7.3 mgpd (million gallons per day) from 28.3 mgpd in 2003 to 35.6 mgpd at buildout. Solid waste demand, or trash placed in landfills, is estimated to increase region-wide by 23,462 tons per year, from 80,861 tons per year in 2003 to 104,323 tons per year at buildout. Police response calls per year are estimated to increase region-wide by 93,928 responses, from 248,411 in 2003 to 342,339 at buildout. Fire and emergency service response calls per year are estimated to increase region-wide by 5,806 responses, from 17,585 in 2003 to 23,291 at buildout. Nashua Regional Planning Commission 33

34 34 Nashua Regional Planning Commission


35 CHAPTER 4: COMMUNITY BUILDOUT RESULTS In this chapter, buildout results are presented community-wide and for each zoning district within the community. The amount of developable acres is calculated for each COMMUNITIES eligible parcel in the community. The zoning-based minimum lot size is then divided into the developable acres to produce an estimate of the number of new lots at buildout. This value is aggregated to the zoning district and community-wide level and used to estimate the number of housing units, population and non-residential development at buildout. The number of new lots estimated at buildout are provided for each zoning district and by the five generalized land uses: single family residential, multi family residential, commercial, office and industrial. For zoning districts that allow multiple uses, new estimated lots may be distributed among multiple land use types. This distribution is based on the current ratio of allowable use types within the zoning district. Appendix B lists the ratios applied to each zoning district for each municipality. The additional population at buildout is calculated by multiplying new estimated housing units by the number of persons per household from U.S. Census 2000 figures. The total nonresidential square feet is calculated for current (base year 2003) values and for the additional amount at buildout. Each of the twelve communities in the region is presented separately in alphabetical order. Map 4-1: Communities in the NRPC Region Source: NRPC GIS Database- October 2005 The impacts derived from this study are illustrative only. The buildout analysis is not a prediction or forecast of growth in the region and there is no timeline attached. The study is a planning tool that attempts to recognize the maximum potential for growth under current land use regulations. It is not appropriate for budgeting, capital improvement plans or growth management purposes, except as a general guide. The best available local and state data was used in the analysis. In some cases specific data was not available. Nashua Regional Planning Commission 35
36 COMMUNITIES A. AMHERST Results of the buildout analysis for the Town of Amherst are included in Table 4-1 below. The buildout study estimates that an additional 1,054 housing units are possible in Amherst, all of which will be single family houses. This represents a 28% increase, from 3,804 current housing units to 4,858 housing units at buildout. Using the population multiplier of 3.0 persons per household, based on the 2000 Census, population increases by 3,162 persons, from 11,413 to 14,575 at buildout. Commercial (retail/service) space is estimated to increase by 25% from 499,200 square feet to 624,000 square feet. Office space is estimated to increase by 20% from 273,665 square feet to 328,398 square feet. Industrial space is estimated to increase the greatest amount by 75% from 944,720 square feet to 1,653,260 square feet. The Town of Amherst has approved two very large retail developments along NH Route 101A that will add several hundred thousand square feet to the commercial space in town. This additional square footage is not included in the estimated value at buildout. Table 4-1: Amherst Town-wide Buildout Results Current 1 Additional At Buildout Population 11,413 3,162 14,575 Persons per Household Housing units 3,804 1,054 4,858 Single family Housing 3,637 1,054 4,691 Multi family Housing units (incl. Mobile Home) Multi family lots Multi family Housing units per lot Commercial/retail lots Commercial/retail square feet 5 499, , ,000 Office lots Office square feet 6 273,665 54, ,398 Industrial lots Industrial square feet 7 944, ,540 1,653,260 1Current Population and Housing units based on NH Office of Energy and Planning 2003 Estimates. 2 Persons per Household based on U.S. Census 2000 figures. 3 Number of Multi family, Commercial, Office & Industrial lots derived from NRPC GIS database. 4 Current Multi family Housing units divided by multi family lots. 5 Based on region-wide average (excluding Nashua) of 6,240 square feet per lot. 6 Based on region-wide average (excluding Nashua) of 7,819 square feet per lot. 7 Based on region-wide average (excluding Nashua) of 23,618 square feet per lot. 36 Nashua Regional Planning Commission


37 Table 4-2: Amherst Buildout Results by Zoning District Zoning Lots Single Family Multi family Office Developable Acres Commercial Industrial C GO I LC NR NT POD RR Totals: 2,545 1,110 1, Map 4-2: Amherst Estimated New Lots at Buildout Source: NRPC Buildout Analysis - October 2005 Nashua Regional Planning Commission 37
38 B. BROOKLINE Results of the buildout analysis for the Town of Brookline are included in Table 4-3 below. The buildout study estimates that an additional 1,857 housing units are possible in Brookline, of which 1,680 will be single family houses and 177 will be multi family units. This represents a 127% increase from 1,463 current housing units to 3,320 housing units at buildout. COMMUNITIES Using the population multiplier of 3.11 persons per household, based on the 2000 Census, population increases by 5,775 persons, from 4,497 to 10,272 at buildout. Commercial (retail/service) space is estimated to increase by 48% from 193,440 square feet to 287,040 square feet. Office space is estimated to increase by 50% from 234,570 square feet to 351,855 square feet. Industrial space is estimated to increase by 43% from 165,326 square feet to 236,180 square feet. Table 4-3: Brookline Town-wide Buildout Results Current 1 Additional At Buildout Population 4,497 5,775 10,272 Persons per Household Housing units 1,463 1,857 3,320 Single family Housing 1,357 1,680 3,037 Multi family Housing units (incl. Mobile Home) Multi family lots Multi family Housing units per lot Commercial/retail lots Commercial/retail square feet 5 193,440 93, ,040 Office lots Office square feet 6 234, , ,855 Industrial lots Industrial square feet 7 165,326 70, ,180 1Current Population and Housing units based on NH Office of Energy and Planning 2003 Estimates. 2 Persons per Household based on U.S. Census 2000 figures. 3 Number of Multi family, Commercial, Office & Industrial lots derived from NRPC GIS database. 4 Current Multi family Housing units divided by multi family lots. 5 Based on region-wide average (excluding Nashua) of 6,240 square feet per lot. 6 Based on region-wide average (excluding Nashua) of 7,819 square feet per lot. 7 Based on region-wide average (excluding Nashua) of 23,618 square feet per lot. 38 Nashua Regional Planning Commission


39 COMMUNITIES Table 4-4: Brookline Buildout Results by Zoning District Zoning Developable Acres Lots Single Family Multi family Office Ind/Commercial Residential/Agr. 3,183 1,732 1, Totals: 3,217 1,766 1, Commercial Industrial Detailed worksheet tables used in the buildout to inventory zoning classifications and land use type ratios can be found in Appendix B. Map 4-3: Brookline Estimated New Lots at Buildout Source: NRPC Buildout Analysis - October 2005 Nashua Regional Planning Commission 39
40 C. HOLLIS Results of the buildout analysis for the Town of Hollis are included in Table 4-5 below. The buildout study estimates that an additional 1,627 housing units are possible in Hollis, of which 1,577 will be single family houses and 50 will be multi family units. This represents a 62% increase from 2,615 current housing units to 4,242 housing units at buildout. COMMUNITIES Using the population multiplier of 2.88 persons per household, based on the 2000 Census, population increases by 4,686 persons, from 7,489 to 12,175 at buildout. Commercial (retail/service) space is estimated to increase by 14% from 230,880 square feet to 263,827 square feet. Office space is estimated to increase by 6% from 93,828 square feet to 99,458 square feet. Industrial space is estimated to increase by 40% from 354,270 square feet to 495,978 square feet. These values are based on estimates provided by town officials and are not results of the model. Table 4-5: Hollis Town-wide Buildout Results Current 1 Additional At Buildout Population 7,489 4,686 12,175 Persons per Household Housing units 2,615 1,627 4,242 Single family Housing 2,375 1,577 3,952 Multi family Housing units (incl. Mobile Home) Multi family lots Multi family Housing units per lot Commercial/retail lots Commercial/retail square feet 5 230,880 32, ,827 Office lots Office square feet 6 93,828 5,630 99,458 Industrial lots Industrial square feet 7 354, , ,978 1Current Population and Housing units based on NH Office of Energy and Planning 2003 Estimates. 2 Persons per Household based on U.S. Census 2000 figures. 3 Number of Multi family, Commercial, Office & Industrial lots derived from NRPC GIS database. 4 Current Multi family Housing units divided by multi family lots. 5 Based on region-wide average (excluding Nashua) of 6,240 square feet per lot. 6 Based on region-wide average (excluding Nashua) of 7,819 square feet per lot. 7 Based on region-wide average (excluding Nashua) of 23,618 square feet per lot. 40 Nashua Regional Planning Commission


41 COMMUNITIES Table 4-6: Hollis Buildout Results by Zoning District Zoning Lots Single Family Multi family Office Developable Acres Commercial Industrial AB C I MH R RA 1, RL TC WSC Total: 1,823 1,591 1, The developable acreage for Hollis declines significantly when the Open Space Development standards, where 50% of the available land on a parcel is set aside for conservation, are applied. Per the adopted regulations, a one acre minimum lot size was used in the model for these parcels. Detailed worksheet tables used in the buildout to inventory zoning classifications and land use type ratios can be found in Appendix B. Map 4-4: Hollis Estimated New Lots at Buildout Source: NRPC Buildout Analysis - October 2005 Nashua Regional Planning Commission 41
42 D. HUDSON Results of the buildout analysis for the Town of Hudson are included in Table 4-7 below. The buildout study estimates that an additional 3,437 housing units are possible in Hudson, of which 2,374 will be single family houses and 1,063 will be multi family units. This represents a 41% increase from 8,331 current housing units to 11,768 housing units at buildout. COMMUNITIES Using the population multiplier of 2.83 persons per household, based on the 2000 Census, population increases by 9,727 persons, from 23,839 to 33,566 at buildout. Commercial (retail/service) space is estimated to increase by 28% from 1,104,480 square feet to 1,410,240 square feet. Office space is estimated to increase by 34% from 250,208 square feet to 336,217 square feet. Industrial space is estimated to increase by 122% from 3,400,992 square feet to 7,557,760 square feet. Table 4-7: Hudson Town-wide Buildout Results Current 1 Additional At Buildout Population 23,839 9,727 33,566 Persons per Household Housing units 8,331 3,437 11,768 Single family Housing 6,228 2,374 8,602 Multi family Housing units (incl. Mobile Home) 2,103 1,063 3,166 Multi family lots ,276 Multi family Housing units per lot Commercial/retail lots Commercial/retail square feet 5 1,104, ,760 1,410,240 Office lots Office square feet 6 250,208 86, ,217 Industrial lots Industrial square feet 7 3,400,992 4,156,768 7,557,760 1Current Population and Housing units based on NH Office of Energy and Planning 2003 Estimates. 2 Persons per Household based on U.S. Census 2000 figures. 3 Number of Multi family, Commercial, Office & Industrial lots derived from NRPC GIS database. 4 Current Multi family Housing units divided by multi family lots. 5 Based on region-wide average (excluding Nashua) of 6,240 square feet per lot. 6 Based on region-wide average (excluding Nashua) of 7,819 square feet per lot. 7 Based on region-wide average (excluding Nashua) of 23,618 square feet per lot. 42 Nashua Regional Planning Commission


43 COMMUNITIES Table 4-8: Hudson Buildout Results by Zoning District Zoning Lots Single Family Multi family Office Developable Acres Commercial Industrial R R TR B I G G1 2, Total: 3,348 3,035 2, Detailed worksheet tables used in the buildout to inventory zoning classifications and land use type ratios can be found in Appendix B. Map 4-5: Hudson Estimated New Lots at Buildout Source: NRPC Buildout Analysis - October 2005 Nashua Regional Planning Commission 43
44 E. LITCHFIELD Results of the buildout analysis for the Town of Litchfield are included in Table 4-9 below. The buildout study estimates that an additional 1,225 housing units are possible in Litchfield, of which 1,020 will be single family houses and 205 will be multi family units. This represents a 49% increase from 2,477 current housing units to 3,702 housing units at buildout. COMMUNITIES Using the population multiplier of 3.12 persons per household, based on the 2000 Census, population increases by 3,822 persons, from 7,975 to 11,797 at buildout. Commercial, Office and Industrial use was estimated to grow dramatically in the buildout. This is mostly due to zoning districts focusing on commercial/industrial particularly along the proposed Circumferential Highway corridor. Commercial (retail/service) space is estimated to increase by 1324% from 106,080 square feet to 1,510,080 square feet. Office space is estimated to increase by 8000% from 15,638 square feet to 1,266,678 square feet. Industrial space is estimated to increase by 8225% from 94,472 square feet to 7,864,794 square feet. Table 4-9: Litchfield Town-wide Buildout Results Current 1 Additional At Buildout Population 7,975 3,822 11,797 Persons per Household Housing units 2,477 1,225 3,702 Single family Housing 2,102 1,020 3,122 Multi family Housing units (incl. Mobile Home) Multi family lots Multi family Housing units per lot Commercial/retail lots Commercial/retail square feet 5 106,080 1,404,000 1,510,080 Office lots Office square feet 6 15,638 1,251,040 1,266,678 Industrial lots Industrial square feet 7 94,472 7,770,322 7,864,794 1Current Population and Housing units based on NH Office of Energy and Planning 2003 Estimates. 2 Persons per Household based on U.S. Census 2000 figures. 3 Number of Multi family, Commercial, Office & Industrial lots derived from NRPC GIS database. 4 Current Multi family Housing units divided by multi family lots. 5 Based on region-wide average (excluding Nashua) of 6,240 square feet per lot. 6 Based on region-wide average (excluding Nashua) of 7,819 square feet per lot. 7 Based on region-wide average (excluding Nashua) of 23,618 square feet per lot. 44 Nashua Regional Planning Commission


45 COMMUNITIES Table 4-10: Litchfield Buildout Results by Zoning District Zoning Lots Single Family Multi family Office Developable Acres Commercial Industrial R 1, HC SWC NC T SCI NCI Total: 1,770 1,765 1, Detailed worksheet tables used in the buildout to inventory zoning classifications and land use type ratios can be found in Appendix B. Map 4-6: Litchfield Estimated New Lots at Buildout Source: NRPC Buildout Analysis - October 2005 Nashua Regional Planning Commission 45
46 F. LYNDEBOROUGH Results of the buildout analysis for the Town of Lyndeborough are included in Table 4-11 below. The buildout study estimates that an additional 542 housing units are possible in Lyndeborough, all of which will be single family houses. This represents an 81% increase from 672 current housing units to 1,214 housing units at buildout. COMMUNITIES Using the population multiplier of 2.83 persons per household, based on the 2000 Census, population increases by 1,534 persons, from 1,702 to 3,236 at buildout. Commercial (retail/service) space is estimated to increase by 167% from 18,720 square feet to 49,920 square feet. Office space is estimated to increase by 250% from 15,638 square feet to 54,733 square feet. Industrial space is estimated to increase by 167% from 70,854 square feet to 188,944 square feet. Table 4-11: Lyndeborough Town-wide Buildout Results Current 1 Additional At Buildout Population 1,702 1,534 3,236 Persons per Household Housing units ,214 Single family Housing ,196 Multi family Housing units (incl. Mobile Home) Multi family lots Multi family Housing units per lot Commercial/retail lots Commercial/retail square feet 5 18,720 31,200 49,920 Office lots Office square feet 6 15,638 39,095 54,733 Industrial lots Industrial square feet 7 70, , ,944 1Current Population and Housing units based on NH Office of Energy and Planning 2003 Estimates. 2 Persons per Household based on U.S. Census 2000 figures. 3 Number of Multi family, Commercial, Office & Industrial lots derived from NRPC GIS database. 4 Current Multi family housing units divided by multi family lots. 5 Based on region-wide average (excluding Nashua) of 6,240 square feet per lot. 6 Based on region-wide average (excluding Nashua) of 7,819 square feet per lot. 7 Based on region-wide average (excluding Nashua) of 23,618 square feet per lot. Larger minimum lot sizes are used in the Lyndeborough buildout model than are stated in the zoning regulations. This is due to the severe terrain and ledge geology which makes it virtually impossible to develop at the minimum lot sizes under the adopted soils-based zoning of the Town of Lyndeborough. These larger lot sizes are based on recommendations from Town officials and are meant to account for the soils-based zoning. 46 Nashua Regional Planning Commission


47 COMMUNITIES Table 4-12: Lyndeborough Buildout Results by Zoning District Zoning Lots Single Family Multi family Office Developable Acres Commercial Industrial LI RL1 5, RL RL V Total: 6, Detailed worksheet tables used in the buildout to inventory zoning classifications and land use type ratios can be found in Appendix B. Map 4-7: Lyndeborough Estimated New Lots at Buildout Source: NRPC Buildout Analysis - October 2005 Nashua Regional Planning Commission 47
48 G. MERRIMACK Results of the buildout analysis for the Town of Merrimack are included in Table 4-13 below. The buildout study estimates that an additional 1,833 housing units are possible in Merrimack, of which 1,009 will be single family houses and 824 will be multi family units. This represents a 20% increase from 9,398 current housing units to 11,231 housing units at buildout. Because a large number of multi family lots (206) were created in the buildout, the value of multi family housing units per lot has an enormous effect on the results. The median number of units per permit, as reported by the U.S, Census, was used in this analysis. COMMUNITIES Using the population multiplier of 2.84 persons per household, based on the 2000 Census, population increases by 5,206 persons, from 26,394 to 31,600 at buildout. Commercial (retail/service) space is estimated to increase by 26% from 3,294,720 square feet to 4,137,120 square feet. Office space is estimated to increase by 25% from 1,383,963 square feet to 1,735,818 square feet. Industrial space is estimated to increase by 25% from 1,582,406 square feet to 1,983,912 square feet. Table 4-13: Merrimack Town-wide Buildout Results Current 1 Additional At Buildout Population 26,394 5,206 31,600 Persons per Household Housing units 9,398 1,833 11,231 Single family Housing 7,920 1,009 8,929 Multi family Housing units (incl. Mobile Home) 1, ,302 Multi family lots 3 2, ,541 Multi family Housing units per lot Commercial/retail lots Commercial/retail square feet 5 3,294, ,400 4,137,120 Office lots Office square feet 6 1,383, ,855 1,735,818 Industrial lots Industrial square feet 7 1,582, ,506 1,983,912 1Current Population and Housing units based on NH Office of Energy and Planning 2003 Estimates. 2 Persons per Household based on U.S. Census 2000 figures. 3 Number of Multi family, Commercial, Office & Industrial lots derived from NRPC GIS database. 4 U.S. Census Median number of units per permit Based on town-specified average of 18,720 square feet per lot.* 6 Based on region-wide average (excluding Nashua) of 7,819 square feet per lot. 7 Based on region-wide average (excluding Nashua) of 23,618 square feet per lot. *The large average square feet of commercial lots attempts to account for several large developments Town Officials feel are likely to occur in Merrimack. Due to this adjustment, the current square footage of commercial properties is most likely overestimated. The Town of Merrimack has implemented a Elderly Housing overlay District that allows for higher density housing (up to 8 dwelling units per acre) where implemented. Therefore this district has the potential to significantly increase the housing and population of Merrimack at buildout. The Elderly Housing District was not included in this study. 48 Nashua Regional Planning Commission


49 COMMUNITIES Table 4-14: Merrimack Buildout Results by Zoning District Zoning Lots Single Family Multi family Office Developable Acres Commercial Industrial R 2,185 1,213 1, C C I I I Total: 2,578 1,322 1, Detailed worksheet tables used in the buildout to inventory zoning classifications and land use type ratios can be found in Appendix B. Map 4-8: Merrimack Estimated New Lots at Buildout Source: NRPC Buildout Analysis - October 2004 Nashua Regional Planning Commission 49
50 H. MILFORD Results of the buildout analysis for the Town of Milford are included in Table 4-15 below. The buildout study estimates that an additional 2,641 housing units are possible in Milford, of which 2,204 will be single family houses and 437 will be multi family units. This represents a 48% increase from 5,493 current housing units to 8,134 housing units at buildout. COMMUNITIES Using the population multiplier of 2.58 persons per household, based on the 2000 Census, population increases by 6,814 persons, from 14,235 to 21,049 at buildout. Commercial (retail/service) space is estimated to increase by 51% from 985,920 square feet to 1,485,120 square feet. Office space is estimated to increase by 90% from 531,692 square feet to 1,008,651 square feet. Industrial space is estimated to increase the greatest by 205% from 1,842,204 square feet to 5,621,084 square feet. Table 4-15: Milford Town-wide Buildout Results Current 1 Additional At Buildout Population 14,235 6,814 21,049 Persons per Household Housing units 5,493 2,641 8,134 Single family Housing 3,115 2,204 5,319 Multi family Housing units (incl. Mobile Home) 2, ,815 Multi family lots Multi family Housing units per lot Commercial/retail lots Commercial/retail square feet 5 985, ,200 1,485,120 Office lots Office square feet 6 531, ,959 1,008,651 Industrial lots Industrial square feet 7 1,842,204 3,778,880 5,621,084 1Current Population and Housing units based on NH Office of Energy and Planning 2003 Estimates. 2 Persons per Household based on U.S. Census 2000 figures. 3 Number of Multi family, Commercial, Office & Industrial lots derived from NRPC GIS database. 4 Current Multi family housing units divided by multi family lots. 5 Based on region-wide average (excluding Nashua) of 6,240 square feet per lot. 6 Based on region-wide average (excluding Nashua) of 7,819 square feet per lot. 7 Based on region-wide average (excluding Nashua) of 23,618 square feet per lot. 50 Nashua Regional Planning Commission


51 COMMUNITIES Table 4-16: Milford Buildout Results by Zoning District Zoning Lots Single Family Multi family Office Developable Acres Commercial Industrial A B R 2,616 1,306 1, C I LC ICI Total: 3,168 2,589 2, Detailed worksheet tables used in the buildout to inventory zoning classifications and land use type ratios can be found in Appendix B. Map 4-9: Milford Estimated New Lots at Buildout Source: NRPC Buildout Analysis - October 2005 Nashua Regional Planning Commission 51
52 I. MONT VERNON Results of the buildout analysis for the Town of Mont Vernon are included in Table 4-17 below. The buildout study estimates that an additional 943 housing units are possible in Mont Vernon, all of which will be single family houses This represents a 133% increase from 711 current housing units to 1,654 housing units at buildout. COMMUNITIES Using the population multiplier of 2.90 persons per household, based on the 2000 Census, population increases by 2,735 persons, from 2,275 to 5,010 at buildout. Commercial (retail/service) space is estimated to increase by 475% from 24,960 square feet to 143,520 square feet. Table 4-17: Mont Vernon Town-wide Buildout Results Current 1 Additional At Buildout Population 2,275 2,735 5,010 Persons per Household Housing units ,654 Single family Housing ,631 Multi family Housing units (incl. Mobile Home) Multi family lots Multi family Housing units per lot Commercial/retail lots Commercial/retail square feet 5 24, , ,520 Office lots Office square feet Industrial lots Industrial square feet 7 23,618-23,618 1Current Population and Housing units based on NH Office of Energy and Planning 2003 Estimates. 2 Persons per Household based on U.S. Census 2000 figures. 3 Number of Multi family, Commercial, Office & Industrial lots derived from NRPC GIS database. 4 Current Multi family housing units divided by multi family lots. 5 Based on region-wide average (excluding Nashua) of 6,240 square feet per lot. 6 Based on region-wide average (excluding Nashua) of 7,819 square feet per lot. 7 Based on region-wide average (excluding Nashua) of 23,618 square feet per lot. 52 Nashua Regional Planning Commission
53 COMMUNITIES Table 4-18: Mont Vernon Buildout Results by Zoning District Zoning Lots Single Family Multi family Office Developable Acres Commercial Industrial WRR WR R RR 1, LC MCC Total: 2, Detailed worksheet tables used in the buildout to inventory zoning classifications and land use type ratios can be found in Appendix B. Map 4-10: Mont Vernon Estimated New Lots at Buildout Source: NRPC Buildout Analysis - October 2005 Nashua Regional Planning Commission 53
54 J. NASHUA Results of the buildout analysis for the City of Nashua are included in Table 4-19 below. The buildout study estimates that an additional 2,753 housing units are possible in Nashua, of which 1,729 will be single family houses and 1,024 will be multi family units. This represents an 8% increase from 35,737 current housing units to 38,490 housing units at buildout. COMMUNITIES Using the population multiplier of 2.46 persons per household, based on the 2000 Census, population increases by 6,772 persons, from 87,285 to 94,057 at buildout. Commercial (retail/service) space is estimated to increase by 20% from 14,874,540 square feet to 17,918,232 square feet. Office space is estimated to increase by 48% from 3,324,286 square feet to 4,933,368 square feet. Industrial space is estimated to increase by 70% from 10,667,710 square feet to 18,176,535 square feet. City-wide 20% of the land area is zoned industrial and 22% of the estimated developable land is zoned industrial. Table 4-19: Nashua City-wide Buildout Results Current 1 Additional At Buildout Population 87,285 6,772 94,057 Persons per Household Housing units 35,737 2,753 38,490 Single family Housing 18,569 1,729 20,298 Multi family Housing units (incl. Mobile Home) 17,168 1,024 18,192 Multi family lots 3 3, ,487 Multi family Housing units per lot Commercial/retail lots ,042 Commercial/retail Sq feet 5 14,874,540 3,043,692 17,918,232 Office lots Office square feet 6 3,326,286 1,607,082 4,933,368 Industrial lots Industrial square feet 7 10,667,710 7,508,825 18,176,535 1Current Population and Housing units based on NH Office of Energy and Planning 2003 Estimates. 2 Persons per Household based on U.S. Census 2000 figures. 3 Number of Multi family, Commercial, Office & Industrial lots derived from NRPC GIS database. 4 Current Multi family housing units divided by multi family lots. 5 Based on Nashua average of 17,196 square feet per lot. 6 Based on Nashua average of 18,687 square feet per lot. 7 Based on Nashua average of 51,785 square feet per lot. 54 Nashua Regional Planning Commission


55 COMMUNITIES Table 4-20: Nashua Buildout Results by Zoning District Zoning Lots Single Family Multi family Office Developable Acres Commercial Industrial R R R R R-A R-B R-C LB GB CB HB PI GI AI PRD Total: 1,070 2,334 1, Detailed worksheet tables used in the buildout to inventory zoning classifications and land use type ratios can be found in Appendix B. Map 4-11: Nashua Estimated New Lots at Buildout Source: NRPC Buildout Analysis - October 2005 Nashua Regional Planning Commission 55
56 K. PELHAM Results of the buildout analysis for the Town of Pelham are included in Table 4-21 below. The buildout study estimates that an additional 4,026 housing units are possible in Pelham, of which 3,783 will be single family houses and 243 will be multi family units. This represents a 101% increase from 3,967 current housing units to 7,993 housing units at buildout COMMUNITIES Using the population multiplier of 3.03 persons per household, based on the 2000 census, population increases by 12,199 persons, from 11,986 to 24,185 at buildout. Commercial (retail/service) space is estimated to increase by 39% from 436,800 square feet to 605,280 square feet. Office space is estimated to increase by 233% from 46,914 square feet to 156,380 square feet. Industrial space is estimated to increase by 188% from 590,450 square feet to 1,700,496 square feet. Table 4-21: Pelham Town-wide Buildout Results Current 1 Additional At Buildout Population 11,986 12,199 24,185 Persons per Household Housing units 3,967 4,026 7,993 Single family Housing 3,507 3,783 7,290 Multi family Housing units (incl. Mobile Home) Multi family lots Multi family Housing units per lot Commercial/retail lots Commercial/retail square feet 5 436, , ,280 Office lots Office square feet 6 46, , ,380 Industrial lots Industrial square feet 7 590,450 1,110,046 1,700,496 1Current Population and Housing units based on NH Office of Energy and Planning 2003 Estimates. 2 Persons per Household based on U.S. Census 2000 figures. 3 Number of Multi family, Commercial, Office & Industrial lots derived from NRPC GIS database. 4 Current Multi family housing units divided by multi family lots. 5 Based on region-wide average (excluding Nashua) of 6,240 square feet per lot. 6 Based on region-wide average (excluding Nashua) of 7,819 square feet per lot. 7 Based on region-wide average (excluding Nashua) of 23,618 square feet per lot. The Town of Pelham has implemented an Elderly Housing Overlay District that allows for higher density housing where implemented. Elderly Housing regulations allow for up to 40 dwelling units per acre with 30% of land set aside as open space. Based on recommendations from Town officials, ten percent (10%) of the acres in the Rural District were designated as Elderly Housing. These higher density areas significantly increased the housing and population of Pelham at buildout. Without the inclusion of this district, housing units and population at buildout in Pelham would have been estimated at 50% less, or approximately 8,000 additional residents at buildout. The new housing estimated under the Elderly Housing District was not included in the estimate of students at buildout. If all of these properties are developed as single family housing and not as elderly housing, Pelham s student estimate at buildout would be 3,245 students, 183 more than the 3,062 reported on page Nashua Regional Planning Commission
57 COMMUNITIES Table 4-22: Pelham Buildout Results by Zoning District Zoning Lots Single Family Multi family Office Developable Acres Commercial Industrial B I R ,023 1, RCA RU EH 239 1,840 1,840 Total: 2,376 3,952 3, Detailed worksheet tables used in the buildout to inventory zoning classifications and land use type ratios can be found in Appendix B. Map 4-12: Pelham Estimated New Lots at Buildout Source: NRPC Buildout Analysis - October 2005 Nashua Regional Planning Commission 57
58 L. WILTON Results of the buildout analysis for the Town of Wilton are included in Table 4-23 below. The buildout study estimates that an additional 915 housing units are possible in Wilton, of which 827 will be single family houses and 88 will be multi family units. This represents a 62% increase from 1,474 current housing units to 2,389 housing units at buildout. COMMUNITIES Using the population multiplier of 2.65 persons per household, based on the 2000 Census, population increases by 2,425 persons, from 3,787 to 6,212 at buildout. Commercial (retail/service) space is estimated to increase by 25% from 343,200 square feet to 430,560 square feet. Office space is estimated to increase by 255% from 86,009 square feet to 304,941 square feet. Industrial space is estimated to increase by 53% from 448,742 square feet to 684,922 square feet. Table 4-23: Wilton Town-wide Buildout Results Current 1 Additional At Buildout Population 3,787 2,425 6,212 Persons per Household Housing units 1, ,389 Single family Housing 1, ,005 Multi family Housing units (incl. Mobile Home) Multi family lots Multi family Housing units per lot Commercial/retail lots Commercial/retail square feet 5 343,200 87, ,560 Office lots Office square feet 6 86, , ,941 Industrial lots Industrial square feet 7 448, , ,922 1Current Population and Housing units based on NH Office of Energy and Planning 2003 Estimates. 2 Persons per Household based on U.S. Census 2000 figures. 3 Number of Multi family, Commercial, Office & Industrial lots derived from NRPC GIS database. 4 Current Multi family housing units divided by multi family lots. 5 Based on region-wide average (excluding Nashua) of 6,240 square feet per lot. 6 Based on region-wide average (excluding Nashua) of 7,819 square feet per lot. 7 Based on region-wide average (excluding Nashua) of 23,618 square feet per lot. 58 Nashua Regional Planning Commission


59 COMMUNITIES Table 4-24: Wilton Buildout Results by Zoning District Zoning Lots Single Family Multi family Office Developable Acres Commercial Industrial RD R&A C IN OPD Total: 1, Detailed worksheet tables used in the buildout to inventory zoning classifications and land use type ratios can be found in Appendix B. Map 4-13: Wilton Estimated New Lots at Buildout Source: NRPC Buildout Analysis - October 2005 Nashua Regional Planning Commission 59
60 COMMUNITIES This page left intentionally blank 60 Nashua Regional Planning Commission


61 Figure A-1: The Buildout Model Step-by-Step GIS Model Nashua Regional Planning Commission 61
Appendix F PENNSYLVANIA LOCAL PARKS AND THE COMMUNITIES THEY SERVE
 Appendix F PENNSYLVANIA LOCAL PARKS AND THE COMMUNITIES THEY SERVE August 8, 2014 By The Center for Rural Pennsylvania Profile Data Profiles and Analysis Introduction To assist in the development of the
FIRE AND RESCUE. Intent
 FIRE AND RESCUE Intent The Fire and Rescue Plan is designed to maintain Prince William County as a safe community, reducing loss of life, injury, and property from fire and/or accident. The mission of
PREPARED FOR: PLATTEVIEW ROAD CORRIDOR STUDY EXECUTIVE SUMMARY
 PREPARED FOR: PLATTEVIEW ROAD CORRIDOR STUDY EXECUTIVE SUMMARY SEPTEMBER 2016 Introduction The Platteview Road Corridor Study was led by the Metropolitan Area Planning Agency (MAPA) with assistance from
Ten Mile Creek Planning Area
 PLANNING AREA POLICIES TEN MILE CREEK Ten Mile Creek Planning Area Location and Context The Ten Mile Creek Planning Area ( Ten Mile Creek area ) is located south of the current Boise AOCI, generally south
Cumberland Comprehensive Plan Town Council adopted August 2003, State adopted June 2004 TABLE OF CONTENTS
 TABLE OF CONTENTS I. Executive Summary A. Scope of the Comprehensive Plan I-2 B. Plan Development Process I-3 C. Plan Format I-3 D. Acknowledgements I-4 II. Demographic Analysis A. Introduction II-1 B.
OPEN SPACE CHAPTER 7: OVERVIEW. Preserve open space to protect natural resources, enhance character and provide passive recreation opportunities
 CHAPTER 7: OPEN SPACE OVERVIEW Ridgefield has made tremendous progress permanently preserving areas of town as open space. Open space preservation can serve many important purposes, including: protect
SECTION 1 Introduction...1. SECTION 2 Regional Context Criteria for Planning Districts Description of Planning District...
 Table of Contents SECTION 1 Introduction...1 SECTION 2 Regional Context...2 2.1 - Criteria for Planning Districts...2 2.2 - Description of Planning District...2 SECTION 3 Goals & Objectives...5 SECTION
Land Use and Community Design
 2 Land Use and Community Design 2.1 Introduction An understanding of the Merrimack s historic and existing land use patterns, regulations, growth trends, natural resources, and infrastructure is useful
495/MetroWest Development Compact Plan Citizen Planner Training Collaborative Conference. March 17, 2012
 495/MetroWest Development Compact Plan Citizen Planner Training Collaborative Conference March 17, 2012 Project Process Local and Regional Priority Areas Growth Scenarios Transportation Investment Categories
Section 2 Study Area
 Study Area Section 2 Study Area 2-1 Purpose This section describes the study area of the Update and discusses the existing and future land uses within the study area. 2-2 Location The study area, as shown
LAND USE MODEL UPDATE. Planning and Land Use Advisory Committee Meeting #2 September 4, 2014
 1 LAND USE MODEL UPDATE Planning and Land Use Advisory Committee Meeting #2 September 4, 2014 2 Presentation Outline Introduction and Recap Model Process Study Design Place Types Suitability Factors 3
Chapter 10 IMPLEMENTATION RECOMMENDATIONS
 Chapter 10 IMPLEMENTATION RECOMMENDATIONS The recommended land use plan presented in the previous chapter provides a design for the attainment of the urban and rural development and open space preservation
Open Space and Farmland Preservation
 Vibrant. Green. Connected. Competitive. Open Space and Farmland Preservation Statement of Purpose The purpose of this section of the Plan is to encourage and support the preservation of open space areas
TOWN OF SPRINGFIELD, NEW HAMPSHIRE
 TOWN OF SPRINGFIELD, NEW HAMPSHIRE NATURAL RESOURCES INVENTORY EXECUTIVE SUMMARY March 2008 Prepared by: Watershed to Wildlife, Inc. Natural Resource Consultants 42 Mill Street, Suite 3 Littleton, NH 03561
TABLE OF CONTENTS. Transportation Chapter 1 - Introduction and Purpose of Planning to 1-3. Utilities
 Chapter 1 - Introduction and Purpose of Planning... 1-1 to 1-3 Pennsylvania Municipalities Planning Code (Act 247)...1-1 Previous County Planning Activities...1-1 Objectives of the Plan...1-2 Elements
Overview of Southwestern Pennsylvania Commission s (SPC) 2040 Long Range Transportation Plan (LRTP)
 2040 Long Range Transportation Plan (LRTP)") Overview of Southwestern Pennsylvania Commission s (SPC) 2040 Long Range Transportation Plan (LRTP) Presented to Pennsylvania Agency Coordination Meeting May 27, 2015 Doug Smith & Ryan Gordon 1 Southwestern
Overview of Southwestern Pennsylvania Commission s (SPC) 2040 Long Range Transportation Plan (LRTP) Presented to Pennsylvania Agency Coordination Meeting May 27, 2015 Doug Smith & Ryan Gordon 1 Southwestern
Land Use. Chapter 8: Introduction. Land Use Vision. Section I: Current Land Use 8-1
 Introduction Land use is the defining element of the comprehensive plan. It will serve as a framework for decision makers, guiding future growth and development in the Town of Oconto Falls. This chapter
Gold Line Bus Rapid Transit Transit Oriented Development (BRTOD) Helmo Station Area Plan
 Helmo Station Area Plan") Appendix F Gold Line Bus Rapid Transit Transit Oriented Development (BRTOD) Helmo Station Area Plan Introduction and Purpose of the Plan The Gold Line Bus Rapid Transit facility is an eleven-mile dedicated
Appendix F Gold Line Bus Rapid Transit Transit Oriented Development (BRTOD) Helmo Station Area Plan Introduction and Purpose of the Plan The Gold Line Bus Rapid Transit facility is an eleven-mile dedicated
CHAPTER 4 - LAND USE CLASSIFICATIONS
 CHAPTER 4 - LAND USE CLASSIFICATIONS Four new land use classification categories are established in the Gualala Town Plan: Gualala Village Mixed Use; Gualala Highway Mixed Use; Gualala Planned Development
Land Use Amendment in Southwood (Ward 11) at and Elbow Drive SW, LOC
 at and Elbow Drive SW, LOC") 2018 November 15 Page 1 of 10 EXECUTIVE SUMMARY This land use amendment application was submitted by Rick Balbi Architect on 2017 August 31 on behalf of Sable Developments Ltd, and with authorization from
2018 November 15 Page 1 of 10 EXECUTIVE SUMMARY This land use amendment application was submitted by Rick Balbi Architect on 2017 August 31 on behalf of Sable Developments Ltd, and with authorization from
BLACK/HARMONY/FAREWELL CREEK WATERSHED EXISTING CONDITIONS REPORT CHAPTER 5 IMPERVIOUS SURFACES
 BLACK/HARMONY/FAREWELL CREEK WATERSHED EXISTING CONDITIONS REPORT CHAPTER 5 IMPERVIOUS SURFACES Draft November 2009 TABLE OF CONTENTS 1.0 INTRODUCTION... 3 2.0 STUDY AREA AND SCOPE... 4 3.0 METHODOLOGY...
FUTURE LAND USE PLAN 7
 FUTURE LAND USE PLAN 7 The recommendations of each of the preceding chapters can be combined to present an overall Future Land Use Plan for Wilton. The Future Land Use Plan, presented on the following
Joint Meeting City Council and the Plan Commission. September 1st, 2015
 Joint Meeting City Council and the Plan Commission September 1st, 2015 1 The City Plan Commission shall recommend a City Plan for the physical development of the City Article IX Section 2 of the City of
Tri-County Transportation & Land Use Study. Steering Committee Meeting May 14, 2009
 Tri-County Transportation & Land Use Study Steering Committee Meeting May 14, 2009 Agenda Recap of Study Goals and Objectives Update on CV Land Use Model: Business as Usual (BAU) Growth Scenario Pros vs
CITY OF COLWICH COMPREHENSIVE PLAN LAND USE LAND USE 1
 LAND USE LAND USE 1 WHAT YOU WILL FIND IN THIS CHAPTER: Discussion of today s conditions and tomorrow s projections Discussion of challenges and opportunities Discussion of the environmental quality goals,
ALBEMARLE COUNTY CODE CHAPTER 18 ZONING SECTION 20A NEIGHBORHOOD MODEL - NMD
 CHAPTER 18 ZONING SECTION 20A NEIGHBORHOOD MODEL - NMD Sections: 20A.1 PURPOSE AND INTENT 20A.2 STATUS AS A PLANNED DEVELOPMENT DISTRICT 20A.5 CODES OF DEVELOPMENT 20A.6 PERMITTED USES 20A.7 RESIDENTIAL
Innovative Land Use Techniques
 Innovative Land Use Techniques A Handbook for Sustainable Development Eric Williams, Assistant Administrator, NHDES Carolyn Russell, Principal Planner, NHDES Cliff Sinnott, Executive Director, RPC Jill
Comprehensive Plan. Faribault, Minnesota. Hoisington Koegler Group Inc. Claybaugh Preservation Architecture Inc. Howard R. Green Company Bonz/REA
 Comprehensive Plan Faribault, Minnesota Adopted by the Faribault City Council July 8, 2003 prepared for: prepared by: Hoisington Koegler Group Inc. Claybaugh Preservation Architecture Inc. Howard R. Green
Section 3: Land Use M C H E N R Y K A N E. Figure 3.1: Potential Future Municipal Boundaries. Future Municipal Boundaries. County Land Use Plans
 Section 3: Land Use Figure 3.1: Potential Future Municipal Boundaries Land use and transportation are intertwined; yet, land use and transpor- tation planning are often undertaken as separate disciplines.
E. RURAL COMMERCIAL/INDUSTRIAL PARK MODEL
 E. RURAL COMMERCIAL/INDUSTRIAL PARK MODEL 1. PURPOSE The purpose of the Rural Commerce/Industrial Park Model is to provide parameters within which a grouping of business buildings with parking, loading
Secrest Short Cut and Monroe Expressway Small Area Plan AUGUST 29, 2018
 Secrest Short Cut and Monroe Expressway Small Area Plan AUGUST 29, 2018 Background and Process Monroe Expressway will be open by the end of 2018 Union County and Indian Trail identified a need to revisit
Rural Land Use Designations Kittitas County December 6, 2007 Draft
 KITTITAS COUNTY COMMUNITY DEVELOPMENT SERVICES 411 N. Ruby St., Suite 2, Ellensburg, WA 98926 CDS@CO.KITTITAS.WA.US Office (509) 962-7506 Fax (509) 962-7682 Rural Land Use Designations Kittitas County
Scorecard. WaterQuality. Appendix B USEPA WATER QUALITY SCORECARD APPENDIX B
 Appendix B USEPA WATER QUALITY SCORECARD EPA 231B09001 October 2009 http://www.epa.gov WaterQuality Scorecard Incorporating Green Infrastructure Practices at the Municipal, Neighborhood, and Site Scales
Westport Master Plan. Town of Westport. Master Plan Master Plan Update Committee. Westport, Massachusetts
 Town of Westport Master Plan 2004 Master Plan Update Committee Westport, Massachusetts Open Space and Recreation 5-1 Table of Contents Table of Contents... i List of Tables... ix List of Figures... ix
LAND USE OVERVIEW WHAT YOU WILL FIND IN THIS CHAPTER
 LAND USE WHAT YOU WILL FIND IN THIS CHAPTER Information about the City s expected population and employment growth. Description and capacity of existing and future land use designations. Policies that
Improve Neighborhood Design and Reduce Non Point Source Water Pollution
 HOW TO Planning Guide Improve Neighborhood Design and Reduce Non Point Source Water Pollution This document was funded by a grant from the New Hampshire Coastal Program with funding from the National Oceanic
6 Growth Management Challenges and Opportunities
 6 Growth Management Challenges and Opportunities The Town has established a goal of attaining a 50% participation rate with respect to employment opportunities versus residential population. The Town s
Sacramento Area Council of Governments (SACOG)
") Sacramento Area Council of Governments (SACOG) The Blueprint Vision The SACOG Board of Directors adopted the Preferred Blueprint Scenario in December 2004, a bold vision for growth that promotes compact,
Sacramento Area Council of Governments (SACOG) The Blueprint Vision The SACOG Board of Directors adopted the Preferred Blueprint Scenario in December 2004, a bold vision for growth that promotes compact,
TOWN OF BETHLEHEM OPEN SPACE CONSERVATION PLAN PUBLIC MEETING: OCTOBER 12, 2017
 TOWN OF BETHLEHEM OPEN SPACE CONSERVATION PLAN PUBLIC MEETING: OCTOBER 12, 2017 Welcome and Agenda 6:00 6:45: Open House, Part One 6:45 7:15: Presentation and Questions 7:15 8:00: Open House, Part Two
East Corridor Final Environmental Impact Statement
 East Corridor Final Environmental Impact Statement Alternatives Considered Operating Plan The requirements for opening day operations versus year 2030 are based on ridership and operations. Opening day
Comprehensive Development Guide
 INDUSTRIAL ELEMENT Comprehensive Development Guide 1 Industrial Element 7.1 Hardin County Industrial Overview BG PKWY Fort Knox Industrial Corridor Comprised of 11 parcels totaling 720 acres of land 68
SECTION ONE: INTRODUCTION. introduction
 introduction 1 INTRODUCTION Since it was first established in 1843 as a trading post for the Hudson s Bay Company, Victoria has evolved into a Provincial capital city that is recognized across Canada and
Land Use Element Inventory
 Land Use Element Inventory I. Introduction..1 II. History of Land Use Planning..4 III. Lincoln's Current Land Use Pattern....6 IV. Growth Projections 12 V. Zoning Review...20 VI. Future Land Use Map..22
NEW CASTLE COUNTY S ZONING DISTRICTS
 NEW CASTLE COUNTY S ZONING DISTRICTS This is general information about New Castle County s zoning districts. The information included is by no means exhaustive or complete. Before designing plans to develop
Section 4 BUILDING THE MASTER PLAN
 The Master Plan 33 Section 4 BUILDING THE MASTER PLAN Figure 4:1. A collaborative effort characterized the two design workshops sponsored by DISC to create hypothetical Master Plans for the Towers Property
Case Study: City of San Mateo
 Published on GreenPlan-IT (http://greenplanit.sfei.org) Home > Archived Materials > GreenPlan-IT Toolkit Demonstration Report > Chapter 2. Case Study: City of San Mateo Case Study: City of San Mateo Chapter
Town of Rico Three Mile Plan for Annexation
 Town of Rico Three Mile Plan for Annexation 10.20.2010 Adopted by Resolution 2010-2 Produced with funding support from the Colorado Department of Local Affairs 2 Content Guide Introduction. 3 Annexation
Chapter 2: Land Use Element
 Chapter 2: Land Use Element CHAPTER 2: LAND USE ELEMENT A VISION FOR LAND USE As Lake Stevens continues to grow in population and area, the city will strive to create balanced opportunities for residential
Silver Line CPAM UPDATE. Transportation and Land Use Committee October 14, 2016
 Silver Line CPAM UPDATE Transportation and Land Use Committee October 14, 2016 Purpose Recap Project History and Map Changes Provide Overview of CPAM Components Discuss Transportation Impacts Discuss Fiscal
IMPLEMENTATION STRATEGIES. In This Chapter. Goals & Strategies 182 Project List 183 Future Land Use 186 CHAPTER 11 IMPLEMENTATION STRATEGIES
 In This Chapter Goals & Strategies 182 Project List 183 Future Land Use 186 11 IMPLEMENTATION STRATEGIES NORTH AUGUSTA, SC 2017 COMPREHENSIVE PLAN 179 Individual commitment to a group effort that is what
TRANSPORTATION AND LAND USE
 CHAPTER 10 TRANSPORTATION AND LAND USE Transportation and land use are intimately linked. The expansion of a highway typically spurs housing, employment growth and land development in the communities that
Miami Valley Regional Planning Commission Regional Land Use Planning
 Miami Valley Regional Planning Commission Regional Land Use Planning This document provides an overall approach on the region-based land use planning process, outlining the major tasks and work elements
City of Chickasaw Land Use Comprehensive Plan 2030 Chapter5-Draft(2)Public review_
Public review_") Land Use Land Use refers to the activity or development characteristics of a given parcel of land. The Land Use Plan presented in the following pages, represents the City of Chickasaw s official position
Land Use Land Use refers to the activity or development characteristics of a given parcel of land. The Land Use Plan presented in the following pages, represents the City of Chickasaw s official position
3.10 LAND USE SETTING PROJECT SITE EXISTING LAND USE DESIGNATIONS AND ZONING. General Plan Land Use Designations.
 This section of the Draft EIR addresses the existing land uses on and adjacent to the project site and discusses the potential impacts of the proposed project on existing land uses. Key issues addressed
Water Master Plan. March Prepared by: Prepared for:
 Water Master Plan March 2016 Prepared by: Prepared for: WATER MASTER PLAN March 2016 Prepared for: Prepared by: WATER MASTER PLAN TABLE OF CONTENTS Page No. CHAPTER 1 INTRODUCTION... 1-1 Introduction...
Town of Washington Master Plan & Regulatory Audit: Interim Results
 Town of Washington Master Plan & Regulatory Audit: Interim Results May 20, 2008 Presented by: 30 Bank Street Lebanon, NH 03766 www.uvlsrpc.org Introduction & Purpose Compare the Master Plan to the regulations
Environmental: Urban land..51 acre wet (.30%); 1.01 acres/.59% within a 100 year floodplain; no other environmental indicators limit development.
; 1.01 acres/.59% within a 100 year floodplain; no other environmental indicators limit development.") A N DOV ER Downtown: Designated a State PDA Land Use: Downtown Andover (171.61 acres) is the Town s traditional central business district. It consists of offices, shops, restaurants, civic and institutional
A N DOV ER Downtown: Designated a State PDA Land Use: Downtown Andover (171.61 acres) is the Town s traditional central business district. It consists of offices, shops, restaurants, civic and institutional
Sorted citizen input comments in review of Blount County plans July, August, and September 2007
 Sorted citizen input comments in review of Blount County plans July, August, and September 2007 The following presents sorted citizen input comments from three sessions held in July, August and September
A BLUEPRINT FOR BROCKTON A CITY-WIDE COMPREHENSIVE PLAN
 A BLUEPRINT FOR BROCKTON A CITY-WIDE COMPREHENSIVE PLAN Public Meeting October 2016 1 Plan Summary and Discussion Public Meeting May 4 2017 City of Brockton Bill Carpenter, Mayor Department of Planning
Economic Development & Housing Council Committee Comprehensive Plan Update September 20, 2005
 1 Economic Development & Housing Council Committee Comprehensive Plan Update September 20, 2005 Purpose To update the Committee on the ForwardDallas! Plan, including: Status Anticipated Products Public
HAZARD MITIGATION GOALS AND OBJECTIVES
 SEWRPC Community Assistance Planning Report No. 282, 2nd Edition CITY OF MILWAUKEE ALL HAZARDS MITIGATION PLAN UPDATE Chapter IV HAZARD MITIGATION GOALS AND OBJECTIVES [NOTE: Throughout this plan update
Total acreage of Bloomsburg 3,014. Percentage of land used by intensive land uses 49.7% Percentage of land used by open space land uses 42.
 Land Use by the Numbers Total acreage of Bloomsburg 3,014 Percentage of land used by intensive land uses 49.7% Percentage of land used by open space land uses 42.8% Percentage of other lands (water) 7.5%
Table IX-1 LAND USES IN WASHINGTON COUNTY: 2006
 #128550 v1 - WASH CO CP TBL I-1 2006 LU NMA/RLR 12/21/07 Table I-1 LAND USES IN WASHINGTON COUNTY: 2006 Note: This table, and the accompanying map, is more general than the land use inventory conducted
PART 1: PROJECT SUMMARY. The application is Attachment A. The site plan is Attachment B.
 Belleterre Subdivision Sketch Plan Town Board 8.7.17 Belleterre Subdivision Sketch Plan PART 1: PROJECT SUMMARY Applicant: Bowman Development Project Size: +/- 20.85 acres Parcel Number: 01115104 and 01115121
THAT the attached Terms of Reference for the Thornhill Centre Street Study be approved.
 COMMITTEE OF THE WHOLE AUGUST 18, 2003 THORNHILL CENTRE STREET STUDY PLANNING FILE: 15.92 Recommendation The Commissioner of Planning recommends: THAT the attached Terms of Reference for the Thornhill
COLVER ROAD INDUSTRIAL CONCEPT PLAN
 COLVER ROAD INDUSTRIAL CONCEPT PLAN A CONCEPTUAL LAND USE AND TRANSPORTATION PLAN FOR TA-4 AN URBAN RESERVE AREA OF THE CITY TALENT City of Talent Adopted by City Council Resolution No., June, 2015 PART
Draft CHAPTER TWO THREE LAND USE PLAN
 CHAPTER TWO THREE LAND USE PLAN LAND USE PLAN The basic intent of the comprehensive planning process is to provide a well-founded and coordinated decision-making framework to guide both public and private
NORTH-SOUTH CORRIDOR STUDY EXECUTIVE SUMMARY. Executive Summary
 Executive Summary Background As congestion continues to affect mobility in the region, the Ozarks Transportation Organization (OTO) is particularly concerned with traffic movement. The North-South Corridor
Riparian Buffer on the Bushkill Creek. Policies
 Riparian Buffer on the Bushkill Creek Riparian buffers provide numerous benefits to landowners and the community by protecting groundwater recharge areas, providing flood control, providing stormwater
FREEDOM S WAY GIS INVENTORY
 APPENDIX F FREEDOM S WAY GIS INVENTORY Freedom s Way National Heritage Area (FWNHA) is required by its enabling legislation to prepare an inventory of natural, historical, and recreational resources within
ROAD CLOSURE AND LAND USE AMENDMENT SILVER SPRINGS (WARD 1) NORTHEAST OF NOSEHILL DRIVE NW AND SILVER SPRINGS ROAD NW BYLAWS 2C2018 AND 29D2018
 NORTHEAST OF NOSEHILL DRIVE NW AND SILVER SPRINGS ROAD NW BYLAWS 2C2018 AND 29D2018") Page 1 of 19 EXECUTIVE SUMMARY This application proposes redesignating two parcels in the community of Silver Springs from Special Purpose Future Urban Development (S-FUD) District and undesignated road
Page 1 of 19 EXECUTIVE SUMMARY This application proposes redesignating two parcels in the community of Silver Springs from Special Purpose Future Urban Development (S-FUD) District and undesignated road
A story worth telling
 A story worth telling INSIDE COVER PAGE MAY BALSAMA Formerly Souhegan Valley Chamber of Commerce KATHY HERSH City of Nashua JANET LANGDELL Town of Milford SARAH MARCHANT City of Nashua SHAUNAE NOLET
Sustainably Repositioning Greyfield Sites. Greyfield Sites Anywhere
 Sustainably Repositioning Greyfield Sites Jim Constantine Looney Ricks Kiss Architects Todd Poole 4ward Planning Greyfield Sites Anywhere Pennsylvania Chapter American Planning Association Conference 2009
Colerain Township report to. Hamilton County Regional Planning Commission. December 2, 2010, 1:00PM. t a f f r e p o r t
 Colerain Township report to Hamilton County Regional Planning Commission December 2, 2010, 1:00PM Preliminary Plan: Case No.: ZA2001-04, Forevergreen Prepared By: Amy Bancroft, Land Use Planner t a f f
The South Macleod Trail Community and Employment Centre
 The South Macleod Trail Community and Employment Centre Community and Neighbourhood Planning Module Context During the 1950s, the movement of people away from urban centres led to the evolution of the
SHEFFIELD PARK Paulding County, GA DRI #588
 SHEFFIELD PARK Paulding County, GA DRI #588 Supplemental Information for RDC s DRI (Form 2) Review August 16, 2004 Prepared for: Mr. David Howerin Coosa Valley RDC 1 Jackson Hill Drive Rome, GA 30161 P.O.
Chesapeake Bay Critical Area Conservation Plan
 The Maryland-National Capital Park and Planning Commission Prince George s County Planning Department Development Review Division 301-952-3530 Note: Staff reports can be accessed at www.mncppc.org/pgco/planning/plan.htm.
CITY OF GRIDLEY 2030 General Plan
 I TABLE OF CONTENTS Page INTRODUCTION... 1 Relationship to Other Elements... 1 Areas Covered by the... 2 Planned Growth Area... 5 BUILDOUT ESTIMATES... 9 Buildout in the Planned Growth Area... 10 Buildout
Citizen Comment Staff Response Staff Recommended Revision Planning Committee
 Citizen Comment Staff Response Staff Recommended Revision Planning Committee Area No. 1: Owner desires retail land uses. Area No. 1a: Owner of two small parcels adjacent to Area No. 1 desires retail land
Exhibit A Comprehensive Plan Amendments
 Exhibit A Comprehensive Plan Amendments May 2010 Draft Chapter One - Introduction Chapter One INTRODUCTION NOTE: For brevity and ease in viewing the proposed changes, portions of chapter one that are not
Transportation Research Center
 Increasing Design Flexibility in the AASHTO Green Book Your Department Name Presentation to AASHTO Subcommittee on Design Doug Harwood, MRIGlobal July 2017 Transportation Research Center Resolution of
SUSSEX COUNTY COMPREHENSIVE PLAN COUNTY PLANNING AND ZONING COMMISSION WORKSHOP
 SUSSEX COUNTY COMPREHENSIVE PLAN COUNTY PLANNING AND ZONING COMMISSION WORKSHOP August 21, 2017 TODAY S WORKSHOP Public Comment Utilities Update Economic Development Update Future Land Use Discussion Public
The Salt Marsh Advancement Zone Assessment of Connecticut
 The Salt Marsh Advancement Zone Assessment of Connecticut Front cover image: Salt marsh advancement zones in Stratford, CT from the Comprehensive Map Book of Stratford, CT. Table of Contents Introduction...
Section XI RELATIONSHIP TO OTHER PLANS
 Section XI RELATIONSHIP TO OTHER PLANS INTRODUCTION The land development plans 1 for the municipalities bordering West Windsor were reviewed to determine their relative compatibility to the planning policies
4-Town Comprehensive Plan DRAFT 7/30/07
 4-Town Comprehensive Plan DRAFT 7/30/07 Acknowledgements ning Committee Town of Harrisburg Norman Roof Randy Nicol Town of Martinsburg Terry Thisse Paul Kelly Town of Montague Jan Bagdanowicz Wendy Perry
USA Addition of South & East Side Residential Parcels. USA Deletion of a Town of Christiana Parcel. Conversion from USA to Limited Service Area
 Village of Rockdale Village of Rockdale 148 Water Street Cambridge, WI 53523 Phone 608.423.1497 Fax 608.423.9694 Urban Service Area (USA) Amendment USA Addition of South & East Side Residential Parcels
Definitions. Average Daily Traffic Demand (ADT): The actual number or projected number of cars that pass a point in a 24-hour period.
: The actual number or projected number of cars that pass a point in a 24-hour period.") Definitions Access Management: A combination of physical techniques and transportation policies used to control the flow of traffic between roads and the surrounding lands. Alternative City Form Scenarios:
Definitions Access Management: A combination of physical techniques and transportation policies used to control the flow of traffic between roads and the surrounding lands. Alternative City Form Scenarios:
Humboldt No. 1 Fire Protection District
 Humboldt No. 1 Fire Protection District Municipal Service Review September 2008 Prepared for Development of the District Sphere of Influence Report TABLE OF CONTENTS Page Local Agency Formation Commission
Chapter 13: Implementation Plan
 Implementation A. Introduction The Implementation Plan, in table form on the following pages, provides a summary of all the Action Items recommended in Chapters 2 through 12. The table also indicates which
Proposed Water Ski Wakeboard Cable Park (former Cedar Run Horse Park) Kevin Bechard Deputation to Committee of the Whole June 4, 2018
 Kevin Bechard Deputation to Committee of the Whole June 4, 2018") Proposed Water Ski Wakeboard Cable Park (former Cedar Run Horse Park) Kevin Bechard Deputation to Committee of the Whole June 4, 2018 Development Proposal - Comprised of three separate cable systems ;
Proposed Water Ski Wakeboard Cable Park (former Cedar Run Horse Park) Kevin Bechard Deputation to Committee of the Whole June 4, 2018 Development Proposal - Comprised of three separate cable systems ;
Chapter 1 - General Design Guidelines CHAPTER 1 GENERAL DESIGN GUIDELINES
 CHAPTER 1 GENERAL DESIGN GUIDELINES 1.0 INTRODUCTION This Publication has been developed to provide current, uniform procedures and guidelines for the application and design of safe, convenient, efficient
Final Generic Environmental Impact Statement for Adoption of the Town of New Hartford Comprehensive Plan Update
 for Adoption of the Town of New Hartford Comprehensive Plan Update Name of Action: Adoption of the Town of New Hartford Comprehensive Plan Update by the Town of New Hartford Town Board Location: Lead Agency:
DRAFT Land Use Chapter
 Stevens Creek Urban Village DRAFT 1 18 17 Land Use Chapter INTRODUCTION This Land Use Chapter describes how the Stevens Creek Urban Village will accommodate the growth that is planned for it in the Envision
INTRODUCTION PLANNING HISTORY
 INTRODUCTION The Upper Rock Creek Master Plan Area lies in the east central part of Montgomery County. The Master Plan Area is adjacent to the City of Rockville to the south, the Olney Planning Area to
Growth Management Plan for Milford Township, PA: Suitability Analysis and Buildout Scenarios
 Growth Management Plan for Milford Township, PA: Suitability Analysis and Buildout Scenarios Md Mahbubur Rabb Meenar, ASM Abdul Bari, Jesse Sherry ABSTRACT The paper describes the GIS techniques and methods
The transportation system in a community is an
 7 TRANSPORTATION The transportation system in a community is an important factor contributing to the quality of life of the residents. Without a sound transportation system to bring both goods and patrons
Chapter #3 LAND USE AND SCENARIO PLANNING
 Chapter #3 LAND USE AND TABLE OF CONTENTS 3.0 Land Use and Scenario Planning...3-1 3.1 Introduction IMAGINE 2040...3-1 3.2 Background...3-3 3.2.1 4D Analysis...3-3 3.3 Imagine 2040 Scenario Planning...3-7
Planning and Public Consultation Process for the Preparation of a General Land Use Plan for South Port Kells TERMS OF REFERENCE
 APPENDIX "B" Planning and Public Consultation Process for the Preparation of a General Land Use Plan for South Port Kells TERMS OF REFERENCE PURPOSE South Port Kells is located in the northeastern quadrant
City of Royalton Comprehensive Land Use Plan 2005 to Revision February 8, 2011
 City of Royalton Comprehensive Land Use Plan 2005 to 2015 2011 Revision February 8, 2011 PART ONE: INTRODUCTION TO THE COMPREHENSIVE PLAN 1.0 Purpose and Introduction The Comprehensive Land Use Plan provides
4.1 LAND USE AND PLANNING EXISTING CONDITIONS REGULATORY BACKGROUND LAND USES IN THE PLAN AREA SURROUNDING LAND USES
 4.1 LAND USE AND PLANNING This section includes a description of the existing land use plans that apply to the Plan area and a description of existing land uses in the vicinity. It also includes an analysis