I. EXECUTIVE SUMMARY 3 III. MAIN EVENTS IN THE PERIOD 6 IV. RETAIL INDICATORS 7 V. REVENUES BY BUSINESS UNITS 9 VI. CREDIT INDICATORS 11
|
|
|
- Giles Ward
- 6 years ago
- Views:
Transcription

1

2 I. EXECUTIVE SUMMARY 3 II. CONSOLIDATED INCOME STATEMENT AS OF SEPTEMBER 30, III. MAIN EVENTS IN THE PERIOD 6 IV. RETAIL INDICATORS 7 V. REVENUES BY BUSINESS UNITS 9 VI. CREDIT INDICATORS 11 VII. FINANCIAL STRUCTURE 13 VIII. FINANCIAL STATEMENTS OF S.A.C.I. FALABELLA ACCORDING TO IFRS 14 Notes: All dollar figures are calculated using the observed exchange rate of CLP 483,65/US$1 on October 1, Symbols for quarters are: 1Q, 2Q, 3Q and 4Q, as applicable. Other symbols for periods in the year are: 1H for first semester and 9M for the first 9 months of the year. Currency symbols: CLP$: Chilean pesos; US$: U.S. dollars; M: Million. 2
3 I. Executive Summary Third quarter s net profit grew 236.8% compared to the third quarter of 2009 reaching MCLP$81,882 (MUS$169). This growth is explained for higher Operational Income, higher Profit on associates and lower financial costs. The cumulative net profit grew 87.3% compared with the same period of 2009 reaching MCLP$ (MUS$ 505). This increase is due to higher profit in associates and lower financial cost as a consequence of the financial debt restructuring made during the first half of The EBITDA grew 44.9% in 3Q10 compared to the same period last year, to a total of MCLP$154,019 (MUS$318). The EBITDA margin of the quarter rose 2.2 percentage points in comparison to the same period in 2009, to 14.2% of total revenues. On a cumulative basis through September 2010, EBITDA grew 37.7% to MCLP$466,840 (MMUS$ 965). Revenues in the quarter grew 21.6% reaching MCLP$1,081,200 (MUS$2,236). On a cumulative basis through September 30th, consolidated revenues totaled MCLP$3,119,424 (MUS$6,450), representing a growth of 15.5% with respect to the same period in Selling, General and Administrative Expenses continue showing the effects of the measures taken in all businesses in In the third quarter, SG&A fell 1.8 percentage points over total revenues. The cumulative SG&A through September 30 th fell 1.7 percentage points too. Total loans reached MCLP$ (MUS$3.959). The risk level continued falling during the quarter. Consolidated provision over total gross loans reached 3.71% at September 30th. The consolidated leverage was 1.20 at the end of third quarter. Excluding the liabilities of the bank businesses in the group 1, the consolidated leverage was 0.84 times. During the third quarter, five supermarkets were opened: one in Padre Hurtado, Chile, and four in Peru: Isil, Naciones Unidas, Angamos and Tusilagos. In Peru, Open Plaza Angamos was opened. It counts with a Falabella store, a Sodimac, a Tottus, Cinemas, Food courts and other minor attractions. In Chile, a new Imperial was opened in Concepcion during the quarter. In October, a new Sodimac store was opened in Bucaramanga, Colombia. In November, four new stores have been opened. A Falabella and a Sodimac, in the Tortugas Open Mall in Argentina and a Falabella and a Tottus in San Felipe, Chile. 1 These are the operations that did not consolidate under Chilean GAAP: Banco Falabella Chile, Banco Falabella Peru and CMR Colombia. 3


4 II. Consolidated Income Statement as of September 30, 2010 Consolidated Income Statement 9M 2010 (MCLP$) Consolidated Income Statement 3Q 2010 (MCLP$) 4
5 1. Operational Income Operational income grew 58.4%in the third quarter compared to the same period in It totaled MCLP$128,704 (MUS$266). Operating margin in the quarter was 11.9%, that means 2.8 percentage points more than in the third quarter of the previous year. The cumulative operating margin totaled MCLP$386,296 (MUS$799), a 12.4% of total consolidated revenues, i.e. 2.8 percentage points higher than the cumulative operating margin in September Consolidated revenues rose 21.6% in the third quarter. This growth has been seen in Bank and non-banking businesses. Revenues from banking operations grew 21.9% and Non-banking operations ones grew 18.3%. On a cumulative basis, as of September 30 th, the total revenues grew 15.5%in comparison to the same period in the previous year. This growth was driven mainly for the better consumption levels observed in the region due to the higher level in consumer confidence. Other element that also contributed to this growth was the selling area. The 40 stores opened in 2008, in the middle of crisis, are maturing at an accelerated pace. As an example of this, we can mention the case of ex Casa Estrella stores added in December of 2008 or Tottus and Sodimac in Peru which almost duplicated their number of stores during that year. The consolidated gross margin grew 0.9 percentage points in the quarter and 1.1 percentage points on a cumulative basis as of September with respect to the same periods in This improvement has been driven mainly by financial businesses because of the reduction in the loan portfolio risk, which is reflected by the drop in provisions. Retail businesses had their inventory levels very tight, which together with the higher levels of consumption has had a positive effect in the consolidated gross margin. Selling, general and administrative expenses fell 1.8 percentage points as a proportion of total revenues in the quarter and 1.7 percentage points on a cumulative basis as of September. These improvements are the result of company s efforts to keep expenses controlled in all countries and businesses in presence of higher consumption levels. 2. Non-Operating Income The non operating profit of the third quarter reached a loss of MM$ (MUS$41), it represents a reduction of non operating loss of 48.2% compared with the same period of This lower loss is mainly explained by lower financial expenses due to the lower financial debt levels and the effects of financial debt restructuring made in Another fact that has contributed to these results is the higher results obtained from associated companies which has been also impacted for the higher consumption levels in the region. As of September, the non operating loss was MM$ (MMUS$ 129) which represents a reduction of 7.4% of non operating loss compared with the same period of This result, as in the quarter, is mainly due to lower financial expenses. It s important to mention that the higher loss showed as other non operating income / (expenses) includes the provisions made by the February s earthquake in Chile. 5
6 III. Main Events in the Period In July, Tottus Chile opened a store in Padre Hurtado, Chile with a selling area of 2,100m 2. Also in July, two Tottus stores were opened in Peru: Isil with a selling area of 3,800 m 2 and Naciones Unidas with 1,500 m 2. In August, an Imperial store was opened in Hualpen 8 th region in Chile. This new store has a selling area of 3,277 m 2. In September, Open Plaza Angamos was opened in Lima. This new Shopping center have a GLA of 41,922 m 2 and contains a Saga Falabella store of 9,000 m 2, a Sodimac store of 8,377 m 2, a Tottus supermarket of 4,600 m 2, cinemas, food court and other attractions. In September, Falabella communicated its decision to accept the offer launched by Casa Saba for Farmacias Ahumada S.A. The profit obtained from this operation is not incorporated in September s income statement because the effective payment was received in October. Recent Events On October 8th, SACI Falabella prepaid its whole E series corporate bonds for UF 4.5 millions. On October 15th, Sodimac prepaid its whole C series corporate bonds for UF 1.1 millions. In October, a Sodimac store of m2 was opened in Bucaramanga, Colombia. In November, Falabella and Sodimac Tortugas Open Mall were opened in Argentina. Also in November, a Tottus supermarket and a Falabella store were opened in San Felipe, Chile. In November, Mall Plaza announced its plan to open a Shopping mall in Cartagena de Indias. Colombia with an investment of US$ 75 millions. 6
 3 (Nominal Chilean pesos converted to USD at the observed exchange rate for October 1, 2010) Retail")
 2 Does not include financial businesses income.")
7 7 IV. Retail Indicators 1. Retail Business Revenues Cumulative Retail Revenues in (MUS$) 3 (Nominal Chilean pesos converted to USD at the observed exchange rate for October 1, 2010) Retail Revenues 3Q 2010 (MUS$) 2 (nominal Chilean pesos converted to USD at the observed exchange rate for October 1, 2010) Same Store Sales (SSS) Growth 4 (All growth is nominal and has been calculated in the local currency of each country) 2 Does not include financial businesses income. 3 The variation of sales in local currency provides insulation against the effects of the exchange rate in the translation of the financial statements. 4 SSS Colombia does not include Ex Casa Estrella stores

8 2. Number of Stores and Net Selling Area 5 During the quarter, 8 stores and 1 Shopping mall were opened. This Shopping mall, Open Plaza Angamos is owned by Open Plaza, the Real Estate subsidiary of Falabella in Peru which owns a 40% of Aventura Plaza. Open Plaza ANgamos contains a Falabella, a Sodimac, a Tottus supermarket, cinemas and specialist stores. Total selling area growths in 44,593 m 2, it means a growth of 2.2% in the quarter. 5 Soc. Rentas includes only powercenters. These are locations where there are two or more of Falabella formats, in addition to minor stores. 8


9 V. Revenues by Business Units 1. Chile As the first two quarters of 2010, there is a growth in total revenues all business during the quarter and in cumulative terms. Although, all the businesses show an improvement in gross margin, it s especially notorious in CMR because of the lower level of provisions shown. SG&A expenses, as a percentage of revenues, have decreased in almost all businesses with the exception of CMR which has increased its SG&A expenses due to higher expenses in Marketing and clients loyalty. Despite this, CMR operating margin grew 10 percentage points in the third quarter compared with same quarter of last year. Operating Results 3Q 2010 (MUS$) Cumulative Operating Results 2010 (MUS$) 9

10 2. International Operations The growth of revenues shown by International operations during the third quarter of 2010 was stronger than the observed in Chilean operations. This growth has been driven mainly for the maturity of stores opened in During 2008, the Operation of Casa Estrella in Colombia was acquired and Sodimac and Tottus almost duplicated its number of stores in Peru in the same year. All of these new stores showed low levels of sales during 2009, and during the current year they are showing a recovery. With the exception of Peru, where SG&A expenses were affected for the new stores opened in the quarter, SG&A as a percentage of revenues fell compared with same periods of All of this has been possible due to the measures to keep costs down that has been in place during the whole year. Operating Results 3Q 2010 (MUS$) 6 Cumulative Operating Results 2010 (MUS$) 6 Consolidated revenues includes financial businesses: Sodimac has not been included in Colombia 10
 7 Note: Loans in MCLP$ of each period Note: Loans in M Soles of each period 7 Note: Banco Falabella Peru uses the provisions calendar issued by the Peruvian Banking")
11 VI. Credit Indicators 1. Loans and Provisions CMR Chile Banco Falabella Chile Note: Loans in MCLP$ of each period. Banco Falabella Perú (Ex CMR Perú) 7 Note: Loans in MCLP$ of each period Note: Loans in M Soles of each period 7 Note: Banco Falabella Peru uses the provisions calendar issued by the Peruvian Banking and Insurance Commission. It has also maintained additional provisions required some time ago, even though the pro-cyclical rule is no longer in effect. 11


12 CMR Argentina Note: Loans in M Pesos (Arg) of each period Financiera CMR Colombia 2. CMR Card Sales Note: Loans in M Cop of each period. Percentage of Sales using CMR 8 As of September 2010, the total active accounts of CMR per country were as follows: Chile 2.1 millions of accounts, Peru 970 thousand accounts, Argentina 556 thousand accounts and Colombia 637 thousand of accounts. 8 Percentage of sales using CMR : sales using the card as compared to all sales in each businesss. 12

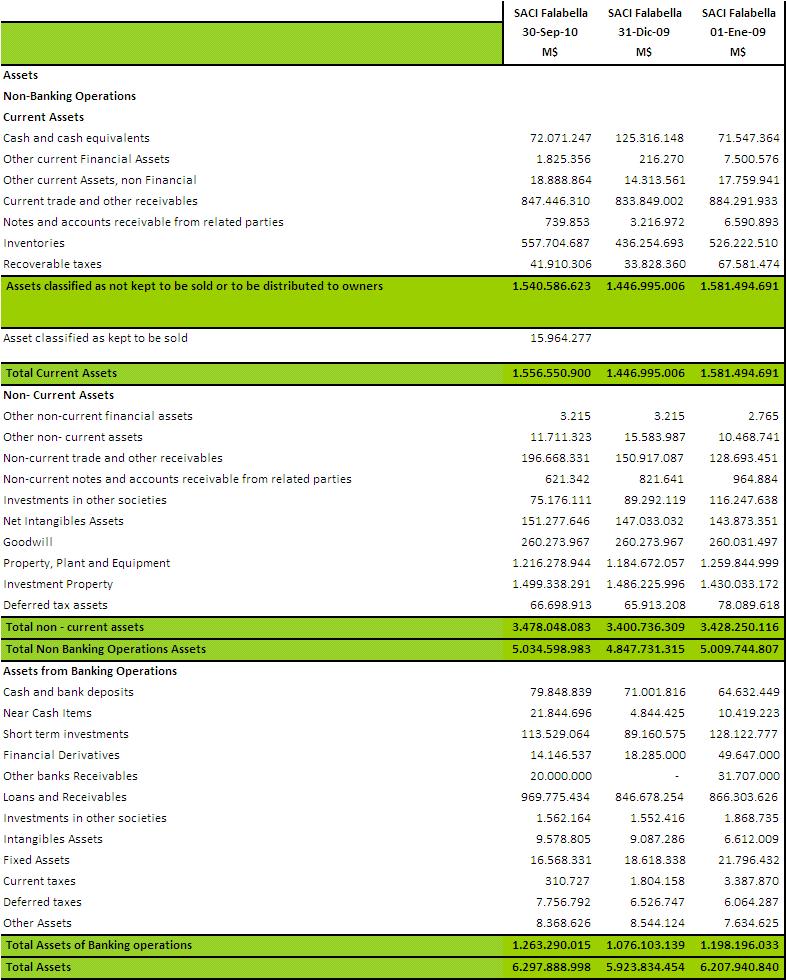
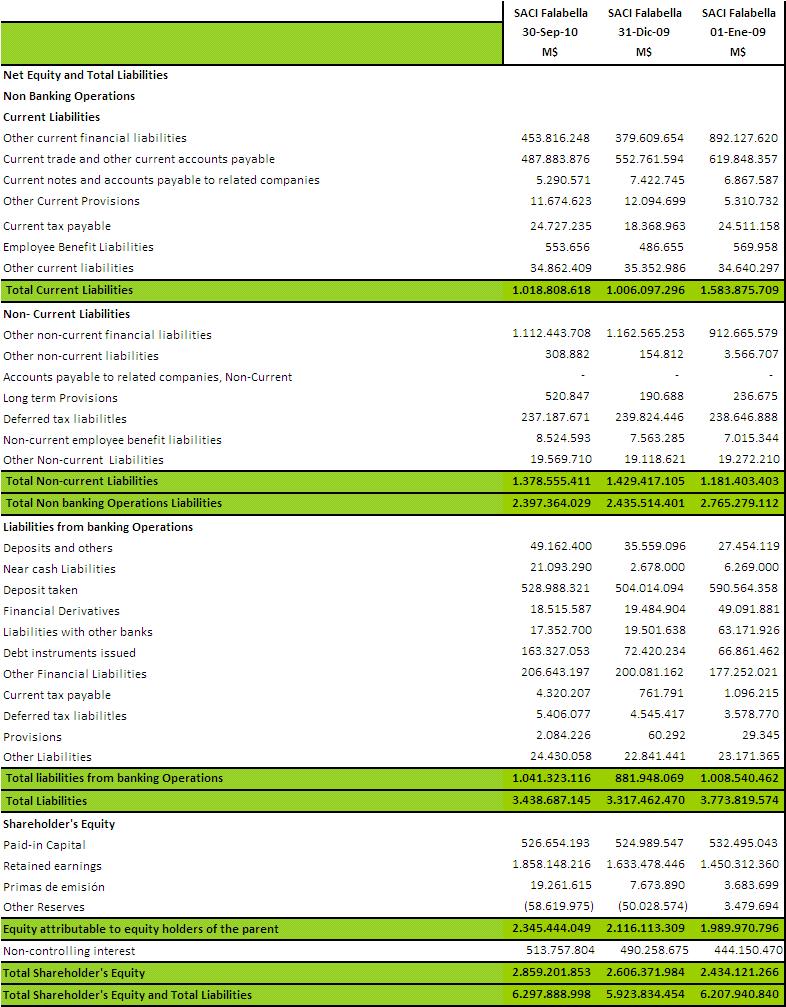
13 VII. Financial Structure Liabilities as of September 30, 2010 totaled MCLP$ (MUS$ 7.110). This mean that there was a leverage of 1.20 times. 9 Total liabilities include Banco Falabella Chile, Banco Falabella Peru and CMR Colombia. Excluding these companies engaged in the banking business the consolidated Leverage is 0.84 times. Excluding these same companies, net financial Leverage was 0.52 times. Leverage 10 0,94 0,87 0,85 0,84 Dic-09 Mar-10 Jun-10 Sep-10 Net Financial Leverage 10 0,54 0,52 0,51 0,52 Dic-09 Mar-10 Jun-10 Sep-10 9 Leverage= total liabilities divided by total shareholder's equity. 10 Figures does not include Bank s liabilities or Financial debt neither cash or Equivalents. 13

14 VIII. Financials Statements of S.A.C.I. Falabella according to IFRS 14
15 15
16 16
 380 2007 Email: inversionistas@falabella.cl Website: www.falabella.com Click on Inversionistas at the page bottom.")
17 S.A.C.I. Falabella Address: Rosas 1665 Santiago, Chile Contacts: Jordi Gaju N. / Humberto Solovera R. Corporate Planning and Development Division Phone: (56 2) inversionistas@falabella.cl Website: Click on Inversionistas at the page bottom. The information in this report was prepared on the basis of the Consolidated Financial Statements reported to the Securities and Insurance Commission (SVS). S.A.C.I. Falabella assumes no liability for damages, injuries or losses that may result from the interpretation of this report or the evolution of markets, in particular the Stock Exchange.
LATIN AMERICA EXECUTIVE CONFERENCE
 LATIN AMERICA EXECUTIVE CONFERENCE January 2013 FALABELLA CONSOLIDATED STATEMENTS BUSINESS UNITS INVESTMENT PLAN MORE THAN 120 YEARS OF HISTORY 1889 Salvatore Falabella opens the first large tailor shop
Santander Conference Acapulco JAN 08
 Santander Conference Acapulco JAN 08 Consolidated Summary FALABELLA SNAPSHOT Chile based integrated retailer involved in the department store business, home improvement, supermarket and financial services.
SACI FALABELLA CORPORATE PRESENTATION AUGUST 2015
 SACI FALABELLA CORPORATE PRESENTATION AUGUST 2015 CONTENTS The Company Key Investment Highlights Consolidated Statements Corporate Structure Overview per Business Unit FIVE BUSINESS UNITS 126 YEARS OF
SACI FALABELLA CORPORATE PRESENTATION NOVEMBER 2015
 SACI FALABELLA CORPORATE PRESENTATION NOVEMBER 2015 CONTENTS The Company Key Investment Highlights Consolidated Statements Corporate Structure Overview per Business Unit FIVE BUSINESS UNITS 126 YEARS OF
Falabella Peru Corporate Presentation
 Falabella Peru Corporate Presentation September 2017 CONTENTS FALABELLA GROUP FALABELLA PERU: GENERAL INFORMATION BUSINESS UNITS OVERVIEW CONSOLIDATED FINANCIALS FALABELLA GROUP Presence In 7 Countries
Ripley. May Corp
 1 May 2012 One of the biggest holdings of the department store business in Chile and Peru, and starting operations in Colombia CHILE since 1956 PERU since 1997 38 department stores 236 Th. m2 of selling
S.A.C.I. Falabella. Corporate Presentation. J a n u a r y
 S.A.C.I. Falabella Corporate Presentation J a n u a r y 2 0 1 8 CONTENTS THE COMPANY INVESTMENT HIGHLIGHTS CONSOLIDATED STATEMENTS CORPORATE STRUCTURE BUSINESS UNIT OVERVIEW THE COMPANY Presence In 7 Countries
Earnings Presentation Second Quarter September 2012
 Earnings Presentation Second Quarter 2012 September 2012 Key Issues First Half 2012 Cencosud Projects Second Quarter Results Company overview Key metrics (2Q12) Number of stores: 920 Selling space: 3,495,857
CONTENTS RIPLEY CORP 2010 FOCUS CONCLUSIONS
 RIPLEY CORP CONTENTS RIPLEY CORP 2010 FOCUS CONCLUSIONS Our Assets Revenues 2009: US$ 1,963 m Loans Portfolio: US$ 1,354 m 1.8 million of customer using Tarjeta Ripley 51 stores in the best commercial
Earnings Presentation First Quarter May 2012
 Earnings Presentation First Quarter 2012 May 2012 Company overview Key metrics (LTM 2012 1 ) Number of stores: 906 Selling space: 3,3 million sq 2 Number of customers: 800mm Number of employees: 139,082
Almacenes Éxito S.A. Consolidated Financial Results For the three-month period ended March 31. First Quarter 2013 Financial Highlights
 Almacenes Éxito S.A. Consolidated Financial Results For the three-month period ended March 31 2013 New Éxito Soledad in Atlántico First Quarter 2013 Financial Highlights Note: Consolidated figures include
EARNINGS REPORT 1st Quarter 2007 S.A.C.I. FALABELLA
 EARNINGS REPORT 1st Quarter 2007 S.A.C.I. FALABELLA April 2007 Results First Quarter 2007 Table of Contents I. EXECUTIVE SUMMARY...3 II. CONSOLIDATED INCOME STATEMENT AS OF MARCH 31, 2007...4 III. CONSOLIDATED
2011 Fourth Quarter Results
 2011 Fourth Quarter Results February, 2012 INVESTOR RELATIONS Disclaimer The financial information in this document are consolidated earnings results based on K-IFRS. The previous earnings results have
Almacenes Éxito S.A. Consolidated Financial Results
 Almacenes Éxito S.A. Consolidated Financial Results 2011 For the quarter and twelve-month period ended December 31, 2011 The New Surtimax La Paz Bosa store. BVC (The Colombian Stock Exchange): ÉXITO ADR
Almacenes Éxito S.A. Consolidated Financial Results
 Almacenes Éxito S.A. Consolidated Financial Results For the second quarter and six-month period ended June 30, Viva Caucasia Shopping Mall BVC (The Colombian Stock Exchange): ÉXITO ADR Program: ALAXL Medellín,
Ripley Corp October 2017
 Ripley Corp October 2017 A COMPANY WITH HISTORY AND SUCCESS First store in Santiago Credit business beginning First department store Opening of Ripley Parque Arauco First store in Peru Opening of Ripley
For the quarter and six-month period ended June 30, 2010
 2 1 Almacenes Éxito S.A Second Quarter Consolidated 2 financial report 1 financial results The converted Éxito Libertador store in Santa Marta For the quarter and six-month period ended June 3, 21 Working
Almacenes Éxito S.A.
 Carulla express Olaya Herrera in Medellín BVC (The Colombian Stock Exchange): ÉXITO ADR Program: ALAXL Medellín, Colombia July 29, 2015 Almacenes Éxito S.A. ( Éxito or the Company ), the largest retail
HORNBACH Baumarkt AG Group Q3/9M 2017/2018
 HORNBACH Baumarkt AG Group Q3/9M 2017/2018 Quarterly Statement as of November 30, 2017 2 HORNBACH BAUMARKT AG GROUP QUARTERLY STATEMENT: 3 RD QUARTER AND 1 ST NINE MONTHS OF 2017/2018 HORNBACH BAUMARKT
Almacenes Éxito S.A. Consolidated Financial Results 2012
 Almacenes Éxito S.A. Consolidated Financial Results 2012 For the quarter and twelve-month period ended December 31, 2012 Surtimax Codito in Bogotá BVC (The Colombian Stock Exchange): ÉXITO ADR Program:
For the quarter and twelve-month period ended December 31, 2010
 Almacenes Éxito S.A. Consolidated Financial Results 20 Fourth Quarter 20 financial report Éxito Modelia: the first store converted from Cafam brand For the quarter and twelve-month period ended December
Corporate Presentation. November 2018
 Corporate Presentation November 2018 Company Profile FOURLIS GROUP is a leading retail group of companies of quality consumer goods in Southeast Europe. The initial company was founded in 1950. The group
Almacenes Éxito S.A. Consolidated Financial Results 2011
 Almacenes Éxito S.A. Consolidated Financial Results 2011 For the second quarter and six-month period ended June 30, 2011 Expansion in intermediate cities: Éxito Yopal store BVC (The Colombian Stock Exchange):
HORNBACH Holding AG & Co. KGaA Group. 1 st QUARTER 2017/2018
 HORNBACH Holding AG & Co. KGaA Group 1 st QUARTER 2017/2018 Quarterly Statement as of May 31, 2017 2 HORNBACH HOLDING AG & CO. KGaA GROUP QUARTERLY STATEMENT: 1 ST QUARTER OF 2017/2018 HORNBACH HOLDING
B&M European Value Retail SA Interim Results Presentation 26 weeks to 23 rd September 2017
 B&M European Value Retail SA Interim Results Presentation 26 weeks to 23 rd September 2017 Interim FY18 Group Highlights Group revenues increased by 21.7% to 1,346.4m B&M LFL revenues +7.5%, Q2 LFL +7.7%
HORNBACH Holding AG & Co. KGaA Group. 1 st QUARTER 2018/19
 HORNBACH Holding AG & Co. KGaA Group 1 st QUARTER 2018/19 Quarterly Statement as of May 31, 2018 2 HORNBACH HOLDING AG & CO. KGaA GROUP STATEMENT ON 1 ST QUARTER OF 2018/19 HORNBACH HOLDING AG & CO. KGaA
2016 First Quarter Results
 LOTTE SHOPPING CO., LTD 2016 First Quarter Results May, 2016 INVESTOR RELATIONS Disclaimer The financial information in this document are consolidated earnings results based on K-IFRS. This release includes
Interim Report HORNBACH-BAUMARKT-AG GROUP
 Interim Report HORNBACH-BAUMARKT-AG GROUP 1st QUARTER 2006/2007 (MARCH 1 MAY 31, 2006) HORNBACH-Baumarkt-AG Group Interim Report (IFRS): First Quarter of 2006/2007 (March 1 May 31, 2006) 2 Pleasing business
Interim Report HORNBACH-BAUMARKT-AG GROUP FIRST HALF-YEAR 2004/2005 (MARCH 1 - AUGUST 31, 2004)
") Interim Report HORNBACH-BAUMARKT-AG GROUP FIRST HALF-YEAR 2004/2005 (MARCH 1 - AUGUST 31, 2004) Page 2 HORNBACH-BAUMARKT-AG Group Interim Report (IFRS) for the First Half-Year 2004/2005 (March 1 August
Interim Report HORNBACH-BAUMARKT-AG GROUP FIRST HALF-YEAR 2004/2005 (MARCH 1 - AUGUST 31, 2004) Page 2 HORNBACH-BAUMARKT-AG Group Interim Report (IFRS) for the First Half-Year 2004/2005 (March 1 August
DFVA Analyst Meeting 2017
 DFVA Analyst Meeting 2017 HORNBACH Holding AG & Co. KGaA September 28, 2017 Frankfurt/Main Page 1 Financial Year 2017/2018 1st Half/2nd Quarter (March August 2017) Page 2 since March 28, 2017 Shareholder
May 24, 2018 Frankfurt/Main. DVFA Analyst Meeting May 2018 HORNBACH Group 2018
 HORNBACH Baumarkt AG DVFA Analyst Meeting May 24, 2018 Frankfurt/Main Page 1 Financial Calendar 2018 HORNBACH Group June 22, 2018 Financial Update: 1st Quarter of 2018/19 as of May 31, 2018 July 5, 2018
Arun Nayar Senior Vice President, Finance and Treasurer
 Arun Nayar Senior Vice President, Finance and Treasurer November 18, 2010 Forward-Looking Statements / Safe Harbor Certain statements in this presentation are forward-looking statements within the meaning
FY2017 First Six Months Consolidated Business Results
 FY2017 First Six Months Consolidated Business Results November 8, 2017 Content 1. Key Messages 2. FY2017 First Six Months Consolidated Business Results 3. FY2017 Forecast 1 Key Messages Operating income
FY2017 Consolidated Business Results May 9, 2018 Toshiba Tec Corporation
 FY2017 Consolidated Business Results May 9, 2018 Toshiba Tec Corporation Content 01 Key Messages 02 FY2017 Consolidated Business Results 03 FY2018 Forecast 1 Key Messages Toshiba Tec achieved the highest
Q Sales inc. VAT 12 July 2012
 H1 2012 sales (inc. VAT) up 0.9% to 43.7 bn Q2 2012 sales (inc. VAT) down 0.3% at 21.7 bn Sustained growth in emerging markets, stabilization of sales trends in France and Europe H1 2012 sales: 43.7 bn,
ScS Group Plc Interim Results For The 26 Weeks Ended 24 January 2015 March 2015
 ScS Group Plc Interim Results For The 26 Weeks Ended 24 January 2015 March 2015 October 2014 H1 2015 Highlights Financial Highlights: Like for like sales order intake up 7.8% Flooring up 13.0% Total sales
Revenue increased by 6.4% from 790 billion RUR in 9M 2016 to 841 billion RUR in 9M 2017.
 Press Release Krasnodar October 20, 2017 PJSC Magnit Announces Unaudited 9M 2017 Results Krasnodar, Russia (October 20, 2017): Magnit PJSC, one of Russia s leading retailers (MOEX and LSE: MGNT) announces
Matas FY/Q4 2016/17 Results
 Matas FY/Q4 2016/17 Results Forward Looking Statements This presentation contains statements relating to the future, including statements regarding Matas A/S future operating results, financial position,
INTERIM REPORT. 1st QUARTER 2011/2012 HORNBACH HOLDING AG GROUP (MARCH 1 MAY 31, 2011)
") INTERIM REPORT HORNBACH HOLDING AG GROUP 1st QUARTER 2011/2012 (MARCH 1 MAY 31, 2011) 2 HORNBACH HOLDING AG GROUP INTERIM REPORT: 1 ST QUARTER OF 2011/2012 HORNBACH HOLDING AG GROUP Interim Report for
INTERIM REPORT HORNBACH HOLDING AG GROUP 1st QUARTER 2011/2012 (MARCH 1 MAY 31, 2011) 2 HORNBACH HOLDING AG GROUP INTERIM REPORT: 1 ST QUARTER OF 2011/2012 HORNBACH HOLDING AG GROUP Interim Report for
HALF-YEAR FINANCIAL REPORT HORNBACH BAUMARKT AG GROUP H1 2017/2018 (MARCH 1 AUGUST 31, 2017)
") HALF-YEAR FINANCIAL REPORT HORNBACH BAUMARKT AG GROUP H1 2017/2018 (MARCH 1 AUGUST 31, 2017) 2 HORNBACH BAUMARKT AG GROUP HALF-YEAR FINANCIAL REPORT 2017/2018 HORNBACH BAUMARKT AG GROUP Half-Year Financial
HALF-YEAR FINANCIAL REPORT HORNBACH BAUMARKT AG GROUP H1 2017/2018 (MARCH 1 AUGUST 31, 2017) 2 HORNBACH BAUMARKT AG GROUP HALF-YEAR FINANCIAL REPORT 2017/2018 HORNBACH BAUMARKT AG GROUP Half-Year Financial
4Q13 Results. Tres Picos #65 Col. Bosques de Chapultepec, Miguel Hidalgo, CP , Distrito Federal, México.
 4Q13 Results Tres Picos #65 Col. Bosques de Chapultepec, Miguel Hidalgo, CP. 11580, Distrito Federal, México. 1 Highlights 3 New Projects 4 Results and Key Indicators 5 Environmental and Social Development
Gross margin grew from 28.51% in 2013 to 28.88% in Gross profit increased by 33.44% from 165, million RUR to 220, million RUR.
 Press-release Krasnodar March 25, 2015 PJSC Magnit Announces Audited FY 2014 Results Krasnodar, March 25, 2015: PJSC Magnit, Russia s largest retailer (the Company ; MOEX and LSE: MGNT) announces its audited
Results Briefing: Consolidated Cumulative Q3RD (March to November 2014) Results of 2015 Ending February
 Results of 2015 Ending February") Results Briefing: Q3RD (March to November 2014) Results of 2015 Ending February 2015.1.19 I. Results Overview *The amounts given in this material are rounded down to the nearest million yen. 2 1. Consolidated
Results Briefing: Q3RD (March to November 2014) Results of 2015 Ending February 2015.1.19 I. Results Overview *The amounts given in this material are rounded down to the nearest million yen. 2 1. Consolidated
BB&T Capital Markets Automotive Aftermarket Conference: Car Talk in the City August 17, 2011
 BB&T Capital Markets Automotive Aftermarket Conference: Car Talk in the City August 17, 2011 Forward Looking Statements The Company claims the protection of the safe-harbor for forward-looking statements
INVESTOR PRESENTATION
 TOUCHCORP LIMITED ASX:TCH WWW.TOUCHCORP.COM INVESTOR PRESENTATION $25.6M CAPITAL RAISING SEPTEMBER 2016 TOUCHCORP LIMITED 1 TOUCH SERVICE OFFERING TOUCHCORP NOW OFFERS ITS CUSTOMERS A COMPLETE OMNI-CHANNEL
Revenue increased by 8.08% from billion RUR in 1Q 2017 to billion RUR in 1Q 2018.
 Press Release Krasnodar April 20, 2018 PJSC Magnit Announces Unaudited 1Q 2018 Results Krasnodar, Russia (April 20, 2018): Magnit PJSC, one of Russia s leading retailers (MOEX and LSE: MGNT) announces
PUREGOLD PRICE CLUB, INC.
 Sa PUREGOLD PRICE CLUB, INC., Always Panalo! Company Presentation 1Q 2016 Results and Performance July 2016 Disclaimer These presentations and/or other documents have been written and presented by Puregold
HALF-YEAR FINANCIAL REPORT. HORNBACH Holding AG & Co. KGaA Group H1 2018/19 (MARCH 1 AUGUST 31, 2018)
") HALF-YEAR FINANCIAL REPORT HORNBACH Holding AG & Co. KGaA Group H1 2018/19 (MARCH 1 AUGUST 31, 2018) 2 HORNBACH HOLDING AG & CO. KGaA GROUP STATEMENT ON 1 ST HALF OF 2018/19 HORNBACH HOLDING AG & CO. KGaA
HALF-YEAR FINANCIAL REPORT HORNBACH Holding AG & Co. KGaA Group H1 2018/19 (MARCH 1 AUGUST 31, 2018) 2 HORNBACH HOLDING AG & CO. KGaA GROUP STATEMENT ON 1 ST HALF OF 2018/19 HORNBACH HOLDING AG & CO. KGaA
HALF-YEAR FINANCIAL REPORT HORNBACH BAUMARKT AG GROUP H1 2018/19 (MARCH 1 AUGUST 31, 2018)
") HALF-YEAR FINANCIAL REPORT HORNBACH BAUMARKT AG GROUP H1 2018/19 (MARCH 1 AUGUST 31, 2018) 2 HORNBACH BAUMARKT AG GROUP STATEMENT ON 1 ST HALF OF 2018/19 HORNBACH BAUMARKT AG GROUP Half-Year Financial
HALF-YEAR FINANCIAL REPORT HORNBACH BAUMARKT AG GROUP H1 2018/19 (MARCH 1 AUGUST 31, 2018) 2 HORNBACH BAUMARKT AG GROUP STATEMENT ON 1 ST HALF OF 2018/19 HORNBACH BAUMARKT AG GROUP Half-Year Financial
CORPORATE PRESENTATION March 2016
 CORPORATE PRESENTATION March 2016 Corporate Presentation Contents 2 Contents Highlights First Quarter Cencosud Snapshot Key Figures Strategy Cencosud Corporate Governance Corporate Presentation Highlights
Following is a presentation that is to be given at the Macquarie Australia Conference in Sydney today, Wednesday, 2 May 2018.
 2 May 218 The Manager Company Announcements Office Australian Securities Exchange Dear Manager, MACQUARIE CONFERENCE BRIEFING PRESENTATION Following is a presentation that is to be given at the Macquarie
Earnings Per Share Summary (Unaudited)
") Earnings Per Share Summary Quarter Ended Quarter Ended Year Ended Dec. 27, 213 Dec. 28, 212 March 29, 213 June 28, 213 Sept. 27, 213 Sept. 27, 213 Continuing Operations Attributable to Tyco Shareholders
Earnings Per Share Summary Quarter Ended Quarter Ended Year Ended Dec. 27, 213 Dec. 28, 212 March 29, 213 June 28, 213 Sept. 27, 213 Sept. 27, 213 Continuing Operations Attributable to Tyco Shareholders
Second Quarter Interim Report
 2 Second Quarter Interim Report For the Six Months Ended June 30, 1997 W E L L S E R V I C E L T D. Financial Summary ($millions, except per share amounts) Six months ended June 30, Three months ended
Ben Gordon Chief Executive
 Interim Results 18 th November, 2009 Ben Gordon Chief Executive Performance highlights Group sales +7.9% to 387.3m Group network sales up 13.6% to 549.1m Group underlying profit before tax +11.1% to 10.0m
Interim Report (IFRS)
") Interim Report (IFRS) HORNBACH HOLDING AG GROUP THIRD QUARTER 2004/2005 (March 1 to November 30, 2004) PAGE 2 HORNBACH HOLDING AG Group Interim Report (IFRS) for the First of 2004/2005 (March 1 to November
Interim Report (IFRS) HORNBACH HOLDING AG GROUP THIRD QUARTER 2004/2005 (March 1 to November 30, 2004) PAGE 2 HORNBACH HOLDING AG Group Interim Report (IFRS) for the First of 2004/2005 (March 1 to November
STRONG ORGANIC SALES GROWTH: +4.9% IN Q Second quarter 2014 consolidated sales inc. VAT
 STRONG ORGANIC SALES GROWTH: +4.9% IN Q2 2014 Second quarter 2014 consolidated sales: 20.5bn, a strong +4.9% increase on an organic basis Europe : good performance, with organic growth of +1.9% o France:
Medical and Graphic Imaging
 (4) Notes Regarding Going Concern Assumptions None. (5) Segment Information [1] Segment Three months to December 31, 2009 (From October 1, 2009 to December 31, 2009) External Medical and Graphic Sensing
For personal use only TOUCHCORP 1H2015 RESULTS PRESENTATION DATED: THURSDAY, 27TH AUGUST 2015
 TOUCHCORP 1H2015 RESULTS PRESENTATION DATED: THURSDAY, 27TH AUGUST 2015 DISCLAIMER The material in this presentation has been prepared by Touchcorp Limited ARBN 603 731 184 (Touchcorp) and is general background
Q Sales inc. VAT 11 October 2012
 Q3 2012 sales (inc. VAT): +2.1% to 22.6 bn Continued growth in emerging markets, notably Latin America, better quarter in France 9-month 2012 sales (inc. VAT) up 1.3% to 66.3 bn Q3 2012 sales: 22.6 bn,
Introduction - Business Divisions. Key Indicators. Regional Footprint Operating Highlights. Investment Plan History
 The company & ITS subsidiaries Introduction - Business Divisions Department Stores Home Improvement Supermarkets Financial Services Real Estate Business Regional Footprint Operating Highlights Key Indicators
Sales growth in the second quarter of 1.3% at constant exchange rates Sales growth in France ex. calendar impact Growth in Latin America and China
 Sales growth in the second quarter of 1.3% at constant exchange Sales growth in France impact Growth in Latin America and China Q2 2013 consolidated sales inc. VAT: 20.5bn, up 1.3% at constant exchange
The NASDAQ 35th Investor Program. November 30,
 R The NASDAQ 35th Investor Program November 30, 2016 1 Forward Looking Statements Certain statements made in this presentation that are not based on historical information are forward-looking statements
HALF-YEAR FINANCIAL REPORT HORNBACH BAUMARKT AG GROUP H1 2016/2017 (MARCH 1 AUGUST 31, 2016)
") HALF-YEAR FINANCIAL REPORT HORNBACH BAUMARKT AG GROUP H1 2016/2017 (MARCH 1 AUGUST 31, 2016) 2 HORNBACH BAUMARKT AG GROUP HALF-YEAR FINANCIAL REPORT 2016/2017 HORNBACH BAUMARKT AG GROUP Half-Year Financial
HALF-YEAR FINANCIAL REPORT HORNBACH BAUMARKT AG GROUP H1 2016/2017 (MARCH 1 AUGUST 31, 2016) 2 HORNBACH BAUMARKT AG GROUP HALF-YEAR FINANCIAL REPORT 2016/2017 HORNBACH BAUMARKT AG GROUP Half-Year Financial
Safe harbor statement
 1 Safe harbor statement During this presentation management may discuss certain forwardlooking statements concerning FEMSA s future performance that should be considered as good faith estimates made by
P R E S S R E L E A S E
 P R E S S R E L E A S E from ASSA ABLOY AB (publ) Stockholm 8 November, 1999 no. 16/99 INTERIM REPORT JANUARY-SEPTEMBER 1999 Sales increased by 19% to SEK 7,532 M (6,317) Income before taxes increased
Content. Paseo de la Reforma 725 Col. Lomas de Chapultepec, Miguel Hidalgo, CP , Distrito Federal, México.
 3Q16 RESULTS 1 Content Relevant Issues... 3 MDF Business Unit... 3 Teak Business Unit... 5 Income Statement Analysis... 6 Environmental and Social Development... 10 Stock Development... 11 Proteak Informs...
O`KEY GROUP ANNOUNCES OPERATING RESULTS FOR Q1 2018
 Press Release 17 Apr 2018 O`KEY GROUP ANNOUNCES OPERATING RESULTS FOR Q1 2018 O`KEY Group S.A. (LSE: OKEY, the Group ), one of the leading Russian food retailers, announces its unaudited operating results
METRO GROUP achieves sales target and confirms EBIT guidance
 19 October 2015 1/5 METRO GROUP achieves sales target and confirms EBIT guidance Like-for-like sales growth of 1.5% in financial year 2014/15 Growth drivers online retail and delivery remain successful
Financial Results for the 3rd Quarter Ended December 31, 2004 < U.S. GAAP-based >
 Financial Results for the 3rd Quarter Ended December 31, < U.S. GAAP-based > February 1, 5 NIDEC CORPORATION www.nidec.co.jp/english/index.html Consolidated Financial Results for the 3 rd Quarter Ended
Revenue increased by 6.37% from 1, billion RUR in 2016 to 1, billion RUR in 2017.
 Press Release Krasnodar January 26, 2018 PJSC Magnit Announces Unaudited FY 2017 Results Krasnodar, Russia (January 26, 2018): Magnit PJSC, one of Russia s leading retailers (MOEX and LSE: MGNT) announces
Institutional Presentation June, 2018
 Institutional Presentation June, 2018 THE LEADER IN BRAZILIAN RETAIL: OVERVIEW NATIONWIDE PRESENCE Multiformat and omnichannel platform 150 (3) Atacadão stores Hyper Convenience Drugstores 11% 23 Atacadão
Stable sales excluding petrol (at constant exchange rates) Q sales inc. VAT: 22.7bn
 Q sales inc. VAT: 22.7bn") Q1 2009 sales incl. VAT 16 April 2009 Stable sales excluding petrol (at constant exchange rates) Q1 2009 sales inc. VAT: 22.7bn o Q1 2009 sales including VAT: 22.7bn, 1.4% at constant exchange rates o
Q1 2009 sales incl. VAT 16 April 2009 Stable sales excluding petrol (at constant exchange rates) Q1 2009 sales inc. VAT: 22.7bn o Q1 2009 sales including VAT: 22.7bn, 1.4% at constant exchange rates o
FIRST QUARTER 2016 SALES: 20.1bn GOOD START TO THE YEAR, ACCELERATING GROWTH IN INTERNATIONAL MARKETS
 FIRST QUARTER 2016 SALES: 20.1bn GOOD START TO THE YEAR, ACCELERATING GROWTH IN INTERNATIONAL MARKETS REPORTED GROWTH OF +3.8% EX PETROL, +3.1% LIKE-FOR-LIKE International: Reported growth of +6.4% ex
LOWE S SECURITY ANALYSIS TERRY ASANTE
 LOWE S SECURITY ANALYSIS TERRY ASANTE THE OUTLINE 1. Theme 2. Business Analysis 3. Financial Analysis 4. Stock Valuation 5. The moat 6. Risk 7. Bulls vs.. Bears 8. Investing Strategies THE THEME Lowe s
top line growth was due to an increase in selling space as well as to a 6.21% increase in like-for-like sales.
 Press-release Krasnodar March 24, 2016 PJSC Magnit Announces Audited FY 2015 Results Krasnodar, March 24, 2016: PJSC Magnit, Russia s largest retailer (the Company ; MOEX and LSE: MGNT) announces its audited
Pre-seen case study for Strategic level examinations Papers E3, P3 and F3. For examinations in May 2014 and September 2014
 Pre-seen case study for Strategic level examinations Papers E3, P3 and F3 For examinations in May 2014 and September 2014 PRE-SEEN MATERIAL, PROVIDED IN ADVANCE FOR PREPARATION AND STUDY FOR THE EXAMINATIONS
1Q15 Results. Paseo de la Reforma 725 Col. Lomas de Chapultepec, Miguel Hidalgo, CP , Distrito Federal, México.
 1Q15 Results 1 Highlights 3 Independent Proteak Valuation 3 Capital Increase 4 MDF Project 4 Forestry Development 6 Results and Key Indicators 7 Balance Sheet Analysis 10 Cash Flow Analysis 11 Stock Development
Falabella: Challenges of a Latin American giant
 Falabella: Challenges of a Latin American giant Jorge Tarzijan Pontificia Universidad Catolica de Chile, School of Management. I. Introduction By the end of 2012, Falabella was one of the main retailers
LENTA SALES AND OPERATING HIGHLIGHTS FOR THE FIRST QUARTER ENDED 31 MARCH 2018
 LENTA SALES AND OPERATING HIGHLIGHTS FOR THE FIRST QUARTER ENDED 31 MARCH 2018 St-Petersburg, Russia; 19 April, 2018 Lenta Ltd, (LSE, MOEX: LNTA / Lenta or the Company ) one of the largest retail chains
Whirlpool Corporation Q Financial Review Press Release July 25, 2006 SLIDE 1
 Whirlpool Corporation Q2 2006 Financial Review Press Release July 25, 2006 SLIDE 1 Whirlpool Corporation Second Quarter Performance Earnings from continuing operations of $100 million versus $96 million
Solid sales growth in Q3 2013: +2.7% at constant exchange rates Further sales growth in France Continued growth in Latin America and China
 Solid sales growth in Q3 2013: +2.7% at constant exchange rates Further sales growth in France Continued growth in Latin America and China Q3 2013: Solid sales growth, + 2.7% at constant exchange rates
INVESTOR NEWS /16
 Düsseldorf, 14.12.2016 1/8 INVESTOR NEWS 1-2015/16 METRO GROUP meets sales and earnings targets in financial year 2015/16 EBIT from continuing operations before special items reaches 1,560 million (2014/15:
Results and strategy of CCC Group
 01 Results and strategy of CCC Group Strategy of dynamic foreign expansion will be continued with the CEE countries being the most important part of the future growth. Besides Poland, Czech Republic, Slovakia
Needham Growth Conference January 10,
 R Needham Growth Conference - 2017 January 10, 2017 1 Forward Looking Statements Certain statements made in this presentation that are not based on historical information are forward-looking statements
FINANCIAL STATEMENTS Stockmann Group 15 February 2017
 FINANCIAL STATEMENTS 2016 Stockmann Group 15 February 2017 YEAR 2016: OPERATING RESULT BACK TO PROFIT Gross margin 53.4% (50.6%) Adjusted operating profit, EUR mill. -20.2 (-28.5) Reported operating profit,
Steinhoff International, MARKUS JOOSTE HISTORY AND DEVELOPMENT OF STEINHOFF
 Steinhoff International, MARKUS JOOSTE HISTORY AND DEVELOPMENT OF STEINHOFF WELCOME 2 HISTORY: STEINHOFF INVOLVED IN HOUSEHOLD GOODS TRADING SINCE 1963 1963-1990: Sourcing in the East for the West City:
Press Release Krasnodar July 21, PJSC Magnit Announces Unaudited 1H 2017 Results
 Press Release Krasnodar July 21, 2017 PJSC Magnit Announces Unaudited 1H 2017 Results Krasnodar, Russia (July 21, 2017): Magnit PJSC, one of Russia s leading retailers (MOEX and LSE: MGNT) announces its
Half Year Results 2016 Presentation
 Half Year Results 2016 Presentation Agenda Company highlights Financial results nbn operational progress Questions 2016 nbn co limited 2 2020 goals Connect Australia. Close Digital Divide 8 million premises
Making the world a safer place to travel QUIXOTE CORPORATION
 Making the world a safer place to travel QUIXOTE CORPORATION MISSION ENHANCE THE SAFETY, EFFICIENCY & SECURITY OF TRANSPORTATION SYSTEMS WORLD WIDE. BUSINESS SEGMENTS PROTECT & DIRECT: Provide products
Q1 Report 2014/ September Klas Balkow CEO
 Report 2014/15 10 September 2014 Klas Balkow CEO Agenda 2014/15 Events after period-end Strategic priorities Q&A Store opening in Levanger, Norway, in June 2014 2 High energy and strong position 186 stores
Almacenes Éxito S.A. Solid margin growth from productivity efforts and international performance KEY BUSINESS HIGHLIGHTS
 Almacenes Éxito S.A. Consolidated Financial Results 4Q17 For the fourth quarter and twelve-month period ended December 31, 2017 Envigado, Colombia, February 21, 2018 Almacenes Éxito S.A. ( Éxito or the
Company Presentation. 1H 2014 Results and Performance August 15, 2014
 Company Presentation 1H 2014 Results and Performance August 15, 2014 Disclaimer These presentations and/or other documents have been written and presented by Puregold Price Club, Inc. (PGOLD). PGOLD is
Will we see a return of traditional financing structures? A Corporate View
 Will we see a return of traditional financing structures? A Corporate View 1 Stéhan Grobler Steinhoff International Holdings Limited Karlsruhe Germany October 2010 Agenda 2 Steinhoff Group Overview Group
Q SALES. (+7.0%) and market share gain since the beginning of the year (+0.2pt over the most recent Kantar period)
 and market share gain since the beginning of the year (+0.2pt over the most recent Kantar period)") Q2 2015 SALES Improved activity in France: Return to at Géant and recovery at Leader Price Increase in food sales in Brazil Strong of the E-commerce business In France, improved activity: in organic sales
Q2 2015 SALES Improved activity in France: Return to at Géant and recovery at Leader Price Increase in food sales in Brazil Strong of the E-commerce business In France, improved activity: in organic sales
Q3 2016/17 RESULTS PRESENTATION. 31 August 2017
 Q3 2016/17 RESULTS PRESENTATION 31 August 2017 DISCLAIMER AND NOTES To the extent that statements in this presentation do not relate to historical or current facts, they constitute forward-looking statements.
The Remodeling Market
 The Remodeling Market Kermit Baker Remodeling Futures Program International Builders Show January 21, 2010 www.jchs.harvard.edu Remodeling Market Issues 1. Where do we stand in the remodeling cycle at
Strategic Pillars. Growth Profitability Sustainability
 2016 Highlights Strategic Pillars Growth Profitability Sustainability 40 Annual Report 2016 S.A.C.I. FALABELLA Strategic Pillars S.A.C.I. Falabella aims to grow each business with discipline and responsibility,