WEST LAKE DRIVE PLAN. City of Detroit Lakes, Minnesota DRAFT - March 28, 2018
|
|
|
- Gregory Randall
- 5 years ago
- Views:
Transcription


1 WEST LAKE DRIVE PLAN City of Detroit Lakes, Minnesota DRAFT - March 28, 2018
2 ACKNOWLEDGMENTS MAYOR Matt Brenk CITY OF DETROIT LAKES Kelcey Klemm, City Administrator Larry Remmen, Community Development Director Nancy Wichmann, Planning Department Secretary DETROIT LAKES CITY COUNCIL Matt Boeke Bruce Imholte Dan Josephson Jamie Marks Erickson Jay Schurman Madalyn Sukke Barb Voss Dan Wenner Ron Zeman DETROIT LAKES DEVELOPMENT AUTHORITY Tom Klyve, President Chet Collin Phil Hansen Bruce Imholte Mike Stearns G.L. Tucker Ron Zeman CONSULTANT RDG Planning & Design A MESSAGE FROM THE AUTHORS We want to thank the hundreds of residents and stakeholders who invested their time and insight to help author the concepts and ideas in this plan. This plan is truly a document of the people. Plans like this can be a catalyst for new investment, and help the community provide a more memorable experience for the people who live and visit Detroit Lakes. We cherish our annual visits to the area and the lifetime memories. Congratulations on your past accomplishments and thank you for the opportunity to help create a roadmap for the future of this special corridor. 2
3 INTRODUCTION...4 CHAPTER 1: MARKETS...7 CHAPTER 2: STRATEGIC PLANNING Planning Process...24 First Principles...29 CHAPTER 3: DEVELOPMENT PLAN Development Program...36 Mobility and Access...37 West Lake Drive West End Development...46 Lake View Development...55 Lakeside Development...54 Pavilion and Beachfront...58 Washington Avenue...62 Policy Recommendations
4 4
5 INTRODUCTION The residents of Detroit Lakes are vigilant in keeping their community great and improving it for the future. The city has a strong history of planning and carrying out those plans. City leaders continue to use plans to understand priorities for supporting existing and new investments, while creating conditions that help residents enjoy living and working in the city. The West Lake Drive Plan, like past studies, does not commit the city to a specific course of action. It is not a rigid plan that anticipates the specific use of every piece of property or street into the future. It is a guide to establish priorities for further discussion, and refining the presented concepts where and when necessary. Celebrating the lakefront s rich recreation opportunities is important to attract visitors of all ages. People overwhelmingly agreed with this fundamental concept during the planning process. Also, they want people to enjoy their time in Detroit Lakes, building memories and telling others about their fun experiences to make West Lake Drive a must-stop destination. Like any popular destination, these spaces require continued investment to ensure that residents and visitors alike want to return. The quality and use of the public space along the lake and the development environment of West Lake Drive are vitally important to the city s economy and environment and are fundamental concerns of this plan. Land use and economic changes have affected the character of the lakefront. For example, lakeside resorts that served short-term vacationers created a lively commercial market along the lake. The decline of the resorts and their replacement by seasonal condominiums have reduced this market, and, in the opinions of many local observers, also reduced the activity and vitality of the lakefront. Economic trends have also favored residential land development over the risks and limited potential of highly seasonal retailing. Planning for a future lakefront must accommodate these economic trends and market preferences, while maintaining the liveliness that is part of the Detroit Lakes tradition. Therefore, the plan suggests mixing uses to connect the district from end-to-end and placing public spaces along the corridor for people to gather. The plan lays out a vision for the future of West Lake Drive corridor that focuses on priorities for city policies and public investments. The spirit of the concepts intends to build on the area s strengths, improving the neighborhood and businesses environment while adding amenities that make the district even more appealing to visit. It is not an unchangeable, inflexible commitment to carry out specific projects, but a guiding vision for a changing future. 5
6 6
7 MARKETS This chapter analyzes potential markets and changes since the 2008 Business Corridor Plan. It reviews important demographic and market characteristics to guide planning for the next phase of development along West Lake Drive. Also, it considers population and demographic characteristics of the marketplace to understand development possibilities. 7 1


8 WEST LAKE DRIVE PLAN MARKETS INTRODUCTION Much has changed in regional markets, housing needs, and consumer spending patterns since the 2008 Business Corridor Redevelopment Plan. The 2008 recession influenced people s spending habits on discretionary items and in other parts of the county led to a stagnant housing market. Consumer confidence and housing construction have since rebounded. New trends and innovations in the way people shop are impacting commercial centers across the county. The rise of on-line shopping coupled with changing household demographics changes the way communities need to think about retail and commercial areas. Visitors, residents, and employees are searching for an experience. Detroit Lakes is a well known destination attraction provides this experience. But how opportunity sites respond to these changing markets will determine the ability for Detroit Lakes to continue to compete with regional employment and tourist destinations in the future. The 2017 market analysis builds on the findings of the 2008 plan to account for changes in the past ten years, specifically targeted at West Lake Drive. In summary, A market analysis provides insight into the factors affecting commercial development in a region, city, downtown, or corridor. There are many reasons to conduct, and update, market studies: Identify the trade area where people choose Detroit Lakes to shop for every day items and necessities. Identify the trade area where people choose Detroit Lakes for special purposes and experiences. Understand the amount of retail spending drawn to Detroit Lakes. Identify development opportunities in different market segments - commercial and residential. A methodology for a market analysis can vary by community. Local knowledge and logical interpretation gives the updated market data meaning and ability to draft feasible solutions for challenges or ways to leverage opportunities. The steps to understanding the local market revolve around supply and demand - what does the community provide and what can the residents be expected to support. A general methodology used for Detroit Lakes includes: 1. Identification of retail trade areas 2. Understanding demographic trends - population 3. Understanding economic trends - business and employment 4. Understanding tourism trends 5. Identifying retail spending patterns and performance 6. Identifying housing market patterns and needs 7. Develop policies, recommendations, and strategies to meet commercial and residential needs and opportunities 8


9 1 MARKETS TRADE AREA DEFINITION Detroit Lakes is regionally known as a quality community with a unique downtown and getaway to more than 400 lakes in the surrounding region, and has historically been a significant small regional market at the crossroads of Highways 10, 34 and 59. The process of defining Detroit Lakes market area is the same as the 2008 plan - defining three separate geographic areas that Detroit Lakes can draw from and its potential to capture retail dollars. FIGURE 1.1: Primary Market FIGURE 1.2: Secondary Market FIGURE 1.3: Tertiary Market Figures illustrate different geographic trade areas for Detroit Lakes. The primary and secondary trade areas create the largest demand for goods and services in the city, and represent the basis for calculating commercial demand. Primary. The primary trade area is a three-mile trade radius from the intersection of Highway 10 and Washington Avenue. Residents of the city do a large amount of their shopping in Detroit Lakes and view the city as a place where some goods and services can be met. Secondary. The secondary trade area includes an area roughly 25-mile out from Highway 10 and Washington Avenue and extends out to include surrounding communities, including Frazee, Pelican Rapids, and Perham, but excluding the primary trade area. While residents of this area use Detroit Lakes retailers and service providers for their daily needs there is a significant pull to the larger markets of Moorhead/Fargo, Fergus Falls, Brainerd, and Bemidji. The boundary of the market area uses a gravity model, considering the distance and population size of similar sized communities in the region and the probability that a person may select one community over the other to purchase goods and services. Tertiary. The tertiary trade area is more broadly defined and includes people who visit Detroit Lakes for special events, tourism or destination businesses. In addition, special attractions or places in a downtown district extend the effective size of the local market area. This area extends generally 90-miles from Detroit Lakes to include Park Rapids, Bemidji, Brainerd, and Fargo/ Moorhead. 9
10 WEST LAKE DRIVE PLAN DEMOGRAPHICS Population & Household Change Table 1.1 displays the historical population growth since Detroit Lakes continues to experience a healthy annual growth rate. Table 1.2 compares Detroit Lakes with regional communities outside of Detroit Lakes. Of those communities, Detroit Lakes grew by 16.6% between 2000 and 2010 and grew by 3.8% from In total from Detroit Lakes grew by an estimated 21%. Compared to other communities in the region, Detroit Lakes continues to experience substantial growth, rivaling larger communities such as Bemidji. Nearly all communities saw population growth except for Fergus Falls and Wadena. Population growth in the region influences the economic base and Detroit Lakes continues to capture a portion of this growth. TABLE 1.1: Population Change since 1960, Detroit Lakes YEAR POPULATION DECENNIAL CHANGE DECENNIAL % CHANGE ANNUAL GROWTH RATE , , % 0.3% ,106 1, % 2.1% , % -0.7% , % 1.0% ,569 1, % 1.5% 2015 Est. 8, % 0.75% , % 0.84% Source: U.S. Census Bureau TABLE 1.2: Population Change, Detroit Lakes & Area Communities POP POP. # CHANGE % CHANGE 2015 EST. POP CHANGE % CHANGE Detroit Lakes 7,348 8,569 1, % 8, % Alexandria 8,820 11,070 2, % 11, % Bemidji 11,917 13,431 1, % 14, % Brainerd 13,178 13, % 13, % Fergus Falls 13,471 13, % 13, % Park Rapids 3,276 3, % 3, % Pelican Rapids 2,374 2, % 2, % Perham 2,559 2, % 3, % Wadena 4,294 4, % 4, % Fargo-Moorhead 174, ,777 34, % 223,379 14, % 25-miles* 47,493 50,379 2, % 53,661** 90-miles* 586, ,046 51, % 690,771** Source: U.S. Census Bureau, * 25-mile and 90-mile ring estimates provided by ESRI **2017 estimate provided by ESRI Business Analyst 10
11 1 MARKETS Population Projection Detroit Lakes is attracting people to live in the city and models for projecting population indicate continued growth. Table 1.3 shows the population change since Estimates for future population are supplied by ESRI Business Analyst, a demographics research software. All trade areas are expected to grow, and the area surrounding Detroit Lakes is expected to grow by a higher percentage through Table 1.4 considers a number of potential growth scenarios for Detroit Lakes. 0.63% Growth Rate. A 30-year growth rate considers the long term growth patterns in Detroit Lakes, but puts more emphasis on more recent trends and markets. Since 1980 the city has growth by about 0.63% annually, lower than the 50 year growth because of a decline in population in the 1980s. 0.84% Growth Rate. A 50-year growth rate considers the long term growth patterns in Detroit Lakes to balance decades of slow growth with decades of substantial growth. Since 1960 the city has grown by about 0.84% annually. 1.1% Growth Rate. A 1.1% growth rate assumes a growing demand in the region and growth potential sustained from the 2008 plan. 1.48% Growth Rate. Building construction data, which is discussed later in this chapter, indicates growth rate occurring at about 1.48% annually from This growth rate is similar to growth between and housing that is actually being built in recent years. TABLE 1.3: Projected Population , Market Areas 2000 POP POP. GROWTH RATE BW 2000/2010 % CHANGE 2000/ ESTIMATE 2021 ESTIMATE % CHANGE Detroit Lakes 7,348 8, % 16.6% 9,172 9, % Primary (3-mile) 8,529 9, % 8.8% 9,916 10, % Secondary (25-mile) 47,493 50, % 6.1% 53,141 55, % Secondary-Primary 38,964 41, % 5.5% 43,225 44, % Tertiary (90-mile) 586, , % 8.8% 682, , % Tertiary-Secondary 538, , % 9.1% 628, , % Source: U.S. Census Bureau, ESRI TABLE 1.4: Migration and Growth Scenarios for Detroit Lakes Natural Population Change 8,569 8,377 8,250 8,153 8,067 7, % Annual Growth Rate (Historic 30-year rate) 8,569 8,842 9,124 9,415 9,716 10, % Annual Growth Rate (Historic 50-year rate) 8,569 8,936 9,319 9,718 10,135 10, % Annual Growth Rate (Based on 2008 plan) 8,569 9,051 9,560 10,097 10,665 11, % Annual Growth Rate (Construction b/w 08-16) 8,569 9,222 9,925 10,682 11,496 12,372 *2016 Census population estimate was 9,165 Source: U.S. Census Bureau, RDG Planning & Design Population projections from the West Lake Drive Plan are relatively in alignment with the 2018 housing study. Detroit Lakes is expected to reach a population of 10,665 by Detroit Lakes is positioned to continue their strong growth given the recent residential construction for multi-family and single-family housing. Even with uncertainties of the housing market, an annual growth rate of 1.1% is used, which compares similarly to building construction between
12 WEST LAKE DRIVE PLAN Income Characteristics Table 1.5 presents the 2016 estimated median household income for residents of Detroit Lakes, the primary area, the secondary area (including the primary market), and tertiary area. Some of the highest incomes in the region are in the area surrounding Detroit Lakes which begin to capture other metropolitan regions such as Bemidji, Fargo, and Brainerd. The rate at which each area s median income is growing is more near Detroit Lakes than the larger trade area. Workplace & Employment Table 1.6 indicates the different types of businesses and number of individuals employed in each business segment within the primary and secondary trade areas. In the primary area the three largest employment bases are in service, retail, and manufacturing, which accounts for 71% of all employment. Within the secondary area the largest employment base is service-oriented at 37%. Retail and manufacturing follow with 18% and 15%, respectively. TABLE 1.5: Median Household Income Forecasts in Detroit Lakes Market Areas, ESTIMATED 2021 ESTIMATED CHANGE % CHANGE Detroit Lakes $43,295 $47,902 $4, % Primary (3-mile) $44,792 $50,464 $5, % Secondary (25-mile) $52,073 $56,699 $4, % Tertiary (90-mile) $51,536 $55,415 $3, % Source: ESRI TABLE 1.6: Work Places and Employment for Detroit Lakes Trade Areas, 2016 PRIMARY TRADE AREA SECONDARY TRADE AREA Business Description TOTAL TOTAL % TOTAL EMPLOYED % ESTABLISHMENTS ESTABLISHMENTS % TOTAL EMPLOYED % Industries (All) % 11, % 3, % 28, % Agriculture 28 3% 211 2% 184 6% 723 3% Mining 0 0% 0 0% 0 0% 0 0% Construction 85 9% 470 4% % 1,515 5% Manufacturing 36 4% 1,810 16% 117 4% 4,278 15% Trans, Communications/Public Utilities 50 5% 461 4% 184 6% 1,901 7% Wholesale Trade 31 3% 328 3% 98 3% 1,401 5% Retail % 2,497 22% % 5,055 18% Finance % 488 4% % 1,080 4% Service % 3,824 33% 1,041 35% 10,554 37% Public Administration 73 7% 1,410 12% 167 6% 2,357 8% Source: ESRI Business Analyst 12

13 1 MARKETS PROJECTED ANNUAL EXPENDITURE GROWTH ESTIMATING RETAIL SALES AND EXPENDITURES Estimating retail sales are a vital component to understand retail forces that attract people to a community and opportunities for new retail development. Detroit Lakes is also unique as a major tourism destination. The components of understanding the retail environment in Detroit Lakes include: Consumer Spending Patterns Retail Sales Volume Retail Sales Performance Tourism Performance Retail Market Potential Several methods can be considered to calculate retail sales in a specified category depending on the data available and purpose of the study. This report relies on data provided by ESRI Business Analyst to calculate retail sales supply and demand in trade areas that do not follow jurisdictional boundaries. Taxable sales reported by the Minnesota Department of Revenue are referenced to compare Detroit Lakes with peer communities and the tourism industry. Common methods for calculating retail sales include: Store Size estimates the square footage of commercial stores in an area and multiplies it by expected sales volume per square foot. Urban Land Institute provides assumption data on sales volume required by business types. Advantages: Quick insight into potential retail opportunities Can be applied to a trade area that does not follow jurisdictional boundaries Disadvantages: An estimate and not indicative of actual sales Assumes businesses in the trade area perform similarly to national averages Data can be difficult to obtain and time consuming Statistical Modeling estimates consumer spending in a defined area. Data often needs to be obtained from third party sources that use statistical calculations that draw upon multiple sources such as the Bureau of Labor Statistics and U.S. Census. Advantages: Considers actual spending patterns of households in the trade area based on reputable sources Can be applied to a trade area that does not follow jurisdictional boundaries. Uses advanced statistical methods to reconcile many sources of retail data. Disadvantages: Data can be difficult to obtain unless subscribing to a service. Estimates vary by the methodology used by the third party data service. Taxable Sales Method. Some states report the tax receipts from gross sales by business category. The taxable sales represent actual retail sales. Advantages: Can be easier to obtain depending on State. Comparable to other peer cities in the State Disadvantages: Data may be inaccurate for several reasons: States have administrative rules that change over time. Certain items may be exempt from sales tax, resulting in under-reporting. Generally, gross sales are left to each business to report (which may not be secluded to local sales) whereas taxable sales are required. Does not allow customized trade area analysis. 13
14 WEST LAKE DRIVE PLAN Consumer Spending Patterns Table 1.7 compares annual consumer expenditures by product type in each trade area to the national average. The retail spending index provides a glimpse into the spending habits of residents in both the primary market and the total market areas compared to the national average (an index value of 100). In addition to the national comparison, the average per capita spending is illustrated in Table 1.8. The retail spending index illustrates consumer habits by considering what goods and services are convenient, the willingness to spend money in certain market sectors, and other contributing factors. Notable finding include: Households in the primary trade area spend less than the national average in all commercial market segments. Households in the secondary trade area tend to spend more in all market segments than the primary trade area. Spending on pets and recreational vehicles is above the national average for areas outside the primary trade area. On a per capita basis, the largest portion of household spending occurs in food and transportation. TABLE 1.7: Spending Potential Index, 2016 PRODUCT TYPE PRIMARY SECONDARY TERTIARY Apparel and Services Entertainment & Recreation Fees and Admissions TV/Video/Audio Pets Toys/Games/Crafts/Hobbies Recreational Vehicles and Fees Sports/Recreation/Exercise Equipment Photo Equipment and Supplies Reading Catered Affairs Food Food at Home Food Away from Home Transportation Gasoline and Motor Oil Vehicle Maintenance/Repairs Travel Airline Fares Lodging on Trips Auto/Truck Rental on Trips Food and Drink on Trips Source: ESRI Business Analyst 14
15 1 MARKETS Retail Sales Volume Table 1.8 indicates total retail sales in the total market area (primary and secondary). Fuel stations, automobile dealers, and nonstore retailers are removed from the analysis because these uses either do not attract visitors making multiple retail stops, do not generate brick and mortar stores, or are so large in scale they are not appropriate for the walkable pedestrian environment envisioned for West Lake Drive. In 2016, the primary market reported $234,032,370 in retail sales, while the secondary market reported slightly less at $193,503,975 (excluding the three mile primary market area). Table 1.9 shows that retail sales have rebounded and exceeded levels from the 2008 recession and are starting to level off. The secondary market includes a substantially larger area than the primary market. However, there are fewer communities with the retail capacity or population in this area as Detroit Lakes. Of the total $427,536,345 retail dollars spent in the combined primary and secondary areas, about 55% of retail sales within the 25-mile area were reported in and around the immediate vicinity of Detroit Lakes. RETAIL SALES PERFORMANCE One way of evaluating Detroit Lakes retail role in the region is to analyze the level of retail spending in the market areas compared to the amount of retail uses provided. The analysis compares actual spending to the amount predicted based on the population. The purpose of this analysis is to identify the market sectors that attract spending into Detroit Lakes (surplus sectors) and those market sectors where spending is not being captured (gap sectors). The analysis allows for logical interpretation whether it would be possible to support additional businesses by capturing lost spending. The recommendations focus TABLE 1.8: Per Capita Amount Spent, 2016 Product Type PRIMARY SECONDARY TERTIARY Apparel and Services $1,567 $1,701 $1,777 Entertainment & Recreation $2,299 $2,691 $2,678 Fees and Admissions $418 $409 $441 TV/Video/Audio $989 $1,136 $1,136 Pets $425 $569 $536 Toys/Games/Crafts/Hobbies $91 $108 $107 Recreational Vehicles and Fees $80 $108 $102 Sports/Recreation/Exercise Equipment $122 $163 $160 Photo Equipment/Supplies $42 $46 $47 Reading $109 $129 $124 Catered Affairs $18 $20 $20 Food $6,524 $7,410 $7,516 Food at Home $4,081 $4,708 $4,720 Food Away from Home $2,442 $2,701 $2,795 Transportation Gasoline and Motor Oil $2,498 $3,070 $3,021 Vehicle Maintenance/Repairs $831 $1,001 $984 Travel Airline Fares $336 $353 $367 Lodging on Trips $ $409 $402 Auto/Truck Rental on Trips $17.38 $19 $20 Food and Drink on Trips $ $390 $385 Source: ESRI Business Analyst 15
16 WEST LAKE DRIVE PLAN TABLE 1.9: Share of Total Retail Sales, 2016 TOTAL RETAIL SALES % OF TOTAL Primary (3-mile) $234,032,370 55% Secondary (25-mile) $193,503,975 45% Total $427,536, % *Minnesota Department of Revenue reported $266,681,941 of gross sales for Detroit Lakes in 2015, although gross sales are not verified by the DOR, whereas taxable sales equaled $155,796,088. Source: ESRI on evaluating opportunities for businesses that are appropriate for West Lake Drive. Table 1.10a and 1.10b identifies the gap between consumer demand (expected expenditures) and estimated retail sales within each of the community s trade areas. A positive value results from demand exceeding supply and reflects a leakage of consumer dollars. Gap markets indicate people are traveling elsewhere for a good or service. If the gap is large enough to support a new venture, efforts should be made to recruit or incubate a business to fill the gap. A negative value results from sales exceeding demand and indicates a flow of regional dollars into the city s retail trade areas. Surplus markets indicate that Detroit Lakes is a destination for certain goods and services. Efforts could be made to expand this niche. People from outlying areas are traveling to Detroit Lakes to spend their money CITYWIDE MARKET REVIEW Detroit Lakes attracts substantial spending from outside of the community. Within Detroit Lakes primary market, retail sales were reportedly over $234 million with the adjustment factor. The primary area s population would feasibly generate a demand of about $105 million. The difference is over $128 million that comes from outside of the community to the immediate area of Detroit Lakes. In other words, people from outlying areas are traveling to Detroit Lakes to spend their money. The total surplus in retail spending in 2016 of $233 million is substantially more than the estimated surplus in 2007 of $156 million. Significant surplus retail markets in the primary market include: Building Materials, Garden Equipment, & Supply Stores Food & Beverage Stores (particularly grocery stores) Health & Personal Care Stores General Merchandise Stores Restaurants/Other Eating Places The primary market does not have many significant gap retail markets. However, some opportunities include: Electronics & Appliance Stores Sporting Goods, Hobby, Book & Music Stores General Merchandise Stores other than Department Stores The largest portion of adjusted retail sales in the primary market comes from General Merchandise Stores (28%) followed by Building Material Stores (22%). Whereas the largest portion of household expenditures occur in General Merchandise Stores (24%) and Food and Beverage Stores (21%). Retail Summary Detroit Lakes is attracting spending from the surrounding region to the community. Yet, the city has the opportunity to capture additional retail spending from the peripheral areas as the combined primary and secondary market shows leakage to larger market areas. This pattern is predictable as the city competes with metropolitan areas that offer more options and memory making experiences. Surplus retail markets in the total market are limited: Building Materials, Garden Equipment, & Supply Stores Beer, Wine, & Liquor Stores Drinking Places The total market has many significant gap retail markets: Furniture Stores Electronics & Appliance Stores Grocery Stores Health & Personal Care Stores Clothing Stores Sporting Goods, Hobby, Book & Music Stores General Merchandise Stores Restaurants/Other Eating Places The portion of adjusted retail sales and expenditures in the market segments are similar to the primary market. 16
17 1 MARKETS TABLE 1.10A: Primary Market Area s Demand, Supply and Opportunity Gap, 2016 PRIMARY SECONDARY TOTAL 2016 DEMAND CONSUMER EXPENDITURES 2016 SUPPLY RETAIL SALES OPPORTUNITY GAP/SURPLUS 2016 DEMAND CONSUMER EXPENDITURES 2016 SUPPLY RETAIL SALES OPPORTUNITY GAP/SURPLUS 2016 DEMAND CONSUMER EXPENDITURES 2016 SUPPLY RETAIL SALES OPPORTUNITY GAP/SURPLUS TOTAL RETAIL SALES $147,980,628 $381,642,938 -$233,662,310 $722,726,878 $342,484,935 $380,241,943 $870,707,506 $724,127,873 $146,579,633 ADJUSTED RETAIL SALES (EXCLUDING NONSTORE, AUTO DEALERS, AND GAS) $105,235,330 $234,032,370 -$128,797,040 $502,994,216 $193,503,975 $309,490,241 $608,229,546 $427,536,345 $180,693,201 Motor Vehicle & Parts Dealers $30,723,021 $114,499,770 -$83,776,749 $158,277,210 $68,455,026 $89,822,184 $189,000,231 $182,954,796 $6,045,435 Automobile Dealers $25,260,200 $81,980,450 -$56,720,250 $129,575,480 $29,001,033 $100,574,447 $154,835,680 $110,981,483 $43,854,197 Other Motor Vehicle Dealers $3,434,123 $27,088,016 -$23,653,893 $18,595,610 $30,174,331 -$11,578,721 $22,029,733 $57,262,347 -$35,232,614 Auto Parts, Accessories & Tire Stores $2,028,698 $5,431,304 -$3,402,606 $10,106,120 $9,279,663 $826,457 $12,134,818 $14,710,967 -$2,576,149 Furniture & Home Furnishings Stores $3,644,664 $4,633,567 -$988,903 $16,279,424 $5,729,546 $10,549,878 $19,924,088 $10,363,113 $9,560,975 Furniture Stores $2,264,771 $3,480,611 -$1,215,840 $9,637,933 $3,220,133 $6,417,800 $11,902,704 $6,700,744 $5,201,960 Home Furnishings Stores $1,379,893 $1,152,956 $226,937 $6,641,491 $2,509,413 $4,132,078 $8,021,384 $3,662,369 $4,359,015 Electronics & Appliance Stores $7,304,126 $4,511,241 $2,792,885 $32,922,557 $8,665,666 $24,256,891 $40,226,683 $13,176,907 $27,049,776 Bldg Materials, Garden Equip. & Supply Stores $8,555,138 $50,380,293 -$41,825,155 $47,322,698 $28,943,334 $18,379,364 $55,877,836 $79,323,627 -$23,445,791 Bldg Material & Supplies Dealers $7,502,119 $47,591,112 -$40,088,993 $40,763,333 $25,213,686 $15,549,647 $48,265,452 $72,804,798 -$24,539,346 Lawn & Garden Equip & Supply Stores $1,053,019 $2,789,181 -$1,736,162 $6,559,365 $3,729,648 $2,829,717 $7,612,384 $6,518,829 $1,093,555 Food & Beverage Stores $22,240,309 $43,475,355 -$21,235,046 $105,267,952 $50,805,416 $54,462,536 $127,508,261 $94,280,771 $33,227,490 Grocery Stores $18,489,443 $37,006,292 -$18,516,849 $88,027,704 $24,061,458 $63,966,246 $106,517,147 $61,067,750 $45,449,397 Specialty Food Stores $1,538,045 $2,691,528 -$1,153,483 $7,258,384 $4,606,387 $2,651,997 $8,796,429 $7,297,915 $1,498,514 Beer, Wine & Liquor Stores $2,212,821 $3,777,535 -$1,564,714 $9,981,865 $22,137,571 -$12,155,706 $12,194,686 $25,915,106 -$13,720,420 Health & Personal Care Stores $9,016,175 $18,582,226 -$9,566,051 $46,031,226 $21,235,100 $24,796,126 $55,047,401 $39,817,326 $15,230,075 Gasoline Stations $9,517,832 $29,311,371 -$19,793,539 $48,653,913 $79,044,928 -$30,391,015 $58,171,745 $108,356,299 -$50,184,554...continued -$000,000 $000,000 Represents a strong category and ability to attract spending from outside of the market area. Represents a category experiencing leakage and is an opportunity to capture spending. 17
18 WEST LAKE DRIVE PLAN TABLE 1.10B: Primary Market Area s Demand, Supply and Opportunity Gap, 2016 PRIMARY SECONDARY TOTAL 2016 DEMAND CONSUMER EXPENDITURES 2016 SUPPLY RETAIL SALES OPPORTUNITY GAP/SURPLUS 2016 DEMAND CONSUMER EXPENDITURES 2016 SUPPLY RETAIL SALES OPPORTUNITY GAP/SURPLUS 2016 DEMAND CONSUMER EXPENDITURES 2016 SUPPLY RETAIL SALES OPPORTUNITY GAP/SURPLUS Clothing & Clothing Accessories Stores $5,989,773 $6,889,354 -$899,581 $26,274,813 $5,632,839 $20,641,974 $32,264,586 $12,522,193 $19,742,393 Sporting Goods, Hobby, Book & Music Stores $3,677,553 $1,998,040 $1,679,513 $17,055,642 $3,928,074 $13,127,568 $20,733,195 $5,926,114 $14,807,081 Sporting Goods/Hobby/Musical Stores $3,149,404 $1,515,102 $1,634,302 $14,632,140 $3,408,482 $11,223,658 $17,781,544 $4,923,584 $12,857,960 Book, Periodical & Music Stores $528,149 $482,938 $45,211 $2,423,502 $519,592 $1,903,910 $2,951,651 $1,002,530 $1,949,121 General Merchandise Stores $25,249,164 $65,869,273 -$40,620,109 $118,686,789 $19,764,993 $98,921,796 $143,935,953 $85,634,266 $58,301,687 Department Stores Except Leased Depts. $19,598,270 $63,656,636 -$44,058,366 $91,450,270 $17,171,043 $74,279,227 $111,048,540 $80,827,679 $30,220,861 Other General Merchandise Stores $5,650,895 $2,212,637 $3,438,258 $27,236,518 $2,593,950 $24,642,568 $32,887,413 $4,806,587 $28,080,826 Miscellaneous Store Retailers $6,194,479 $7,282,915 -$1,088,436 $33,019,562 $12,424,376 $20,595,186 $39,214,041 $19,707,291 $19,506,750 Florists $268,066 $490,713 -$222,647 $1,517,679 $474,802 $1,042,877 $1,785,745 $965,515 $820,230 Office Supplies, Stationery & Gift Stores $950,025 $670,552 $279,473 $4,336,892 $2,634,456 $1,702,436 $5,286,917 $3,305,008 $1,981,909 Used Merchandise Stores $598,057 $352,284 $245,773 $2,627,552 $1,651,028 $976,524 $3,225,609 $2,003,312 $1,222,297 Other Miscellaneous Store Retailers $4,378,331 $5,769,366 -$1,391,035 $24,537,438 $7,664,090 $16,873,348 $28,915,769 $13,433,456 $15,482,313 Nonstore Retailers $2,504,445 $3,799,427 -$1,294,982 $12,801,539 $1,481,006 $11,320,533 $15,305,984 $5,280,433 $10,025,551 Electronic Shopping & Mail-Order Houses $1,712,826 $2,771,349 -$1,058,523 $7,879,687 $0 $7,879,687 $9,592,513 $2,771,349 $6,821,164 Vending Machine Operators $116,846 $0 $116,846 $546,671 $1,415,518 -$868,847 $663,517 $1,415,518 -$752,001 Direct Selling Establishments $674,773 $1,028,078 -$353,305 $4,375,181 $65,488 $4,309,693 $5,049,954 $1,093,566 $3,956,388 Food Services & Drinking Places $13,363,948 $30,410,106 -$17,046,158 $60,133,556 $36,374,631 $23,758,925 $73,497,504 $66,784,737 $6,712,767 Special Food Services $333,679 $0 $333,679 $1,594,371 $754,365 $840,006 $1,928,050 $754,365 $1,173,685 Drinking Places - Alcoholic Beverages $726,854 $634,529 $92,325 $2,970,228 $5,397,226 -$2,426,998 $3,697,082 $6,031,755 -$2,334,673 Restaurants/Other Eating Places $12,303,414 $29,708,463 -$17,405,049 $55,568,958 $30,290,154 $25,278,804 $67,872,372 $59,998,617 $7,873,755 Source: ESRI Business Analyst -$000,000 $000,000 Represents a strong category and ability to attract spending from outside of the market area. Represents a category experiencing leakage and is an opportunity to capture spending. 18
19 1 MARKETS TOURISM PERFORMANCE Tourism in Detroit Lakes primary market is healthy, and can continue to offer more experiences for visitors. The city supports a regional mall, larger grocery stores, and many restaurants. The performance of the tourism industry helps determine the potential for future retail space growth, among other factors such as changing preferences and movement toward online shopping. Figure 1.4 shows leisure and hospitality sales from 2008 which include performing arts/sports venues, gambling, amusement, accommodation, and food service establishments. Similar to overall retail sales, spending on leisure and hospitality has rebounded from the 2008 recession. Detroit Lakes experiences an influx of tourists in the summer months. Figure 1.5 illustrates food and beverage sales by month between 2012 and Sales on food and beverages peak in August which translates into summer peaks for other retail categories. Resorts contribute to the tourism industry in Minnesota and Becker County. People staying at resorts depend on surrounding communities for food, supplies, or simply a night to get off the resort. Gross sales at resorts in Minnesota continue to grow, increasing from about $268 million in 2013 to $284 million in Data for counties with more than 10 resorts indicate the industry around Detroit Lakes remains stable. Becker County reported 30 resorts in 2015, which ranks in the middle compared to the number in other Minnesota counties. Becker County ranks 9th out of 17 counties that have more than 10 resort establishments when considering resort sales per capita of the county population - no change since Percent growth in resort sales in Becker County between 2013 and 2015 was 8.28%, which is comparable to other resort counties. FIGURE 1.4: Liesure Leisure and and Hospitality Hospitality Taxable Taxable Sales Sales FIGURE 1.5: Food Food and and Beverage Beverage Sales Sales by month by Month $60, $50, $40, $30, $20, $10, $ Source: Minnesota Department of Revenue FIGURE 1.5: Resort Sales Percent, Todd County Stearns County St. Louis County Otter Tail County Mille Lacs County Lake of the Woods County Lake County Itasca County Hubbard County Douglas County Crow Wing County Cook County Cass County Beltrami County Becker County Aitkin County Northwest Minnesota % % -5.00% 0.00% 5.00% 10.00% 15.00% 20.00% 25.00% Source: Minnesota Department of Revenue 19


20 WEST LAKE DRIVE PLAN RETAIL SPACE POTENTIAL Translating Gaps Detroit Lakes captures a significant amount of the consumer spending in the city and pulls consumers from peripheral areas. The data shows little to no leakage of spending for retail categories in the primary market, and capturing any leakage from the primary market translates to a marginal increase of commercial space. However, the city could capture more spending from the secondary market (25-mile area). Right now, the larger secondary market area sees more households shopping elsewhere at destinations in the region than Detroit Lakes. While the local tourism market remains strong and retail growth will continue as the city continues to enhance their public spaces, downtown, and housing. Ultimately, the collection of experiences found in Detroit Lakes draws people to the community. Large retail gaps indicate a potential for additional/ new businesses in the primary trade area. But not all gaps indicate opportunities. Some markets are already saturated in Detroit Lakes. For example, department stores require a large market area and population base to meet profit demands. Larger retail options that could support gaps and attract people to travel 25+ miles to Detroit Lakes are plausible, but not appropriate for West Lake Drive. However, larger format retail (such as those west of Highway 59) can benefit businesses in downtown and West Lake Drive when shoppers are steered to the central business district through wayfinding, gateways, events, and promotions. Detroit Lakes ability to attract consumers from peripheral areas relies on the city offering a mix of services and providing unique experiences where customers wants to return. Enhancing the appearance and experience of West Lake Drive contributes to a consumer s decision to visit Detroit Lakes versus another city. The corridor, particularly the area from Zorbaz to Washington Avenue, presents the strongest potential for creating an entertainment district that presents customers with places to eat and people watching. Small specialty shops, like Lake Shirts, thrive and similar retail would build on this theme. Some retail can be incorporated into mixed-use developments that create lively environments and public spaces. As indicated before, these gaps could include specialty stores, smaller merchandise stores, and restaurants. HOUSING POTENTIAL Residential development continues to be critical to growth and revitalization initiatives in many communities. Housing development is becoming a more important priority for cities than retail as retail feeds off permanent residents, in addition to visitors and employees. Housing near commercial areas also needs to accommodate the preferences of a wide variety of households at various price points. The 2018 Housing Study indicates that the housing demand for Detroit Lakes is units per year with units being owner-occupied and units being renter-occupied. Concepts for West Lake Drive can absorb some of the demand. 20

21 1 MARKETS CONCLUSIONS Detroit Lakes remains a strong tourism destination in Northwest Minnesota and serves as a center for households living and spending in the region. Historic population growth and recent building activity point toward continued strong growth in the future. Redevelopment along West Lake Drive needs to be mindful of the district s context relative to the broader development patterns in Detroit Lakes. Several insights from the market analysis should steer policy directions in Detroit Lakes to continue momentum and maintain Detroit Lakes status as a high quality community to visit, work, and live. These policies include: Continue to transform the downtown and lake front as a destination in Detroit Lakes to reinforce elements that draw visitors to the region, and subsequently Detroit Lakes. Obviously, the appeal of West Lake Drive are its lake views. Providing recreational opportunities and connections to the lake further enhances the appeal and character of the corridor. Continue supporting quality development of quality commercial areas. This can be ensured by design guidelines and pedestrian features. Per 2018 Housing Study, address housing affordability issues for the lowest income households and service-oriented workforce. Residential uses not seen elsewhere in Detroit Lakes can be targeted, particularly rental multifamily, to accommodate seniors and young people not looking for conventional single-family homes. Plan for seasonal and recreational properties and locate these uses in an efficient development pattern if located in the city. The retail market is strong, but uncertainties remain with the growth in online shopping. However, opportunities for specialty shops and neighborhood commercial can be successful along West Lake Drive. Larger commercial developments and uses to capture secondary market spending should be located in other strategic locations in the city. 21
22 22
23 STRATEGIC PLANNING The West Lake Drive Plan builds on the principles and goals of the Business Corridors Plan prepared in The First Principles of this plan continues the momentum and commitment of past planning efforts by describing what success looks like for the community. These principles emerged from numerous interviews, small group discussions, and meetings. 23 2
24 WEST LAKE DRIVE PLAN 2017 RFP FOR CONSULTANTS CONSULTANT SELECTED LAUNCH SURVEY FOCUS GROUPS COMMUNITY ROUNDTABLE DESIGN STUDIO DESIGN REVIEW II OPEN HOUSE 1 CONCEPT REFINEMENT OPEN HOUSE 2 & DLDA REVIEW 2018 CITY COUNCIL WORK SESSION DEVELOPMENT AUTHORITY REVIEW INPUT DESIGN REFINEMENT IMPLEMENTATION APPROVAL J F M A M J J A S O N D J F M A M J J Activities for public input and feedback for the West Lake Drive Corridor Plan began in June 2017 and wrapped up by the end of the year. The process was designed to involve seasonal visitors and year-round residents. The public launch of the project began with a public kick-off meeting where participants identified the goals and key focus areas of the plan. The consultant team then began exploring concepts to respond to these goals. Ultimately, concepts were refined for inclusion in this plan. This plan recommends policies largely based on opinions and perceptions of those who know the community best and participated in the process its residents and business and property owners. The specific components of the public participation process include: Detroit Lakes Development Authority Steering Committee Meetings. The Detroit Lakes Development Authority (DLDA) served as the steering committee throughout the planning process. The DLDA met at key points during the planning process to review the progress of the plan and make revisions to initial concepts. All meetings were open to the public. Website. A project website was developed at the beginning of the process to post progress updates and announcements. Questionnaire. A questionnaire was released in June The results of the process identify preliminary issues and goals, which were addressed in more detail during focus group discussion. Results are summarized in the appendix. Focus Group Meetings. Focus group meetings were held in June Residents (yearround and seasonal), business and property owners, financial institutions, and public officials participated in roundtable discussions to share their opinion of the district and its future opportunities. Interviews. The project team intercepted walkers, picnickers, beach-goers, and attendees of the Cruise DL Night. Discussion focused likes and dislikes of the corridor. Kick-off Meeting. A kick-off meeting on July 10th, 2017 began the planning process for the West Lake Drive Corridor Plan. The meeting reviewed the planning process and broke people into small groups to talk about strategies for the future. Design Workshops. Workshops were held on July 31 and August 1. These workshops engaged citizens, residents, business owners, and other stakeholders in the planning process. Participants shared their ideas, issues and concerns informally with planners and designers, while actively drawing their concepts for the future of the corridor. Open House. An evening presentation was hosted by the City of Detroit Lakes at City Hall on October 17th. The open house provided the public an opportunity to review and provide comments to the development concept prior to the approval process. Open House Encore. The city hosted an encore of the open house on December 18th. The event included an updated concept to reflect feedback received from the previous open house. City Council Work Session. The City Council hosted a work session on January 25th to review the results of the plan and prepare strategies for proceeding with implementation. DLDA members participated in the session, as well. Approval. After the plan was reviewed by the DLDA on March 27, the plan was forwarde to the Planning Commission and City Council for approval. 24


, business and")


25 2 FIRST PRINCIPLES 2017 JUNE Focus Group Meetings. Focus group meetings were held in June Residents (year-round and seasonal), business and property owners, financial institutions, and public officials participated in roundtable discussions to share their opinion of the district and its future opportunities. 25


26 WEST LAKE DRIVE PLAN 2017 JULY Kick-off Meeting. A kick-off meeting on July 10th, 2017 began the planning process for the West Lake Drive Corridor Plan. The meeting reviewed the planning process and separated people into small groups to talk about strategies for the future. Results of the event became the foundation for focus ares at the design studio and development plan. 26


27 2 FIRST PRINCIPLES 2017 JULY Design Workshops. The city hosted a twoday workshop to engage citizens, residents, business owners, and other stakeholders in the planning process. Participants shared their ideas, issues and concerns informally with planners and designers, while actively drawing their concepts for the future of the corridor. Workshops were held on July 31 and August 1. 27


28 WEST LAKE DRIVE PLAN 2017 OCTOBER Open House. An evening presentation was hosted by the City of Detroit Lakes at City Hall on October 17th. The open house provided the public an opportunity to review and provide comments to the development concept prior to the approval process. 28


29 2 FIRST PRINCIPLES GUIDING PRINCIPLES BUILD MEMORIES INCREASE BUSINESS & PRIVATE INVESTMENT IMPROVE MOBILITY OPTIONS MAXIMIZE THE LAKEFRONT The guiding principles reflect a community focused on a vibrant and dynamic future of lasting value - one that promotes public health, social engagement, a robust economy, natural resources and life-long learning. The residents and leaders have welcomed the opportunity to plan for a long-term future in the hopes of making West Lake Drive an even stronger community attraction. The people of Detroit Lakes now plan proactively for their future. Their conversations point to a set of principles that should shape the city s work ahead for years to come. It should be noted the four themes of build memories, increase business and private investment, improve mobility options, and maximize the lakefront are ever present as an undercurrent to these guiding principles. These principles - intended to drive decision-making - are derived from the many stakeholder conversations and broad public input sessions held in support of this plan. The spirit of the concepts in these plan is to achieve these guiding principles. 29

30 WEST LAKE DRIVE PLAN BUILD MEMORIES BUILD MEMORIES The idea of experience is fundamental to business in Detroit Lakes. This experience takes place at a number of levels a visitor to an event at the Pavilion, a summer day on the beach at Lake Detroit, a show or concert at the Holmes Theater, or eating at a friendly and iconic local restaurant. Memories and images of Detroit Lakes stay with people with great clarity for decades indeed, for lifetimes. Energizing West Lake Drive with life and activity will both increase the customers satisfaction, build local pride, and cause visitors to return. 30

31 2 FIRST PRINCIPLES INCREASE BUSINESS & PRIVATE INVESTMENT INCREASE BUSINESS & PRIVATE INVESTMENT The development program should create an environment for new investment. The program should provide greater stability for existing businesses, and reward reinvestment in buildings, new business starts, and other responses that strengthen the district. Initial investments in the public realm can create conditions for economic growth that is unlikely to happen spontaneously. These investments will preserve and increase property values, increase sales tax revenues, and create a district that brings new business to the city. 31

32 WEST LAKE DRIVE PLAN IMPROVE MOBILITY OPTIONS IMPROVE MOBILITY OPTIONS West Lake Drive should provide a safe and comfortable atmosphere for pedestrians and bicyclists, while moving traffic smoothly. Reallocating the right-of-way is an excellent opportunity for improving the convenience and comfort of circulation throughout the district. Providing better linkages between West Lake Drive and downtown improves visibility and makes the district more pleasant. Parking supply is also an important issue. Available parking is often competitive and inconvenient to the destination. The overall plan should provide convenient parking that does not overwhelm the district s fabric and feel. 32

33 2 FIRST PRINCIPLES MAXIMIZE THE LAKEFRONT MAXIMIZE THE LAKEFRONT The life and lights of Detroit Lakes lakefront and beach have long symbolized the city. Yet, many people believe that status is threatened by recent trends that have drained some of the waterfront s vitality. Most frequently cited are the decline in visitor resorts and the replacement of commercial businesses by suburban-like condominiums, many of which are seasonally occupied. The plan should restore the life of the lakefront, recognizing and using demands for lakefront residential settings to strengthen the retail and entertainment base. 33
34 34
35 DEVELOPMENT PLAN The Development Plan establishes strategies to unify the West Lake Drive corridor, connecting visitor destinations and creating an experience for visitors to walk and ride outside and explore the community. 35 3


36 WEST LAKE DRIVE PLAN DEVELOPMENT PROGRAM FIGURE 3.1. West Lake Drive Plan - Development Areas Forest Street The program for West Lake Drive includes: Creating opportunities for both future retail and residential development. Establishing a redevelopment concept for the strategic but commercially underused block of West Lake Drive from Washington Avenue to Legion Road. Rossman Avenue Summit Avenue Minnesota Avenue Lake Avenue Washington Avenue Improving bicycle and pedestrian accommodations along the beachfront. Improving parking and traffic circulation throughout the district. Preventing encroachment of parking and commercial uses into adjacent residential neighborhoods. Figure 3.1 identifies major initiatives of the development program. Projects are described The Development Plan is organized into the following districts: West Lake Drive West End Development Lakeview Development Lakeside Development Pavilion and Beachfront Washington Avenue Sites considered for redevelopment were introduced by participants in the planning process. Concepts presented in this plan reflect the input and feedback from area residents and business owners. Figure 3.2 shows the development concept for the West Lake Drive Environs. West Lake Drive is one of Detroit Lakes most memorable streets. West Lake Drive West End Development Lakeview Development Lakeside Development Pavilion and Beachfront Washington Avenue 36
37 3 DEVELOPMENT CONCEPT FIGURE 3.2. West Lake Drive Plan - Development Concept D Forest Street Extension C E F Rossman Avenue Peoples Park Forest Street Peoples Summit Avenue Minnesota Avenue Lake Avenue Washington Avenue 7 7 L Langford Street North Shore Drive City Park Peoples Street G 3 WEST LAKE DRIVE J 4 K County Fairgrounds 2 2 H I i H I 5 6 ii C 2 B 1 Legion Road A i WEST LAKE DRIVE # PROJECTS 1. West End Mixed-Use 2. Lakeview Development 3. Proposed Rossman Park 4. Lakeside Mixed Use 5. Pavilion Reconstruction 6. Clubhouse 7. Possible Mixed-Use Development 8. Neighborhood Preservation X MOBILITY A. Trail Connection to Dunton Locks B. New Peoples Trail C. New Street D. Forest Street Extension E. Fairgrounds Promenade F. Parking Reconfiguration G. Peoples Street Extension H. West Lake Drive Pathway & North Side Walk I. Beachfront Walk J. Parking Structure (2-Level) K. Expanded Parking L. Langford/Forest Street Realignment i. Non-motorized Boat Launch ii. Possible Boat Launch Relocation 37


38 WEST LAKE DRIVE PLAN MOBILITY AND ACCESS Participants identified good access for all modes as a priority. Early discussions ranged from closing the street to adding angle parking on both sides of the street. Participants preferred concepts that enhance the walkability of the corridor, improve the convenience for bicyclists, and, yet retain access for motorists. Concepts in this section focus on promoting mobility for pedestrians and bicyclists who visit Detroit Lakes destinations rather than passersby. The system should be complement a wayfinding system oriented to pedestrians and bicyclists. Figure 3.3 shows the mobility concept for the corridor. Shuttle Service Elements of the concept include: 1. Improve Pedestrians Movements. The concept enhances the existing walkways along the beach and northside of West Lake Drive. Also, it adds another multi-use path along the south side of West Lake Drive. All paths should be ADA accessible. Beachfront Walk. Replacing the narrow walkway between the beach and lawn with a wider pathway provides pedestrians an ability to walk side-by-side and runners with a level surface. Reportedly, the concrete s original function was intended to separate the sand and lawn, yet it is used as a walking path. North Side Walk. Widening the sidewalk on the north side of West Lake Drive allows pedestrians to walk with greater ease from business-to-business. Wider walks lets pedestrians side-by-side, limiting the amount of someone needing to walk on the turf or street. West Lake Pathway. Establishing a new multiuse path on the south side of West Lake Drive presents an option for both pedestrians and cyclists to move through the district while under shade. The amount of right-of-way is limited and numerous obstructions are present. This chapter discusses this concept in more detail. Peoples Pathway. A new Peoples Pathway, running parallel to West Lake Drive and behind business, adds trail access for the neighborhood and creates a buffer between the neighborhood and existing businesses. Also, the path provides more of a direct route from City Park to the County Fairgrounds. 2. Improve Bicyclist Movements. Cyclists need to move through the area without competing with pedestrians and vehicles, particularly for people (families) riding in groups. Establishing the West Lake Pathway becomes an even more promising solution to encourage cycling in the corridor. 3. Connect to Regional Trail. The city has plans to build a trail along West Lake Drive, west of Legion Road. The West Lake Pathway should connect to this trail. 4. Boat Access. Boat access on Lake Detroit has improved in the last decade with two new launches. Considering the increased demands for monitoring invasive species and the conflicts associated with the process of loading/unloading, the plan proposes two actions. Removing or relocating motorized boat launches. Launching boats along West Lake Drive interrupts traffic flow, fractures the continuity of the beach, and occupies parking spaces that could otherwise be dedicated for people visiting the beach or businesses. A new boat launch could be considered in City Park, using the alignment of the Lincoln Avenue. Retaining non-motorized boat launch. The launch near Rossman Avenue will be retained for non-motorized boats, including canoes, kayaks, and sail boats. 5. Shuttle Service. During special events, the City should use a shuttle service move people between city destinations and available parking. 6. Improve Water Quality. Exotic plant life in the water affects the quality and use of the beach. The City has experienced success in controlling the introduction of new invasive plants, but struggles with eradicating more mature plants. State agencies are developing methods to address this issue. Measures that manage stormwater runoff into the lake also help preserve water quality, such as the shoreland regulations. 38
39 3 DEVELOPMENT CONCEPT FIGURE 3.3. West Lake Plan - Mobility Concept Rossman Avenue Langford Street Forest Street Forest Street Extension Peoples Pathway Summit Avenue Minnesota Avenue Lake Avenue North Shore Drive Peoples Street Peoples Street Extension WEST LAKE DRIVE WEST LAKE DRIVE i West Lake Drive Pathway ii Beachfront Walkway Legion Road WEST LAKE DRIVE i ii Pedestrian Paths Multi-use Paths Gathering Spots Non-motorized Boat Launch Possible Boat Launch Relocation 39


40 WEST LAKE DRIVE PLAN WEST LAKE DRIVE West Lake Drive offers drivers and pedestrians vistas of the lake along this tree-lined street. The City Beach and marina facilities are located on the lakeside of the street, while restaurants, lodging, retail and residential dwellings dominate the north side. Many properties along the corridor have been redeveloped for condominium housing overlooking the lake. The streetscape for West Lake Drive should continue to evolve, providing a positive and memorable experience to attract visitors and private investment to the area. Minor and relatively inexpensive enhancements to the corridor add life to the experience. Features such as pedestrian lighting, trees and benches can be used to create a sense of place and human scale. Clean streets, ornamental lighting, native plantings, shrubs and community graphics all influence the impression of the corridor. Elements of the Washington Avenue streetscape used along West Lake Drive can unify the two districts and manage costs for replacement parts. Figure 3.8 shows streetscape elements that share a theme for the corridor. These are not prescriptive, but rather illustrates a common design vocabulary. Specific recommendations include: WEST LAKE DRIVE STREETSCAPE Preserve Lake View. Trim tree limbs to avoid obstructing views to the lake. Also, prohibit building structures south of West Lake Drive. Street lighting. Replace obsolete street lighting with efficient LED lighting. The corridor s existing street lighting is no longer supported by the manufacturer. Spare parts are unavailable, necessitating the need to consider new lighting. LED lighting should be used. Benefits of LED system include the ability to control and program the emission of the light (dim lights after 8pm or increase lighting during early snow removal), flashing lights at specific addresses for emergency response vehicles. Additionally LED lights use 5 to 10 times less wattage than traditional lights. Alternative lighting styles should be considered with care. Considerations include the height and width of the pole, appearance and scale of the fixture, light distribution and photometry along the street, and potential attachments and electrical outlets. Planters. Shrubs and flowers can be introduced along the corridor, particularly near intersections where pedestrians cross. Trees. Ash trees are endangered by the emerald ash borer. Figures 3.7 and 3.10 shows a new line of trees, such as Kentucky Coffee or Hack berry, offset from existing trees by 10 feet. West Lake Drive exhibits a strong canopy of full-size trees, offering shade to pedestrians and buildings. These trees should be replaced by Kentucky Coffee or Hack berry, and be placed 10 away from the Ash trees in a uniform line. Banners and flower baskets. Minor and relatively in-expensive enhancements such as flower baskets and banners add color and interest. Banners should be changed seasonally and for special events. Wayfinding. Pedestrian-scale wayfinders, such as blade signs, inform and direct people to the district s various destinations, including the restaurants, City Park and proposed Rossman Park. 40


41 3 DEVELOPMENT CONCEPT West Lake Drive Lakeside Tavern Lake Shirts Replace signage FIGURE 3.4. Possible cabana and beach bar areas Source: Lipe Beach Resort Source: Tripinview Source: Pending Expanded beachfront Safe crossings Possible cabana and beach bar area BEACHSCAPE Beachfront Walk. Figure 3.8 shows replacing the pathway between the beach and lawn with a wider path providing pedestrians an ability to walk side-by-side and runners with a level surface. Benches and trash bins. Seating areas should be well-defined. Benches provide space for people to sit and watch people. Trash bins should be placed near seating and gathering areas. Cabanas and Beach Bar Areas. Figure 3.4 shows a possible outdoor seating areas and enclosed beach bar. Cabanas and beach bars create activity along the beach, while the beach bar expands the business opportunities in the district. The city ordinance prohibits alcohol on the beach, and would need to be revisited to allow this type of use. State laws need to be reviewed to understand permitting, particularly serving areas that may be separated from its principle supplier, like Zorbaz or Lakeside Tavern. Neither of these businesses introduced the idea as the concept emerged from feedback from the public. Currently, local law prohibits alcohol on the beach. Portable Toilet Screening. The existing portable toilets are unappealing, yet a necessity for visitors. These toilets should be replaced and screened to reduce their visibility. Plants and shrubs can screen the appearance, as well. Permanent shelters are proposed at West Lake Park and near the Pavilion. Shade structures. Figure 3.9 exhibits a shade structure that recalls to the sail concept that extends along the beach. These shade structures could be placed near benches and picnic tables. Signage. Residents and businesses want to replace the Summer Fun sign. The style of the new sign should fit into the streetcape design and orient people to other community destinations. 41
42 WEST LAKE DRIVE PLAN Street Section Evaluation Various future streetscape sections were explored for the corridor. Figure 3.5 illustrates the 42-foot curb-to-curb width. Participants in the planning process expressed an interest in significantly improving the experience of pedestrians and cyclists. All concepts recognize that retrofitting a sidewalk behind the south side curb is not possible as the alignment forces many of the trees to be immediately removed. The following concepts were considered: A. Raised Bicycle Lane. The existing parking lane becomes a raised bicycle path. The drive lanes remain at A B. Protected Bicycle Lane. The protected bicycle lane retrofits the existing parking lane. Traffic bollards separate the cyclist from the motorist. C. North side Angle Parking. The north side is retrofitted with angle parking. The north side sidewalk is expanded to allow for vehicle overhang. The concept failed the test of improving the pedestrian and bicyclist experience. D. Widened North side Sidewalk. The concept widens the north side sidewalk without adjusting the street channel. Some areas of the corridor can easily be retrofitted, while the eastern section of the West Lake Drive will continue to be narrow. The sketch also shows establishing a new line of trees. B C E. Widened Beach Pathway. The concept improves the pedestrian experience, yet participants preferred separating pedestrian and bicyclist movements and does not address pedestrians along the south side of the street. F. Preferred Street Section. Figure 3.7 shows the preferred street section includes a multi-use path along the southside of West Lake Drive next to parking. D E FIGURE 3.5. West Lake Drive - Existing Street Section FIGURE 3.6. West Lake Drive - Possible Cross Sections 42


43 3 DEVELOPMENT CONCEPT FIGURE 3.7. West Lake Drive - Proposed Street Section, Option F 3 Buffer 8 Parking 11 Drive Lane 11 Drive Lane 2 Buffer F 6-8 Beachfront Walk 12 Path 29 Street 8 Walk FIGURE 3.8. Beachfront Walk Existing 3 +3 Option +3 Option 43


44 WEST LAKE DRIVE PLAN FIGURE 3.9. West Lake Drive - Themed Design Vocabulary The streetscape elements in Figure 3.8 are not prescriptive, but rather illustrating the concept that elements should have a theme, being part of a shared design vocabulary. BENCHES BICYCLE RACKS BOLLARD TRASH/RECYCLE RECEPTACLES SHADE STRUCTURE LIGHTING Idea represents decking from a dock. Idea represents reeds peeking out of the water. Idea represents a sail. Idea represents the nautical lighting that is already present along the corridor. REPLACE ASH TREES Ash trees are endangered by the emerald ash borer. This plan recommends planting a new line of trees that are setback 10 from the existing Ash trees. Substitute trees could include Kentucky Coffee or Hack berry. LANDSCAPING AND LIGHTING Landscaping provides color and shade to the district. Uniform tree planting provides continuity in the landscape design. The character and type of illumination of light fixtures along the street and parking areas will also complement the lakefront feeling. 44

45 3 DEVELOPMENT CONCEPT FIGURE West Lake Drive - Landscaping and Lighting GATHERING SPACES Plazas give a change in scenery with locations for art, landscaping, and seating. Plazas are versatile for many events such as farmers markets, holiday celebrations, or an everyday lunch spot. Alternatively, these gathering spaces can be a yard with shade trees and seating. 45


. The project could be associated with the American Legion Campground. 3.")
46 WEST LAKE DRIVE PLAN WEST END DEVELOPMENT The West End includes the western section of West Lake Drive from Rossman Avenue to Legion Road. The concept creates connections between uses and leverages the lake as an amenity to attract investment. The area includes a blend of uses along West Lake Drive, Becker County Fairgrounds, and American Legion Campgrounds. Properties along West Lake Drive, west of Rossman Avenue, include single-unit housing, Lakes Inn, Viking Resort, restaurant, laundry service, and parking. Becker County Fairgrounds hosts an annual fourday event in July. The site includes a hockey arena, grandstand, bike track, exhibit buildings, and open space for temporary staging. The event uses all of the available property for the event. During the winter, the space is used for outdoor storage, providing space for people to place their boat lifts. Many of its structures are in moderate to poor condition and need repair. The American Legion Campgrounds is segmented into short-term camping and long-term stay. Visitors to the campgrounds often return every year, and many of the long-term (summer) stay units have remained on the same site for several years. The Legion Lounge rests on the fringe of campgrounds near West Lake Drive. The bathhouse at West Lake Drive and Legion Road is obsolete and a candidate for redevelopment. The road that wraps around this building is often used for vehicles turning around on West Lake Drive. Development Possibilities Figure 3.11 presents possibilities for the west end of West Lake Drive. Elements of the concept include: 1. Peoples Pathway. A continuous neighborhood trail that is parallel to West Lake Drive. The trail connects the Legion Campgrounds to the fairgrounds, People s Park, neighborhood, and Washington Park. 2. Project Site A, Mixed Use. The Mixed Use Project is envisioned as a three-story building with the main-level reserved for parking and Super Suds Laundry. Upper-story residential could be owner-occupied or vacation rental by owner (VRBO). The project could be associated with the American Legion Campground. 3. Shared Parking Lot. A new parking lot replaces the obsolete bathhouse. Spaces could be shared between the Mixed Use project and Legion Lounge. 4. Legion Plaza. The Legion Lounge is a signature destination. A new plaza in front provides outdoor gathering space for visitors. The space can have a seating area, shelter, and features that recognize veterans. The lounge itself could expand to the west. 5. Possible Gateway Entrance. A new entrance road into the campgrounds with landscaping and possibly a new welcome building creates a new arrival to the grounds. The welcome building could be incorporated into the Mixed Use Project. 46

47 3 DEVELOPMENT CONCEPT FIGURE West End Development Concept Promenades leading to central plaza Emergency access road Forest Street Kent Freeman Arena 6 Rossman Avenue 8 Peoples Street Becker County Fairgrounds 2 2 Track 1 2 Development Possibilities 1 Peoples Pathway Legion Road West Lake Drive Project Site A, Mixed Use Possible Joint-Use Parking Lot Legion Plaza Possible Gateway Road Arena Parking Redesign 7 Trail Continuity 7 8 Fairgrounds Enhancements 47


48 WEST LAKE DRIVE PLAN Possible Shared Parking Lot Cottage Housing Example The entrance road also leads to ground floor parking for the Mixed Use Project. 6. Redesign of the Arena Parking. Reorienting the layout of the arena s parking lot will increase the number of stalls. The current design has an excess amount of space dedicated to circulation rather than stalls. During events at the fairgrounds, the surrounding lawn can be used for overflow parking. 7. Trail Continuity. A trail is planned for the southside of West Lake Drive, west of Legion Road. This plan will connect the trail into the city. 8. Fairgrounds Enhancements. Introducing a network of streets into the fairgrounds provides better circulation within the site and connects to future development projects. The proposed extension of Peoples Street to Fair Road should be done at the same time. Portions of the street can be closed during the county fair event. People Street extends west into the site to connect to a new north/south street, defining the edge of the development area for the projects fronting West Lake Drive. During the fair, the street is closed and used by the fair for staging, parking, and creating a grand walkway through the site. The surrounding green space can be used for parking. Forest Street extends west to provide access to the grandstand. This street provides access for emergency vehicles and becomes a possible long-term extension to Legion Road. This alignment should remain free of obstructions. Promenades and Central Plaza. Walking paths could become grand promenades that lead to a central plaza. Action Steps The West End development process could take decade(s) of coordination and incremental steps. Strategies include: 1. Land banking. Individual properties by themselves may not present significant redevelopment opportunity. However, if numerous properties were assembled to create a single, larger redevelopment project, then a higher yield of units can be achieved. As properties become available, the Detroit Lakes Development Authority should acquire and hold property until a larger development project can be secured. 2. Becker County Fairgrounds. The Becker County Fairgrounds will remain a candidate site for redevelopment in the foreseeable future. Next steps include: The Becker County Fairground Board, in association with the City of Detroit Lakes, should complete a Facility and Space Needs Assessment to evaluate existing buildings, management, marketing, and operation. The study should consider alternative sites for the fairgrounds, allowing the event to expand its programming and construct new buildings. Fair Road (new) is a proposed street that connects West Lake Drive to Peoples Street and Forest Street. Fair Road, north of the development can be closed during the four-day annual fair. 3. American Legion Campgrounds. Initiate discussion with American Legion for connecting a trail to the campground. The trail can become an attractive amenity to link campers to Washington Park and other community attractions. Initiate discussion with American Legion to discuss lease agreement and improvements. 48


49 3 DEVELOPMENT CONCEPT Legion Road MAP West End Alternative Scenario West Lake Drive MAP West End Alternative Scenario Rendering ALTERNATIVE POSSIBILITIES Over a long period, the condition and management of any property changes over time, and market demand for housing and commercial uses change, as well. New development continues to occur on the community s fringe, and the city continues to find itself taking an active role in maximizing the use of land in the city to control the manage the cost of extending infrastructure and public safety services. Recognizing these trends, the concepts in this section show options for redevelopment within the city. Campgrounds. Possible relocation and redevelopment of the campground emerged as a topic of consideration during the planning process. Some participants indicated that the site is already in city limits and provides convenient access to utilities, schools, and convenience to everyday shopping. Also, the annual lease agreement of $10,000 compared to the possible benefits from redeveloping the site increased interest for exploring options for relocating the campgrounds. People also recognize the importance of the campers, and their attachment to the experiences shared in the community. Yet, participants asked the designers to explore alternatives for the reuse of the site. The consideration of long-term reuse of the campground led many users of the facility to communicate their concern to the consulting team and city leaders. These campers effectively spoke of the unique seasonal campground community and their annual commitment to Detroit Lakes. In response, this concept is a long-term alternative to be considered only in the event of major change in the market, operation, or sustainability of the campground. Suggestions for reuse include developing the area as a new neighborhood, a hotel and conference center, community school, and multi-family housing. Key elements include: 1. Cottage Units. The concept presents cottage housing in place of the campgrounds. The American Legion Lounge remains as a signature destination on West Lake Drive. These cottages would be designed to provide affordable accommodation for both permanent and seasonal residents, including people retiring to Detroit Lakes. 2. Possible Multi-family Units. Multi-family housing, with parking on the main level and three-stories of housing above, provides relief to the housing demand emerging at the city s fringe and providing greater access to schools and city services. Access to the city s trail system makes the project even more marketable. Fairgrounds. The fairgrounds is a limited use site inside the city, used for a few weeks out of the year. Ultimately, alternative uses may contribute more to the city s urban fabric. Alternative uses include: 1. Possible New Neighborhood. The area could become a new neighborhood in Detroit Lakes, having a mix of residential types from singlefamily homes to apartments. 2. Possible Conference/Event Center. The 2008 Business Corridors Plan studied the concept of a conference/event space. The report should be updated to understand changes in the marketplace, including the performance of newer venues like the Sanford Center in Bemidji and Fairfield Inn down the street. 49


50 WEST LAKE DRIVE PLAN LAKE VIEW DEVELOPMENT The Lake View Development Concept includes the area along West Lake Drive between Legion Road and Summit Avenue. Conditions The area is mostly characterized by single-family homes, small apartments, older resorts, and restaurants. The single-family homes and motels along this stretch of West Lake Drive vary in condition and front a busy street, which influences their marketability for resale. These conditions warrant them to be candidates for redevelopment. The restaurant, located in the octagon-shaped building, has changed ownership over the decades. The history of the building s use has experienced considerable instability compared its district s restaurants - Zorbaz and Lakeside Tavern. Redevelopment of the properties along the corridor is intended to bring continuity from the businesses eastern counterparts. Motels and Hotels. Lodging along this segment of West Lake Drive include Lakes Inn and Viking Resort Hotel. Both of these establishments compete with contemporary hotels that provide more visitor services. These sites, if assembled with its neighboring properties, can be part of a larger redevelopment project that offers a higher yield of units overlooking the lake. Public Restroom. Again, participants in the planning process indicate that the public restroom at Rossman Avenue is inconvenient for people along the beach, particularly because people hesitate to cross West Lake Drive. Development Possibilities The Lake Lakeview Concept recognizes market forces that may emerge along West Lake Drive. Elements of the concept include: Mixed Use Project Sites. The plan proposes a series of mixed use projects along West Lake Drive, and represents a major redevelopment that provides both housing and commercial uses along the corridor. To maximize views of the lake, new projects should push the maximum height threshold of 35 feet. This may require that the first level be slightly depressed to gain three levels. All sites need to consider regulations that limit building coverage for the entire site. Housing and commercial projects are limited to 25% and 35%, respectively. Mixed-use projects are not addressed with a specific limitation. Building coverage is addressed below. 1. Project Site B, Mixed Use. The mixed-use project includes three levels of multi-family housing over a level of covered parking. Typically, one level of parking will furnish one stall per unit for three stories of residential. The site west of Rossman Avenue could have a commercial component that shares off-street parking with the restaurant. 2. Project Site C, Mixed Use. As depicted in Figures 3.15, the building prototype is a single level of commercial space extending from the corner of the building towards West Lake Drive. A patio lawn could be extend to the sidewalk, while the courtyaard offers greenspace to 50


51 3 DEVELOPMENT CONCEPT Fair Road (new) Peoples Street Rossman Ave Rossman Avenue 2 1 West Lake Drive Lake Detroit Project Site B, Mixed Use Project Site C, Mixed Use Project Site D, Multi-family West Lake Park Arena Lake Pathway Peoples Street Extension Multi-family Multi-family Multi-family Commercial Parking FIGURE 3.15: Building Prototype and Use Diagram MAP 3.14: Lake View Development Concept manage stormwater. On-street parking along Rossman Avenue would serve the commercial space. 3. Project Site 3, Multi-family. Access to offstreet parking is limited and reduces commercial potential. One level of parking can support three levels of residential. 4. West Lake Park. The public restroom is redeveloped as a new community park. The West Lake Park concept links activities at the beach and along West Lake Drive to the County Fairgrounds and arena. The park could include a splash pad and sculptures surrounded by landscaping. Also, the site could adapt the existing restrooms or replace them with new restrooms and a shower station. 5. Arena Lake Pathway. The Arena Lake Pathway connects the main entrance of the Kent Freeman Arena to West Lake Drive. The path can be adorned with sculptures, informational displays, and landscaping to enhance the experience of people parking at the arena an walking to the lake. Similar enhancements can apply to the sidewalk along Rossman Avenue to improve the experience. 51


52 WEST LAKE DRIVE PLAN Action Steps Realizing the concepts for the Lake View Development area needs to be deliberate and incremental. 1. Land banking. Individual properties by themselves may not present significant redevelopment opportunity. However, if numerous properties were assembled to create a single, larger redevelopment project, then a higher yield of units can be achieved. The Detroit Lakes Development Authority should deliberately acquire properties to assemble individual project sites. 2. Peoples Street. The City should work with Becker County Fairgrounds to extend Peoples Street and negotiate rights to the property south of the street. Securing larger development projects requires that development parcels cover a larger area to account for the the required to place 65-75% or property in open space, which is a requirement under the shoreland regulations. The scale of the buildings in the illustrations can be achieved if the developable area includes the property to Peoples Street. 3. Seek Development Agreements. Redevelopment process requires an RFP and selection process if going through DLDA. If property is assembled privately, then action item is work with developers on appropriate agreement. Also, establish what incentives are to be used. 4. West Lake Park Concept. Work with the selected developer of the mixed-use project to redevelop West Lake Park in tandem. FIGURE 3.16: West Lake Park Concept POSSIBLE APPLICATIONS Informational kiosk Path with landscaping and decking Path with public art 52
 Project Site C, Mixed")
53 3 DEVELOPMENT CONCEPT FIGURE 3.17: Lake View Development Concept Project Site A+B, Mixed Use (not shown) Project Site C, Mixed Use Project Site D, Multi-family West Lake Park Arena Lake Pathway 53


54 WEST LAKE DRIVE PLAN LAKESIDE DEVELOPMENT The Lakeside Development project includes the property along West Lake Drive between Lake Avenue and Minnesota Avenue. Conditions This area attracts a significant amount of visitors due to the convenience of many nearby destinations. Parking often creeps into neighborhoods and customers of area businesses often Lakefront Tavern s surface parking. Lakefront Tavern is a popular restaurant throughout the entire year. Its presence on the lakefront makes it an even more popular destination, attracting customers from outside of the city. In 2016, the adjacent parking lot was improved from gravel to asphalt with an underground stormwater basin to capture rain runoff. Operations continue to improve and remain a staple business along the corridor. Holiday Tavern is a 1950 s motel. Generally, people perceive that its use is obsolete and its condition in decline. The site is considered an opportunity site for exploring options for redevelopment. Parking near Lakeside Tavern and on West Lake Drive is very competitive. Available parking at Lakeside Tavern is often used by people visiting locations other than Lakeside Tavern. Resolving the area s parking challenges is a key priority. Development Possibilities Figure 3.18 presents possibilities for extending commercial uses along West Lake Drive. These concepts assume that an exception to the impervious coverage requirement can be granted by showing a zero net change from current conditions. Elements of the concept include: 1. Parking Deck 2. Crosswalk Enhancements 3. Greenspace - Stormwater Control 4. Possible Mixed-Use Project Redeveloping the site must consider impervious coverage allowed under shoreland ordinances. Impervious surfaces include buildings and parking where stormwater runs off. Regulations permit 25% impervious coverage for single-family uses and 35% for commercial uses. Currently, impervious surface represents 70% of the area. The proposed concept retains that impervious coverage and proposes a storage basin beneath the parking structure to manage flow. For the concepts in this section to become reality, they are predicated on seeking exception to the impervious coverage requirement, showing that the redevelopment project does not contribute additional impervious surface and shows deliberate care to managing runoff. 1. Two-Level Parking Deck. The parking deck is a two-level structure that supplies parking for area businesses, activities along the beach, and special events like Cruise DL Night. Independent entrances from Minnesota and Lake Avenue allow each deck to be accessed at different levels without the need for ramping, making for an efficient design that maximizes the number of available stalls. This additional parking provides relief to all of the surrounding businesses, particularly for Lakeside Tavern, who essentially supplies parking for patrons to surrounding businesses and activities on the lake. 54


55 3 DEVELOPMENT CONCEPT FIGURE 3.18: Lakeside Development Concept FIGURE 3.19: Lakeside Plaza 3 Minnesota Ave 1 Lake Ave West Lake Drive Lakeside Tavern Lake Shirts Parking Deck Parking Deck Upper-Level Entrance 3 Parking Deck Lower-Level Entrance 4 Crosswalk Enhancements 5 Public Greenspace - Stormwater Control 6 Project Site E, Mixed Use The facade of the parking structure should should have special features like awnings, goose-neck lighting, and quality materials would mask the buildings appearance to be consistent with the surrounding context of the lakefront and residential neighborhoods. 2. Parking Deck Upper-Level Entrance. See Figure 3.18 for reference. The upper-level deck is accessible only from Lake Avenue. 3. Parking Deck Lower-Level Entrance. The lower-level deck is accessible only from Minnesota Avenue. 4. Crosswalk Enhancements. Pedestrian crossings along West Lake Drive should be safe and convenient. People parking on side streets or patronizing businesses want to walk safely to the beach. Enhancing crosswalks at intersections need: Bump outs at intersections to shorten crossing distance. Bump outs also protect parked vehicles. Clearly mark crosswalks with striping. Signage to alert motorists of pedestrians. These can be pedestrian crossing beacons. 5. Public Greenspace - Stormwater Control. The greenspace in front of the parking structure helps manage stormwater on the site. Ultimately, a detention basin beneath the parking structure captures stormwater from the structure, while the greenspace helps intercept runoff. The greenspace can be used as public gathering space and provide shade, as well. 6. Project Site E, Mixed Use. A new mixed-use project lines the front of the parking structure. The second-story of the mixed use project has direct access to the upper-level of the parking deck, providing convenient parking for occupants. The project wants to have a green roof or rooftop deck that overlooks the lake. 55


 have a total impervious coverage of 69%,")


56 WEST LAKE DRIVE PLAN Action Steps Implementing the concepts for the Lakeside Development Concept requires further investigation. 1. Assemble Property. The project involves two businesses, Holiday Haven and Lakeside Tavern. The project will require Lakeside Tavern s current parking lot be folded into the development project. 2. Seek Shoreland Regulation Exception. Shoreland development regulations allow up to 35% of impervious coverage for commercial properties. Currently, the two sites (Lakeside Tavern and hotel) have a total impervious coverage of 69%, while the development concept shows 69%. An exception to standards should be sought, showing that the redevelopment project has a zero net change, and not adding to the total amount of impervious coverage. Also, providing an underground stormwater detention cell will provide better management of runoff. 3. Developer Agreement. The project needs a developer to work with the city to build the mixed use project. Parking for the project can be dedicated on the lower-level of the parking deck, providing covered space for tenants. Top: Parking structure with bathrooms and vending Middle: Open parking structure with awnings Bottom: Seating area and fire pit. Top: Wayfinding possibilities Middle: Outdoor seating open to plaza/greenspace Bottom: Themed informational kiosk 56
 Parking Deck Lower-Level Entrance Crosswalk Enhancements")
57 3 DEVELOPMENT CONCEPT Lake Avenue Lake Shirts Lakeside Tavern 1 6 Minnesota Avenue 3 5 West Lake Drive 4 LAKE DETROIT FIGURE 3.20: Lakeside Development Concept Rendering Parking Deck Parking Deck Upper-Level Entrance (not shown) Parking Deck Lower-Level Entrance Crosswalk Enhancements Greenspace - Stormwater Control Project Site E, Mixed Use 57


58 WEST LAKE DRIVE PLAN PAVILION AND BEACHFRONT The Pavilion and Beachfront concept presents concepts for the south end of Washington Avenue and Washington Park. Conditions City Park, located along the lake at Washington Avenue and West Lake Drive, is the largest park in Detroit Lakes at 25 acres. The Pavilion located within the park has been an important public building that is available for rental. City Park also boasts a Frisbee golf course, physical fitness course, tennis courts and the city s bathhouse. The integrity of the existing pavilion continues to be a challenge and its operation is limited to warmer months. The city completed a review of the structure and site, which concluded that the long-term strategy for Pavilion is to replace the structure. Considering the result of that study, this plan recommended a long-term replacement with a contemporary facility that has antecedents in the historical memories and events that once occurred at the site. The beachfront includes play areas, splash pad, and restroom facility. Development Possibilities Figure 3.21 presents possibilities for enhancing the edge of the lakefront with public facilities and services. Alternative concepts are also considered as part of the development plan to convey flexibility for future enhancements. 1. New Pavilion. The plan suggests rebuilding the Pavilion on its current site, shifting the footprint so that the building opens views to Lake Detroit for people traveling south on Washington Avenue. Features of the new Pavilion may include: Four season facility with HVAC. Reuse of trusses. Meeting rooms and classrooms. Main level large event space. Upper-story meeting space with balcony overlooking Lake Detroit. Public restrooms. Limited administrative office space. 2. Expanded Parking. By expanding the lot, additional stalls can be gained. This concept can work with the Pavilion as it is today or if redeveloped. 3. Lakefront Plaza. The space in front of the main entrance to the New Pavilion includes a plaza that welcomes visitors and becomes a gathering space or meet-up spot for visitors. The space should include seating areas, shade, and public art. 4. Lakefront Drop-off Area. A public dropoff at the entrance of the Pavilion provides convenience for people to enter the facility or near the lakefront. 5. Family Play Area. The beachfront east of the Pavilion is somewhat more private than the rest of the public beach. This area experiences more activity with children and youth. 58


59 3 DEVELOPMENT CONCEPT North Shore Drive North Shore Drive Washington Avenue Washington Avenue 1 4 West Lake Drive 2 West Lake Drive A B FIGURE 3.21: Pavilion and Beachfront Concept FIGURE 3.22: Pavilion and Beachfront Concept - Alternatives Development Possibilities Alternatives New Pavilion Expanded Parking Lakefront Plaza Lakefront Drop-off Area Family Play Area A B Restore Pavilion (not shown). The pavilion can remain. The building assessment prepared in 2012 indicates that the building and site require significant investment in place and undergo a substantial reconstruction program.. Possible Boat Launch. The plan recommends removing all boat launches west of Washington Avenue. Placing a boat launch in Washington Park requires investigation to determine whether depth is adequate. 6 Public Restroom and Showers 59


60 WEST LAKE DRIVE PLAN 6. Public Restroom and Showers. Building a new public restroom and showers near the lakefront provides convenience for users. Participants in the public input process suggested that a project like this is desirable for people with children. Also, the shelter could storage space for maintenance equipment for upkeep of the entire beach.. Action Steps The subject of the Pavilion s future has been studied and, ultimately, a decision for replacing or upgrading the facility is necessary to implement concepts in the area. 1. Update Pavilion Buildling Assessment. The 2012 Detroit Lakes Pavilion Building Assessment needs to be updated as the facility continues to experience structural settling. A citation from the previous study suggests replacing the facility. In summary, it is felt that the original structure of the Pavilion building, going into its 97th year in existence, has served its purpose and community well. Though the building continues to stand, has withstood countless storms and remains functional in its current state, a closer look will show that it has begun to move and that the ongoing maintenance process will continue at a minimum on an annual basis. These annual repairs will continue to grow in cost with each continuing year. In reviewing the assessment it also becomes apparent that in order to retrofit the facility for year round usage, significant upgrades would be required, some of which could impose additional complications to the existing structure that cannot be verified based on its age......it is recommended that the original structure be removed and replaced, salvaging the original steel structural elements for reuse within a new structure in an aesthetic function. This plan identifies alternatives that increase the use of the site, while honoring the Pavilion s past role in the community. Top: Children s splash pad Middle: Children s labyrinth surrounding by seating Bottom: Public restrooms Top: Additional public art displays Middle: Continue sail theme along corridor Bottom: Interactive musical stations 60


61 3 DEVELOPMENT CONCEPT Washington Avenue Sail gardens 6 Splash Pad 5 Current Pavilion FIGURE 3.23: Pavilion and Beachfront Rendering 1 Expanded Parking (not shown) 4 2 New Pavilion 5 3 Lakefront Plaza 6 Lakefront Drop-off Area Family Play Area Public Restroom and Showers 61

62 WEST LAKE DRIVE PLAN WASHINGTON AVENUE FIGURE 3.24: Possible Street Realignment The South Washington Avenue district includes the area from Langford Street to West Lake Drive. Condition The area is characterized by the long-standing Washington Ball Park, City Park, single-story commercial, multi-family housing, and Fairfield Inn. Washington Ball Park is an icon of Washington Avenue s south end and listed on the National Register of Historic Places. The building is in good condition, considering its age. Yet, some public discussion suggested interest in redevelopment of the site. Possible realignment of offset intersection Forest Street Washington Avenue Redeveloping the ballpark will result in the dedesignation of its historic status and influence the city s certified local government potential. During major rain events, runoff from the area will reportedly pool in the outfield of the ball park. Additional study is necessary to understand the nature of stormwater movement, as the reported condition may inhibit the space from being redeveloped. Development Possibilities 1. Washington Avenue Streetscape. Streetscape elements similar to those in the downtown core create continuity between the downtown and lakefront. These concepts contribute to a more pedestrian-friendly corridor. The streetscape standards should continue to West Lake Drive, then blend with the library of elements identified for the lakefront corridor. 2. Realign Langford and Forest Streets. The offset of Langford Street and Forest Street at Washington Avenue creates turning conflicts. Realigning the intersection should coincide with any redevelopment plan. Langford Street 3. Washington Ballpark Restoration and Plaza. Restoring the Washington Ballpark includes updating the facility, dugouts, and its surroundings. This evocative 1920s-vintage stadium is an important feature on South Washington Avenue. The street-facing backstop could be refaced in the style of a traditional ballpark, with a corner plaza that celebrates people who played at the ballpark. A pathway connection should lead from Lincoln Park, cross Langford Street, and connect through the ballpark site to City Park and the lakefront. 4. Possible Mixed-Use Development. Properties along South Washington Avenue could be redeveloped with mixed-use projects, having residential over commercial. Market demand will influence the implementation schedule. 5. Alternate- Ball Park Reorientation. The concept shows the spectator stand relocating south near North Shore Drive, preserving the open space for stormwater management, and realigning Langford Street. 6. Alternate - Washington Park Redevelopment. Further discussion for redeveloping the Washington Ball Park should involve the Minnesota State Historic Preservation Office. Concepts in this section are for illustration only and responded to public input to see alternatives for the site. The concept shows a mixed-use project with lower-level commercial and upperlevel residential. Surface parking is behind the building. 62


63 3 DEVELOPMENT CONCEPT FIGURE 3.25: Restored Grandstand FIGURE 3.26: Reoriented Ballfield FIGURE 3.27: Redevelopment with Realignment Forest Street i ii Langford Street Forest Street 1 Langford Street Forest Street A Langford Street Washington Avenue iii 3 3 Washington Avenue 2 Washington Avenue B C North Shore Drive 5 North Shore Drive North Shore Drive 4 i Enhanced Backstop Plaza 1 Realigned Intersection A Realigned Intersection ii Restored Grandstand 2 Reoriented Ballfield B Possible Mixed-Use Development iii Updated Fencing 3 Possible Mixed-Use Development C Stormwater Detention Area 4 Extend Streetscape along South Washington 5 Enhanced Crosswalks MIXED USE CONCEPTS (3-STORIES) Preserving the ballpark retains its historic designation. 63


64 WEST LAKE DRIVE PLAN Action Steps Improvements to the South Washington Avenue area corrects circulation conflicts and identifies candidates for redevelopment. 1. Conduct Site and Structural Assessment of Washington Park Ball Field. The assessment of Washington Park Ball Field should consider the historical and projected repairs of the grand stand. Also, the evaluation should consider stormwater management in and around the site to understand the site s ability to be redeveloped. 2. Continue Streetscape along Washington Avenue. Budget funds for extending the streetscape from downtown to West Lake Drive. 3. Conduct Traffic Study. Evaluate turning conflicts at Langford Street and Forest Street. The study should determine the warrants for realigning the street and an opinion of probable cost of improvements. 4. Coordinate with Stakeholders. Any realignment of Langford Street will influence adjacent properties. The Sanford Clinic could become a partner as their yard will likely increase. 5. Assemble Property. Properties along the west side of Washington Avenue are candidate sites for redevelopment. Development projects should be three to four stories and address the street. 6. Contact Minnesota State Historical Society. As required under state statues (MS ), the City will need to contact the Minnesota State Historical Society before undertaking any project at the Washington Ball Park or City Park. FIGURE 3.28: Enhanced Backstop EXISTING Backstop Enhancements POSSIBLE APPLICATIONS 64

65 3 DEVELOPMENT CONCEPT FIGURE West Lake Drive Plan - Development Concept Forest Street Extension Rossman Avenue Peoples Park Forest Street Peoples Summit Avenue Minnesota Avenue Lake Avenue Washington Avenue Langford Street North Shore Drive City Park County Fairgrounds Peoples Street WEST LAKE DRIVE Legion Road WEST LAKE DRIVE A glance back at the concepts for West Lake Drive. Concepts are intended to improve the experience for residents and visitors alike, while introducing new development opportunities for Detroit Lakes. Ultimately, these efforts will make Detroit Lakes a stronger destination in the region. 65
66 WEST LAKE DRIVE PLAN POLICY RECOMMENDATIONS This section addresses policy considerations for developing components of the plan. These policies primarily relate to zoning regulations. Similar to other areas of the city, zoning regulations are a first step to ensure that proposed development concepts meets the vision laid out in the plan. Much of Detroit Lakes success comes from the beauty and recreational amenities of Detroit Lake. West Lake Drive is a special place in Detroit Lakes that offers opportunities for redevelopment and connections to Lake Detroit. Protecting this valuable resource is imperative and mandated by the City of Detroit Lakes and the State of Minnesota through Shoreland District zoning regulations. Figure 3.30 shows the existing base zoning districts in the study area. Sites fall within the Residential Lakefront Business district (R-LB) and the One and Two Family Residential district (R-2). All properties within 1,000 feet of the high water mark of Lake Detroit are also subject to the Shoreland district regulations. The Shoreland District and base zoning regulations have several implications for development along West Lake Drive. Abutting areas outside the study area also includes an Auto-Oriented Business Districts and Multi-Family Residence Districts. Shoreland District (S). As stated in the ordinance, the Shoreland District serves to regulate the subdivision, use, and development of the shorelands of public waters and thus preserve and enhance the quality of surface waters, conserve the economic and natural environmental values of shorelands, and provide for the wise use of water and related land resources. Nearly all sites in the West Lake Drive Study area also fall under Shoreland zoning regulations based the designation of Detroit Lake as a General Development, sewered lake. Zoning Regulations for the shoreland district are additional to the underlying zoning district designations. These districts include: Residential Lakefront Business district (R-LB). The R-LB Residential-Lakefront Business District is intended to provide for the intermixing of lake-oriented business, public, and semi-public recreational opportunities and residential uses. Most of the West Lake Drive study area falls under R-LB zoning regulations. The City of Detroit Lakes is renaming the R-LB District to Lakefront Business District in order to clarify that it is essentially a commercial district that allows housing development. Uses allowed include parks, public and semipublic recreational uses and surface water-oriented commercial. Other commercial uses are allowed under a commercial planned unit development. One and Two Family Residential district (R-2). The purpose of the R-2 District is to encourage the development and preservation of medium density residential neighborhoods characterized by one and two family dwellings for the owner and rental occupancy. Nonresidential services permitted in this district shall provide for auxiliary services which will contribute to the stability and long-term value of the area for residential purposes. Most property in Detroit Lakes is zoned R-2. Only a small portion of the West Lake Drive study area falls under R-2 zoning, limited to the Fairgrounds area and Legion Campground. As the name indicates, the R-2 district allows primarily residential uses at a density compatible with neighborhoods in Detroit Lakes. Development pressures and opportunities make the R-2 district inappropriate for the area along Legion Road because of limitations on minimum floor area, building height, and multi-family uses. Planned Unit Development (PUD). A Residential Planned Unit Development (PUD) designation does give some flexibility within the confines of residential uses by providing relief from conventional zoning requirements and creativity in site design, allowing the City Council to approve departures from the underlying zoning regulations and a mix of uses and densities. While a PUD designation does give some flexibility in mixing uses and densities, several Shoreland regulations limit the level of flexibility in order to maintain the character and protect the water quality of Lake Detroit. Base regulations for a Commercial PUD in the Shoreland District include but are not limited to: Minimum lot width: 75 feet Minimum lot area: two acres, unless 2 or more land uses or lot size 10,000 square foot minimum Yards: 30 feet or height of the building along all sides; 50 feet from residential districts Impervious Coverage: 35% (if set back more than required) Open Space: 50% usable greenspace Flexible Building Height: Can deviate from underlying zoning limit of 2.5 stories. Density: Tiered density based on distance from shoreland; otherwise 25% Floor Area Ratio Location: structures and parking placed or screened to reduce visibility from the Shoreland Stormwater Management: Preference given to natural methods over man-made pipes and buried features Multi-family developments over 150 attached units require an Environmental Impact Statement 66
 Residential Lakefront Business District (R-LB) Tier 1 Density Boundary RM Auto-Oriented")

67 3 DEVELOPMENT CONCEPT FIGURE 3.30: Zoning Districts, 2017 R-2 B-3 Shoreland District Area R-LB One and Two Family Residential District (R-2) Residential Lakefront Business District (R-LB) Tier 1 Density Boundary RM Auto-Oriented Business District (B-3) Multi-Family Residence District (RM) Shoreland District Area Tier 1 Density Boundary Base standards for a Residential PUD in the Shoreland District include but are not limited to Minimum lot width: 75 feet Minimum lot area: 10,000 square feet Yards: 30 feet or height of the building along all sides. Impervious Coverage: 25% Open Space: 50% usable greenspace Flexible Building Height: Can deviate from underlying zoning limit of 25 feet. Density: Tiered density based on distance from shoreland Location: structures and parking placed or screened to reduce visibility from the Shoreland Stormwater Management: Preference given to natural methods over man-made pipes and buried features Multi-family developments over 150 attached units require an Environmental Impact Statement CHANGE ZONING DESIGNATION The Central Business District Zone provides an option for additional flexibility on building heights and setbacks. Consideration should be given to changing some of the B-3 areas on Washington Avenue to B-1 to allow more downtown type of development along this corridor. Changes to the zoning in the West Lake Drive area should meet the intent of this plan and the City s comprehensive plan. 67


68 WEST LAKE DRIVE PLAN To accommodate higher development, lot consolidation is necessary. FIGURE 3.31: Shoreland District overlaid on Development Concept Concept Testing Figure 3.31 shows the shoreland district boundary in relation to the development concepts presented in the plan. All of the concepts fall within the area. The Shoreland Management Act mandates many of these regulations limit impervious coverage and density is allowed on a site. The plan proposes development at higher intensity than existing in To accommodate higher development area and impervious surfaces, development should only occur under a lot consolidation scenario. Lot consolidation allows the developer more flexibility in site design and areas for natural stormwater infiltration, open space, and density reduction while still being able to accommodate buildings, parking, and sidewalks that are impervious. Shoreland District Area Tier 1 Density Boundary The mixed-use project proposed in the Lakeview development is a example of needing to assemble property. Currently the site consists of single-family residences and resorts divided between numerous lots. The concept shows two higher intensity buildings, but also a park and greenspace along the extension of People Street. Impervious coverage today ranges from 20% to 30% per individual lot. Under redevelopment with lot consolidation the impervious coverage is comparable with new mixed-uses of commercial, residential, and open space that enhances the character of West Lake Drive and the Rossman Avenue intersection. FIGURE 3.32: Lakeview Impervious Coverage Demonstration 34% Impervious Coverage Impervious Pervious 68
69 3 DEVELOPMENT CONCEPT DESIGN GUIDELINES Many of the concepts presented in this plan include a mix of uses and unique design elements. Indicated previously, PUD zoning allows an appropriate amount of flexibility for development that better serves the community. However, criteria for PUD approval are sometime vague and not tailored to West Lake Drive. A set of specific design guidelines for West Lake Drive can help decision makers evaluate projects for consistency with area character and design for pedestrians. Alternatively, a set of design guidelines could serve as a launching point for whether a separate zoning district should be established for areas along West Lake Drive. Elements of the Design Guidelines should include: Materials Building Form and Scale Building Orientation Parking Pedestrian Accommodations Signs Materials High quality building materials can maintain aesthetic appeal along the Lake and extend the life of buildings from deterioration and repair. The materials used for commercial and large scale residential buildings should consider: Facades facing public right-of-ways and the Lake should be comprised of high quality materials such as brick, stone, decorative architectural metal paneling, glass, or other modern building materials that match the character of the corridor. Materials such as wood, textured concrete masonry units, or EFIS, could be appropriate for trim or accessory design features. Glass should compose a majority of building facades facing the lake. Ultimately, exterior materials should be evaluated on the basis of design quality, consistency with scale, and durability. Building Form and Scale The pedestrian experience should not be compromised on West Lake Drive. Guidelines for the concepts proposed in this plan can help prevent development from making West Lake Drive feel uninviting to pedestrians. However, as with all design rules, no guideline on façade composition should be inflexible. Quality design is paramount, and innovative design should never be excluded. Parking generally not permitted in the front yard between building wall and street. Instead place in rear yards. Commercial parking may be located to the side of the primary building. Entry doors oriented directly to West Lake Drive with direct connection to public sidewalk. Transparency should be provided to a reasonable extent. Possible guidelines to evaluate transparency are 60% of the street level façade area for retail buildings, restaurants, and similar establishments; 40% of the street level facade area for offices and other commercial uses; and 25% of the facade area for upper levels. The effects of multi-story buildings can be minimized by setting back upper stories from the ground floor, which also allows space for upper story balconies and patios. However, buildings generally should not be taller than four stories. Building Orientation Similar to building form and scale, building orientation can greatly affect the pedestrian environment and views from Detroit Lake. Buildings should be oriented with entryways facing the lake or public right-of-way. Setback areas, where applicable, should be used for landscaping, plazas, or courtyards. Buildings on intersections should accent the corner with public spaces, building treatments, windows, or pedestrian features. Parking Flexibility should be provided for mixed use projects and the review process should include some variation for specific projects, based on availability of on-street parking or shared parking arrangements with other nearby development. Ultimately, improvements that encourage active transportation can reduce parking demand by diverting short trips to non-motorized modes. Pedestrian Accommodations All development should accommodate pedestrians and bicyclists through site design, landscaping, building orientation, and aesthetics. West Lake Drive should continue to be a place where people can comfortably walk from destination to destination. Sidewalks should be provided to all building entrances. Perimeter parking lot landscaping and islands can help lessen the amount of concrete and buffer pedestrians from vehicles. Development should make connections to existing or planned sidewalks and trails. Sidewalks should generally be set back from vehicle travel areas to increase safety and comfort. Bicycle racks provided near building entrances, free from obstacles. Pedestrian routes that cross vehicle driveways should be clearly marked either by paint or change in material. Signs Review should also include guidelines for sign visibility, scale, and compatibility with surrounding development, not blocking views to the lake or open space. 69


70 WEST LAKE DRIVE PLAN Procedural Policies Additional policy goals to improve development approval efficiency and understanding include adding resources and guidelines on the City website. A city code can be daunting to those not referencing it every day. Any property owner or developer wishing to do a project should not be faced with confusing language or be required to decipher all parts of the ordinance. The City can improve the clarity of the land development process in several ways. The City website does not have information about finding property zoning classifications. The first step to identifying what you can do with your property is to know which zoning district applies to your property. The map should be placed front and center on the zoning page. Ensure the website is accurate and contains all possible procedures. Flowcharts are a great way to show applicants the procedures and time lines for approval quickly. Maps showing the shoreland zone and overlay standards can help a developer understand whether additional standards may apply to the property. FIGURE 3.33: Mixed Use Project Sites Recap, A/B/C/D/E B C D Priority Criteria The West Lake Drive Plan establishes several project areas and includes many projects that will be developed over time. The plan provides a master plan of a completed corridor. However, real implementation is an incremental process that requires setting priorities, completing initial steps, and evaluating new conditions along the way. The City with coordinating agencies should maintain a five year Corridor capital program, updated annually, much as city and state governments do with their capital improvement plans. Table 5.1 identifies individual projects and provides a conceptual priority for their implementation. However, market demand and opportunities will inevitably affect this schedule. Annually, the capital development group should update the schedule, based on priority criteria. The City should use the criteria to develop specific project priorities. Initial public improvement priorities, some of which are relatively ambitious projects, may include different types of implementation scenarios that balances immediate improvement and sustained improvement. E CRITERIA Evaluative criteria may involve applying the following questions to specific projects at the time of consideration: Does the project respond to specific or high-profile community issues or needs? Does the project generate maximum private market response? What is the project s potential to transform the image of the area and community? Does the project attract both local residents and visitors, increasing business traffic and creating new reasons for people to be along the lake? Does the project support the growth of existing businesses? Does the project capitalize on established, but unmet, market needs? Can the project be realistically implemented within a reasonable time frame with potentially available re-sources? Does the project generate substantial community support or consensus? Does the project incorporate and leverage outside funding sources, such as state grants or charitable contributions? A 70
71 3 DEVELOPMENT CONCEPT TABLE 3.1A: Project Priorities PROJECT TYPE PRIORITY LEVEL SCHEDULE FACTORS Private/Public Public Feedback Ongoing Within 3 Years 3-10 Years Beyond 10 Years MOBILITY AND ACCESS Improve Pedestrian/Bicycle Movements Beachfront Walk Public High Northside Walk (West Lake Drive) Public Medium Occurs with West Lake Drive Streetscape. West Lake Pathway (West Lake Drive) Public High Occurs with West Lake Drive Streetscape. Peoples Pathway Public Low Reserve space for future pathway. Prohibit obstructions. Connect to Regional Trail Public Occurs with West Lake Drive Streetscape Boat Access Remove/relocate motorized boat launches Public High Occurs with West Lake Drive Streetscape Retain non-motorized boat launch Public High Water Quality Public/Private High Ongoing WEST LAKE DRIVE Streetscape Project (Game Changer) Public High Phased project: (1) Restriping, (2) Complete Reconstruction Beachscape Project Public High Phased project: (1) Tree plantings, (2) walk WEST END DEVELOPMENT Peoples Pathway - - SEE MOBILITY AND ACCESS. Mixed Use Project Site A Private/Public Medium Private - development; Public - land assembly. Mixed Use Project Site B - - SEE LAKE VIEW DEVELOPMENT Mixed Use Project Site C - - SEE LAKE VIEW DEVELOPMENT Legion Plaza Private Medium Dependent on Mixed Use Project Site A feasibility. Gateway Entrance Public Medium Title research necessary. Follows West Lake Drive Arena Park Redesign Public High Follows facility needs study of fairgrounds. Connection to Regional Trail - - SEE MOBILITY AND ACCESS. Fairgrounds Enhancements Private Medium Becker County Fairgrounds to initiate facility needs study. 71
72 WEST LAKE DRIVE PLAN TABLE 3.1B: Project Priorities PROJECT TYPE PRIORITY LEVEL SCHEDULE FACTORS LAKE VIEW DEVELOPMENT Action, Policy, Capital Public Feedback Ongoing Within 3 Years 3-10 Years Beyond 10 Years Mixed Use Project Site B Private/Public Medium Private - development; Public - land assembly. Mixed Use Project Site C Private/Public Medium Private - development; Public - land assembly. Mixed Use Project Site D Private/Public Medium Private - development; Public - land assembly. West Lake Park Private/Public Medium Occurs in tandem with Project Site D. Arena Lake Pathway (West Lake Park to Arena) Public Medium Occurs in tandem with West Lake Park. LAKESIDE DEVELOPMENT Parking Deck (Game Changer) Private/Public High Assemble property, coordinate with DNR for shoreland exceptions, and establish agreement with property owners. Crosswalk Enhancements Public High Occurs with West Lake Drive Streetscape. Public Greenspace Public High Occurs with Parking Deck Mixed Use Project Site E - Lakeside Tavern Private/Public High Private - development; Public - land assembly. Pavilion Restoration Public Low Private fundraising. Pavilion Replacement Public Low Commission update of Pavilion Facility Study Expanded parking lot Public Medium Occurs with West Lake Drive Streetscape. Lakefront Enhancements (Plaza, beach, drop-off, play area, restrooms) WASHINGTON AVENUE Public Medium Occurs with New Pavilion Washington Avenue Streetscape Public High Occurs with West Lake Drive Streetscape. Washington Ballpark Restoration and Plaza Public Low Prepare design and fundraising campaign. Ballpark Redevelopment Options Private Low Deferred alternative. Realign intersection of Langford and Forest Public Medium Prepare traffic study to determine warrants for realignment. POLICIES Zoning Amendments Public High Amend Zoning Ordinance Map Public High Title research Public Medium Research deed restrictions for Bathhouse and Campgrounds. 72
73 3 DEVELOPMENT CONCEPT TABLE 3.2: Opinion of Probable Cost for West Lake Drive (Legion Road to North Shore Drive) TABLE 3.3: Opinion of Probable Cost for Parking Deck (excludes development) WEST LAKE DRIVE STREETSCAPE RANGE PARKING DECK RANGE PHASE ONE $400,000 - $500,000 Bump out and Bike Lane striping, Collapsable Bollards, Crosswalk striping, new lighting! Does not include mill and overlay! Excludes design/engineering fees PHASE TWO $750,000 - $900,000 Permanent bumpouts, separated bike lane, landscaping! Does not include new street pavement! Excludes design/engineering fees TOTAL - STREETSCAPE $1,150,000 - $1,400,000 ESTIMATE APPROACH #1: COMPARABLE PROJECT (256 X 120 DECK) Cost translates to about $57/SF or $16,000/stall! Precast structure with no accents.! Nominal stormwater management! Excludes design fees ESTIMATE APPROACH #2: PER STALL UNIT COST $19, stalls at $19,000 each! Excludes stormwater management ~$3.1 MILLION ~$4.9 MILLION BEACHSCAPE BEACHSCAPE near pavilion $1,000,000 - $1,200,000 Grading, Utilities,Color Concrete Sidewalks, Seat Walls, Site Furnishings, Public Art, Water Feature, New Restroom, Lighting, Landscaping BEACHSCAPE along West Lake Drive $600,000 - $700,000 Grading, Utilities, Concrete Sidewalks, Seat Walls, Site Furnishings, Public Art, Lighting, New Trees, Landscaping TOTAL - BEACHSCAPE $1,600,000 - $1,900,000 GATEWAY MONUMENTS FEATURES Design and fabrication! Cost can vary significantly. $20,000 - $35,000 Public Art Design and installation $60,000 Source: RDG Planning & Design TOTAL - PARKING DECK $3,250,000 - $5,000,000 Source: RDG Planning & Design TABLE 3.4: Opinion of Probable Cost for Pavilion (from Pavilion Study) PAVILION ESTIMATE APPROACH #1: Nominal exterior site work (low estimate) ESTIMATE APPROACH #2: Nominal exterior site work and building envelope upgrade ESTIMATE APPROACH #3: Nominal exterior site work, building envelope upgrade, and insulation ESTIMATE APPROACH #4: Nominal exterior site work and new building RANGE $170,000 $400,000 $1,000,000 $2,700,000 TOTAL - PAVILION ~$5,000,000 Source: Detroit Lakes Pavilion Study by BHH Partners,
74 74

75 3 DEVELOPMENT CONCEPT APPENDIX Questionnaire Results Open House Posters Event Posters 75 a
76 WEST LAKE DRIVE PLAN SURVEY RESULTS Background and Emerging Themes A community questionnaire was conducted to evaluate residents feeling towards the West Lake Drive corridor. The questionnaire received 213 responses through SurveyMonkey. Overall, individuals are concerned about community character, new development, and traffic safety. When asked to identify West Lake Drive s three greatest assets, many responded with restaurants, the beach, and the campground. According to respondents, increased outreach and community involvement is an important component of West Lake Drive s future. Therefore, more neighborhood events and activities, more parking, and better advertisement and promotion of the area. The community envisions a more vibrant, easily accessible, and safer corridor. The three following themes highlight detailed results on the following pages: ECONOMIC AND COMMUNITY CHARACTER Respondents indicated that they are satisfied with the overall character of West Lake Drive area. However, they want to see improvement in the business environment and character. Top important actions: Restoration of Historic Business Facades Improved Streetscape (sidewalks, landscaping, lighting, and benches) throughout the District Entrance Features and Gateways Special Graphics and Signs (including historic information) NEW DEVELOPMENT While people rated the current restaurants and business area as good, they want to see additional and a wide variety of restaurants, entertainment, and new retail businesses in hope of attracting more visitors to the West Lake Drive area. Additionally, they want to see new construction on vacant sites and more public spaces. Respondents are neutral to seeing more housing and new conference or convention centers. Top important projects: Attraction of New Retail Businesses New Construction on Vacant Sites More Restaurants and Entertainment Additional Public Spaces TRAFFIC Adequacy of parking and pedestrian and bicycle access to the West Lake Drive area is rated by respondents as below average. People feel it is important to improve traffic and access to the area in order to prepare for new growth and development. Top important actions: Improved Pedestrian Safety Crossings More Parking Street and Traffic Flow Improvements 76
77 3 DEVELOPMENT CONCEPT FIGURE A.1: Economic Charateristics Rating Please rate West Lake Drive for each of the following economic characteristics Summary. Respondents are satisfied with current condition, but want to see more variety and attractions to improve the business environment. Tourism Environment Restaurants & Entertainment Environment Provisions of Parks & Open Space Amount of Business Attracted from Outside Detroit Lakes Hotel & Accommodations Environment Business Growth During the Last 5 Years Cultural Facilities & Attractions Overall Economic Health Future Business Prospects 5% 22% 35% 31% 5% Business Variety Retailing Environment 4% 9% 3% 8% 6% 4% 3% 2% 14% 2% 10% 9% 20% 22% 26% 15% 17% 17% 19% 15% 24% 30% 35% 35% 33% 31% 36% 44% 35% 43% 26% 31% 32% 28% 29% 31% 20% 27% 20% 36% 27% 18% 25% 9% 15% 13% 9% 8% 4% 4% EXCELLENT GOOD AVERAGE BELOW AVERAGE POOR Overall Economic Health Amount of Business Attracted from Outside Detroit Lakes Provisions of Parks and Open Space Restaurants & Entertainment Environment Tourism Environment Future Business Prospects Business Growth During the Last 5 Years Hotel and Accommodations Environment Office Market Environment Retailing Environment Business Variety Cultural Facilities and Attractions Office Market Environment 29% 34% 25% 9% 2% 20% 40% 60% 80% 100% eption of West 77
78 WEST LAKE DRIVE PLAN FIGURE A.3: Transportation and Awareness Characteristics Please rate West Lake Drive on each of the following characteristics pertaining to transportation Summary. Respondents feel the current condition is average with room for improvements in active transportation alternatives. Access to the Lake 5% 12% 27% 38% 18% EXCELLENT GOOD AVERAGE BELOW AVERAGE POOR Marketing and Promotional Activities 11% 22% 38% 20% 8% Access to the Lake Street and Traffic Flow Adequacy of Parking Directional Information to Downtown 12% 25% 38% 21% 5% Directional Information to Downtown Pedestrian and Bicycle Access Pedestrian and Bicycle Access 30% 31% 15% 19% 5% Marketing and Promotional Activities Street and Traffic Flow 21% 27% 33% 15% 4% Adequacy of Parking 24% 35% 27% 11% 3% 20% 40% 60% 80% 100% Excellent Good Average Below Average Poor 78
79 3 DEVELOPMENT CONCEPT FIGURE A.3: Community Character Rating Please rate West Lake Drive on Community Character Summary. Respondents feel the current character of the corridor is average, with the experience of West Lake Drive a notable feature to retain. Experience of being on West Lake Drive 4% 19% 26% 34% 17% EXCELLENT GOOD AVERAGE BELOW AVERAGE POOR Perception of West Lake Drive 4% 19% 28% 39% 14% Public Investment Along West Lake Drive Private Investment Along West Lake Drive Streetscape and Public Environment Overall Appearance 4% 2% 17% 6% 26% 41% 32% 35% 26% 20% 41% 29% 7% 7% 6% Experience of being on West Lake Drive Perception of West Lake Drive Streetscape and Public Environment Condition of Surrounding Residential Areas Overall Appearance Condition of Buildings Condition of Surrounding Residential Areas 4% 10% 46% 35% 6% Private Investment Along West Lake Drive Public Investment Along West Lake Drive 7% 30% 40% 18% 6% Condition of Buildings 4% 25% 43% 26% 3% 20% 40% 60% 80% 100% Excellent Good Average Below Average Poor 79
80 WEST LAKE DRIVE PLAN FIGURE A.4: Future Development Level of Importance (% of respondents) Please rate the following list of ideas and actions based on how important you think each is for the future of West Lake Drive. 50% Summary. Most respondents want to see more future development with a focus on places for people to gather. 40% VERY IMPORTANT IMPORTANT NEUTRAL UNIMPORTANT VERY IMPORTANT Additional Public Spaces More Housing More Office Development 30% 20% Attraction of New Retail Businesses More Restaurants and Entertainment Housing in Upper Stories New Conference/ Convention Center 10% New Construction on Vacant Sites 0% Additional Public Spaces Attraction of New Retail Businesses More Restaurants and Entertainment New Construction on Vacant Sites More Housing More Office Development Housing in Upper Stories New Conference/ Convention Center Very Important Important Neutral Unimportant Very Unimportant 80
81 3 DEVELOPMENT CONCEPT FIGURE A.5: Community Character Level of Importance (% or respondents) Please rate the following list of ideas and actions based on how important you think each is for the future of West Lake Drive. Summary. Most respondents want to see community character improvements related to the general appearance and identification of West Lake Drive. 50% 40% VERY IMPORTANT IMPORTANT NEUTRAL UNIMPORTANT VERY Restoration of Historic Business Facades Murals and Public Art 30% 20% 10% Improved Streetscape ( Sidewalks, landscaping, lighting, & benches throughout the district Entrance Features and Gateways Better Directional Information to Downtown 0% Restoration of Historic Business Facades Improved Streetscape Entrance Features and Gateways Murals and Public Art Special Graphics and Signs (including historic Better Directional Information to Downtown Special Graphics and Signs Very Important Important Neutral Unimportant Very Unimportant 81
82 WEST LAKE DRIVE PLAN PERCEIVED ACTIONS FIGURE A.6: Transportation & Awareness Level of Importance (% of respondents) Please rate the following list of ideas and actions based on how important you think each is for the future of West Lake Drive. Summary. Most respondets feel all aspects of transportation and area awareness are important for the future of West Lake Drive, with more preference toward traffic flow and pedestrian safety. 50% 40% 30% VERY IMPORTANT IMPORTANT NEUTRAL VERY Better Advertising and Promotion More Neighborhood Events and Activities 20% 10% Improved Pedestrian Safety Crossings More Parking Special Events and Activities Street and Traffic Flow Improvements Extended Business Hours 0% Extended Business Hours Better Advertising & Promotion More Neighborhood Events & Activities Improved Pedestrian Safety Crossings More Parking Special Events & Activities Street & Traffic Flow Improvements Very Important Important Neutral Unimportant Very Unimportant eption of West Lake Dr 82
83 3 DEVELOPMENT CONCEPT FUTURE IMPROVEMENTS Respondents were asked to identify the top three greatest assets and greatest liabilities in the City and the West Lake Drive corridor. They were also asked to identify top three important projects or actions they would like to see in the West Lake Drive Corridor in five years, and in the city in 10 years. Listed in Figure 6 and 7 are the top answers. The beach/lake came up as the greatest assets in the community, as well as the greatest liability. Respondents want to see an overall improvement in the corridor and the city, especially parking improvements. It is evident that identified future important projects correlate with the majority of liabilities listed. FIGURE A.7: Assets, Liabilities, and Future Projects for West Lake Drive FIGURE A.7: Assets, Liabilities, and Future Projects for the City of Detroit Lakes GREATEST ASSETS GREATEST LIABILITIES FUTURE IMPORTANT PROJECTS IN 5YRS GREATEST ASSETS GREATEST LIABILITIES FUTURE IMPORTANT PROJECTS IN 10YRS Beach/Lake Restaurants Park Traffic Parking Beach/Lake Bike Parking Beach Improvement Beach/Lake The Community Businesses Housing Parking Beach/Lake Parking Businesses School American Legion Campground Businesses Zorbaz Pavilion Location New Hotel Year-round Condition Pedestrians Businesses Bike Swimmers Congestion Residential Facilities People Traffic Improvements Retail Business Improvements Restaurants Pavilion More and Improve Activities Bike Safety and Shops Sidewalk/ Street Tourism Downtown Parks Detroit Lakes Mountain Events School Business Traffic Aging Taxes Lake Retail choices Downtown Affordable Housing Downtown Plan/Expansion Businesses Parks Traffic Trails Beach/Lake Development 83


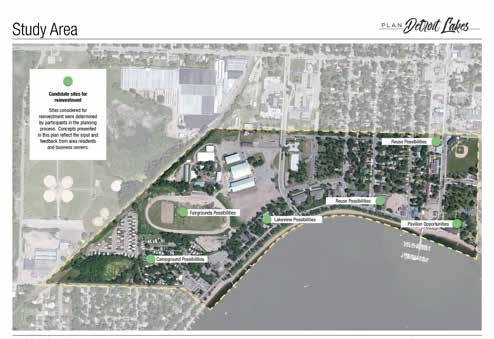
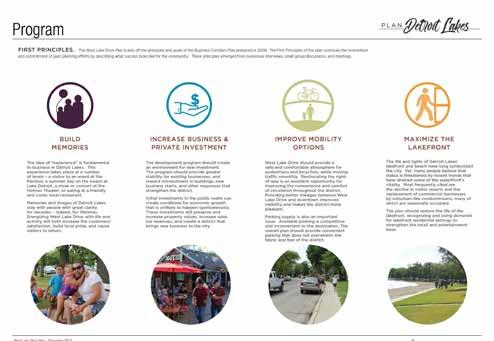
84 WEST LAKE DRIVE PLAN OPEN HOUSE POSTERS - OCTOBER/DECEMBER 84

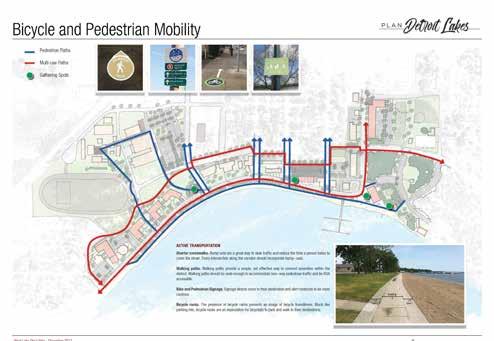
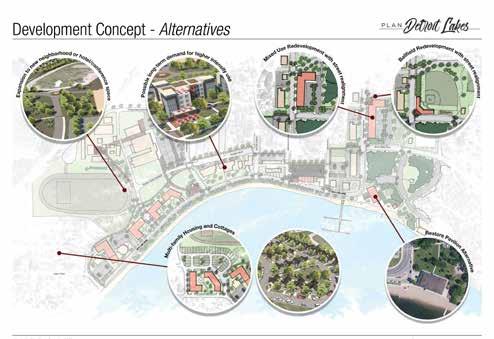
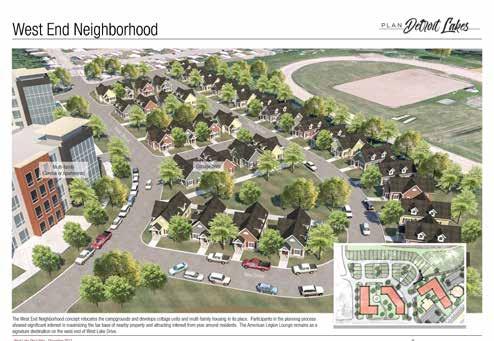
85 3 DEVELOPMENT CONCEPT OPEN HOUSE POSTERS - OCTOBER/DECEMBER 85


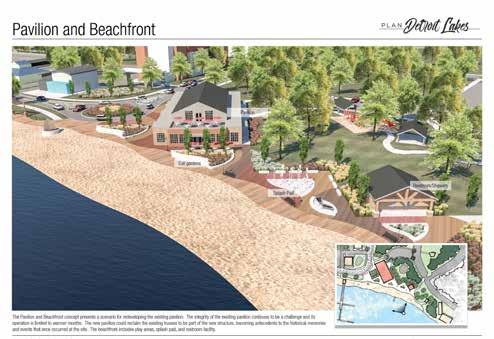
86 WEST LAKE DRIVE PLAN OPEN HOUSE POSTERS - OCTOBER/DECEMBER 86


87 3 DEVELOPMENT CONCEPT OPEN HOUSE POSTERS - OCTOBER/DECEMBER EVENT POSTERS What do you want West Lake Drive to be like in the future? Help design West Lake Drive for the future. Discover the future possibilities for West Lake Drive ENCORE EVENT: Discover the future possibilities for West Lake Drive Learn more. Share ideas. Discover possibilities. Enjoy free snacks! Share ideas. Draw concepts. Explore possibilities. Have fun! Development opportunties Mobility options Talk with planners and designers about the concepts for improving the West Lake Drive area. Development opportunties Mobility options Talk with city staff about the concepts for improving the West Lake Drive area. Kick-off Meeting Monday, July 10 th 6:30pm- 8:00pm Minnesota State Community and Technical College 900 Highway 34 E - Detroit Lakes Auditorium, Room C101 Design Studio Tuesday, August 1 st & Wednesday, August 2 nd 5pm-7pm Stop by for 15 minutes or the entire session Open House Event Tuesday, October 17 th 5:00pm- 6:30pm Doors open at 5pm. Presentation at 5:15pm. City Hall Council Chambers 1025 Roosevelt Avenue Open House Encore Event Monday, December 18 th 5:00pm- 6:00pm Doors open at 5pm for informal discussion. Some concepts have been modified based on your input. City Hall Council Chambers 1025 Roosevelt Avenue City Hall - City of Detroit Lakes 1025 Roosevelt Avenue 87

88 WEST LAKE DRIVE PLAN 88
Retail MarketPlace Profile
 Ring: 1 mile radius Latitude: 32.35365 Summary Demographics 2016 Population 7,400 2016 Households 3,138 2016 Median Disposable Income $41,269 2016 Per Capita Income $24,267 Industry Summary (Retail Potential)
Retail MarketPlace Profile
 Ring: 3 miles radius Longitude: -83.78862 Summary Demographics 21 Population 28,66 21 Households 9,146 21 Median Disposable Income $35,477 21 Per Capita Income $18,259 Industry Summary (Retail Potential)
Retail MarketPlace Profile
 Summary Demographics Ring: 1 mile radius Longitude: -79.19276 2015 Population 2,497 2015 Households 1,302 2015 Median Disposable Income $36,906 2015 Per Capita Income $31,929 Industry Summary (Retail Potential)
Retail MarketPlace Profile
 Drive Time: 5 minute radius Longitude: -86.79066 Summary Demographics 2015 Population 10,596 2015 Households 4,648 2015 Median Disposable Income $55,009 2015 Per Capita Income $47,446 Industry Summary
Demographic and Income Profile
 Demographic and Income Profile Summary Census 21 212 217 Population 3,718 3,985 4,362 Households 1,316 1,418 1,571 Families 1,128 1,212 1,336 Average Household Size 2.82 2.81 2.77 Owner Occupied Housing
Site Map. Meadowlark Dr & Robinhood Rd, Winston Salem, NC, October 31, Esri
 Site Map Robinhood Village Meadowlark Dr & Robinhood Rd, Winston Salem, NC, 27106 Ring: 1, 3, 5 Miles Latitude: 36.120508 Longitude: -80.367204 October 31, 2011 2011 Esri Executive Summary Ring: 1, 3,
SUMMARY CENSUS Population 135, , ,685. Households 44,675 52,029 57,758. Families 36,035 41,582 45,978
 Retail Specialty Report 450 US-23, Suwanee, Georgia, 30024 RING: 5 MILES Demographic & Income Profile SUMMARY CENSUS 2010 2017 2022 Population 135,417 157,987 175,685 Households 44,675 52,029 57,758 Families
3598 OLD JENNINGS RD 3598 Old Jennings Rd, Middleburg, FL 32068
 LAND FOR SALE 3598 OLD JENNINGS RD 3598 Old Jennings Rd, Middleburg, FL 32068 PROPERTY FEATURES 7.69 Acres at Lighted intersection Adjacent Properties are Zoned MPC, School & Retail NC Across Tynes Water
KARNS, TENNESSEE 5.7 Acres Available Located on Oak Ridge Highway Excellent Development Opportunity!
 KARNS, TENNESSEE 5.7 Acres Available Located on Oak Ridge Highway Excellent Development Opportunity! DIXON GREENWOOD, CCIM Ball Realty & Auction, Inc. P.O. Box 237, Tazewell, TN 37879 423-626-9393 office
.33 AC AC RETAIL LAND FOR SALE OR BUILD TO SUIT ORCHARD ROAD & OAK STREET, NORTH AURORA, IL 60542
 Development Opportunity.33 AC - 6.74 AC RETAIL LAND FOR SALE OR BUILD TO SUIT ORCHARD ROAD & OAK STREET, NORTH AURORA, IL 60542 OFFERING SUMMARY Price / Acre: See Enclosed Pricing Summary Lot Size:.33
Real Estate/Economic Considerations
 Real Estate/Economic Considerations Why a Market Study? Understand demographic trends & real estate market conditions Translate growth forecasts into New housing Workplace uses Hotel/lodging Retail & supporting
Retail MarketPlace Profile
 Retail MarketPlace Profile Drive Time: 5 minute radius Longitude: -77.40323 Summary Demographics 2015 Population 8,394 2015 Households 3,199 2015 Median Disposable Income $38,578 2015 Per Capita Income
Retail / Office - Available on Busy Florence Ave.
 Retail / Office - Available on Busy Florence Ave. 1931-1935 Florence Ave. Los Angeles, CA 90001 DEMOS 1 mile 3 mile 5 mile Population 62,398 489,568 1,146,128 Avg. HH Income $43,380 $44,533 $45,775 Daytime
RETAIL PROPERTY FOR LEASE RYLAND PLAZA Ryland Pike, Huntsville, AL Clinton Avenue Suite 501 Huntsville, AL deancre.
 1001 Ryland Pike, Huntsville, AL 35811 2101 Clinton Avenue Suite 501 Huntsville, AL 35805 deancre.com 1001 RYLAND PIKE, HUNTSVILLE, AL 35811 EXECUTIVE SUMMARY OFFERING SUMMARY Available SF: 1,000-2,000
EDC ADDENDUM to the INTERIM REPORT
 EDC ADDENDUM to the INTERIM REPORT Economic Impact Assessment of Mansfield Park November 2018 STEWARDSHIP STRATEGIES Design Planning Historic Preservation Economic Development INTERIM REPORT - Economic
SECOND FLOOR STUDIO AVAILABLE ON VENTURA BLVD
 SECOND FLOOR STUDIO AVAILABLE ON VENTURA BLVD Located at 13563 1/2 Ventura Blvd, Sherman Oaks, CA 91423 DEMOS 1 mile 3 mile 5 mile Population 24,151 187,734 519,845 Avg. HH Income $121,056 $109,474 $101,327
Committee Meeting: Downtown Today & Concept Refinement September 11, 2017
 Committee Meeting: Downtown Today & Concept Refinement September 11, 2017 AGENDA 1. Brief Input Update 2. Comprehensive Plan Principles 3. Downtown Today 4. Concept Updates 5. Future Schedule What is a
Retail Leakage and Surplus Analysis
 The Retail Leakage and Surplus Analysis examines the quantitative aspect of the community's retail opportunities. It is a guide to understanding retail opportunities but it is not an analysis that indicates
Retail Leakage and Surplus Analysis
 Retail Leakage and Surplus Analysis The Retail Leakage and Surplus Analysis examines the quantitative aspect of the community's retail opportunities. It is a guide to understanding retail opportunities
Retail Leakage and Surplus Analysis
 Retail Leakage and Surplus Analysis The Retail Leakage and Surplus Analysis examines the quantitative aspect of the community's retail opportunities. It is a guide to understanding retail opportunities
1 October Dear Citizens of Charlotte and Mecklenburg County,
 1 October 2011 Dear Citizens of Charlotte and Mecklenburg County, As co-chairs of the Center City 2020 Vision Plan Steering Committee, we are proud to present the Center City 2020 Vision Plan, which sets
the GARRISON at Stafford
 the GARRISON at Stafford 425 GARRISONVILLE ROAD STAFFORD, VA 22556 STAFFORD COUNTY VA FOR LEASING INFORMATION PLEASE CONTACT: Dallon L. Cheney 703-268-2703 dcheney@klnb.com DEVELOPED BY: Melissa Welch
ELK GROVE GENERAL PLAN VISION
 2-1 CHAPTER 2: 2-2 CREATING OUR The Community Vision for Elk Grove, expressed through a Vision Statement and a series of Supporting Principles, is a declaration of the kind of community that Elk Grove
Dyersville Downtown Plan. Open House October 24, 2017
 Dyersville Downtown Plan Open House October 24, 2017 What is a Comprehensive Plan? - Vision - Guidance for decisions - Basis for regulations What is a Downtown Plan? - Understand priorities - Identify
SECTION ONE: INTRODUCTION. introduction
 introduction 1 INTRODUCTION Since it was first established in 1843 as a trading post for the Hudson s Bay Company, Victoria has evolved into a Provincial capital city that is recognized across Canada and
PROPERTY INFORMATION Executive Summary
 PROPERTY INFORMATION Executive Summary OFFERING SUMMARY Sale Price: $749,000 Lease Rate: $15-18 NNN Lot Size: 0.37 Acres Year Built: 1886 Renovated: 2011 PROPERTY HIGHLIGHTS Located on Main Street Route
2 BUSINESS CORRIDOR REDEVELOPMENT PLAN
 2 BUSINESS CORRIDOR REDEVELOPMENT PLAN ADOPTED DECEMBER 9, 2008 ACKNOWLEDGEMENTS 3 Acknowledgements Mayor Larry Buboltz City of Detroit Lakes Bob Louiseau, City Administrator Larry Remmen, Community Development
This Review Is Divided Into Two Phases:
 Semiahmoo Town Centre Review The purpose of this review: To review the Semiahmoo Town Centre Concept Plan, originally approved in 1993, to ensure that this centre will continue to serve the needs of South
4- PA - LD - LIVELY DOWNTOWN. LD - Background
 4- PA - LD - LIVELY DOWNTOWN LD - Background The downtown has been the service centre for the community since the city s inception and the area continues to supply people with their personal services,
Market Demand and Land Use
 Market Demand and Land Use Summary 57 Challenges 60-61 Guiding Principles 62 Strategy and Implementation 63-69 Establish a mix of uses that contribute to a vibrant downtown. 58 Summary Historically, downtown
EXISTING COMPREHENSIVE PLAN
 EXISTING COMPREHENSIVE PLAN Town Center Land Use Element: V. LAND USE POLICIES Town Center Mercer Island's business district vision as described in "Your Mercer Island Citizen-Designed Downtown" was an
Wasatch CHOICE for 2040
 Wasatch CHOICE for 2040 Economic Opportunities We Can Choose a Better Future We enjoy an unparalleled quality of life along the Wasatch Front. People from all over the world are drawn to our stunning scenery,
Retail Market Place Analysis Village of Monroe Comprehensive Plan. Prepared by
 Retail Market Place Analysis Village of Monroe Comprehensive Plan Prepared by January 31, 2011 Introduction It is clear from travelling around the Village that Monroe's current land use pattern is not
RMP Opportunity Gap - Retail Stores
 Radius 1:, 0.00-1.00 Miles, Total Total Retail Sales Incl Eating and Drinking Places 20,171,574 13,300,717 Motor Vehicle and Parts Dealers-441 3,793,941 601,379 Automotive Dealers-4411 3,202,573 356,177
5245 South Durango Drive Las Vegas, Nevada newmarketadvisors.com
 Revised 11.9.18 Charles Creigh 702.221.2500 ext. 305 ccreigh@newmarketadvisors.com Bob Touma 702.221.2500 ext. 318 Cell/Text 702.371.3467 btouma@newmarketadvisors.com Features Deer Springs Town Center
appendix 6: retail market potential opportunity gap retail stores 2007 Appendix Kensington and Vicinity Sector Plan Appendix 70
 appendix 6: retail market potential opportunity gap retail stores 2007 Appendix Kensington and Vicinity Sector Plan Appendix 70 Total Retail Sales Incl Eating and Drinking Places 32,442,099 95,578,148
RMP Opportunity Gap - Retail Stores
 Radius 1:, 0.00-1.00 Miles, Total Total Retail Sales Incl Eating and Drinking Places 265,416,122 83,489,366 Motor Vehicle and Parts Dealers-441 45,469,731 11,931,711 Automotive Dealers-4411 40,430,946
RMP Opportunity Gap - Retail Stores
 Radius 1:, 0.00-3.00 Miles, Total Total Retail Sales Incl Eating and Drinking Places 709,535,602 1,041,558,846 Motor Vehicle and Parts Dealers-441 136,302,785 84,961,319 Automotive Dealers-4411 120,666,093
Chapter 1: Introduction
 Chapter 1: Introduction The Penn Avenue Community Works Corridor Vision and Implementation Framework presents an integrated communitybased vision and a coordinated, long-term implementation framework for
Small Area Plan. South Gateway
 Small Area Plan Adopted May 12, 2008 South Gateway Purpose. The South Gateway Small Area Plan defines the City s expectations for the future of the southern entrance to the City at Interstate 85 and Highway
Comprehensive Plan ADOPTED APRIL 2014
 Comprehensive Plan ADOPTED APRIL 2014 8 8. Outstanding Recreational & Cultural Opportunities We are proud of our community s parks and recreation system. Our community will ensure that the legacy of our
5245 South Durango Drive Las Vegas, Nevada
 Revised 01.17.17 Charles Creigh 702.221.2500 ext. 305 ccreigh@newmarketadvisors.com Bob Touma 702.221.2500 ext. 318 Cell/Text 702.371.3467 btouma@newmarketadvisors.com FEATURES Deer Springs Town Center
SUBJECT: Waterfront Hotel Planning Study Update TO: Planning and Development Committee FROM: Department of City Building. Recommendation: Purpose:
 Page 1 of Report PB-23-18 SUBJECT: Waterfront Hotel Planning Study Update TO: Planning and Development Committee FROM: Department of City Building Report Number: PB-23-18 Wards Affected: 2 File Numbers:
RMP Opportunity Gap - Retail Stores 2007
 Radius 1: 5737 S TRANSIT RD, LOCKPORT, NY 14094-5892, 0.00-3.00 Miles, Total Total Retail Sales Incl Eating and Drinking Places 552,172,317 460,321,140 Motor Vehicle and Parts Dealers-441 103,214,550 82,475,641
REGIONAL ACTIVITY CENTER
 DRAFT REGIONAL ACTIVITY CENTER 70 EAST BENCH MASTER PLAN DRAFT 06 Introduction The East Bench Regional Activity center is comprised of large educational, research, medical, and employment centers. These
7Page 1 CLEMMONS COMMUNITY COMPASS 1 PLAN OVERVIEW
 1 Plan Overview WHAT IS I THE CLEMMONS COMMUNITY COMPASS? The Clemmons Community Compass is our community s comprehensive plan. It serves as our blueprint and provides direction for the future of the Village
Chapter 2: Vision, Goals and Strategies
 Chapter 2: Vision, Goals and Lake Elmo Today & Tomorrow Comprehensive Plan 2040 2 VISION, GOALS & STRATEGIES - DRAFT 4-6-2018 INTRODUCTION Comprehensive Plan Purpose Perhapse the most important objective
Robbinsdale LRT Station. CDI Development Guidelines. August Overview
 Robbinsdale LRT Station August 2018 Overview The City of Robbinsdale may have the coolest opportunity site along the 13 mile stretch of the Bottineau LRT corridor / Blue Line extension. Located a block
Denton. A. Downtown Task Force
 2 Public Involvement Early and ongoing public involvement was solicited so that the public had ample opportunity to help direct the DTIP s concepts and implementation strategies. The residents of Denton
Parks Master Plan Implementation: Phase I Waterfront Use and Design REPORT #: September 7, 2016 File #
 0 'O DI Lan-171-14 1 - THE CORPORATION OF THE TOWN OF COBOURG..,. STAFF REPORT TO: FROM: Mayor and Members of Council Dean A. Hustwick, Director of Recreation and Culture DATE OF MEETING: Committee of
Preparing to Review City-owned Property
 Preparing to Review City-owned Property June 28, 2017 WORKING DRAFT Prepared for: Mayor DeBoer and the Holland City Council Prepared by: Denny Ellens William J. Johnson Soren Wolff Phil Meyer REPORT CONTENTS
Policies and Code Intent Sections Related to Town Center
 Policies and Code Intent Sections Related to Town Center The Town Center Vision is scattered throughout the Comprehensive Plan, development code and the 1994 Town Center Plan. What follows are sections
Town Center (part of the Comprehensive Plan)
") Town Center (part of the Comprehensive Plan) Mercer Island Town Center Looking North (2014) In 1994, a year-long process culminated in a set of design guidelines and code requirements for the Town Center
Town Center (part of the Comprehensive Plan) Mercer Island Town Center Looking North (2014) In 1994, a year-long process culminated in a set of design guidelines and code requirements for the Town Center
Michigan City Alternative Analysis Realignment Study. Progress Status Update Report Presentation to City Council February 1, 2012
 Michigan City Alternative Analysis Realignment Study Progress Status Update Report Presentation to City Council Project Web Site Project Web Site is Active www. emichigancity.com Click on NICTD logo at
ROBBINSDALE LRT STATION CDI DEVELOPMENT GUIDELINES
 August 2018 OVERVIEW The City of Robbinsdale has a prime-opportunity site in the middle of the 13 mile stretch of the Bottineau LRT corridor / Blue Line extension. Robbinsdale offers a prominent, vital,
SALISBURY TOMORROW Our Vision
 SALISBURY TOMORROW Our Vision Salisbury is committed to supporting a high quality of life and sense of community for all residents. These commitments need to be reflected in our community programs, services
Joint Meeting City Council and the Plan Commission. September 1st, 2015
 Joint Meeting City Council and the Plan Commission September 1st, 2015 1 The City Plan Commission shall recommend a City Plan for the physical development of the City Article IX Section 2 of the City of
HE VISION. Building a Better Connected Place
 HE VISION Building a Better Connected Place WALK INTO THE FUTURE. Life in Cranberry, 2030 Here s what our residents told us they wanted to see in their community by 2030: The Cranberry of 2030 is a place
Living in Albemarle County s Urban Places
 Living in Albemarle County s Urban Places ALBEMARLE COUNTY, VIRGINIA A Closer Look at Albemarle s Approach to Managing Growth and Creating Quality Urban Environments www.albemarle.org Page 2 Living in
CHAPTER 1 Introduction
 CHAPTER 1 Introduction From sea to summit, Lane County covers almost 4,800 square miles of diverse Oregon landscape. Stretching from the Pacific Ocean through the Coastal Range, the Willamette Valley to
THE TOWN OF WASAGA BEACH
 THE TOWN OF WASAGA BEACH Downtown Development Master Plan Committee of the Whole Presentation January 26 th 2017 Uses within this designation should reflect a dependence on tourism as opposed to the permanent
Somers Point Master Plan
 Somers Point Master Plan Progress Report and Public Meeting August 20, 2014 Master Plan Reexamination Municipal Land Use Law require that all municipalities reexamine their master plan every ten years.
Study Area Maps. Profile Tables. The CORE Shopping Centre Pitney Bowes 2018 Canada Business Summary
 Powered by Sitewise Page 1 Study Area Maps Profile Tables 2018 Canada Business Summary 2018 Canada Businesses By SIC Codes (1-49) 2018 Canada Businesses By SIC Codes (50-99) Prepared on: 4/20/2018 3:45:52
Envision Front Royal Workshop 1 of 2
 Envision Front Royal Workshop 1 of 2 September 12, 2013 Summary The Envision Front Royal project held the first of two public workshops on September 12, 2013. The purpose of the workshop was to evaluate
General Plans. Tom Dansie, AICP Steve Pastorik, AICP
 General Plans Tom Dansie, AICP Steve Pastorik, AICP General Plans What is a General Plan? What does State code say? How is a General Plan used? How is a General Plan developed? Suggested considerations
THEMES, VISION, + PRINCIPLES
 CHAPTER 2: THEMES, VISION, + PRINCIPLES This page intentionally left blank. 20 VISION DRAFT AUGUST 2018 2 2 THEMES, VISION, + GUIDING PRINCIPLES The Key Themes, Vision, and Guiding Principles presented
Midtown Greenway PROJECT REPORT CARD
 Midtown Greenway PROJECT REPORT CARD Project Overview and History The Midtown Greenway is a 5.5-mile multi-use trail that connects the Mississippi River to the Minneapolis Chain of Lakes. The corridor,
Economic Development & Housing Council Committee Comprehensive Plan Update September 20, 2005
 1 Economic Development & Housing Council Committee Comprehensive Plan Update September 20, 2005 Purpose To update the Committee on the ForwardDallas! Plan, including: Status Anticipated Products Public
TOD 101 CREATING LIVABLE COMMUNITIES WITH TRANSIT
 1 CREATING LIVABLE COMMUNITIES WITH TRANSIT What are transit Centered Communities? Benefits of Partnerships to Support and Implement What You Will Learn Portland s Pearl District Your Trainers Today Catherine
MALL REVITALIZATION CASE STUDIES
 MALL REVITALIZATION CASE STUDIES DECEMBER 9, 2012 MALL REVITALIZATION OVERVIEW Introduction Sample Case Studies prepared for Lacey Woodland District Steering Committee as it considers strategies to revitalize
BROOKLYN PARK / 85TH AVE LRT STATION CDI DEVELOPMENT GUIDELINES DRAFT
 August 2018 Page intentionally left blank The Brooklyn Park Library adjacent to the 85th Ave LRT Station Area. OVERVIEW The Blue Line LRT Extension / Bottineau corridor offers a unique opportunity to leverage
hermitage town center
 hermitage town center A Community Vision prepared by Strada for The City of Hermitage and The Mercer County Regional Planning Commission January 2007 table of contents introduction 3 design principles
2012 Population by Race
 Trends 2012-2017 3 Annual Rate (in percent) 2.5 2 1.5 1 0.5 Area State USA 0 Population Households Families Owner HHs Median HH Income Population by Age 22 20 18 16 Percent 14 12 10 8 6 4 2 0 0-4 5-9 10-14
CITY CLERK. Parkland Acquisition Strategic Directions Report (All Wards)
") CITY CLERK Clause embodied in Report No. 10 of the, as adopted by the Council of the City of Toronto at its meeting held on November 6, 7 and 8, 2001. 10 Parkland Acquisition Strategic Directions Report
CITY CLERK Clause embodied in Report No. 10 of the, as adopted by the Council of the City of Toronto at its meeting held on November 6, 7 and 8, 2001. 10 Parkland Acquisition Strategic Directions Report
Cumberland Region Tomorrow is a private, non-profit, citizen based regional organization working with Greater Nashville Regional Council
 Cumberland Region Tomorrow is a private, non-profit, citizen based regional organization working with Greater Nashville Regional Council and others in the public and private sectors, dedicated to planning
Urban Planning and Land Use
 Urban Planning and Land Use 701 North 7 th Street, Room 423 Phone: (913) 573-5750 Kansas City, Kansas 66101 Fax: (913) 573-5796 Email: planninginfo@wycokck.org www.wycokck.org/planning To: From: City Planning
2040 LUP is a part of the Comprehensive Plan and carries the same legal authority. Economic Challenges
 1.1. Guiding Anchorage s Growth Where will new residents settle over the next two decades? Where will people work, shop, and play? Will there be enough room to grow? How will Anchorage look? Will growth
Commercial, Retail and Tourism Executive Summary December 2018
 Town of Wasaga Beach Official Plan Review, Retail and Executive Summary December 2018 1 An Official Plan directs where and how to grow The preparation of a new Official Plan for Wasaga Beach is an opportunity
EXHIBIT A. Tax Increment Reinvestment Zone No. 1 (Town Center) First Amended Project Plan 1
 First Amended Project Plan 1") EXHIBIT A Tax Increment Reinvestment Zone No. 1 (Town Center) First Amended Project Plan 1 1 As amended by Resolution No. 2008-02-001(TR1R) of the Tax Increment Reinvestment Zone No.1, and approved to
EXHIBIT A Tax Increment Reinvestment Zone No. 1 (Town Center) First Amended Project Plan 1 1 As amended by Resolution No. 2008-02-001(TR1R) of the Tax Increment Reinvestment Zone No.1, and approved to
section 3: Vision, Values and Goals
 Vision, Values and Goals 3 2041 Vision: Victoria is an urban sustainability leader inspiring innovation, pride and progress towards greater ecological integrity, livability, economic vitality, and community
South Norfolk Municipal Facilities Study
 South Norfolk Municipal Facilities Study City of Chesapeake, VA P r e s e n t e d b y H B A A r c h i t e c t u r e & I n t e r i o r D e s i g n, I n c. 1 Purpose of the Study (Phase I) Identify potential
East Central Area Plan
 East Central Area Plan Steering Committee Meeting March 8 th, 2018 CHUN Tears McFarlane House Vision Statement Development Opportunities Analysis Vision Elements 1. Equitable, Affordable and Inclusive
RE-Imagining the Downtown Colorado Springs Master Plan
 RE-Imagining the Downtown Colorado Springs Master Plan 2016 APA Colorado State Conference October 25, 2016 Overview 8:00 Welcome, Introductions, and Overview 8:15 Downtown s Planning History 8:30 A Market
2.0 THE PLATINUM TRIANGLE VISION
 2.0 THE PLATINUM TRIANGLE VISION The envisions an exciting future for the area surrounding Angel Stadium of Anaheim, the Honda Center and The Grove of Anaheim. 2.1 Planning Principles In order to further
7Page 91 CLEMMONS COMMUNITY COMPASS 7 COMMUNITY CHARACTER
 7 Community Character The beauty of Clemmons won t necessarily be a reflection of our past, but our future. This quote from Comprehensive Plan Steering Committee member Wayne Dodson captures the essence
1.0 Purpose of a Secondary Plan for the Masonville Transit Village
 Report to Planning and Environment Committee To: Chair and Members Planning & Environment Committee From: John M. Fleming Managing Director, Planning and City Planner Subject: Masonville Transit Village
CHAPTER 3 VISION, GOALS, & PLANNING PRINCIPLES. City of Greensburg Comprehensive Plan. Introduction. Vision Statement. Growth Management Goals.
 CHAPTER 3 VISION, GOALS, & PLANNING PRINCIPLES Introduction The Greensburg Comprehensive Plan is intended as a working community document. A combination of long and short-term goals, this document is intended
Sherri Ferguson. President/CEO Portland Chamber of Commerce. Tennessee Certified Economic Developer Capstone Project
 Sherri Ferguson President/CEO Portland Chamber of Commerce Tennessee Certified Economic Developer Capstone Project Strategic Plan Development for the North Gateway of Portland, Tennessee The New Gateway
Preliminary Plan Framework: Vision and Goals
 Preliminary Plan Framework: Vision and Goals Draft: May 2015 Introduction Since the Town of Milliken s comprehensive plan was last updated in 2010, the community was heavily impacted by the 2013 flood,
Table of Contents. Elm Avenue Improvement Plan City of Waco, Texas. Introduction 1. Existing Context 1 Figure 1 2.
 Table of Contents Introduction 1 Existing Context 1 Figure 1 2 Plan Guidelines 3 Future Urban Form 4 The West-End 4 Main Street 6 The East-End 7 Figure 2 9 Public Improvement Recommendations 7 General
Arlington County Retail Plan
 Arlington County Retail Plan Draft April 28, 2015 EXECUTIVE SUMMARY Arlington will be a community where retail is convenient, appealing, activating and sustainable; that provides interest and authenticity,
2 Vision. Master Plan
 19 2 Vision Master Plan 20 Chapter 2 MASTER PLAN VISION 2.1 Master Plan Organization Lake Calhoun/Bde Maka Ska and Lake Harriet are places where complex human and natural systems intersect and converge.
Downtown Dubuque...it s a great time.
 Downtown Dubuque...it s a great time. Your timing could not be better to invest in Downtown. With hundreds of millions in public and private investment occurring on the City s downtown waterfront, millions
RESOLUTION NO. R Refining the route, profile and stations for the Downtown Redmond Link Extension
 RESOLUTION NO. R2018-32 Refining the route, profile and stations for the Downtown Redmond Link Extension MEETING: DATE: TYPE OF ACTION: STAFF CONTACT: Capital Committee Board PROPOSED ACTION 09/13/2018
Gold Line Bus Rapid Transit Transit Oriented Development (BRTOD) Helmo Station Area Plan
 Helmo Station Area Plan") Appendix F Gold Line Bus Rapid Transit Transit Oriented Development (BRTOD) Helmo Station Area Plan Introduction and Purpose of the Plan The Gold Line Bus Rapid Transit facility is an eleven-mile dedicated
Appendix F Gold Line Bus Rapid Transit Transit Oriented Development (BRTOD) Helmo Station Area Plan Introduction and Purpose of the Plan The Gold Line Bus Rapid Transit facility is an eleven-mile dedicated
A Dynamic Downtown requires Dynamic Planning
 A Dynamic Downtown requires Dynamic Planning DOWNTOWN WINSTON -SALEM: 15 YEARS OF TRANSFORMATION OCTOBER 17, 2014 A.PAUL NORBY, FAICP JASON THIEL ADAM SEBASTIAN, AIA What Has Happened So Far To Make Downtown
Atlanta BeltLine Subarea 3 Master Plan Update
 Atlanta BeltLine Subarea 3 Master Plan Update April 14, 2018 Workshop Meeting 1 22 miles, connecting 45 neighborhoods 22 MILES of transit 46 MILES of streetscapes and complete streets 33 MILES of urban
CITY OF COLWICH COMPREHENSIVE PLAN LAND USE LAND USE 1
 LAND USE LAND USE 1 WHAT YOU WILL FIND IN THIS CHAPTER: Discussion of today s conditions and tomorrow s projections Discussion of challenges and opportunities Discussion of the environmental quality goals,
MASTER PLANNING: THE CRITICAL ROLE OF ELECTED LEADERS AND THE PLANNING COMMISSION Planning Michigan Conference
 MASTER PLANNING: THE CRITICAL ROLE OF ELECTED LEADERS AND THE PLANNING COMMISSION 2018 Planning Michigan Conference Today s Presenters: Chris McLeod, AICP, Sterling Heights City Planner Gerald (Jerry)
City of Farmington. Downtown Plan. Amendment to the 1998 Master Plan Adopted October 11, 2004
 City of Farmington Amendment to the 1998 Master Plan Adopted October 11, 2004 Introduction Planning Background 1 Scope and Components of the Plan Amendment 2 Concept Introduction 3 Plan Concepts 3 Conceptual