Impact of a High Volume Low Speed Fan on Sprinkler Performance in Rack Storage Fires
|
|
|
- Jade Penelope Randall
- 5 years ago
- Views:
Transcription
1 Research TECHNICAL REPORT Impact of a High Volume Low Speed Fan on Sprinkler Performance in Rack Storage Fires
2 TECHNICAL REPORT Impact of a High Volume Low Speed Fan on Sprinkler Performance in Rack Storage Fires By: Benjamin Ditch FM Global Research Division January 211
3 Impact of a High Volume Low Speed Fan on Sprinkler Performance in Rack Storage Fires by Benjamin Ditch FM Global Research Division 1151 Boston-Providence Turnkpike Norwood, MA Factory Mutual Insurance Company All rights reserved.
4 DISCLAIMER The research presented in this report, including any findings and conclusions, is for informational purposes only. Any references to specific products, manufacturers, or contractors do not constitute a recommendation, evaluation, or endorsement by Factory Mutual insurance Company (FM Global) of such products, manufacturers, or contractors. FM Global makes no warranty, express or implied, with respect to any product or process referenced in this report. FM Global assumes no liability by or through the use of any information in this report.
5 EXECUTIVE SUMMARY An Engineering Standards support project was initiated to evaluate the effect of High Volume Low Speed (HVLS) fans on sprinkler system performance in warehouse scenarios. These fans have diameters up to 7.3 m (24 ft) and are becoming an increasingly popular alternative to standard high speed industrial fans due to their improved energy efficiency. The effect of HVLS fans has yet to be subjected to detailed exploration of the unique and potentially detrimental effect on ceiling level sprinkler protection. Consequently, neither FM Global Property Loss Prevention Data Sheets nor NFPA 13 [i] contains specific installation recommendations or requirements for HVLS fans. This project was conducted in conjunction with the Property Insurance Research Group (PIRG) and was directed through the National Fire Protection Association (NFPA) Fire Protection Research Foundation (FPRF). PIRG is comprised of domestic and international property insurance companies with the goal of acquiring general knowledge for issues spanning the property insurance industry. Participation is voluntary and projects are funded by an annual fee. All projects include a technical panel oversight committee including industry experts, consultants and sprinkler association members. FM Global participates in the PIRG as a principal sponsor. In this study, four large-scale fire tests were conducted by FM Global at the FM Global Research Campus in West Glocester, Rhode Island, USA. The specific scenario addressed was protection of cartoned unexpanded plastic (CUP) commodity using FM Approved quick-response, pendent sprinklers, having a 71 o C (16 o F) rated link and a K-Factor of 22 L/min/bar 1/2 (14 gpm/psi 1/2 ). Commodity was stored in a double-row open rack arrangement and the ceiling height was set to the maximum allowed in FM Global Property Loss Prevention Data Sheet 8-9 [ii] of 12.2 m (4 ft). A 7.3 m (24 ft) diameter HVLS fan operating at 66 rpm was mounted between the ceiling and the commodity. Within the scope of these tests, it was found that operation of the HVLS fan without any means of shut down caused an unacceptable impairment to the sprinkler system. i National Fire Protection Association Standard 13, Standard for the Installation of Sprinkler System, 21. ii Storage of Class 1, 2, 3, 4 and Plastic Commodities, Data Sheet 8-9, FM Global, May 28. i
6 However, when shut down of the fan occurred within 1 min 3 s after first sprinkler operation the sprinkler systems performed adequately. The fan-induced air-flow velocity around and through the ignition bay also was measured for each test array. With only the fan operating, measurements were acquired at multiple elevations spanning from the top of the array to the floor. It was shown that the fan can produce downward air velocities up to 4.5 m/s (14.8 ft/s) at the top of the array with significant penetration, i.e., velocity 1. m/s (3.3 ft/s), several tiers through the array. These data provide insight into the potential affect on sprinkler activation and fire development within the array due to the operating fan. To date, no study has been conducted to measure these air currents for an HVLS fan installed above any type of storage array. There has been one previous study, coordinated by PIRG, evaluating the effects of an HVLS fan on sprinkler system performance [iii]. This study included two large-scale tests that were conducted at Underwriters Laboratories located in Northbrook, Illinois, USA. Both tests consisted of 6.1 m (2 ft) tall rack storage of cartoned unexpanded plastic (CUP) commodity under a 9.1 m (3 ft) ceiling. Protection was provided by quick-response, pendent sprinklers, having a K-Factor of 22 L/min/psi 1/2 (14 gpm/psi 1/2 ). It was concluded that the presence of an operating HVLS fan did not significantly hinder the ceiling level sprinkler protection. However, it is important to note that ignition for these tests was centered within the array and an evaluation with the ignition offset within the central transverse flue was not conducted. In addition, the protection requirements contained in FM Global Property Loss Prevention Data Sheet 8-9 [ii] allows ceiling-only sprinkler protection for this sprinkler up to 12.2 m (4 ft), which would potentially increase the fire challenge. FM Global participated as a member of the project technical panel for this prior project. All conclusions in this report are specific to the array configurations used in these tests. The combined effects of a different array height, commodity type, ceiling height, fan diameter/blade shape and speed, etc., are yet to be well understood and may not be inferred from these test iii HVLS Fans and Sprinkler Operation Phase 1 Research Program, Final Report prepared by Schirmer Engineering Corporation, February 29. ii
7 results alone. Based on the results of the tests presented in this report the following additional conclusions can be made: The HVLS fan operating without means of automatic shut down resulted in inadequate sprinkler system performance. The HVLS fan centered over the main array, with a clearance from the ceiling to the top of the commodity of 3. m (1 ft), resulted in the largest negative impact on the sprinkler system performance. For storage with a clearance from the top of the commodity to the ceiling ranging from 3. to 7.6 m (1 to 25 ft), fan shut down due to a water flow alarm, i.e., fan shut down less then or equal to 1 min 3 s after first sprinkler operation, allowed for adequate sprinkler system performance. The HVLS fan operating at full speed, with a 3. m (1 ft) clearance between the top of the commodity and the ceiling: o Produced downward air-flow velocities up to 4.5 m/s (14.8 ft/s) at the top of the storage array, o Produced significant air-flow velocities, i.e., velocities greater than or equal to 1 m/s (3.3 ft/s), that penetrate up to 4 tiers (6.1 m [2 ft]) through an open frame double-row rack storage array, o Created the greatest disturbance to the ceiling gas flow above ignition when the fan was offset 2.2 m (7.1 ft) from the center of the test array. The HVLS fan operating at half speed, with a 7.6 m (25 ft) clearance between the top of the commodity and the ceiling, and the fan centered over the array, reduced the peak air velocity reaching the top of the array by approximately 6%. The exhaust air system of the FM Global Large Burn Laboratory extracting air at 94 m 3 /s (2, cfm) generates a negligible air flow across the movable ceiling. The air-flow generated by the HVLS is the dominant disturbance to the ceiling level gas flow. iii
8 LARGE-SCALE TEST OVERVIEW The setup and results for all tests included in this report are shown in Table i and Table ii. iv
9 Table i: Test parameters and results, Tests 1-3 Project Identification Test Number Test 1 Test 2 Test 3 Test Date 8/4/21 8/2/21 9/3/21 FM Global Fire Technology Laboratory Test Site South Movable Ceiling Environmental Conditions Pre-test Site Dry-Bulb Temperature [ C ( F)] 27 (8) 23 (73) 23 (73) Pre-test Site Relative Humidity (%) Outdoor Dry-Bulb Temperature [ C ( F)] 29 (84) 19 (67) 28 (82) Outdoor Relative Humidity (%) Main Array Moisture Content [% v/v] Target Array (East Only) Moisture Content [% v/v] Fire Test Setup Nominal Ceiling Height [m (ft)] 12.2 (4) Test Commodity / Fuel Standard Plastic Commodity Fire Type Double-row rack storage array Main Array Dimensions (pallet loads) 2 x 8 x 6 Target Array Dimensions (pallet loads), East and West 1 x 6 x 6 Nominal Flue Space Width [mm (in.)] 152 (6) Aisle Width [m (ft)] 1.2 (4) Main Array Located Below - number of sprinklers Ignition Location Relative to Rack - offset/non-offset Offset Ignition Location Relative to Sprinkler centered/offset Offset Fan Diameter [m (ft)] - number of blades 7.3 (24) 6 blades Fan Operating Speed (rpm) 66 Fan Location Relative to Rack Offset Centered Centered Fan Hub Installation Level Below Ceiling [mm (in.)] 127 (5) Fan Shut Down Condition None None Water flow Sprinkler Type (Pendent) Pendent Sprinkler Model Tyco TY6226 Discharge Coefficient (K-Factor) [L/min/(bar) ½ (gal/min/(psi) ½ )] 22 (14) Temperature Rating [ C ( F)] 71 (16) Nominal Response Time Index (RTI) [m ½ s ½ (ft ½ s ½ )] 28 (5) Spacing [m x m (ft x ft)] 3 x 3 (1 x 1) Discharge Pressure [bar (psi)] 5.2 (75) Nominal Discharge [L/min (gpm)] 454 (12) Fire Test Results Total Sprinklers Opened First / Last Sprinkler Operation Times (min:s) 1:28/7:53 1:42/3:57 1:54/2:3 Target Jump East/West (min:s) East, 3:9 East, 2:13 East, 3: West, 5:5 West, no West, no Maximum Steel TC Measurement [ C ( F)] 76 (169) 47 (117) 45 4: :45 and Time 4:49 Maximum One Minute Average TC Measurement 293 (559) 13 (266) [ C ( F)] at Time 3:7 Test Termination - Time After Ignition (min:s) 35: 25: 3: Fan shut down occurred 1 min 3 s after first sprinkler operation v
10 Table ii: Test parameters and results, Test 4 Project Identification Test Number Test 4 Test Date 12/2/21 FM Global Fire Technology Laboratory Test Site South Movable Ceiling Environmental Conditions Pre-test Site Dry-Bulb Temperature [ C ( F)] 23 (74) Pre-test Site Relative Humidity (%) 24 Outdoor Dry-Bulb Temperature [ C ( F)] 2 (36) Outdoor Relative Humidity (%) 55 Main Array Moisture Content [% v/v] 5.9 Target Array (East Only) Moisture Content [% v/v] 6.3 Fire Test Setup Nominal Ceiling Height [m (ft)] 12.2 (4) Test Commodity / Fuel Standard Plastic Commodity Fire Type Double-row rack storage array Main Array Dimensions (pallet loads) 2 x 8 x 3 Target Array Dimensions (pallet loads), East and West 1 x 6 x 3 Nominal Flue Space Width [mm (in.)] 152 (6) Aisle Width [m (ft)] 1.2 (4) Main Array Located Below - number of sprinklers 4 Ignition Location Relative to Rack - offset/non-offset Offset Ignition Location Relative to Sprinkler centered/offset Offset Fan Diameter [m (ft)] - number of blades 7.3 (24) 6 blades Fan Operating Speed (rpm) 66 Fan Location Relative to Rack Centered Fan Hub Installation Level Below Ceiling [mm (in.)] 127 (5) Fan Shut Down Condition Water flow Sprinkler Type (Pendent) Pendent Sprinkler Model (Year manufactured) Tyco TY6226 Discharge Coefficient (K-Factor) [L/min/(bar) ½ (gal/min/(psi) ½ )] 22 (14) Temperature Rating [ C ( F)] 71 (16) Nominal Response Time Index (RTI) [m ½ s ½ (ft ½ s ½ )] 28 (5) Spacing [m x m (ft x ft)] 3 x 3 (1 x 1) Discharge Pressure [bar (psi)] 5.2 (75) Nominal Discharge [L/min (gpm)] 454 (12) Fire Test Results Total Sprinklers Opened 4 First / Last Sprinkler Operation Times (min:s) 1:39 / 1:42 Target Jump yes/no (min:s) No Maximum Steel TC Measurement [ C ( F)] and Time (min:s) 28 1:46 Maximum One Minute Average TC Measurement [ C ( F)] at Time(min:s) 44 1:42 Test Termination - Time After Ignition (min:s) 3: Fan shut down occurred 1 min 3 s after first sprinkler operation vi
11 ABSTRACT The goal of this project was to evaluate the effect of a High Volume Low Speed (HVLS) fan on the performance of ceiling level sprinkler protection in a warehouse storage scenario. Four largescale fire tests were conducted with FM Global s Cartoned Unexpanded Plastic (CUP) commodity stored in a rack storage arrangement. It was found that an HVLS fan operating without means of automatic shut down results in inadequate sprinkler system performance. However, adequate protection system performance was achieved when the fan was shut down 1 min 3 s after first sprinkler operation. Increasing the clearance between the HVLS fan and the commodity was also shown to have minimal negative impact on the effectiveness of the sprinkler system. The results found during this project are specific to the array configurations used in these tests. The combined effects of a different array height, commodity type, ceiling height, fan diameter/blade shape and speed, etc., are yet to be well understood and may not be inferred from these test results alone. vii
12 ACKNOWLEDGEMENTS The author thanks Mr. J. Chaffee, Mr. R. Chmura, Mr. M. Skidmore, Mr. P. Mancini and the entire FM Global Research Campus Large Burn Lab crew for their efforts in conducting the large-scale tests. A special thanks to Mr. C. Labutti, Mr. M. Silva, Mr. S. Ulrickson, and Mr. J. St. Pierre for designing and implementing the specialty air-flow instrumentation. The author further thanks Kathleen Almand, as head of the Fire Protection Research Foundation, and the members of the Property Insurance Research Group for their insightful discussions. In addition, MacroAir Technologies is gratefully acknowledged for donating the HVLS fans used in this project. Finally, as always, the efforts of Mrs. Cheryl McGrath in processing this report are greatly appreciated. viii
13 TABLE OF CONTENTS Section Title Page EXECUTIVE SUMMARY i LARGE-SCALE TEST OVERVIEW iv ABSTRACT vii ACKNOWLEDGEMENTS viii TABLE OF CONTENTS ix LIST OF FIGURES xii LIST OF TABLES xv LIST OF TABLES xv 1 INTRODUCTION 1 2 BACKGROUND 2 3 REPORT SCOPE AND RATIONAL 5 4 TEST CONDITIONS AND PROCEDURES LARGE BURN LABORATORY TEST COMMODITY AUTOMATIC SPRINKLER PROTECTION IGNITION HIGH VOLUME LOW SPEED FAN Fan Specifications Fan Operation During Fire Tests TEST CONFIGURATION OVERVIEW DOCUMENTATION AND INSTRUMENTATION AIR-FLOW MEASUREMENTS Air-Flow Measurements at Top of the Main Array Air-Flow Measurements within Main Array Selection of pressure transducer range SPRINKLER SYSTEM PERFORMANCE CRITERIA Sprinkler Operations Extent of Fire Damage Steel Temperature 17 ix
14 4.9.4 Gas Temperature Total Energy Released 17 5 TEST RESULTS AND DATA ANALYSIS SPRINKLER OPERATION PATTERNS TOTAL ENERGY CEILING GAS CENTROID AT FIRST SPRINKLER OPERATION CEILING AIR-FLOW STABILIZATION COLD FLOW AIR VELOCITY AT ARRAY TOP COLD FLOW AIR VELOCITY THROUGH ARRAY FIRE TEST AIR FLOW VELOCITY AT TOP OF ARRAY 41 6 DISCUSSION FIRE GROWTH RATE COMPARISON TESTS 2 AND DISPLACEMENT OF FIRE PLUME DUE TO FAN OPERATION 47 7 CONCLUSIONS 48 8 REFERENCES 5 A APPENDIX A - SOUTH CEILING LEVEL THERMOCOUPLE LAYOUT 51 B APPENDIX B - TEST 1: DATA, OBSERVATIONS, AND RESULTS 52 B.1.1 Test 1 Highlights 53 B.1.2 Test 1 Results 53 C APPENDIX C - TEST 2: DATA, OBSERVATIONS, AND RESULTS 63 C.1.1 Test 2 Highlights 64 C.1.2 Test 2 Results 64 D APPENDIX D - TEST 3: DATA, OBSERVATIONS, AND RESULTS 74 D.1.1 Test 3 Highlights 75 D.1.2 Test 3 Results 75 E APPENDIX E - TEST 4: DATA, OBSERVATIONS, AND RESULTS 85 E.1.1 Test 4 Highlights 86 E.1.2 Test 4 Results 86 F APPENDIX F FIRE CHRONOLOGIES 96 F.1 TEST 1 FIRE CHRONOLOGY 96 F.2 TEST 2 FIRE CHRONOLOGY 97 x
15 F.3 TEST 3 FIRE CHRONOLOGY 98 F.4 TEST 4 FIRE CHRONOLOGY 99 G APPENDIX G HVLS FAN SPECIFICATIONS 1 H APPENDIX H SUMMARY OF HVLS FAN TESTING TO DATE 11 xi
16 LIST OF FIGURES Figure Title Page Figure 1-1: HVLS fan in industrial occupancy... 1 Figure 1-2: Traditional wall-mount industrial fan... 1 Figure 4-1: Illustration of FM Global Large Burn Laboratory test locations... 6 Figure 4-2: Photo of cartoned unexpanded plastic (CUP) commodity... 7 Figure 4-3: Typical rack storage array of standard plastic commodity... 8 Figure 4-4: Plan view of main and target arrays... 9 Figure 4-5: Tyco TY6226 photos... 9 Figure 4-6: Igniters within the rack, located at the rack uprights... 1 Figure 4-7: Sprinkler layout for Tests Figure 4-8: Plan view of air-flow measurement instrumentation layout Figure 4-9: Top view of air-flow instrumentation design Figure 4-1: Supplementary air-flow measurements within main array for Tests 2 and 3 configuration (English and metric units) Figure 5-1: Sprinkler operation pattern for Tests Figure 5-2: Total integrated energy for Tests Figure 5-3: Contour plots of ceiling TC measurements at first sprinkler operation for Tests Figure 5-4: Ceiling level air flow resulting from building exhaust only for Test Figure 5-5: Air-flow at top of array [3.2 m (1.5 ft) below ceiling] with fan operating at 66 rpm for Test Figure 5-6: Air-flow at top of array [3.2 m (1.5 ft) below ceiling] with fan operating at 66 rpm for Tests 2 and Figure 5-7: Air-flow at top of array [7.8 m (25.5 ft) below ceiling] with fan operating at 66 rpm for Test Figure 5-8: Air-flow at top of array [7.8 m (25.5 ft) below ceiling] with fan operating at 33 rpm for Test Figure 5-9: Air velocity through array with the fan at 66 rpm for Test 1 [no fire] Figure 5-1: Air velocity through array with the fan at 66 rpm for Tests 2 and 3 [no fire] Figure 5-11: Air velocity through array with the fan at 33 and 66 rpm for Test 4 [no fire]... 4 xii
17 Figure 5-12: Air flow velocities at top of array during Test 1 (until first sprinkler operation) Figure 6-1: Photos of Test Figure 6-2: Photos of Test Figure 6-3: Ceiling TC measurement contour plot for Test Figure 6-4: Ceiling TC measurement contour plot for Test Figure B-1: Plan view of sprinkler operation pattern - Test Figure B-2: Damage assessment - Test Figure B-3: Various near-ceiling TC measurements - Test Figure B-4: Data plots Test Figure B-5: Heat release rate Test Figure B-6: Time evolution of x- and y-coordinate of ceiling layer centroid Test Figure B-7: Ceiling TC contours at first sprinkler operation (1 min 28 s) Test Figure B-8: Air-flow above array at ignition bay Test Figure C-1: Plan view of sprinkler operation pattern - Test Figure C-2: Damage assessment - Test Figure C-3: Various near-ceiling TC measurements - Test Figure C-4: Data plots Test Figure C-5: Heat release rate Test Figure C-6: Time evolution of x- and y-coordinate of ceiling layer centroid Test Figure C-7: Ceiling TC contours at first sprinkler operation (1 min 42 s) Test Figure C-8: Air-flow above array at ignition bay Test Figure D-1: Plan view of sprinkler operation pattern - Test Figure D-2: Damage assessment - Test Figure D-3: Various near-ceiling TC measurements - Test Figure D-4: Data plots Test Figure D-5: Heat release rate Test Figure D-6: Time evolution of x- and y-coordinate of ceiling layer centroid Test Figure D-7: Ceiling TC contours at first sprinkler operation (1 min 54 s) Test Figure D-8: Air-flow above array at ignition bay Test Figure E-1: Plan view of sprinkler operation pattern - Test Figure E-2: Damage assessment - Test xiii
18 Figure E-3: Various near-ceiling TC measurements - Test Figure E-4: Data plots Test Figure E-5: Heat release rate Test Figure E-6: Time evolution of x- and y-coordinate of ceiling layer centroid Test Figure E-7: Ceiling TC contours at first sprinkler operation (1 min 39 s) Test Figure E-8: Air-flow above array at ignition bay Test xiv
19 LIST OF TABLES Figure Title Page Table i: Test parameters and results, Tests 1 3. v Table ii: Test parameters and results, Test 4...vi Table 5-1: Summary of test setup and results... 2 Table 5-2: Average cold flow air velocities at top of array for Tests Table 5-3: Average cold flow air velocities through array for Test 1 (metric units) Table 5-4: Average cold flow air velocities through array for Tests 2 and 3 (metric units) Table 5-5: Average cold flow air velocities through array for Test 4 (66 rpm) (metric units) Table 5-6: Average cold flow air velocities through array for Test 4 (33 rpm) (metric units) Table 6-1: Comparison of fire development for Tests 2 and xv

 and are rated to displace over 175 m 3 /s (37, cfm) of air while operating at only 65 rpm. This corresponds to a suggested 1,858 m 2 (2, ft 2 ) coverage area or 33.5 m (11 ft) spacing [1].")
20 1 INTRODUCTION High Volume Low Speed (HVLS) fans have become increasingly common as an alternative to smaller traditional industrial fans in many occupancies. Originally developed by Walter Boyd in 1995, HVLS fans move large volumes of air by using large air foil type blades. Increasing the blade range of motion reduces the necessary operating speed while improving the electrical efficiency. Some of the larger fans on the market span 7.3 m (24 ft) and are rated to displace over 175 m 3 /s (37, cfm) of air while operating at only 65 rpm. This corresponds to a suggested 1,858 m 2 (2, ft 2 ) coverage area or 33.5 m (11 ft) spacing [1]. Figure 1-1: HVLS fan in industrial occupancy * Figure 1-2: Traditional wall-mount industrial fan HVLS fan installations are typically mounted on the ceiling above open areas, such as wide aisle spaces or above loading dock areas as shown in Figure 1-1. However, a review by FM Global and Property Insurance Research Group (PIRG) members during this project identified a wide range of fan installations, including high bay rack storage. Depending on environmental conditions, many fans can be designed to blow air downward or upward. In addition, the blade pitch on some models also can be adjusted to maximize efficiency at different operating speeds. The corresponding traditional industrial fans are smaller diameter with the blades often contained within a cage, Figure 1-2. These fans are typically floor-standing or wall-mounted and rely on blade speed to move large volumes of air. Because of the smaller diameter, the displaced air tends to be channeled in a high velocity column in front of the fan. * Photo courtesy of Macro-Air Technologies Inc, Photo courtesy of Schaefer Ventilation Equipment, Versa Kool Model VS36VKWO-B, Kool. 1
21 2 BACKGROUND The usage of HVLS fans has predated any detailed exploration of the unique and potentially detrimental effect on ceiling level sprinkler protection. Consequently, neither FM Global Property Loss Prevention Data Sheets nor National Fire Protection Association Standard 13, Standard for the Installation of Sprinkler System, [2] contain specific installation recommendations or requirements for HVLS fans. In 29, a cooperative research project was conducted to evaluate the impact of HVLS fans on the protection provided by ceiling level sprinklers. Titled HVLS Fans and Sprinkler Operations Phase 1 Research Program, the project was funded by the Property Insurance Research Group (PIRG) * and directed through the National Fire Protection Association (NFPA) Fire Protection Research Foundation (FPRF) [3]. A technical panel oversight committee included FM Global Research staff, industry experts, consultants and sprinkler association members. Schirmer Engineering Corp. was retained to coordinate the testing and prepare a final project report. The objectives of Phase 1 were to investigate the impact of an HVLS fan on a ceiling level sprinkler system due to 1) obstruction of the sprinkler discharge pattern, and 2) air-flow generated by the fan. The approach included Actual Delivered Density (ADD) testing to determine the effect of fan size and location on the obstruction severity and large-scale testing to evaluate the effect on sprinkler protection in a real-world application. Actual Delivered Density (ADD) tests were conducted at Southwest Research Institute (SwRI) in San Antonio, Texas. The intent was to compare the quantity of discharged water that would reach the top of a test array from an unobstructed sprinkler system versus a sprinkler system obstructed by various static fans. While it was ultimately concluded that no quantifiable information regarding the obstruction provided by an HVLS fan could be provided by ADD testing, observations suggested that the fan alone did not substantially obstruct the sprinkler discharge. * PIRG is comprised of several domestic and international property insurance companies with the goal of acquiring general knowledge for issues spanning the property insurance industry. Participation is voluntary and projects are funded by an annual fee from PIRG members. 2
22 Two large-scale tests were conducted at Underwriters Laboratories located in Northbrook, Illinois. Both tests consisted of 6.1 m (2 ft) tall rack storage of cartoned unexpanded plastic (CUP) commodity under a 9.1 m (3 ft) ceiling. Protection was provided by quick-response pendent sprinklers having a K-Factor of 22 L/min/psi 1/2 (14 gpm/psi 1/2 ) on 3. x 3. m (1 x 1 ft) spacing. The fan location was varied between the tests, such that either the blade tips or fan hub was located over ignition. It was found that having the fan hub over ignition was the worstcase scenario, resulting in 8 sprinkler operations that controlled the fire. Under the conditions of the Phase 1 large-scale testing it was concluded that the presence of an operating HVLS fan does not significantly hinder ceiling level sprinkler protection. However, it is important to note that ignition for these tests was centered within the array; an evaluation with the ignition offset within the central transverse flue was not conducted. In addition, the protection requirements contained in FM Global Property Loss Prevention Data Sheet 8-9 [4] allow ceiling-only sprinkler protection for this sprinkler up to 12.2 m (4 ft), which would potentially increase the fire challenge. FM Global participated as a member of the project technical panel for Phase 1 of this project. For reference, eight other large-scale fire tests have been conducted to evaluate the effect of HVLS fans. These tests were sponsored by either XL Global Asset Protection Service (XL Gaps) or Big Ass Fans Corp. and comprise the remainder of all known tests using HVLS fans. A table detailing the setup and results of these tests was included in the PIRG proposal for this project [5], prepared by Schirmer Engineering Corporation, and reproduced in Appendix H of this report. Test configurations for this prior work included rack and solid pile storage arrays of CUP or Class 2 commodity, with a nominal height of 4.6 m (15 ft), under a nominal 7.6 m (25 ft) ceiling height. Sprinkler protection was provided by either standard-response sprinklers having a K-Factor of 81 L/min/psi 1/2 (5.6 gpm/psi 1/2 ) or 161 L/min/psi 1/2 (11.2 gpm/psi 1/2 ), or quickresponse sprinklers having a K-Factor of 22 L/min/psi 1/2 (14 gpm/psi 1/2 ). Link ratings were either 71 or 141 o C (16 or 286 o F). Fan size ranged from 6.1 to 7.3 m (2 to 24 ft) diameter with operating speeds from 24 to 63 rpm. The fan operation procedure also varied from being on for 3
23 the entire test, shut down at first sprinkler operation, or shut down due to advance smoke detection. Of particular interest was the test labeled as XL Gaps 27 Test 1. This test consisted of 4.6 m (15 ft) tall CUP commodity in a palletized solid pile open array under a 7.6 m (25 ft) high ceiling. Protection was provided by standard-response upright sprinklers having a K-Factor of 161 L/min/psi 1/2 (11.2 gpm/psi 1/2 ) and a link rating of 141 o C (286 o F) on 2.4 x 3. m (8 x 1 ft) spacing. The configuration was based on UL 199, Standard for Automatic Sprinklers for Fire Protection Service [6]. The fan was operating at 24 rpm (approximately 5% of full speed) and was shut down upon first sprinkler operation. A significant disturbance to the ceiling gas layer and fire plume was observed due to the fan, delaying the initial sprinkler operations. At 8 min after ignition, the test was terminated with a total of 73 sprinkler operations and commodity damage extending to the extremities of the array. Due to concerns raised from this outcome, this test was repeated by Underwriter s Laboratories in December 21 and will be reported in the overall Phase 2 Test report to be issued by the Property Insurance Research Group in
24 3 REPORT SCOPE AND RATIONAL This report contains the setup, results and conclusions for the large-scale fire tests conducted by FM Global, as detailed in the Phase 2 proposal by Schirmer Engineering [5]. A total of four large-scale fire tests was conducted focusing on protection of Cartoned Unexpanded Plastic (CUP) commodity with pendent, quick-response, sprinklers having a K-factor of 22 L/min/bar ½ (14 gpm/psi ½ ). A ceiling height of 12.2 m (4 ft) was selected to be consistent with the maximum ceiling height allowed in FM Global Data Sheet 8-9, using ceiling-only protection [4]. Three tests were initially included in the Phase 2 proposal using the highest storage height possible of 9.1 m (3 ft). The first two tests were intended to establish the worst-case ignition location, under-one or among-four sprinklers, with the fan operating at full speed for the entire test. Unacceptable performance would result in a re-test, except with the fan shut down after first sprinkler operation to simulate a water flow alarm. It is important to note that ignition between two sprinklers was not possible due to an interference between the sprinkler pipes and the desired fan location for the typical test array orientation used by FM Global. A fourth test was later added using a reduced storage height of 4.6 m (15 ft) to evaluate the sprinkler system performance for a high clearance storage scenario. This test was deemed necessary because the operating fan caused a considerable disturbance of the fire plume, particularly above the array, during the initial three tests. Therefore, the effect of an increased clearance above the array was addressed. Detailed measurements of the vertical air-flow velocity above the ignition bay were also recorded during each fire test. These measurements were acquired to quantify the magnitude and direction of air-flow generated by the fan. Corresponding measurements also were made at several elevations within the array with only the fan operating. These measurements established the air flow penetration through the array. 5
 located in the Fire Technology Laboratory at the FM Global")
25 4 TEST CONDITIONS AND PROCEDURES 4.1 LARGE BURN LABORATORY The tests for this program were conducted under the south movable ceiling in the Large Burn Laboratory (LBL) located in the Fire Technology Laboratory at the FM Global Research Campus in West Glocester, Rhode Island, USA. Figure 4-1 is a plan view of the LBL showing the north movable ceiling, the south movable ceiling, and the 2-MW Calorimeter. The air emission control system (AECS) exhaust ducting for each movable ceiling consists of four extraction points, located at the lab ceiling, that merge into a single duct with a cross sectional area of 6.1 m 2 (66 ft 2 ). Gas concentration, velocity, temperature and moisture measurements are made downstream of the manifold. Beyond the measurement location, the exhaust duct connects to a wet electrostatic precipitator (WESP) prior to the gases venting to the atmosphere. The movable ceilings measure 24.4 x 24.4 m (8 x 8 ft) and are adjustable for heights above the floor ranging from 3.1 to 18.3 m (1 to 6 ft). All tests were conducted at an exhaust rate of 94 m 3 /s (2, ft 3 /min). Figure 4-1: Illustration of FM Global Large Burn Laboratory test locations 6
, made by rigid crystalline polystyrene cups (empty,.47 L, 16 oz.) packaged in single-wall, corrugated paper cartons.")
26 4.2 TEST COMMODITY Four rack storage fire tests were conducted using the FM Global Standard Plastic test commodity. This commodity consists of a Cartoned Group A Unexpanded Plastic (CUP), made by rigid crystalline polystyrene cups (empty,.47 L, 16 oz.) packaged in single-wall, corrugated paper cartons. Cups are individually compartmentalized with corrugated paper partitions, and are arranged in five layers, with 25 cups per layer, to result in 125 per carton. Eight.53-m (21-in.) cube cartons, arranged 2 x 2 x 2, form a pallet load. Overall, the cube unit measures 1.7 m (42 in.) on the outside, and is supported on an ordinary, two-way, slatted deck, hardwood pallet, measuring 1.7 m x 1.7 m x 127 mm (42 x 42 x 5 in.). The total chemical energy for a pallet of the CUP commodity is nominally 1,43 MJ, based on the above masses and the heat of combustion for each material [7] *. A photo of the CUP commodity is provided in Figure 4-2. Figure 4-2: Photo of cartoned unexpanded plastic (CUP) commodity The main fuel array consisted of an open-frame, double-row steel rack erected directly on the floor, as shown in Figure 4-3. Each level of the array contained a total of 32 pallet loads of CUP commodity. The array dimensions measure approximately 1.1 m wide x 2.3 m deep (~33 ft x 7.5 ft) in an 8 wide x 2 deep arrangement, Figure 4-4. Single-row target arrays contained six pallet loads of the same commodity across a 1.2 m (4 ft) aisle to the east and west of the main array. Overall the target arrays measured approximately 7.5 m wide x 1.2 m deep (24.5 ft x * The heat of combustion for each material was multiplied by the mass of the material within a commodity. The referenced heat of combustion for each of the materials are: 12.4 kj/g (pallet), 14.4 kj/g (corrugated board, partitions), and 27.5 kj/g (unexpanded plastic). 7
 high array.")
27 3¼ ft). For Tests 1-3, a six pallet load high configuration was used, resulting in an approximate 9.1 m (3 ft) high array. For Test 4, a three pallet load high configuration was used, resulting in an approximate 4.6 m (15 ft) high array. The rack storage arrays were oriented perpendicular to the sprinkler pipes, which run east-west across the ceiling. For all tests, the ceiling height was set at 12.2 m (4 ft) allowing for a minimum 3.1 m (1 ft) clearance between the ceiling and the top of the array. This clearance is different from FM Global s standard clearance for an among-four sprinklers ignition of 1.5 m (5 ft) with the added clearance being necessary to satisfy the fan and sprinkler installation requirements. Specifically, the fan manufacturer requires a minimum installation clearance of.9 m (3 ft) between the fan blades and the ceiling. Both FM Global Property Loss Prevention Data Sheet 2- [8] and NFPA 13 [2] require a minimum.9 m (3 ft) clearance between any obstruction and the stored commodity. The sum of these requirements results in a minimum 1.8 m (6 ft) clearance, which was rounded to the nearest 1.5 m (5 ft) increment, i.e., 3.1 m (1 ft). Figure 4-3: Typical rack storage array of standard plastic commodity 8
 and is an FM Approved, pendent-type, sprinkler with a nominal 18 mm (.7 in.")

28 1.2m Ignition Location 1.2m Figure 4-4: Plan view of main and target arrays 4.3 AUTOMATIC SPRINKLER PROTECTION For each test, the Tyco Fire Products (TYCO) TY6226 sprinkler was used. The sprinkler has a nominal K-Factor of 22 L/min/bar ½ (14 gpm/psi ½ ) and is an FM Approved, pendent-type, sprinkler with a nominal 18 mm (.7 in.) diameter orifice and 71 o C (16 o F) temperature rating. The actuation mechanism was rated at a nominal RTI of 27.6 m ½ s ½ (5 ft ½ s ½ ). Consistent with FM Global standard procedures for a large-scale fire test, each sprinkler was oriented with the sprinkler frame arms parallel to the sprinkler pipe and the sprinkler s heat sensing link facing towards the north. Figure 4-5: Tyco TY6226 photos 9
 of gasoline and sealed in a plastic bag, Figure 4-6. The igniters were placed in an offset ignition orientation, which is located.")
29 4.4 IGNITION Ignition was achieved with two FM Global standard half igniters, which are 76 x 76 mm (3 x 3 in.) cylinders of rolled cellu-cotton. Each igniter is soaked in 118 ml (4 oz.) of gasoline and sealed in a plastic bag, Figure 4-6. The igniters were placed in an offset ignition orientation, which is located.6 m (2 ft) east of center, in the center transverse flue, between the uprights, of the eastern row of the main array. The igniters were lit with a flaming propane torch at the start of each test and the fires were allowed to develop naturally. Figure 4-6: Igniters within the rack, located at the rack uprights 4.5 HIGH VOLUME LOW SPEED FAN Fan Specifications MacroAir Technologies donated two MaxAir MA24XL26 fans. This fan is a six blade design with an overall diameter of 7.3 m (24 ft). Consistent with previous testing [3], the fan was mounted with the blades 127 cm (5 in.) below the ceiling. The supplied motor was contained in a NEMA-1 * enclosure and provided 1.5 kw (2 HP). Based on the manufacturer specifications, air displacement of 175 m 3 /s (37, cfm) is achieved at the maximum speed of 65 rpm. However, validation testing under the installation conditions of this project resulted in a maximum operating speed of 66 rpm. A complete listing of specifications can be found in Appendix G. * The National American Electrical Association designates NEMA-1 enclosures for general-purpose use indoors and under normal atmospheric conditions. These enclosures protect against dust, light, and indirect splashing but are not dust-tight. 1
30 4.5.2 Fan Operation During Fire Tests During Tests 1 and 2, the HVLS fan was operating at the maximum speed of 66 rpm for the entire test to represent the greatest influence on the performance of ceiling level sprinkler protection. For Tests 3 and 4, the fan was shut down 1 min and 3 s after first sprinkler operation. This sequence, which is consistent with the water flow alarm requirement in NFPA 72 [9], established the benefit of fan shut-down. 4.6 TEST CONFIGURATION OVERVIEW The configurations for Tests 1-4 are shown in Figure 4-7. For Test 1, the main array was centered below one sprinkler and the fan was offset 2.2 m (7.1 ft) to the northeast. For Tests 2-4, the main array was centered among four sprinklers and the fan was nominally centered * over the main array. Sprinklers were installed on 3. x 3. m (1 x 1 ft) spacing. To fit within the extent of the ceiling, a total of 49 sprinklers were installed for Test 1 and 64 sprinklers were installed for Tests 2 4. For consistency with common installation practices and manufacturer recommendations, the HVLS fans were always centered among four sprinklers. 3m 3m 3m Test 1 Configuration 3m Test 2-4 Configurations Figure 4-7: Sprinkler layout for Tests 1 4 * The actual fan placement was offset.3 m (1 ft) northeast of the ceiling center due to the presence of the instrumentation used to acquire ceiling steel temperatures. 11
31 4.7 DOCUMENTATION AND INSTRUMENTATION Documentation for each test included video, still photography *, and audio recordings of the visual observations made during the test. The video documentation included three standard definition digital video cameras, one high definition video camera, and an infrared (IR) camera for qualitative assessments of the fire. The three standard definition digital video cameras provided a view of the test from the northeast (main camera) and of both aisle spaces (remote cameras 1 and 2). The high definition and IR camera were located adjacent to the main camera. Environmental conditions, including relative humidity, dry-bulb temperature, and wet-bulb temperature of the air inside and outside of the lab, were measured just prior to each test as well as continually during each test. In addition, the following standard instrumentation was installed: - Sprinkler protection was provided at up to 64 locations at the ceiling, as described in Section 4.6. Each sprinkler had its operating mechanism included in an electric circuit to determine operation times. - Bare-bead,.8 mm (2-gage), chromel-alumel thermocouples, placed 165 mm (6-1/2 in.) below the ceiling at 125 locations. These thermocouples have been shown to have a response time index (RTI) of 8 ± 1 m 1/2 s 1/2 (14.5 ± 1.8 ft 1/2 s 1/2 ). See Appendix A for specific thermocouple locations. - Bi-directional probes to measure plume velocity immediately below the ceiling. Probes were located at four orthogonal locations with radial distances from the ceiling center of 2.1 and 4. m (7 and 13 ft) [at.1 m (.4 ft) below the ceiling], and 1.4 m (34 ft) [at.5 m (1.5 ft) below the ceiling]. - Thermocouples imbedded in a cross-shaped steel angle, made from two 5.8 mm wide x.6 m long x 6.35 mm thick (2 in. x 2 ft x.25 in.) angle iron segments, attached to the center of the ceiling. Measurements from these thermocouples are referred to as steel temperatures. - Flow meters and pressure controllers to monitor and control the sprinkler system. * Photos from individual tests are not provided in this report, but have been archived for future reference. 12
32 - Gas analyzers to measure the generation of carbon dioxide (CO 2 ), carbon monoxide (CO), total hydrocarbons (THC) from the fire and captured in the exhaust, and the depletion of oxygen (O 2 ) in the test space. Additional instruments were also installed for this project to measure the air flow immediately above the ignition bay of the main array generated by the building exhaust system and the HVLS fan. A complete description of these instruments is included in Section AIR-FLOW MEASUREMENTS Air-Flow Measurements at Top of the Main Array Air-flow velocities were measured continually at 15 locations 12.7 cm (5 in.) above the top of the main array, surrounding the ignition bay. As shown in Figure 4-8, the measurement locations were separated into three groups: W1 W5 were 7.6 cm (3 in.) from the main array commodity in the west aisle, C1 C5 were centered above the longitudinal flue, and E1 E5 were 7.6 cm (3 in.) from the main array commodity in the east aisle. Each measurement was derived from the combination of a vertically oriented 19 mm (¾ in.) diameter bidirectional probe and a 2-gage exposed bead thermocouple [1], Figure 4-9. The bidirectional probes were connected to Setra Model 2641R25WB2DT1F pressure transducers, which have a range of ± 62.5 Pa (.25 in. H 2 ) and a.25% accuracy. This method is consistent with FM Global Large Burn Lab practices for near-ceiling gas velocities and the method described by Ingason [11] for fire plume gas velocities within a rack storage array. Only vertical measurements were taken, since bidirectional probes have an angular insensitivity up to 5 degrees. Measurements were taken under two conditions: 1) with only the fan operating, i.e. no fire and 2) with the fan operating during the fire test. These are referred to as cold flow and fire test measurements in this report, respectively. 13

33 W5 C5 E5 Ignition Location W4 C4 E4 W3 C3 E3 W2 C2 E2 W1 C1 E1 Figure 4-8: Plan view of air-flow measurement instrumentation layout Figure 4-9: Top view of air-flow instrumentation design Air-Flow Measurements within Main Array Additional air-flow velocity measurements were acquired at six elevations within the array with only the fan operating, i.e., no fire. These are referred to as Cold Flow measurements in this report. As shown in Figure 4-1, the selected elevations were 12.7 mm (5 in.) above the commodity at tiers one through five and 15.2 mm (6 in.) above the floor. At each elevation, 15 measurements were acquired to correspond with the locations shown in Figure 4-8, resulting in an additional 9 locations for a six-tier high array and 45 locations for a three-tier-high array. Consistent with the air-flow measurements taken above the top of the array, detailed in Section 4.8.1, the measurement locations were separated into three groups per elevation. Group W1 W5 were 7.6 cm (3 in.) from the main array commodity in the west aisle, C1 C5 were centered within the longitudinal flue, and E1 E5 were 7.6 cm (3 in.) from the main array commodity in the east aisle. At each location data were acquired for five minutes. 14
34 Ceiling 4'-2" Ceiling 1.27m (Distance below ceiling) 6'-11" (Distance below ceiling) 2.1m Level 7 (-1.5 ft) Permanently installed Level 7 (-3.2 m) Permanently installed Level 6 (-15.5 ft) Level 6 (-4.72 m) Level 5 (-2.5 ft) 4'-" Level 5 (-6.25 m) 12.2m Level 4 (-25.5 ft) Level 3 (-3.5 ft) Bidirectional Probe Location Level 4 (-7.77 m) Level 3 (-9.3 m) Bidirectional Probe Location Level 2 (-35.5 ft) Level 1 (-39.5 ft) Floor 6" 7" 6" 3" English Units 3'-6" 1'-1" 5" 5'-".15m Level 2 (-1.8 m).18m.33m.8m 1.7m 1.52m Level 1.15m.13m (-12. ft) Floor Metric Units Figure 4-1: Supplementary air-flow measurements within main array for Tests 2 and 3 configuration (English and metric units) Selection of pressure transducer range The velocity of a gas flow can be calculated using the combination of a bidirectional probe and thermocouple [12], as V. 7 T P Eq. 1 where V is the gas velocity in m/s, T is the gas temperature in K, and P is the bidirectional probe pressure differential in Pa. One can first consider the maximum and minimum pressure transducer range for a fan operating under ambient conditions. From an HVLS fan manufacturer s website [13], the average air velocity 5.5 m (18 ft) away from a 7.3 m (24 ft) diameter fan is 3. m/s (9.8 ft/s). Assuming the peak air velocity is nominally 5% greater, or 9 m/s, the maximum pressure differential is calculated as 9 m / s P fan _ max / 3 K 55 Pa
35 The standard range of Setra bidirectional pressures transducers are: ± 25 to ± 25 Pa at.25% accuracy (±.1 to ± 1 in H 2 O). Using the maximum predicted pressure range of 55 Pa, the selected transducer range was ± 62.5 Pa. This provided an accuracy of ±.16 Pa (6.4 x 1-4 in. H 2 O), i.e., 62.5* SPRINKLER SYSTEM PERFORMANCE CRITERIA Assessment of the system performance was based on the current standard FM Global evaluation criteria for K14 ESFR pendent sprinklers [14]. The primary judgment criteria are the number of sprinkler operations, the extent of fire damage, and the magnitude and duration of steel temperatures. The magnitude of ceiling level TC measurements and total amount of energy released are also considered for comparison between tests, but are not used to evaluate sprinkler system performance Sprinkler Operations In a successful test under these conditions, the total number of sprinkler operations allowed is eight. Additionally, sprinklers along the perimeter of the test ceiling are not allowed to operate. Sprinklers operating at the ceiling perimeter indicate that high temperature gases were present to the edge of the ceiling and could have traveled further along the ceiling, operating additional sprinklers, had they been present. The operation of a sprinkler is verified three ways. First, a wire was installed onto the sprinkler link/bulb and frame, creating a circuit that is monitored. Upon operation of the sprinkler, the circuit is broken and the event is recorded by the data acquisition system. Second, select sprinklers at the ceiling core have differential pressure gauges installed in the connecting fitting. Upon operation of a sprinkler, the pressure drop created by the water flow through the open sprinkler orifice is monitored and recorded. This method is used to verify the time of operation recorded by the electrical monitoring, or can be used to determine operation time in case of a wire hang-up during the test. Finally, a post-test ceiling inspection verifies the location of all operated sprinklers and is compared with events registered by the data acquisition system. 16
36 4.9.2 Extent of Fire Damage Fire damage should be confined within the outermost transverse flues of the main array. Fire jump to the target arrays is permitted, provided the fire does not propagate to the outer faces of the targets. The fire must not display any potential for further propagation at the time of test termination Steel Temperature The maximum 1-min average allowable ceiling steel temperature is 538 o C (1, o F). This criterion is based on the assessment that structural steel loses 5-6 percent of its load-bearing strength upon reaching the 538 o C (1, o F) threshold [15,16]. The loss of strength could cause failure of the ceiling structure resulting in collapse of the roof. Additionally, the maximum instantaneous allowable ceiling steel temperature is 649 o C (1,2 o F). Ceiling temperatures in excess of these thresholds during a test are taken as an indication of ineffective fire protection. The maximum 1-min average temperature is recorded for every test Gas Temperature Ceiling level thermocouple (TC) measurements are taken at 125 locations on the ceiling, as illustrated in Appendix A. Trends in gas temperatures, as indicated by TC measurements, are analyzed for comparison purposes and to generate temperature contour plots along the ceiling. Additionally, the maximum 1-min average temperature is recorded for every test. The data are not used to evaluate the performance of the sprinkler system Total Energy Released Although time-resolved heat release rates (HRR) cannot be determined from the calorimetry data, an estimate of the total energy release during the test can be obtained. The total energy can be calculated by integrating the chemical HRR curve, calculated from mass flow rate and gas analysis data for CO and CO 2 [7]. Integration under the data curve is possible up to test termination. After the test is terminated, an exponential best fit curve of the decay portion of the test data is used to estimate the tail portion of the HRR and again integrated to provide total energy released. These two values are added to provide a value for the total energy released during the test. This value can be used to estimate the total amount of commodity consumed and 17
37 can be used as a test-to-test comparison. For error analysis, it is assumed that the total energy up to test termination has ± 1% error and the post test curve fit data have 5% error. 18
38 5 TEST RESULTS AND DATA ANALYSIS This section presents the results of the four large-scale fire tests conducted to evaluate the effect of an HVLS fan on the protection provided by a ceiling level sprinkler system. A summary of the test conditions and results is shown in Table 5-1. A more in-depth description of the test setup can be found in Table i and Table ii of the Executive Summary. In addition, a complete analysis of each test (including time resolved data) can be found in Appendices B - E. Protection for each test was provided by quick-response, pendent sprinklers, having a 71 o C (16 o F) rated link and a K-Factor of 22 L/min/bar 1/2 (14 gpm/psi 1/2 ). Sprinklers were installed on 3. x 3. m spacing (1 x 1 ft) to provide a 48.9 mm/min (1.2 gpm/ft 2 ) density at 5.2 bar (75 psi) over the protected area. The ceiling was set at a height of 12.2 m (4 ft) above the floor. Tests 1 and 2 were conducted to evaluate the expected worst-case placement of the HVLS fan. For Test 1, the main array was centered below one sprinkler and the fan was offset 2.2 m (7.1 ft) to the northeast. A total of 12 sprinklers operated with the first operation occurring at 1 min 28 s after ignition. Fire spread remained within the confines of the test array; however, extensive damage occurred on both the east and west rows of the main array and the aisle face of both the east and west target arrays. For Test 2, the main array was centered among four sprinklers and the fan was centered * over the main array. A total of 12 sprinklers operated with the first operation occurring at 1 min 42 s after ignition. Fire spread remained within the confines of the main array with damage primarily sustained on the eastern row; however, there was extensive damage to the commodity on the backside of the east target array. Both tests exceeded the evaluation criterion for the allowable number of sprinkler operations (Section 4.9.1). Test 2 additionally exceeded the extent of damage criterion (Section 4.9.2) and, therefore, was considered the worst-case configuration. Test 3 was conducted to evaluate the effect of fan shut down. The configuration was identical to Test 2, except the fan was shut off 1 min 3 s after first sprinkler operation, simulating triggering * The actual fan placement was offset.3 m (1 ft) northeast of the ceiling center due to the presence of the instrumentation used to acquire ceiling steel temperatures. 19
39 from a water flow alarm. A total of four sprinklers operated with the first operation occurring at 1 min 54 s after ignition. Fire spread remained within the confines of the main array, with damage primarily sustained on the eastern row and minimal damage on the aisle face of the east target array. These results are within the specified levels (Section 4.9) and indicate that fan shut down can allow the sprinkler system to perform acceptably under these conditions. Test 4 was conducted to evaluate the effect of a high clearance between the top of the stored commodity and the ceiling. The general test configuration was consistent with Tests 2 and 3, except a lower storage height of 4.6 m (15 ft) resulted in a 7.6 m (25 ft) clearance. A total of 4 sprinklers operated with the first operation occurring at 1 min 39 s after ignition and the final occurring at 1 min 42 s after ignition. The fan was shut off 1 min 3 s after first sprinkler operation; all sprinkler operations had occurred by this time. Fire damage was limited to the main array, with no jump to either target array. Table 5-1: Summary of test setup and results Configuration and Results Test 1 Test 2 Test 3 Test 4 Detailed Analysis, Appendix B C D E Test Configuration Commodity Cartoned Unexpanded Plastic (CUP), Double Row Rack Storage Commodity / Ceiling Height [m (ft)] 9.1 / 12.2 (3 / 4) 9.1 / 12.2 (3 / 4) 9.1 / 12.2 (3 / 4) 4.6 / 12.2 (15 / 4) Main Array Located Below number of sprinklers Fan Operation Full speed, Entire test Full speed, Off at 9s Test Results Sprinklers Operations Total Energy [MJ (BTU x 1 3 )] 18, ± 2 (17, ± 3,4) 7,5 ± 1,1 (7,1 ± 1,) 3,5 ± 5 (3,3 ± 5) 75 ± 1 (7 ± 1) Consumed Commodity [pallet load equivalent] Target Jump Time [min:s] East, 3:9 West, 5:5 East, 2:13 West, no East, 3: West, no East, no West, no Maximum One-Minute Steel Temperature [ o C ( o F)] 76 5: : : :46 Maximum One-Minute TC Measurement [ o C ( o F)] 293 4: : : :42 Test Termination [min:s] 35: 25: 3: 3: To allow for a meaningful comparison of total energy generated, tests were conducted until the fire was largely extinguished (only minimal lingering fire remained) by the sprinkler system. 2
40 5.1 SPRINKLER OPERATION PATTERNS A plan view of the sprinkler operation pattern for each test is presented in Figure 5-1. The location of the test array and the HVLS fan are included for reference. A total of 12 sprinklers operated in Tests 1 and 2, and a total of four sprinklers operated in Tests 3 and 4. 3:26 3:32 1:42 2:13 3:57 3:25 7:53 5:45 1:28 3:21 4:47 1:52 2:2 3:34 3:9* 5:2 3:56 4:48 4:32 2:52 3:27 3:22 3:33 3:34 *operation not identified by digital channel Test 1 Test 2 2:2 2:3 1:39 1:41 1:54 1:55 1:42 1:42 Test 3 Test 4 Figure 5-1: Sprinkler operation pattern for Tests
41 Total Integrated Energy (MW) FM Global 5.2 TOTAL ENERGY Figure 5-2 presents the total integrated energy produced during Tests 1-4. The presented data are based on the generation rates of carbon dioxide and carbon monoxide as described in Section To allow for a meaningful comparison, each test was conducted until the fire was largely extinguished by the sprinkler system with only small lingering fires remaining. Therefore, the actual duration varies between tests. The estimated total energy for each test was 18, ± 2, MJ (17, ± 3,4 BTU x 1 3 ) for Test 1, 7,5 ± 1,1 MJ (7,1 ± 1, BTU x 1 3 ) for Test 2, 3,5 ± 5 MJ (3,3 ± 5 BTU x 1 3 ), and 75 ± 1 MJ (7 ± 1 BTU x 1 3 ) for Test 4. The total energy only reflects the quantity of consumed commodity, not the performance of the sprinkler system. Performance of the sprinkler system is based on the evaluation criteria detailed in Section 4.9. For instance, the total commodity consumed was greatest in Test 1, while the negative impact on the sprinkler performance was greatest in Test 2 (based on the potential for fire propagation beyond the test array) Test 1 Test 2 Test 3 Test 4 Test 1 6 Test 2 Test 3 Test Figure 5-2: Total integrated energy for Tests 1-4 Note that the above graph only includes total energy collected during the fire test. As discussed in Section 4.9.5, the total energy released for each test also includes an estimation of the combustions gases remaining in the laboratory space after the test is terminated. 22
42 5.3 CEILING GAS CENTROID AT FIRST SPRINKLER OPERATION Figure 5-3 presents the ceiling TC measurement contours at first sprinkler operation and the corresponding location of the ceiling gas centroid *, for Tests 1-4. Note that the circle towards the center of the figure (noted by inverted colors) indicates the fan location. The time evolution of the two coordinates of the ceiling gas centroid for each test can be found in Appendices B through E. The departure of the ceiling gas centroid from the ignition location suggests the operating HVLS fan disturbed the fire plume above the stored commodity. For example, the ceiling gas centroid coordinates at first sprinkler operation for Test 1 were 1.3 m south x 2. m west (4.3 ft south x 6.6 ft west). This is coincides with the approximate center of the peak TC measurement contours shown in Figure 5-3. Without the fan the ceiling gas centroid would be nominally centered over the ignition location for this test arrangement. * Centroid refers to the geometric center of the ceiling gas layer produced by the fire, based on summation of normalized magnitude of ceiling TC measurements weighted by location. The position of the centroid is a measure of the axis of the fire plume above the test array. 23
43 Test 1 [Centroid coordinates: 1.3 m south x 2. m west] Test 2 [Centroid coordinates:.7 m north x 1.3 m west] Test 3 [Centroid coordinates:.8 m south x.3 m west] Test 4 [Centroid coordinates:.8 m south x 1.1 m west] Figure 5-3: Contour plots of ceiling TC measurements at first sprinkler operation for Tests
44 5.4 CEILING AIR-FLOW STABILIZATION Figure 5-4 presents the ceiling level air velocities under three conditions for Test 1: 1) ambient lab conditions, 2) with only the building control system exhaust fan operating at 94 m 3 /s (2, cfm), and 3) with the addition of the HVLS fan operating at full speed (66 rpm). Air velocities were measured using bidirectional probes mounted at four orthogonal locations at a radial distance of 2.1, 4. and ~1.4 m (7, 13, and ~34 ft) from the ceiling center as described in Section 4.7. As shown, positive values indicate air flow outward from the ceiling center and negative values indicate inward flow. Under ambient lab conditions, the air flow across the ceiling is minimal with the greatest velocity of ±.25 m/s (.8 ft/s) occurring at the outermost measurement locations of 12.2 m (4 ft). The range of measured flows decreased to ±.15 m/s (.5 ft/s) for the 4. m (13.1 ft) and 1.2 m (4 ft) measurement locations. The inclusion of the building control system exhaust fan at -78 s resulted in a negligible change in the air flow. However, the addition of the HVLS fan at -3 s resulted in a significant increase in the air flow at the ceiling, with the disturbance decreasing with distance from the fan. The specific air velocities ranged from -2.9 to 1.1 m/s at a radial distance of 2.4 m (8 ft), -2.1 to -.8 m/s at a radial distance of 4. m (13.1 ft) and -.3 to.6 m/s at a radial distance of approximately 1.4 m (34 ft). Similar results were found for Tests 2-4. These results indicate that the air flow generated by the HVLS has the dominant influence on the ceiling level gas flow prior to the fire. 25
45 Ceiling Air Flow Velocity (m/s) Ceiling Air Flow Velocity (m/s) Ceiling Air Flow Velocity (m/s) FM Global ambient lab conditions exhaust fan operating HVLS fan operating m North 2.4 m East 2.4 m West 2.4 m South ambient lab conditions exhaust fan operating HVLS fan operating m North 4. m East 4. m West 4. m South ambient lab conditions exhaust fan operating HVLS fan operating m North 1.7 m East 1.7 m West 1.4 m South Figure 5-4: Ceiling level air flow resulting from building exhaust only for Test 1 26
46 5.5 COLD FLOW AIR VELOCITY AT ARRAY TOP Table 5-2 presents the average air velocities measured at 12.7 cm (5 in.) above the top of the main array, as described in Section 4.8, for Tests 1-4. Air velocities were measured continually at 15 locations that were 13 cm (5 in.) above the top of the main array, surrounding the ignition bay. The measurement locations were separated into three groups: W1 W5 were 7.6 cm (3 in.) out from the main array commodity in the west aisle, C1 C5 were centered above the longitudinal flue, and E1 E5 were 7.6 cm (3 in.) out from the main array commodity in the east aisle. Figure 5-5 through Figure 5-8 illustrate the data present in Table 5-2. A plan view schematic of the measurement locations relative to the array and the fan is included for reference. As shown, positive values indicate upward flow and negative values indicate downward flow. Each value, which represents an average over a minimum 3-minute duration, was acquired with only the fan operating, i.e., no fire or exhaust air. As discussed in Section 4.8.1, these are referred to as cold flow measurements in this report. For Test 1, where the fan was offset from the array center, the maximum downward velocity was -4.6 m/s (-15.1 ft/s). Consistent with typical fan air flow, the higher velocities were generally experienced around 5% of the fan blade length. This resulted in higher velocities in the eastern aisle space than in the western aisle space. For the array configuration used in Tests 2 and 3, where the fan was centered over the array, the maximum downward velocity decreased to -3.5 m/s (-11.5 ft/s) and was more evenly distributed between the eastern and western aisle. The decrease can be attributed to the close proximity of the measurement locations to the fan hub, where the fan blades are less efficient. Note that the configuration of Tests 2 and 3 was identical; therefore, cold flow data were only acquired for Test 2. Test 4 was conducted with the same configuration used in Tests 2 and 3, except the array height was reduced to 4.6 m (15 ft) resulting in a 7.6 m (25 ft) clearance to the ceiling. Measurements were acquired with the fan operating at both full speed (66 rpm) and half speed (33 rpm). With the fan operating at full speed, the air velocities at the top of the array are similar to those experienced with the higher array used in Tests 2 and 3. The maximum downward velocity of 27
47 -3.1 m/s (-1.2 ft/s) was measured at the farthest radial distance from the fan hub. This value is within ~1% peak velocity measured during Tests 2 and 3, and indicates that the air velocity did not substantially decrease with the increased clearance. Operating the fan at half speed significantly decreased the air flow, with a maximum downward velocity of -1.3 m/s (-4.3 ft/s) and an average velocity of approximately -.5 m/s (-1.6 ft/s). This range represents a 6% reduction in the peak air velocity. 28
48 Table 5-2: Average cold flow air velocities at top of array for Tests 1 4 [negative velocities indicate downward air flow] Coordinates* Location Test 1 Tests 2 and 3 Test 4 [x,y] Identifier m (ft) m/s (ft/s) m/s (ft/s) m/s (ft/s) W5-1.2, (-4, 4) (-5.9) (-9.5) (-8.5) (-3.6) W4-1.2, (-4, 2) (-12.5) (-8.2) (-5.9) (-2.) W3-1.2, (-4, ) (-13.5) (-1.2) (-7.2) (-1.6) W2-1.2, (-4, -2) (-8.5) (-1.8) (-6.2) (-1.) W1-1.2, (-4, -4) (-1.6) (-11.5) (-1.2) (-2.6) C5, (, 4) (-9.8) (-4.6) (-7.2) (-3.) C4, (, 2) (-6.6) (-2.) (-4.3) (-1.6) C3, (, ) (-13.8) (-4.3) (-4.9) (-1.) C2, (, -2) (-15.1) (-3.9) (-3.6) (.1) C1, (, -4) (-5.6) (-8.2) (-3.9) (-1.3) E5 1.2, (4, 4) (-8.5) (-9.8) (-9.8) (-4.3) E4 1.2, (4, 2) (-8.9) (-6.6) (-5.9) (-2.6) E3 1.2, (4, ) (-9.8) (-3.9) (-5.6) (-2.3) E2 1.2, (4, -2) (-1.2) (-8.9) (-5.6) (-2.) E1 1.2, (4, -4) (-13.8) (-1.8) (-7.9) (-3.) Array height m (3 ft) 9.1 m (3 ft) 4.6 m ( 15 ft) Fan Speed - 66 rpm 66 rpm 66 rpm 33 rpm * Coordinates are relative to the ceiling center (note that the main array was centered below the ceiling) The configuration for Tests 2 and 3 were identical; therefore, cold flow data were only acquired for Test 2 29
49 Air Velocity (m/s) Air Velocity (m/s) FM Global W5 C5 E5 1 W4 C4 E4 W3 C3 E3-1 W2 C2 E2-2 W1 C1 E W C West - East E South - North Figure 5-5: Air-flow at top of array [3.2 m (1.5 ft) below ceiling] with fan operating at 66 rpm for Test W5 W4 W3 W2 W1 C5 C4 C3 C2 C1 E5 E4 E3 E2 E W C West - East E South - North Figure 5-6: Air-flow at top of array [3.2 m (1.5 ft) below ceiling] with fan operating at 66 rpm for Tests 2 and 3 3
 below ceiling] with fan operating at 66 rpm for Test 4 5 4 3 W5 W4 W3 C5 C4 C3 E5 E4 E3 2 1-1 W2 C2 E2-2 W1 C1 E1-3 -4-5 W C E 1 2 3 4 5 Figure 5-8: Air-flow at top of array [7.")
50 Air Velocity (m/s) FM Global W5 C5 E5 W4 C4 E4 W3 C3 E3 W2 C2 E2 W1 C1 E1 Figure 5-7: Air-flow at top of array [7.8 m (25.5 ft) below ceiling] with fan operating at 66 rpm for Test W5 W4 W3 C5 C4 C3 E5 E4 E W2 C2 E2-2 W1 C1 E W C E Figure 5-8: Air-flow at top of array [7.8 m (25.5 ft) below ceiling] with fan operating at 33 rpm for Test 4 31
51 5.6 COLD FLOW AIR VELOCITY THROUGH ARRAY Table 5-3 through Table 5-6 present the average air velocities measured within the main array for Tests 1-4, as described in Section As shown, positive values indicate upward flow and negative values indicate downward flow. Each value represents a 5-minute average and was acquired with only the fan operating, i.e., no fire or exhaust air. All louvers on the external walls of the test volume and those of the dehumidification system were also closed to mitigate unwanted air movement. For reference, an overview schematic of the instrumentation locations relative to the fan was previously shown in Figure 4-8. The location of the measurement elevations was also shown in Figure 4-1 for a six-tier array. For a three-tier array, only levels one through four are used. The following analysis assumes that downward air flow velocities less than -1 m/s (3.3 ft/s) are not sufficient to notably affect fire growth. Figure 5-9 illustrates the air flow velocity data for Test 1 (Table 5-3), where the fan was offset from the main array center. These data coincide with the measurements at 15 cm (6 in.) above the array (Figure 5-5 of Section 5.5), where the air flow velocities were greatest in the eastern aisle space and weakest in the western aisle space. A peak downward air velocity of -4.5 m/s (-14.8 ft/s) was measured at the sixth level. Downward air flows greater than -1 m/s (-3.3 ft/s) penetrate to the third level in the eastern aisle and central flue, and the fourth level in the western aisle. The vertical air flow at the lowest two levels of the array was minimal; however, visual observation of the fire test indicated that the air flow at these elevations may be predominantly horizontal due to air sweeping across the floor. Additionally, observations suggest that the upward air flow measured towards the top of the array in the western aisle is due to air currents traveling down the flue spaces, across the top of the commodity, and re-circulating back into the aisle space. Figure 5-1 illustrates the air flow velocity data for Tests 2 and 3 (Table 5-4), where the fan was centered over the main array. As noted earlier, the configuration for Tests 2 and 3 were identical; therefore, data were only acquired once. Similar to the measurements at 12.7 cm (5 in.) above the array (Figure 5-6 of Section 5.5), the air flow velocities are fairly uniform at the upper levels within the array and a peak velocity of -4.2 m/s (-13.8 ft/s) was measured at the sixth level. 32
52 Downward air flows greater than -1 m/s (-3.3 ft/s) penetrated to the third level in the eastern aisle and central flue, and the fourth level in the western aisle. Interestingly, the air flow at the base of the array appears to sweep across the floor and create an updraft as high as 1 m/s (3.3 ft/s) within the central flue space. Figure 5-11 illustrates the air flow velocity data for Test 4 (Table 5-5 and Table 5-6), which was a high clearance configuration (array height of three tiers) with the fan centered over the main array. Air velocity measurements were acquired with the fan operating at full speed (66 rpm) and half speed (33 rpm) for this test configuration [data for measurement locations C2 C5 of Level 2 are not shown due to an instrumentation error]. The corresponding air flow velocity data at 12.7 cm (5 in.) above the array can be found in Section 5.5. At 66 rpm, the air flow above the second tier of the array was generally downward and had a magnitude greater than -2. m/s (-6.6 ft/s). Note that the peak downward velocity of -2.9 m/s (-9.5 ft/s) represents a 3% reduction compared to Test 2 and 3, which included a taller six-tier array. The air velocity reversed to a slightly upward flow for the lower two measurement levels with an average velocity of ~.5 m/s (1.6 ft/s) above the first tier and ~.7 m/s (2.3 ft/s) near the floor. At the lower fan operating speed of 33 rpm, the peak air flow velocities decreased significantly with magnitudes above the third measurement level of approximately -1. m/s (ft/s). The velocities decreased further for the lower two measurement levels with magnitudes of.3 m/s (1. ft/s) or less. A point of perspective on the results of the analysis of the velocity measurements is provided by previous work by Ingason [11,17], which suggests that the upward gas velocity of a fully developed fire in the flue space of a four-tier, open double-row rack storage array can be up to 1 m/s (33 ft/s) *. In those experiments the higher gas velocities were measured at the upper storage tiers and decreased towards the base of the fire, at the lower storage tiers. This suggests that while the HVLS fan displaces the ceiling gas centroid, the air flow within the array is dominated by the buoyancy of the fire. * The actual experiments were a 1:3 scale of a large-scale test, using Froude modeling, and measured an upward flue gas velocity of 6 m/s at 11 K. (Using a scaling factor of S 1/2, this value corresponds to 1 [m/s] = 3 1/2 6 [m/s]) 33
53 Table 5-3: Average cold flow air velocities through array for Test 1 (metric units) Location Coordinates Identifier [x,y] Level 1 Level 2 Level 3 Level 4 Level 5 Level 6 m m/s m/s m/s m/s m/s m/s W5-1.2, W4-1.2, W3-1.2, W2-1.2, W1-1.2, C5, C4, C3, C2, C1, E5 1.2, E4 1.2, E3 1.2, E2 1.2, E1 1.2, Average cold flow air velocities through array for Test 1 (English units) Location Coordinates Identifier [x,y] Level 1 Level 2 Level 3 Level 4 Level 5 Level 6 ft ft/s ft/s ft/s ft/s ft/s ft/s W5-4, W4-4, W3-4, W2-4, W1-4, C5, C4, C3, C2, C1, E5 4, E4 4, E3 4, E2 4, E1 4,
54 Table 5-4: Average cold flow air velocities through array for Tests 2 and 3 (metric units) Location Coordinates Identifier [x,y] Level 1 Level 2 Level 3 Level 4 Level 5 Level 6 m m/s m/s m/s m/s m/s m/s W5-1.2, W4-1.2, W3-1.2, W2-1.2, W1-1.2, C5, C4, C3, C2, C1, E5 1.2, E4 1.2, E3 1.2, E2 1.2, E1 1.2, Average cold flow air velocities through array for Tests 2 and 3 (English units) Location Coordinates Identifier [x,y] Level 1 Level 2 Level 3 Level 4 Level 5 Level 6 ft ft/s ft/s ft/s ft/s ft/s ft/s W5-4, W4-4, W3-4, W2-4, W1-4, C5, C4, C3, C2, C1, E5 4, E4 4, E3 4, E2 4, E1 4,
55 Table 5-5: Average cold flow air velocities through array for Test 4 (66 rpm) (metric units) Location Coordinates Identifier [x,y] Level 1 Level 2 Level 3 m m/s m/s m/s W5-1.2, W4-1.2, W3-1.2, W2-1.2, W1-1.2, C5, n/a -2.8 C4,.6.7 n/a -2.4 C3,.4 n/a -2.9 C2, n/a -2.2 C1, E5 1.2, E4 1.2, E3 1.2, E2 1.2, E1 1.2, No data were acquired for locations C2 through C5 due to an instrumentation error. Average cold flow air velocities through array for Test 4 (66 rpm) (English units) Location Coordinates Identifier [x,y] Level 1 Level 2 Level 3 ft ft/s ft/s ft/s W5-4, W4-4, W3-4, W2-4, W1-4, C5, n/a -9.3 C4, n/a -7.9 C3, 1.2 n/a -9.5 C2, n/a -7.4 C1, E5 4, E4 4, E3 4, E2 4, E1 4, No data were acquired for locations C2 through C5 due to an instrumentation error. 36
56 Table 5-6: Average cold flow air velocities through array for Test 4 (33 rpm) (metric units) Location Coordinates Identifier [x,y] Level 1 Level 2 Level 3 m m/s m/s m/s W5-1.2, W4-1.2, W3-1.2, W2-1.2, W1-1.2, C5, C4, C3, C2, C1, E5 1.2, E4 1.2, E3 1.2, E2 1.2, E1 1.2, Average cold flow air velocities through array for Test 4 (33 rpm) (English units) Location Coordinates Identifier [x,y] Level 1 Level 2 Level 3 ft ft/s ft/s ft/s W5-4, W4-4, W3-4, W2-4, W1-4, C5, C4, C3, C2, C1, E5 4, E4 4, E3 4, E2 4, E1 4,
57 Air Velocity (m/s) Air Velocity (m/s) Air Velocity (m/s) Air Velocity (m/s) Air Velocity (m/s) Air Velocity (m/s) FM Global Level 4.7 m (15.5 ft) below ceiling Level 6.2 m (2.5 ft) below ceiling W C West - East E South - North W C West - East E South - North Level 7.8 m (25.5 ft) below ceiling Level 9.3 m (3.5 ft) below ceiling W C West - East E South - North W C West - East E South - North Level 1.8 m (35.5 ft) below ceiling Level 12. m (39.5 ft) below ceiling W C West - East E South - North W C West - East E South - North Figure 5-9: Air velocity through array with the fan at 66 rpm for Test 1 [no fire] 38
 below ceiling 5 4 3 2 1-1 -2-3 -4-5 W C West - East E 1 2 3 4 5 South - North 5 4 3 2 1-1 -2-3 -4-5 W C West - East E 1 2 3 4 5 South - North Level 3 @ 9.3 m (3.")
58 Air Velocity (m/s) Air Velocity (m/s) Air Velocity (m/s) Air Velocity (m/s) Air Velocity (m/s) FM Global Level 4.7 m (15.5 ft) below ceiling Level 6.2 m (2.5 ft) below ceiling W C West - East E South - North W C West - East E South - North Level 9.3 m (3.5 ft) below ceiling W C West - East E South - North Level 1.8 m (35.5 ft) below ceiling Level 12. m (39.5 ft) below ceiling W C West - East E South - North W C West - East E South - North Figure 5-1: Air velocity through array with the fan at 66 rpm for Tests 2 and 3 [no fire] 39
 below ceiling 5 4 3 2 Level 3 @ 9.3 m (3.5 ft) below ceiling 1 1-1 -1-2 -2-3 -3-4 -5 W C E 1 2 3 4 5-4 -5 W C E 1 2 3 4 5 5 4 3 2 1-1 -2-3 -4-5 Level 2 @ 1.8 m (35.")
59 Air Velocity (m/s) Air Velocity (m/s) Air Velocity (m/s) Air Velocity (m/s) Air Velocity (m/s) Air Velocity (m/s) FM Global Level 9.3 m (3.5 ft) below ceiling Level 9.3 m (3.5 ft) below ceiling W C E W C E Level 1.8 m (35.5 ft) below ceiling W 2 C E Level 1.8 m (35.5 ft) below ceiling W 2 C E 1 5 Level 9.3 m (39.5 ft) below ceiling 5 Level 9.3 m (39.5 ft) below ceiling W C E W C E [Fan at 33 rpm] [Fan at 66 rpm] Figure 5-11: Air velocity through array with the fan at 33 and 66 rpm for Test 4 [no fire] 4
60 5.7 FIRE TEST AIR FLOW VELOCITY AT TOP OF ARRAY Figure 5-12 presents the air velocity measurements taken during Test 1 at the 15 locations above the top of the array over the ignition bay. Each graph contains data from the measurement locations over either the east face of the array, west face of the array, or above the longitudinal flue. As shown, negative values indicate downward air flow. A plan view schematic of the measurement locations relative to the array and the fan is included for reference. Due to an instrumentation error, data are not presented for locations C1 C3, and C5. Each graph includes air velocity measurements for three conditions: 1) only the building control system exhaust fan operating at 94 m 3 /s (2, cfm), 2) the addition of the HVLS fan operating at full speed (66 rpm), and 3) the fire development up to first sprinkler operation. It is important to note that air velocity measurements were not reliable after first sprinkler operation. As discussed in Section 4.8.3, velocity measurements require accurate measurement of the local gas temperature. Operation of a sprinkler results in unknown wetting of the thermocouple, which is typically observed as a significant drop in the calculated velocity and is evident on each graph. Similar to the cold flow measurements presented in Section 5.5, these data illustrate the strong downward air velocity generated by the fan with peak sustained velocities of over 4 m/s (13 ft/s). After ignition, the buoyant air flow from the fire plume was evident as a net reduction in the downward flow velocity. As the fire grows, the fire plume gases overcome the fan air flow as indicated by upward air velocities at locations W1 W5 and C4, which coincide with the actual location of the fire plume. Similar results were observed for Tests 2 through 4 and can be found in Appendices B through E, respectively. 41
61 5 Air Flow Velocity (m/s) Air Flow Velocity (m/s) -5-1 Stagnant Airflow HVLS fan operation Ignition 1st sprinkler activation W1 W2 W3 W4 W5 FM Global W5 C5 E5 W4 C4 E4 W3 C3 E3 W2 C2 E2 W1 C1 E Stagnant Airflow HVLS fan operation Ignition 1st sprinkler activation C1 C2 C3 C4 C Stagnant Airflow Air Flow Velocity (m/s) HVLS fan operation Ignition 1st sprinkler activation E1 E2 E3 E4 E5 Figure 5-12: Air flow velocities at top of array during Test 1 (until first sprinkler operation) 42
62 6 DISCUSSION All discussion in this report is specific to the array configurations used in the tests. The combined effects of a different array height, commodity type, ceiling height, fan diameter/blade shape and speed, etc, are yet to be understood and may not be inferred from these test results alone. 6.1 FIRE GROWTH RATE COMPARISON TESTS 2 AND 3 Two tests were conducted indicating that adequate sprinkler system performance can be established by shutting the fan down. The first test, Test 2 of this report, established that the greatest negative impact on the sprinkler system performance occurred when the HVLS fan was centered over the main array. In that test, the fan was operating at full speed for the entire test, resulting in an unacceptable number of sprinkler operations (12) and substantial damage to the backside of the east target array. A subsequent test using an identical array configuration, Test 3 of this report, evaluated the effect of fan shut down 1 min 3 s after first sprinkler operation. In that test, a total of four sprinklers operated and commodity damage was acceptable, indicating adequate sprinkler system performance. Caution must be used when concluding that fan shut down was the principal factor leading to the acceptable sprinkler system performance exhibited in Test 3. As no statistical analysis can be made from a single test, confidence in the above conclusion can be gained by comparing the initial fire development and the sprinkler operation pattern between Tests 2 and 3. This analysis is prudent despite the good repeatability of the operating sequence of the four sprinklers surrounding ignition, as shown in Section 5.1. For these tests, the typical method of comparing fire growth rates based on ceiling TC measurements is not reliable due to the high disturbance of the plume gases by the fan. However, the initial fire development can be evaluated based on observation of the fire location within the main array. As shown in Table 6-1, the fire growth leading to first sprinkler operation is very consistent for both tests. The operation times of the initial four sprinklers for each test were also very consistent. In both cases, these sprinklers surrounded the ignition location, which is desirable for an ignition among four sprinklers. 43
63 Table 6-1: Comparison of fire development for Tests 2 and 3 Observation Test 2 Test 3 (min:ss) (min:ss) Ignition : : Flames reach bottom of 2 nd tier :24 :32 Flames reach bottom of 3 rd tier :5 :44 Flames reach bottom of 4 th tier 1: :54 Flames reach bottom of 5 th tier 1:5 1:3 Flames extend above array 1:15 1:12 1 st sprinkler operation 1:42 1:54 2 nd sprinkler operation 1:52 1:55 3 rd sprinkler operation 2:2 2:2 4 th sprinkler operation 2:13 2:3 Eight additional sprinklers operated during Test 2 The fire development leading to the initial sprinkler operations in Tests 2 and 3 is further illustrated in Figure 6-1 and Figure 6-2, respectively. Each figure shows a photograph of the fire at times corresponding to first sprinkler operation in Test 2 (1 min 42 s) and Test 3 (1 min 54 s). Though there is a slight difference in the time of first sprinkler operation, 12 s, it can be seen that the fire development leading to sprinkler operation was consistent. Ceiling TC measurements can provide insight into the actual location of ceiling gases leading to the initial sprinkler operations. Figure 6-3 and Figure 6-4 present contour plots of the ceiling TC measurements for Tests 2 and 3, respectively. The times shown in each plot are consistent with first sprinkler operation in Test 2 (1 min 42 s) and Test 3 (1 min 54 s). It can be seen for both tests that at 1 min 42 s, the fire plume was similarly located northwest of the ceiling center. In the case of Test 2, this resulted in sprinkler operation of the local sprinkler. However, the corresponding temperatures were slightly lower in Test 3 and that sprinkler did not operate. The plume then moved to the south in both tests by 1 min 54 s, resulting in the operation of the local sprinklers. Considering the strong disturbance to the ceiling gases caused by the fan, the consistency in fire growth rate and the operation sequence of the first four sprinklers strongly suggests that the shut down of the fan was the driving factor in the improved performance of the sprinkler system in Test 3. 44

![operation in Test 3] Figure 6-1: Photos of](/docs-images/86/94110674/images/64-1.jpg "Test 2 operation in Test 3] Figure 6-2:")
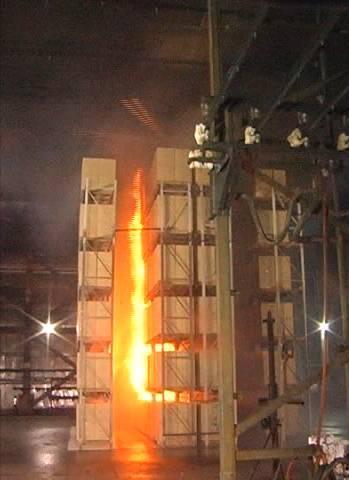
64 1 min 42 s 1 min 54 s [1 st sprinkler activation in Test 2] [1 st sprinkler operation in Test 3] Figure 6-1: Photos of Test 2 1 min 42 s 1 min 54 s [1 st sprinkler activation in Test 2] [1 st sprinkler operation in Test 3] Figure 6-2: Photos of Test 3 45
![1 min 42 s 1 min 54 s [1 st sprinkler activation in Test 2] [1 st sprinkler](/docs-images/86/94110674/images/65-0.jpg "operation in Test 3] Figure 6-3: Ceiling TC measurement contour plot for Test")
![2 operation in Test 3] Figure 6-4: Ceiling TC measurement contour plot for](/docs-images/86/94110674/images/65-1.jpg "Test 3 46")
65 1 min 42 s 1 min 54 s [1 st sprinkler activation in Test 2] [1 st sprinkler operation in Test 3] Figure 6-3: Ceiling TC measurement contour plot for Test 2 1 min 42 s 1 min 54 s [1 st sprinkler activation in Test 2] [1 st sprinkler operation in Test 3] Figure 6-4: Ceiling TC measurement contour plot for Test 3 46
66 6.2 DISPLACEMENT OF FIRE PLUME DUE TO FAN OPERATION A primary concern with the operation of an HVLS fan installed below a sprinkler system is the deflection of the fire plume leading to operation of sprinklers that are not located over the base of the fire. The ceiling gas centroid at the time of first sprinkler operation can be used as an indicator of deflection of the fire plume. Without an operating HVLS fan the centroid should be positioned over the base of the fire. With an operating HVLS fan, as shown in Section 5.3, the ceiling gas centroid for each test was displaced by the air flow induced by the fan. The specific location for each test, at first sprinkler operation, was: - Test 1: 1.3 m south x 2. m west (4.3 ft x 6.6 ft) [Fan offset from ignition] - Test 2:.7 m north x 1.3 m west (2.3 ft x 4.3 ft) [Fan centered over ignition] - Test 3:.8 m south x.3 m west (2.6 ft x 1. ft) [Fan centered over ignition] - Test 4:.8 m south x 1.1 m west (2.6 ft x 3.6 ft) [Fan centered over ignition] [High clearance scenario] Based on these measurements and visual observation, the largest deflection of the fire plume occurred when the fan was offset from the ignition location, Test 1. This test included a 3. m (1 ft) clearance from the top of the commodity to the ceiling, which was the minimum included in this project. Centering the fan over ignition only slightly reduced the deflection of the fire plume, regardless of clearance, Tests 2-4. It is notable that Tests 2 and 3 included a 3. m (1 ft) clearance, while Test 4 included a 7.6 m (25 ft) clearance. Given the significantly greater clearance in Test 4, the HVLS fan had a lesser impact on the fire plume. This result is contradictory to the initial, preliminary hypothesis in Section 3. It is believed this effect of greater clearance lessening the effect of the HVLS fan can be attributed to the decrease in air flow velocity reaching the top of the array as discussed in Section 5.5. The higher clearance also allowed the fire plume to further develop above the array, i.e., increased flame height and gas velocity, before the first sprinkler operated. 47
67 7 CONCLUSIONS All conclusions in this report are specific to the array configurations used in these tests. The combined effects of a different array height, commodity type, ceiling height, fan diameter/blade shape and speed, etc, are yet to be well understood and may not be inferred from these test results alone. The specific scenario addressed by these tests was protection of CUP commodity using quick-response, pendent sprinklers, having a 71 o C (16 o F) rated link and a K-Factor of 22 L/min/bar 1/2 (14 gpm/psi 1/2 ). In accordance with the evaluation criteria established in Section 4.9, it was found that operation of an HVLS fan without any means of shut down caused an unacceptable impairment to the sprinkler system. However, when shut down of the fan occurred due to a simulated water flow alarm the sprinkler systems performed adequately. Based on the results of the tests presented in this report the following conclusions can be made: The HVLS fan operating without means of automatic shut down resulted in inadequate sprinkler system performance. The HVLS fan centered over the main array, with a clearance from the ceiling to the top of the commodity of 3. m (1 ft), resulted in the largest negative impact on the sprinkler system performance. For storage with a clearance from the top of the commodity to the ceiling ranging from 3. to 7.6 m (1 to 25 ft), fan shut down due to a water flow alarm, i.e., fan shut down less than or equal to 1 min 3 s after first sprinkler operation, allowed for adequate sprinkler system performance. The HVLS fan operating at full speed, with a 3. m (1 ft) clearance between the top of the commodity and the ceiling: o Produced downward air-flow velocities up to 4.5 m/s (14.8 ft/s) at the top of the storage array, o Produced significant air-flow velocities, i.e., velocities greater than or equal to 1 m/s (3.3 ft/s), that penetrate up to 4 tiers (6.1 m [2 ft]) through an open frame double-row rack storage array, 48
68 o Created the greatest disturbance to the ceiling gas flow above ignition when the fan was offset 2.2 m (7.1 ft) from the center of the test array. The HVLS fan operating at half speed, with a 7.6 m (25 ft) clearance between the top of the commodity and the ceiling, and the fan centered over the array, reduced the peak air velocity reaching the top of the array by approximately 6%. The exhaust air system of the FM Global Large Burn Laboratory extracting air at 94 m 3 /s (2, cfm) generates a negligible air flow across the movable ceiling. The air flow generated by the HVLS is the dominant disturbance to the ceiling level gas flow. 49
69 8 REFERENCES [1] MacroAir specifications, [2] National Fire Protection Association Standard 13 (NFPA 13), Standard for the Installation of Sprinkler System, 21. [3] HVLS Fans and Sprinkler Operation Phase 1 Research Program, Final Report prepared by Schirmer Engineering Corporation, February 29. [4] Storage of Class 1, 2, 3, 4 and Plastic Commodities, Data Sheet 8-9, FM Global, May 28. [5] Final HVLS Fans Phase II Test Plan for The Fire Protection Research Foundation, Proposal prepared by Schirmer Engineering Corporation, SEC Project No.: 2133-, July 21. [6] Standard for Automatic Sprinklers for Fire Protection Service, UL 199, Section 61, 11 th Edition, 25. [7] A. Tewarson, Generation of Heat and Chemical Compounds, SFPE Handbook of Fire Protection Engineering, 3 rd Edition, Section 3, Chapter 4, pp to 3-161, March 22. [8] Installation Guidelines for Automatic Sprinklers, Data Sheet 2-, FM Global, March 21. [9] NFPA 72, National Fire Alarm and Signaling Code, National Fire Protection Association, Quincy, MA, 21 Edition. [1] B.J. McCaffrey and G. Heskestad, A Robust Bidirectional Low-Velocity Probe for Flame and Fire Application, Combustion and Flame, 26, pp , [11] H. Ingason, Plume Flow in High Rack Storages, Fire Safety Journal, Volume 36, pp , 21. [12] Flammability Testing of Materials Used in Construction, Transport and Mining (Vivek B. Apte, ed.), Woodhead Publishing Materials, Cambridge, England, 26. [13] Link, Sheila, How High Volume Low Speed (HVLS) Fans Can Reduce Facility CO2 Emissions, Whitepaper prepared by MacroAir Technologies, 21. [14] Class Number 28, Approval Standard for Suppression Mode [Early Suppression - Fast Response (ESFR)] Automatic Sprinklers, October 26. [15] J. Milke, Analytical Methods for Determining Fire Resistance of Steel Members, SFPE Handbook of Fire Protection Engineering, 3rd Edition, Section 4, Chapter 9, pp to 4-238, 22 [16] Specifications for the Design, Fabrication, and Erection of Structural Steel for Building, American Institute of Steel Construction, New York, [17] H. Ingason, Fire Experiments in a Two Dimensional Rack Storage, BRANDFORSK project , Swedish National Testing and Research Institute, SP Report 1993:56,
70 A APPENDIX A - SOUTH CEILING LEVEL THERMOCOUPLE LAYOUT Ceiling Thermocouple Layout for Movable Ceiling of Large Burn Lab Reference Key: Thermocouple location Center of Ceiling 51
71 B APPENDIX B - TEST 1: DATA, OBSERVATIONS, AND RESULTS The first test was conducted on August 4, 21, at 1:3 pm under the South Movable ceiling portion of the Large Burn Lab. Environmental conditions inside the lab were as follows: dry-bulb temperature, 27 o C (8 o F) and relative humidity, 32%. Weather conditions outside the lab were as follows: dry-bulb temperature, 29 o C (84 o F) and relative humidity, 78%. The main fuel array consisted of an open-frame, double-row rack of cartoned unexpanded plastic (CUP) commodity. The array dimensions measured approximately 1.1 m wide x 2.3 m deep (~33 ft x 7.5 ft) in an 8 bay wide x 2 bay deep arrangement. Single-row target arrays contained six pallet loads of the same commodity across a 1.2 m (4 ft) aisle to the east and west of the main array. Overall the target arrays measured approximately 7.5 m wide x 1.2 m deep (24.5 ft x 3.25 ft). For each array, a six pallet load high configuration was used, resulting in an array approximately 9.1 m (3 ft) high. The ceiling was set at a height of 12.2 m (4 ft) above the floor. The main array was centered under one sprinkler. Ignition was accomplished with two FM Global standard half igniters, offset.6 m (2 ft) east in the central transverse flue, located at the rack uprights. The sprinkler system was comprised of Tyco TY6226 quick-response pendent sprinklers with a K-Factor of 22 L/min/bar 1/2 (14 gal/min/psi 1/2 ) and a 71 o C (16 o F) rated link. A nominal operating pressure of 5.2 bar (75 psig) was chosen to provide a discharge of 454 L/min (12 gpm) per sprinkler. The sprinklers were installed on 3 x 3 m (1 x 1 ft) spacing, resulting in a 48.9 mm/min (1.2 gpm/ft 2 ) water density at the floor. The HVLS fan was located among four sprinklers and was offset 2.2 m (7.1 ft) northeast of the array center. This fan was a six blade design with an overall 7.3 m (24 ft) diameter and was operating at the maximum speed of 66 rpm for the entire test. 52
72 B.1.1 Test 1 Highlights The data acquisition system was started with the lab under ambient air flow conditions, i.e., the louvers to the dehumidification system were closed, the louvers on the south end of the west wall were closed, and the louvers on the north end of the west wall were open. After 6 s all instrumentation was zeroed. Data were then collected for 2 min with no air flow in the lab. The exhaust air system was then set to 94 m 3 /s (2, cfm) and data were collected for 15 min to allow the air flow to stabilize. The HVLS fan was then started and data were collected for an additional 5 min before ignition, again to allow the air flow to stabilize. After ignition, the initial fire development was within the center transverse flue and flames reached the top of the 1 st tier at 3 sec. By 35 s flames reached the 2 nd tier and were visibly disturbed by air flow from the fan. Flames then reached the 3 rd tier at 1 min 2 s, 4 th tier at 1 min 7 s, 5 th tier at 1 min 13 s, and extended above the top of the array at 1 min 2 s. The first sprinkler operation, which was centered over the array, occurred at 1 min 28 s. This caused the flames to recede to the 1 st and 2 nd tier of the ignition bay. The fire then grew laterally with flames reaching the east and west faces of the main array at 2 min 14 s and 2 min 33 s, respectively. The combination of the fan air flow and the sprinkler discharge rapidly filled the lab with smoke obscuring the view of the array. Ignition of the eastern target array occurred at 3 min 9 s and was followed closely by the 2 nd sprinkler operation at 3 min 21 s. Ignition of the western target array occurred at 5 min 5 s with a total of 11 sprinklers operating. The 12 th and final sprinkler operated at 7 min 53 s. The fire was largely extinguished when the test was terminated by hose stream at 35 min. Damage was contained within the longitudinal extent of the main array and no burning occurred on the backside of either target array. B.1.2 Test 1 Results A schematic overview of the sprinkler operation sequence and operation times can be found in Figure B-1. As indicated, the first sprinkler, centered over the main array, operated at 1 min 28 s. The remaining 11 sprinklers operations were spaced over the next 6 min 19 s. A total of 12 sprinklers operated, with the final occurring at 7 min 53 s. 53
73 The overall extent of fire damage for Test 1 is represented by the shaded areas in Figure B-2 for the main array and both target arrays. As shown, damage represents visual observation of burning on the outside face of the commodity; no observation of damage within the flue spaces was included. Extensive damage to the commodity occurred on both the east and west rows of the main array and the aisle face of both the east and west target arrays. The fire spread remained within the confines of both arrays. Figure B-3 shows the near-ceiling TC measurements centered over the main array, and at a radial distance of 1.5 m (5 ft), 3. m (1 ft), and 6.1 m (2 ft) from center. The 2-gage thermocouple centered over the main array recorded a peak measurement of 88 o C (19 o F) and the adjacent 28-gage thermocouple recorded a peak measurement of 12 o C (248 o F), both coinciding with first sprinkler operation at 1 min 28 s. The peak steel TC measurement of approximately 76 o C (169 o F) was recorded at 6 min. Steel temperatures shown in the graph represent the average of all nine thermocouples located out to 35 mm (12 in.) in all four directions from center. The thermocouples located 1.5 m (5 ft) and 3. m (1 ft) recorded peak TC measurements of 79 o C (174 o F) to the west and 69 o C (156 o F) to the south, respectively, at first sprinkler operation. The thermocouples located 6.1 m (2 ft) recorded a peak TC measurement of 21 o C (394 o F) to the south at 3 min 56 s. Figure B-4 shows the branch-line water discharge pressure and near-ceiling gas velocities at 2.4 m (8 ft), 4. m (13 ft), and 1.4 m (34 ft) from the main array center. The gas velocities present three distinct lab conditions: 1) until -3 s only the exhaust fan was operating at 94 m 3 /s (2, cfm), 2) at -3 s the HVLS fan was started, and 3) at s the fire was ignited. For each radial distance, the recorded air velocities with only the exhaust fans operating were ±.2 m/s (.7 ft/s). The addition of the HVLS fan caused a significant disturbance in the air flow, with the effect decreasing with distance from the fan. The negative measurements at the 2.4 m (8 ft) and 4. m (13 ft) locations indicate an air flow being drawn toward the fan, i.e., toward the ceiling center. The non-uniformity in the radial distribution was likely a result of the fan being offset within these locations and turbulence in the air flow. Upon ignition, the fire plume gases began traveling outward from the ceiling center. This is observed in most locations as a positive air velocity. At the 1.4 m (34 ft) locations, the effect of the HVLS fan was minimal and the 54
74 outward flow of fire plume gases was evident. At all three locations, the peak outward air velocity was less then 1 m/s (3.3 ft/s) at first sprinkler operation. Figure B-5 presents the heat release rate measurements based on the generation rates of carbon dioxide and carbon monoxide (HRR-COCO2), oxygen depletion (HRR-O2), and convection gas flow within the exhaust duct (Convective). Note that the heat release rate calculations do not account for lag and smear of the data, which can be significant, due to complex mixing of the gases above the movable ceiling or transport time through the collection ducts. Based on the HRR-COCO2 measurements, an estimated 18, ± 2, MJ (17,, ± 3,4, BTU) of total energy was released from an equivalent of 12.5 pallet loads of Standard Plastic Commodity. Figure B-6 presents the time evolution of the two coordinates of the ceiling gas layer centroid. At first sprinkler operation, 1 min 28 s, the coordinates were 1.3 m (4.3 ft) to the south and 2 m (6.6 ft) to the west. This indicates that the fan significantly affected the fire plume, which would be nominally centered under the ceiling without the operating fan. For convenience, Figure B-7 presents the corresponding ceiling TC measurement contours at first sprinkler operation, which show a similar bias toward the southwest. Each measurement is obtained from thermocouples located 152 mm (6 in.) below the ceiling. Note that the circle toward the center of the figure indicates the fan location. Due to an unresolved issue with the contour plot software, the colors within the circle are inverted. Figure B-8 presents the air velocity measurements taken during the fire test at the 15 locations above the top of the array over the ignition bay. Each graph contains data from the five measurement locations over the east face of the array, west face of the array, or above the longitudinal flue. As shown, negative values indicate downward air flow. A plan view schematic of the measurement locations relative to the array and the fan is included for reference. Due to an instrumentation error, data are not presented for locations C1 C3, and C5. These data illustrate the strong downward air velocity generated by the fan with peak sustained velocities of over 4 m/s (13 ft/s). After ignition, the buoyant air flow from the fire plume is evident as either a reduction in the downward flow velocity or in some locations an upward air flow. As expected, 55
75 the upward air velocities are greatest at locations W1 W5 and C4, which coincide with the actual location of the fire plume. 3:26 7:53 5:45 1:28 3:21 4:47 5:2 3:56 4:48 4:32 3:27 3:22 Figure B-1: Plan view of sprinkler operation pattern - Test 1 56
76 C FM Global Extent of Damage Front Elevation View West Side Plan View Plan View East Target Array Extent of Damage Front Elevation View East Side Front Elevation View West Side Front Elevation View West Side Plan View Plan View Plan View West Target Array Plan View SP Front Elevation View East Side Extent of Damage Front Elevation View East Side Main Array Figure B-2: Damage assessment - Test 1 57
77 Ceiling TC Measurement (C) Ceiling TC Measurement (C) Ceiling TC Measurement (C) Ceiling TC Measurement (C) FM Global m North 3. m West 3. m East 3. m South m North 6.1 m West 6.1 m East 6.1 m South Ceiling Center (2-gage) Ceiling Center (28-gage) Steel AVG (9 TC) Steel TC AVG North 1.5 West 1.5 East 1.5 South Figure B-3: Various near-ceiling TC measurements - Test 1 58
78 Ceiling Air Flow Velocity (m/s) Ceiling Air Flow Velocity (m/s) Sprinkler Discharge Pressure (bar) FM Global HVLS Fan Activated 4. m North 4. m West 4. m East 4. m South Ignition 1st Sprinkler Activation Ceiling (12.2 m) Sprinkler Operations Target Pressure HVLS Fan Activated 1.2 m North 1.2 m East 1.2 m West 1.2 m South Ignition 1st Sprinkler Activation HVLS Fan 1.4 m North 1.7 m West Ceiling Air Flow Velocity (m/s) 1.7 m East 1.4 m South Ignition 1st Sprinkler Activation Figure B-4: Data plots Test 1 59
79 Heat Release Rate (kw) FM Global 2 15 HRR COCO2 HRR-COCO2 HRR-2 Convective HRR O2 1 5 HRR CONVECTIVE Figure B-5: Heat release rate Test 1 6
80 Ceiling Layer Centroid (m) Ceiling Layer Centroid (m) FM Global 1 East x-coordinate Ceiling center 5-5 West North y-coordinate Ceiling center 5-5 South Figure B-6: Time evolution of x- and y-coordinate of ceiling layer centroid Test 1 Figure B-7: Ceiling TC contours at first sprinkler operation (1 min 28 s) Test 1 61
81 Air Flow Velocity (m/s) Air Flow Velocity (m/s) Air Flow Velocity (m/s) FM Global W5 W4 W3 W2 W1 C5 C4 C3 C2 C1 E5 E4 E3 E2 E1 5 Stagnant Airflow -5 Ignition 1st sprinkler activation Stagnant Airflow 1st sprinkler activation Ignition Stagnant Airflow -5 Ignition 1st sprinkler activation C4 E1 E2 E3 W1 W2 W3 W4 W5 E4 E5 Figure B-8: Air-flow above array at ignition bay Test 1 62
82 C APPENDIX C - TEST 2: DATA, OBSERVATIONS, AND RESULTS The second test was conducted on August 2, 21, at 1:3 am under the South Movable ceiling portion of the Large Burn Lab. Environmental conditions inside the lab were as follows: dry-bulb temperature, 23 o C (73 o F) and relative humidity, 39%. Weather conditions outside the lab were as follows: dry-bulb temperature, 19 o C (67 o F) and relative humidity, 57%. The main fuel array consisted of an open-frame, double-row rack of cartoned unexpanded plastic (CUP) commodity. The array dimensions measured approximately 1.1 m wide x 2.3 m deep (~33 ft x 7.5 ft) in an 8 bay wide x 2 bay deep arrangement. Single-row target arrays contained six pallet loads of the same commodity across a 1.2 m (4 ft) aisle to the east and west of the main array. Overall the target arrays measured approximately 7.5 m wide x 1.2 m deep (24.5 ft x 3.25 ft). For each array, a six pallet load high configuration was used, resulting in an array approximately 9.1 m (3 ft) high. The ceiling was set at a height of 12.2 m (4 ft) above the floor. The main array was centered among four sprinklers. Ignition was accomplished with two FM Global standard half igniters, offset.6 m (2 ft) east in the central transverse flue, located at the rack uprights. The sprinkler system was comprised of Tyco TY6226 quick-response pendent sprinklers with a K-factor of 22 L/min/bar 1/2 (14 gal/min/psi 1/2 ) and a 71 o C (16 o F) rated link. A nominal operating pressure of 5.2 bar (75 psig) was chosen to provide a discharge of 454 L/min (12 gpm) per sprinkler. The sprinklers were installed on 3 x 3 m (1 x 1 ft) spacing, resulting in a 48.9 mm/min (1.2 gpm/ft 2 ) water density at the floor. The HVLS fan was located among four sprinklers and was centered over the main array. This fan was a six blade design with an overall 7.3 m (24 ft) diameter and was operating at the maximum speed of 66 rpm for the entire test. 63
83 C.1.1 Test 2 Highlights The data acquisition system was started with the lab under ambient air flow conditions, i.e., the louvers to the dehumidification system were closed, the louvers on the south end of the west wall were closed, and the louvers on the north end of the west wall were open. After 6 s all instrumentation was zeroed. Data were then collected for 2 min with no air flow in the lab. The exhaust air system was then set to 94 m 3 /s (2, cfm) and data were collected for 15 min to allow the air flow to stabilize. The HVLS fan was then started and data were collected for an additional 5 min before ignition, again to allow the air flow to stabilize. After ignition, the initial fire development was within the center transverse flue. Flames reached the 2 nd tier by 24 s and were visibly disturbed by air flow from the fan. Flames then reached the 3 rd tier at 5 s, 4 th tier at 1 min, 5 th tier at 1 min 5 s, and extended above the top of the array at 1 min 15 s. The first sprinkler operation, which was southeast of ignition, occurred at 1 min 42 s. The remaining three sprinklers surrounding ignition operated at 1 min 52 s, 2 min 2 s, and 2 min 13 s. Ignition of the east target array also occurred at 2 min 13 s and flames quickly extended to the backside of the array by 2 min 5 s. By 3 min 4 s the burning was sustained on the backside of the east target array. The twelfth and final sprinkler operated at 3 min 57 s. The fire was largely extinguished when the test was terminated by hose stream at 25 min. Damage was contained within the longitudinal extent of the main array; however, substantial damage occurred on the backside of the east target array. C.1.2 Test 2 Results A schematic overview of the sprinkler operation sequence and operation times can be found in Figure C-1. The first sprinkler, centered over the main array, operated at 1 min 42 s. The remaining 11 sprinklers operations were spaced over the next 2 min 15 s. A total of 12 sprinklers operated, with the final occurring at 3 min 57 s. The overall extent of fire damage for Test 2 is represented by the shaded areas in Figure C-2 for the main array and both target arrays. As shown, damage represents visual observation of burning on the outside face of the commodity; no observation of damage within the flue spaces was included. The fire spread remained within the longitudinal confines of the main array with 64
84 damage primarily sustained on the eastern row; however, there was extensive damage to the commodity on the backside of the east target array. Figure C-3 shows the near-ceiling TC measurements centered over the main array, and at a radial distance of 1.5 m (5 ft), 3. m (1 ft), and 6.1 m (2 ft) from center. The 2-gage thermocouple centered over the main array recorded a peak measurement of 23 o C (397 o F) and the adjacent 28-gage thermocouple recorded a peak measurement of 238 o C (46 o F), both coinciding with first sprinkler operation at 1 min 42 s. The peak steel TC measurement of approximately 46 o C (115 o F) was recorded at 4 min 51 s. Steel temperatures shown in the graph represent the average of all nine thermocouples located out to 35 mm (12 in.) in all four directions from center. The thermocouples located 1.5 m (5 ft) and 3. m (1 ft) recorded peak TC measurements of 19 o C (374 o F) to the south and 136 o C (277 o F) to the south, respectively, at first sprinkler operation. The thermocouples located 6.1 m (2 ft) recorded a peak TC measurement of 151 o C (34 o F) to the east at 3 min 3 s. Figure C-4 shows the branch-line water discharge pressure and near-ceiling gas velocities at 2.4 m (8 ft), 4. m (13 ft), and 1.4 m (34 ft) from the main array center. The gas velocities present three distinct lab conditions: 1) until -3 s only the exhaust fan was operating at 94 m 3 /s (2, cfm), 2) at -3 s the HVLS fan was started, and 3) at s the fire was ignited. For each radial distance the recorded air velocities with only the exhaust fans operating were ±.2 m/s (.7 ft/s). The addition of the HVLS fan caused a significant disturbance in the air flow, with the effect decreasing with distance from the fan. This was observed as negative measurements at the 2.4 m (8 ft) and 4. m (13 ft) locations in the range of 1 to 2 m/s (3.3 to 6.6 ft/s), which indicate air flow being drawn toward the fan, i.e., toward the ceiling center. The measurements at the 1.4 m (34 ft) locations indicate relatively stagnant air flow during the same timeframe. Upon ignition, the fire plume gases began traveling outward from the ceiling center. This was observed at the 2.4 m (8 ft) locations as a positive air velocity, i.e., away from the ceiling center, with magnitudes up to 4 m/s (13.1 ft/s) near the time of first sprinkler operation. At the 1.4 m (34 ft) locations, the effect of the HVLS fan and the fire plume gas flow was minimal. 65
85 Figure C-5 presents the heat release measurements based on the generation rates of carbon dioxide and carbon monoxide (HRR-COCO2) and convection gas flow within the exhaust duct (Convective). Due to an instrumentation failure, no heat release based on oxygen depletion is reported. Note that the heat release rate calculations do not account for lag and smear of the data, which can be significant, due to complex mixing of the gases above the movable ceiling or transport time through the collection ducts. Based on the HRR-COCO2 measurements, an estimated 7,5 ± 1,1 MJ (7,1, ± 1,, BTU) of total energy was released from an equivalent of 5 pallet loads of Standard Plastic Commodity. Figure C-6 presents the time evolution of the two coordinates of the gas layer centroid. At first sprinkler operation, 1 min 42 s, the coordinates are.7 m (4.3 ft) to the north and 1.3 m (6.6 ft) to the west. This indicates that the fan significantly affected the fire plume, which would be nominally centered under the ceiling without the operating fan. For convenience, Figure C-7 presents the corresponding ceiling TC measurement contours at first sprinkler operation, which show a similar bias towards the northwest. Each measurement is obtained from thermocouples located 152 mm (6 in.) below ceiling. Note that the circle toward the center of the figure indicates the fan location. Due to an unresolved issue with the contour plot software, the colors within the circle are inverted. Figure C-8 presents the air velocity measurements taken during the fire test at the 15 locations above the top of the array over the ignition bay. Each graph contains data from the five measurement locations over either the east face of the array, west face of the array, or above the longitudinal flue. As shown, negative values indicated downward air flow. A plan view schematic of the measurement locations relative to the array and the fan is included for reference. These data illustrate the strong downward air velocity generated by the fan with peak sustained velocities up to 3.5 m/s (11.5 ft/s). After ignition, the buoyant air flow from the fire plume is evident as either a reduction in the downward flow velocity or in some locations an upward air flow. The strongest upward air velocities were measured at locations C2 - C4, E3, and E4, which coincide with the actual location of the fire plume. 66
86 3:32 1:42 2:13 3:57 3:25 1:52 2:2 3:34 3:9* 2:52 3:33 3:34 *operation not identified by digital channel Figure C-1: Plan view of sprinkler operation pattern - Test 2 67
87 C FM Global Extent of Damage Front Elevation View West Side Plan View Plan View East Target Array Extent of Damage Front Elevation View East Side Front Elevation View West Side Front Elevation View West Side Plan View Plan View Plan View West Target Array Plan View SP Front Elevation View East Side Extent of Damage Front Elevation View East Side Main Array Figure C-2: Damage assessment - Test 2 68
88 Ceiling TC Measurement (C) Ceiling TC Measurement (C) Ceiling TC Measurement (C) Ceiling TC Measurement (C) FM Global m North 3. m West 3. m East 3. m South m North 6.1 m West 6.1 m East 6.1 m South Ceiling Center (2-gage) Ceiling Center (28-gage) Steel AVG (9 TC) Steel TC AVG North 1.5 West 1.5 East 1.5 South Figure C-3: Various near-ceiling TC measurements - Test 2 69
89 Ceiling Air Flow Velocity (m/s) Ceiling Air Flow Velocity (m/s) Sprinkler Discharge Pressure (bar) FM Global HVLS Fan Activated 4. m North 4. m West 4. m East 4. m South Ignition 1st Sprinkler Activation Ceiling (12.2 m) Sprinkler Operations Sprinkler operation not detected by digital channel Target Pressure HVLS Fan Activated 1.2 m North 1.2 m East 1.2 m West 1.2 m South Ignition 1st Sprinkler Activation HVLS Fan 1.4 m North 1.7 m West Ceiling Air Flow Velocity (m/s) 1.7 m East 1.4 m South Ignition 1st Sprinkler Activation Figure C-4: Data plots Test 2 7
90 Heat Release Rate (kw) FM Global 15 "HRRCOCO2" "CONVHRR1" HRR COCO2 1 5 HRR CONVECTIVE Figure C-5: Heat release rate Test 2 71
91 Ceiling Layer Centroid (m) Ceiling Layer Centroid (m) FM Global 1 East x-coordinate Ceiling center 5-5 West North y-coordinate Ceiling center 5-5 South Figure C-6: Time evolution of x- and y-coordinate of ceiling layer centroid Test 2 Figure C-7: Ceiling TC contours at first sprinkler operation (1 min 42 s) Test 2 72
92 Air Flow Velocity (m/s) Air Flow Velocity (m/s) Air Flow Velocity (m/s) FM Global W5 W4 W3 W2 W1 C5 C4 C3 C2 C1 E5 E4 E3 E2 E1 5 Stagnant Airflow -5 Ignition 1st sprinkler activation Stagnant Airflow 1st sprinkler activation Ignition Stagnant Airflow -5 Ignition 1st sprinkler activation C1 C2 C3 C4 C5 E1 E2 E3 W1 W2 W3 W4 W5 E4 E5 Figure C-8: Air-flow above array at ignition bay Test 2 73
93 D APPENDIX D - TEST 3: DATA, OBSERVATIONS, AND RESULTS The third test was conducted on September 3, 21, at 1:3 am under the South Movable ceiling portion of the Large Burn Lab. Environmental conditions inside the lab were as follows: dry-bulb temperature, 23 o C (74 o F) and relative humidity, 38%. Weather conditions outside the lab were as follows: dry-bulb temperature, 28 o C (82 o F) and relative humidity, 64%. This test was identical to Test 2, except with the fan was shut off 1 min 3 after first sprinkler operation. The main fuel array consisted of an open-frame, double-row rack of cartoned unexpanded plastic (CUP) commodity. The array dimensions measured approximately 1.1 m wide x 2.3 m deep (~33 ft x 7.5 ft) in an 8 bay wide x 2 bay deep arrangement. Single-row target arrays contained six pallet loads of the same commodity across a 1.2 m (4 ft) aisle to the east and west of the main array. Overall the target arrays measured approximately 7.5 m wide x 1.2 m deep (24.5 ft x 3.25 ft). For each array, a six pallet load high configuration was used, resulting in an array approximately 9.1 m (3 ft) high. The ceiling was set at a height of 12.2 m (4 ft) above the floor. The main array was centered among four sprinklers. Ignition was accomplished with two FM Global standard half igniters, offset.6 m (2 ft) east in the central transverse flue, located at the rack uprights. The sprinkler system was comprised of Tyco TY6226 quick-response pendent sprinklers with a K-factor of 22 L/min/bar 1/2 (14 gal/min/psi 1/2 ) and a 71 o C (16 o F) rated link. A nominal operating pressure of 5.2 bar (75 psig) was chosen to provide a discharge of 454 L/min (12 gpm) per sprinkler. The sprinklers were installed on 3 x 3 m (1 x 1 ft) spacing, resulting in a 48.9 mm/min (1.2 gpm/ft 2 ) water density at the floor. The HVLS fan was located among four sprinklers and was nominally centered over the main array. This fan was a six blade design with an overall 7.3 m (24 ft) diameter. The fan was operating at the maximum speed of 66 rpm at the start of the test and was shut off 1 min 3 s after first sprinkler operation. 74
94 D.1.1 Test 3 Highlights The data acquisition system was started with the lab under ambient air flow conditions, i.e., the louvers to the dehumidification system were closed, the louvers on the south end of the west wall were closed, and the louvers on the north end of the west wall were open. After 6 s all instrumentation was zeroed. Data were then collected for 2 min with no air flow in the lab. The exhaust air system was then set to 94 m 3 /min (2, cfm) and data were collected for 15 min to allow the air flow to stabilize. The HVLS fan was then started and data were collected for an additional 5 min before ignition, again to allow the air flow to stabilize. After ignition, the initial fire development was within the center transverse flue. Flames reached the 2 nd tier by 32 s and were visibly disturbed by the air flow from the fan. Flames then reached the 3 rd tier at 44 s, 4 th tier at 54 s, 5 th tier at 1 min 3 s, and extended above the top of the array at 1 min 12 s. The first sprinkler operation, which was southwest of ignition, occurred at 1 min 54 s, and was immediately followed by the second sprinkler operation at 1 min 55 s southeast of ignition. The remaining two sprinklers surrounding ignition operated at 2 min 2 s and 2 min 3 s. Ignition of the east target array occurred at 3 min. By 5 min, the fire was contained to the lower tiers of the east row of the main array with no observed burning of the east target array. The fire was largely extinguished when the test was terminated by hose stream at 25 min. Damage was limited to the east row of the main array and the aisle face of the east target array. D.1.2 Test 3 Results A schematic overview of the sprinkler operation sequence and operation times can be found in Figure D-1. The first sprinkler, centered over the main array, operated at 1 min 54 s. The remaining 3 sprinklers operations, which surrounded the ignition location, occurred by 2 min 3 s. The overall extent of fire damage for Test 3 is represented by the shaded areas in Figure D-2 for the main array and both target arrays. As shown, damage represents visual observation of burning on the outside face of the commodity; no observation of damage within the flue spaces was included. The fire spread remained within the longitudinal confines of the main array with damage primarily sustained on the eastern row and minimal damage to the commodity on the aisle face of the east target array. 75
95 Figure D-3 shows the near-ceiling TC measurements centered over the main array, and at a radial distance of 1.5 m (5 ft), 3. m (1 ft), and 6.1 m (2 ft) from center. The 2-gage thermocouple centered over the main array recorded a peak measurement of 183 o C (361 o F) and the adjacent 28-gage thermocouple recorded a peak measurement of 239 o C (462 o F), both roughly coinciding with first sprinkler operation at 1 min 54 s. The peak steel TC measurement of approximately 45 o C (113 o F) was recorded at 4 min 41 s. Steel temperatures shown in the graph represent the average of all nine thermocouples located out to 35 mm (12 in.) in all four directions from center. The thermocouples located 1.5 m (5 ft) and 3. m (1 ft) recorded nominally uniform peak TC measurements of 136 o C (277 o F) and 126 o C (259 o F), respectively, at first sprinkler operation. The thermocouples located 6.1 m (2 ft) recorded a peak TC measurement of 99 o C (21 o F) to the east at 3 min 5 s. Figure D-4 shows the branch-line water discharge pressure and near-ceiling gas velocities at 2.4 m (8 ft), 4. m (13 ft), and 1.4 m (34 ft) from the main array center. The gas velocities present three distinct lab conditions: 1) until -3 s only the exhaust fan was operating at 94 m 3 /s (2, cfm), 2) at -3 s the HVLS fan was started, and 3) at s the fire was ignited. For each radial distance the recorded air velocities with only the exhaust fans operating were ±.2 m/s (.7 ft/s). The addition of the HVLS fan caused a significant disturbance in the air flow, with the effect decreasing with distance from the fan. This effect was observed as negative measurements at the 2.4 m (8 ft) and 4. m (13 ft) locations approximately in the range of.5 to 2 m/s (1.6 to 6.6 ft/s), which indicates air flow being drawn toward the fan, i.e., toward the ceiling center. The measurements at the 1.4 m (34 ft) locations indicate relatively stagnant air flow during the same time frame. Upon ignition, the fire plume gases began traveling outward from the ceiling center. This was observed at the 2.4 m (8 ft) locations as a positive air velocity, i.e., away from the ceiling center, with magnitudes up to 3 m/s (13.1 ft/s) near the time of first sprinkler operation. At the 1.4 m (34 ft) locations, the effect of the HVLS fan and the fire plume gas flow was minimal. Figure D-5 presents the heat release measurements based on the generation rates of carbon dioxide and carbon monoxide (HRR-COCO2) and convection gas flow within the exhaust duct (Convective). Due to an instrumentation failure, no heat release based on oxygen depletion is 76
96 reported. Note that the heat release rate calculations do not account for lag and smear of the data, which can be significant, due to complex mixing of the gases above the movable ceiling or transport time through the collection ducts. Based on the HRR-COCO2 measurements, an estimated 3,5 ± 5 MJ (3,3, ± 5, BTU) of total energy was released from an equivalent of 2.5 pallet loads of Standard Plastic Commodity. Figure D-6 presents the time evolution of the two coordinates of the gas layer centroid. At first sprinkler operation, 1 min 54 s, the coordinates are.8 m (2.6 ft) to the south and.3 m (1. ft) to the west. This indicates that the fan significantly affected the fire plume, which would be nominally centered under the ceiling without the operating fan. For convenience, Figure D-7 presents the corresponding ceiling TC measurement contours at first sprinkler operation, which show a similar bias towards the southwest. Each measurement is obtained from thermocouples located 152 mm (6 in.) below the ceiling. Note that the circle towards the center of the figure indicates the fan location. Due to an unresolved issue with the contour plot software, the colors within the circle are inverted. Figure D-8 presents the air velocity measurements taken during the fire test at the 15 locations above the top of the array over the ignition bay. Each graph contains data from the five measurement locations over either the east face of the array, west face of the array, or within the longitudinal flue. As shown, negative values indicate downward air flow. A plan view schematic of the measurement locations relative to the array and the fan is included for reference. These data illustrate the strong downward air velocity generated by the fan with peak sustained velocities of up to 3.5 m/s (11.5 ft/s). After ignition, the buoyant air flow from the fire plume is evident as either a reduction in the downward flow velocity or in some locations an upward air flow. The strongest upward air velocities were measured at locations C2 - C4 and E2 - E4, which coincide with the actual location of the fire plume. 77
97 2:2 2:3 1:54 1:55 Figure D-1: Plan view of sprinkler operation pattern - Test 3 78
98 C FM Global Extent of Damage Front Elevation View West Side Plan View Plan View East Target Array Extent of Damage Front Elevation View East Side Front Elevation View West Side Front Elevation View West Side Plan View Plan View Plan View West Target Array Plan View SP Front Elevation View East Side Extent of Damage Front Elevation View East Side Main Array Figure D-2: Damage assessment - Test 3 79
99 Ceiling TC Measurement (C) Ceiling TC Measurement (C) Ceiling TC Measurement (C) Ceiling TC Measurement (C) FM Global m North 3. m West 3. m East 3. m South m North 6.1 m West 6.1 m East 6.1 m South Ceiling Center (2-gage) Ceiling Center (28-gage) Steel AVG (9 TC) Steel TC AVG North 1.5 West 1.5 East 1.5 South Figure D-3: Various near-ceiling TC measurements - Test 3 8
100 Ceiling Air Flow Velocity (m/s) Ceiling Air Flow Velocity (m/s) Sprinkler Discharge Pressure (bar) FM Global HVLS Fan Activated 4. m North 4. m West 4. m East 4. m South Ignition 1st Sprinkler Activation Ceiling (12.2 m) Sprinkler Operations Target Pressure HVLS Fan Activated 1.2 m North 1.2 m East 1.2 m West 1.2 m South Ignition 1st Sprinkler Activation HVLS Fan 1.4 m North 1.7 m West Ceiling Air Flow Velocity (m/s) 1.7 m East 1.4 m South Ignition 1st Sprinkler Activation Figure D-4: Data plots Test 3 81
101 Heat Release Rate (kw) FM Global 15 "HRRCOCO2" "CONVHRR1" 1 HRR COCO2 5 HRR CONVECTIVE Figure D-5: Heat release rate Test 3 82
102 Ceiling Layer Centroid (m) Ceiling Layer Centroid (m) FM Global 1 x-coordinate Ceiling center 5 East -5 West y-coordinate Ceiling center North 5-5 South Figure D-6: Time evolution of x- and y-coordinate of ceiling layer centroid Test 3 Figure D-7: Ceiling TC contours at first sprinkler operation (1 min 54 s) Test 3 83
103 Air Flow Velocity (m/s) Air Flow Velocity (m/s) Air Flow Velocity (m/s) FM Global W5 W4 W3 W2 W1 C5 C4 C3 C2 C1 E5 E4 E3 E2 E Stagnant Airflow Ignition Stagnant Airflow 1st sprinkler activation Ignition 1st sprinkler activation Stagnant Airflow Ignition 1st sprinkler activation C1 C2 C3 C4 C5 E1 E2 E3 E4 W1 W2 W3 W4 W5 E5 Figure D-8: Air-flow above array at ignition bay Test 3 84
104 E APPENDIX E - TEST 4: DATA, OBSERVATIONS, AND RESULTS The fourth test was conducted on December 2, 21, at 9: am under the South Movable ceiling portion of the Large Burn Lab. Environmental conditions inside the lab were as follows: dry-bulb temperature, 23 o C (74 o F) and relative humidity, 24%. Weather conditions outside the lab were as follows: dry-bulb temperature, 2 o C (36 o F) and relative humidity, 55%. This test was similar to Test 3, except for a reduced storage height of 4.6 m (15 ft). The main fuel array consisted of an open-frame, double-row rack of cartoned unexpanded plastic (CUP) commodity. The array dimensions measured approximately 1.1 m wide x 2.3 m deep (~33 ft x 7.5 ft) in an 8 bay wide x 2 bay deep arrangement. Single-row target arrays contained six pallet loads of the same commodity across a 1.2 m (4 ft) aisle to the east and west of the main array. Overall the target arrays measured approximately 7.5 m wide x 1.2 m deep (24.5 ft x 3.25 ft). For each array, a three pallet load high configuration was used, resulting in an array approximately 4.6 m (15 ft) high. The ceiling was set at a height of 12.2 m (4 ft) above the floor. The main array was centered among four sprinklers. Ignition was accomplished with two FM Global standard half igniters, offset.6 m (2 ft) east in the central transverse flue, located at the rack uprights. The sprinkler system was comprised of Tyco TY6226 quick-response pendent sprinklers with a K-factor of 22 L/min/bar 1/2 (14 gal/min/psi 1/2 ) and a 71 o C (16 o F) rated link. A nominal operating pressure of 5.2 bar (75 psig) was chosen to provide a discharge of 454 L/min (12 gpm) per sprinkler. The sprinklers were installed on 3 x 3 m (1 x 1 ft) spacing, resulting in a 48.9 mm/min (1.2 gpm/ft 2 ) water density at the floor. The HVLS fan was located among four sprinklers and was centered over the main array. This fan was a six blade design with an overall 7.3 m (24 ft) diameter. The fan was operating at the maximum speed of 66 rpm at the start of the test and was shut off 1 min 3 s after first sprinkler operation. 85
105 E.1.1 Test 4 Highlights The data acquisition system was started with the lab under ambient air flow conditions, i.e., the louvers to the dehumidification system were closed, the louvers on the south end of the west wall were closed, and the louvers on the north end of the west wall were open. After 6 s all instrumentation was zeroed. Data were then collected for 2 min with no air flow in the lab. The exhaust air system was then set to 94 m 3 /s (2, cfm) and data were collected for 15 min to allow the air flow to stabilize. The HVLS fan was then started and data were collected for an additional 5 min before ignition, again to allow the air flow to stabilize. After ignition, the initial fire development was within the center transverse flue. Flames reached the 2 nd tier by 34 s and were visibly disturbed by air flow from the fan. Flames then reached the 3 rd tier at 43 s and extended above the top of the array by 1 min. At 1 min 1 s the flames extended 1 m (3 ft) above the array and were substantially disturbed (pushed down) by the fan air flow. By 1 min 3 s, the flames extended half way to the ceiling and the fire plume was stable over the ignition area. The first sprinkler operation, which was northwest of ignition, occurred at 1 min 39 s. The remaining three sprinklers (surrounding ignition) operated by 1 min 42 s and the flames receded to the top of the main array by 1 min 47 s. The fan was shut down at 3 min 9 s with burning of the commodity limited to the first tier of the main array. The fire was largely extinguished when the test was terminated by hose stream at 25 min. Damage was limited to the east row of the main array and no target ignition occurred. E.1.2 Test 4 Results A schematic overview of the sprinkler operation sequence and operation times can be found in Figure E-1. As indicated, the first sprinkler, centered over the main array, operated at 1 min 39 s. The remaining three sprinklers operations, which surrounded the ignition location, occurred by 1 min 42 s. The overall extent of fire damage for Test 4 is represented by the shaded areas in Figure E-2 for the main array and both target arrays. As shown, damage represents visual observation of burning on the outside face of the commodity; no observation of damage within the flue spaces 86
106 was included. The fire spread remained within the confines of the main array with damage primarily sustained on the eastern row and no jump to either target array. Figure E-3 shows the near-ceiling TC measurements centered over the main array, and at a radial distance of 1.5 m (5 ft), 3. m (1 ft), and 6.1 m (2 ft) from center. The 2-gage thermocouple centered over the main array recorded a peak measurement of 178 o C (352 o F) and the adjacent 28-gage thermocouple recorded a peak measurement of 17 o C (338 o F), both roughly coinciding with first sprinkler operation at 1 min 39 s. The peak steel TC measurement of 28 o C (823 o F) was recorded at 1 min 46 s. Steel temperatures shown in the graph represent the average of all nine thermocouples located out to 35 mm (12 in.) in all four directions from center. The thermocouples located 1.5 m (5 ft) and 3. m (1 ft) recorded peak TC measurements of 156 o C (313 o F) to the west and 132 o C (27 o F) to the east, respectively, at first sprinkler operation. The thermocouples located 6.1 m (2 ft) recorded a peak TC measurement of 6 o C (14 o F) to the south also coinciding with first sprinkler operation. Figure E-4 shows the branch-line water discharge pressure and near-ceiling gas velocities at 2.4 m (8 ft), 4. m (13 ft), and 1.4 m (34 ft) from the main array center. The gas velocities present three distinct lab conditions: 1) until -3 s only the exhaust fan was operating at 94 m 3 /s (2, cfm), 2) at -3 s the HVLS fan was started, and 3) at s the fire was ignited. For each radial distance the recorded air velocities with only the exhaust fans operating were ±.3 m/s (1. ft/s). The addition of the HVLS fan caused a significant disturbance in the air flow, with the effect decreasing with distance from the fan. This was observed at the 2.4 m (8 ft) location as a highly variable measurement ranging from 1. to m/s (3.3 to ft/s), indicating flow both toward and away from the fan. The measurements at the 4. m (13 ft) locations were approximately in the range of -1.7 to -2.7 m/s (-5.6 to -8.9 ft/s), which indicates air flow being drawn toward the fan, i.e., toward the ceiling center. The measurements at the 1.4 m (34 ft) locations indicate relatively stagnant air flow during the same timeframe. Upon ignition, the fire plume gases began traveling outward from the ceiling center. This was observed at the 2.4 m (8 ft) locations as a positive air velocity, i.e., away from the ceiling center, with magnitudes up to 2.8 m/s (9.2 ft/s) near the time of first sprinkler operation. At the 1.4 m (34 ft) locations, the effect of the HVLS fan and the fire plume gas flow was minimal. 87
107 Figure E-5 presents the heat release measurements based on the generation rates of carbon dioxide and carbon monoxide (HRR-COCO2) and convection gas flow within the exhaust duct (Convective). Due to an instrumentation failure, no heat release based on oxygen depletion is reported. Note that the heat release rate calculations do not account for lag and smear of the data, which can be significant, due to complex mixing of the gases above the movable ceiling or transport time through the collection ducts. Based on the HRR-COCO2 measurements, an estimated 75 ± 1 MJ (7, ± 1, BTU) of total energy was released from an equivalent of.5 pallet loads of Standard Plastic Commodity. Figure E-6 presents the time evolution of the two coordinates of the gas layer centroid. At first sprinkler operation, 1 min 39 s, the coordinates are.8 m (2.6 ft) to the south and 1.1 m (3.6 ft) to the west. Given the 7.6 m (25 ft) clearance from the commodity to the ceiling for this test configuration, the location of the ceiling gas centroid indicates that the fan only had a minimal effect on the fire plume, which would be nominally centered under the ceiling without the operating fan. For convenience, Figure E-7 presents the corresponding ceiling TC measurement contours at first sprinkler operation, which show a similar minimal displacement of the fire plume centroid towards the southwest. Each measurement is obtained from thermocouples located 152 mm (6 in.) below ceiling. Note that the circle towards the center of the figure indicates the fan location. Due to an unresolved issue with the contour plot software, the colors within the circle are inverted. Figure E-8 presents the air velocity measurements taken during the fire test at the 15 locations above the top of the array over the ignition bay. Each graph contains data from the five measurement locations over either the east face of the array, west face of the array, or above the longitudinal flue. As shown, negative values indicate downward air flow. A plan view schematic of the measurement locations relative to the array and the fan is included for reference. These data illustrate the strong downward air velocity generated by the fan with peak sustained velocities of up to -3.3 m/s (-1.8 ft/s). After ignition, the buoyant air flow from the fire plume was evident as either a reduction in the downward flow velocity or in some locations an upward air flow. The upward air velocities were generally greater than 1 m/s (3.3 ft/s) at first sprinkler 88
108 operation with peak values greater than 5 m/s (16.4 ft/s) measured at locations C3, C4, E2, E4, and W4. 1:39 1:41 1:42 1:42 Figure E-1: Plan view of sprinkler operation pattern - Test 4 89
109 Plan View Plan View Plan View Front Elevation View East Side Extent of Damage Front Elevation View West Side Plan View East Target Array Extent of Damage Front Elevation View East Side Front Elevation View West Side Front Elevation View West Side Plan View West Target Array Plan View Front Elevation View East Side Extent of Damage Main Array Figure E-2: Damage assessment - Test 4 9
110 Ceiling TC Measurement (C) Ceiling TC Measurement (C) Ceiling TC Measurement (C) Ceiling TC Measurement (C) FM Global m North 3. m West 3. m East 3. m South m North 6.1 m West 6.1 m East 6.1 m South Ceiling Center (2-gage) Ceiling Center (28-gage) Steel AVG (9 TC) Steel TC AVG North 1.5 West 1.5 East 1.5 South Figure E-3: Various near-ceiling TC measurements - Test 4 91
111 Ceiling Air Flow Velocity (m/s) Ceiling Air Flow Velocity (m/s) Sprinkler Discharge Pressure (bar) FM Global HVLS Fan 4. m North 4. m West 4. m East 4. m South Ignition 1st Sprinkler Ceiling (12.2 m) Sprinkler Operations Target Pressure HVLS Fan 1.2 m North 1.2 m East 1.2 m West 1.2 m South Ignition 1st Sprinkler HVLS Fan 1.4 m North 1.7 m West Ceiling Air Flow Velocity (m/s) 1.7 m East 1.4 m South Ignition 1st Sprinkler Activation Figure E-4: Data plots Test 4 92
112 Heat Release Rate (kw) FM Global 15 "HRRCOCO2" "CONVHRR1" 1 5 HRR CONVECTIVE HRR COCO Figure E-5: Heat release rate Test 4 93
113 Ceiling Layer Centroid (m) Ceiling Layer Centroid (m) FM Global 1 x-coordinate Ceiling center East 5-5 West y-coordinate Ceiling center North 5-5 South Figure E-6: Time evolution of x- and y-coordinate of ceiling layer centroid Test 4 Figure E-7: Ceiling TC contours at first sprinkler operation (1 min 39 s) Test 4 94
114 Air Flow Velocity (m/s) Air Flow Velocity (m/s) Air Flow Velocity (m/s) FM Global W5 W4 W3 W2 W1 C5 C4 C3 C2 C1 E5 E4 E3 E2 E Stagnant Airflow 1st sprinkler activation Ignition Stagnant Airflow Ignition 1st sprinkler activation Stagnant Airflow Ignition 1st sprinkler activation C1 C2 C3 C4 C5 E1 E2 E3 E4 W1 W2 W3 W4 W5 E5 Figure E-8: Air-flow above array at ignition bay Test 4 95
115 F.1 TEST 1 FIRE CHRONOLOGY Date: 5 August, 21 Observer: Benjamin Ditch F APPENDIX F FIRE CHRONOLOGIES Time (mm:ss) Observation DAQ engines, + 6 s and Lin (zeroes bidirectional probes) -22:13 Test start, no air flow in lab (dehumidifier vents closed, louvered walls closed, fan off) -2:13 Start exhaust air, 2K cfm (time allotted to stabilize air flow) -5:13 HVLS fan on (time allotted to stabilize air flow) : Ignition, rack uprights, offset 2-ft east :3 Flames visible above 1 st tier :35 Flames reach 2 nd tier, visibly disturbed by fan air flow 1:2 Flames reach 3 rd tier 1:7 Flames reach 4 th tier 1:13 Flames reach 5 th tier 1:2 Flames extend above main array, contained to ignition flue 1:28 1 st sprinkler operation, centered over main array 1:4 Flames recede to 1 st and 2 nd tier of ignition bay 2:14 Flames reach east face of main array at 2 nd tier 2:15 Exiting lab due to smoke (fan increasing smoke spread in lab), observations made from cameras viewing east and west aisles and IR camera 2:33 Flames reach west face of main array at 2 nd tier 3:9 Flames on east face of main array extend to 2 nd and 3 rd tier, Ignition of east target array at 3 rd tier 3:21 2 nd sprinkler operation, centered over east target array 3:27 5 total sprinklers operations 3:3 Flames in east aisle from tiers 2-5 4:17 Flames on west face of main array extend to tiers 2-4 4:5 Flames on west face of main array extend to tiers 2-5 5:45 11 total sprinkler operations 5:5 Ignition of west target array at 2 nd and 3 rd tier 7:53 12 th and final sprinkler operation 35: Test terminated by hose stream; 12 sprinkler operations; substantial damage to east and west side of main array, fire jump to both east and west targets, no damage to backside of targets or ends of main array, fan appears to be operating fine 96
116 F.2 TEST 2 FIRE CHRONOLOGY Date: 2 August, 21 Observer: Benjamin Ditch Time (mm:ss) Observation DAQ engines, + 6 s and Lin (zeroes bidirectional probes) -22:1 Test start, no air flow in lab (dehumidifier vents closed, louvered walls closed, fan off) -2:1 Start exhaust air, 2K cfm (time allotted to stabilize air flow) -5:1 HVLS fan on (time allotted to stabilize air flow) : Ignition, rack uprights, offset 2-ft east :12 Boxes replaced in array (moved for ignition) :24 Flames reach 2 nd tier, visibly disturbed by fan air flow :5 Flames reach 3 rd tier 1: Flames reach 4 th tier 1:5 Flames reach 5 th tier 1:15 Flames extend above main array, contained to ignition flue 1:3 Flames extend 3-4 ft above array, visibly disturbed by fan air flow (appear to be forced west) 1:42 1 st sprinkler operation 1:52 2 nd sprinkler operation 2:2 3 rd sprinkler operation 2:13 4 th sprinkler operation, flames contained to eastern aisle, burning along west face of main array at tiers 2 6, ignition of east target array at 2 nd and 3 rd tier 2:5 Flames extend to backside of east target array at 4 th tier, additional sprinkler operation 3:4 Commodity on backside of east target now burning at 4 th tier 3:15 Flames/burning at 3 rd and 4 th tiers on backside of east target, overall fire size appears to be increasing 3:34 11 total sprinkler operations, flames on backside of east target at tiers 3 6 3:45 Exiting lab due to smoke, array completely obscured 3:57 12 th and final sprinkler operation 4:15 Fan appears to be operating fine 6:3 Comments from IR camera: Flames appear to be contained to main and eastern target array, no judgment possible for backside of east target 8:3 No change 25: Test terminated by hose stream; 12 sprinkler operations; damage to main array contained to east row only, fire jump to east target only, substantial damage to backside of east target 97
117 F.3 TEST 3 FIRE CHRONOLOGY Date: 2 September, 21 Observer: Benjamin Ditch Time (mm:ss) Observation DAQ engines, + 6 s and Lin (zeroes bidirectional probes) -22:39 Test start, no air flow in lab (dehumidifier vents closed, louvered walls closed, fan off) -2:39 Start exhaust air, 2K cfm (time allotted to stabilize air flow) -5:39 HVLS fan on (time allotted to stabilize air flow) : Ignition, rack uprights, offset 2-ft east :11 Boxes replaced in array (moved for ignition) :32 Flames reach 2 nd tier, visibly disturbed by fan air flow :44 Flames reach 3 rd tier :54 Flames reach 4 th tier 1:3 Flames reach 5 th tier 1:1 Flames reach 6 th tier 1:12 Flames extend above main array, contained to ignition flue 1:26 Flames extend 2-3 ft above array, visibly disturbed by fan airflow (appear to be forced west) 1:4 Flames burning on the east aisle face of main array at tiers 2-6 1:54 1 st sprinkler operation, southwest of ignition 1:55 2 nd sprinkler operation, southeast of ignition 2:2 3 rd sprinkler operation, northwest of ignition 2:3 4 th (final) sprinkler operation, north east of ignition, flames contained to eastern aisle, burning along west face of main array at tiers 2 6 2:4 Grayish smoke filling lab space a partially obscuring view of array 3: Ignition of east target array at 3 rd tier across from ignition bay 3:24 Fan shut down (1 st sprinkler + 9 s) 5: Fire contained to lower tiers of east, no remaining flames observed on east target 8:1 Fire completely obscured by white smoke, exiting test floor 8:35 Observation from IR camera, fire contained to tiers 2-4 of main array, no burning on east or west target array 25: Test terminated by hose stream; 4 sprinkler operations; damage to main array contained to east row only, fire jump to east target only causing minimal damage 98
118 F.4 TEST 4 FIRE CHRONOLOGY Date: 2 December, 21 Observer: Benjamin Ditch Time (mm:ss) Observation DAQ engines, + 6 s and Lin (zeroes bidirectional probes) -22:9 Test start, no air flow in lab (dehumidifier vents closed, louvered walls closed, fan off) -2:9 Start exhaust air, 2K cfm (time allotted to stabilize air flow) -5:9 HVLS fan on (time allotted to stabilize air flow) : Ignition, rack uprights, offset 2-ft east :1 Boxes replaced in array (moved for ignition) :34 Flames reach 2 nd tier, visibly disturbed by fan air flow :43 Flames reach 3 rd tier 1: Flames extend above main array, contained to ignition flue 1:1 Flames extend!3 ft above array, visibly disturbed by fan air flow (appear to be forced downward) 1:3 Flames extended half way to ceiling (~ 13 ft above array). Fire plume stabilized over ignition area) 1:39 1 st sprinkler operation, northwest of ignition 1:41 2 nd sprinkler operation, northeast of ignition 1:42 3 rd and 4 th (final) sprinkler operation, southeast and southwest of ignition 1:47 Flames reduced to top of main array 1:54 Flames largely extinguished with main array burning primarily at first tier only 3:9 Fan shut down (1 st sprinkler + 9 s), minimal burning on first tier of main array only 25: Test terminated by hose stream; 4 sprinkler operations; damage to main array contained to east row only, no fire jump to target arrays 99
119 G APPENDIX G HVLS FAN SPECIFICATIONS 1

120 H APPENDIX H SUMMARY OF HVLS FAN TESTING TO DATE Table duplicated from reference 5 and prepared by Schirmer Engineering Corporation. 11
RESEARCH TECHNICAL REPORT. SMART Sprinkler Protection for Highly Challenging Fires - Phase 2: Full-Scale Fire Tests in Rack Storage
 RESEARCH TECHNICAL REPORT SMART Sprinkler Protection for Highly Challenging Fires - Phase 2: Full-Scale Fire Tests in Rack Storage SMART Sprinkler Protection for Highly Challenging Fires - Phase 2: Full-Scale
FIRE PROTECTION FOR NON-STORAGE OCCUPANCIES WITH HIGH CEILING CLEARANCES
 FIRE PROTECTIO FOR O-STORAGE OCCUPACIES WITH HIGH CEILIG CLEARACES SOOIL AM, ATOIO BRAGA, HSIAG-CHEG KUG, and JOA M. A. TROUP FM Global Research, 1151 Boston-Providence Turnpike, orwood, Massachusetts
Today's Topics & Sustainability Themes
 2012 Chicago Symposium Fire Safety Design and Sustainable Buildings: Challenges and Opportunities Research Efforts in Fire Protection Engineering are Contributing to Sustainability Goals Dan O Connor,
Protection of Rack Stored Exposed Expanded Group A Plastics with ESFR Sprinklers and Vertical Barriers
 Protection of Rack Stored Exposed Expanded Group A Plastics with ESFR Sprinklers and Vertical Barriers Suppression, Detection and Signaling Research and Applications Conference SupDet 2015 March 5, 2015
Obstructions and ESFR Sprinklers Phase 2 FINAL REPORT
 Obstructions and ESFR Sprinklers Phase 2 FINAL REPORT PREPARED BY: Garner A. Palenske, P.E., and William N. Fletcher, P.E. Aon Fire Protection Engineering San Diego, CA, USA September 2015 Fire Protection
Developing a Fire Test Strategy for Storage Protection Under Sloped Ceilings
 Developing a Fire Test Strategy for Storage Protection Under Sloped Ceilings Justin A. Geiman, Noah L. Ryder Fire & Risk Alliance, Rockville, MD, USA André W. Marshall Custom Spray Solutions, Silver Spring,
Evaluation of Protection for Plastic Containers Using Sprinkler Systems with 1.0% AFFF and Plain Water
 Evaluation of Protection for Plastic Containers Using Sprinkler Systems with 1.0% AFFF and Plain Water BENNIE G. VINCENT* FM Global, Norwood, MA 02062-9102, USA ABSTRACT: Four large-scale fire tests were
RESEARCH TECHNICAL REPORT. Development of Protection Recommendations for Li-ion Battery Bulk Storage: Sprinklered Fire Test
 RESEARCH TECHNICAL REPORT Development of Protection Recommendations for Li-ion Battery Bulk Storage: Sprinklered Fire Test Development of Protection Recommendations for Li-ion Battery Bulk Storage: Sprinklered
Storage Protection Using Horizontal Barriers and Large K-Factor, Extended Coverage In-Rack Sprinklers
 Storage Protection Using Horizontal Barriers and Large K-Factor, Extended Coverage In-Rack Sprinklers Michael Billstroem Director of International Technical Services The Reliable Automatic Sprinkler Co.,
Warehouse Protection of Exposed Expanded Group-A Plastics with Electronic Sprinkler Technology
 Warehouse Protection of Exposed Expanded Group-A Plastics with Sprinkler Technology Zachary L. Magnone, Jeremiah Crocker, Pedriant Peña Tyco Fire Protection Products, Cranston, RI, USA Abstract The focus
Early Suppression Fast Response Sprinklers and Obstructions
 Early Suppression Fast Response Sprinklers and Obstructions Presented at SUPDET 2016 March 1, 2016 San Antonio, Texas Presented by: Garner Palenske, P.E. Senior Vice President Aon Fire Protection Engineering
Model ESFR K-factor Pendent Sprinkler Early Suppression, Fast Response General Description. Sprinkler Identification Number (SIN)
") Worldwide Contacts www.tyco-fire.com Model ESFR-25 25.2 K-factor Pendent Sprinkler Early Suppression, Fast Response General Description TYCO Model ESFR-25 Pendent Sprinklers are Early Suppression, Fast
Worldwide Contacts www.tyco-fire.com Model ESFR-25 25.2 K-factor Pendent Sprinkler Early Suppression, Fast Response General Description TYCO Model ESFR-25 Pendent Sprinklers are Early Suppression, Fast
The Effect of Large Orifice Sprinklers on High-Challenge Fires
 SUPPLEMENT 2 The Effect of Large Orifice Sprinklers on High-Challenge Fires Bill Thomas, P.E. Bill Tomes Editor s Note: Supplement 2 provides background information related to the development and application
1.0 INTRODUCTION. Shaw Industries Group 2 SwRI Project No c
 1.0 INTRODUCTION This report presents the results of a fire performance evaluation in accordance with the 2011 Edition of National Fire Protection Association (NFPA) Standard 265, Standard Methods of Fire
Protection of Storage Under Sloped Ceilings Phase 2 Full Scale Test Matrix
 Protection of Storage Under Sloped Ceilings Phase 2 Full Scale Test Matrix FINAL REPORT BY: Justin A. Geiman, P.E. Noah L. Ryder, P.E. Fire & Risk Alliance Rockville, MD, USA October 2017 2017 Fire Protection
Significant Advancements in Water Based Fire Suppression for Storage Occupancies
 Significant Advancements in Water Based Fire Suppression for Storage Occupancies Presented by: James Golinveaux Sr. Fellow Tyco Fire Protection Products Higher Faster - Further How high can we go? Ceiling
An experimental study of the impact of tunnel suppression on tunnel ventilation
 An experimental study of the impact of tunnel suppression on tunnel ventilation Yoon J. Ko and George Hadjisophocleous Civil and Environmental Engineering, Carleton University 1125 Colonel By Drive, Ottawa,
Protection of Rack Stored Exposed Expanded Group A Plastics with ESFR Sprinklers and Vertical Barriers
 Protection of Rack Stored Exposed Expanded Group A Plastics with ESFR Sprinklers and Vertical Barriers Final Report Prepared by: UL LLC The Fire Protection Research Foundation One Batterymarch Park Quincy,
RESEARCH TECHNICAL REPORT. Numerical Simulations of Sprinkler Activations and Spray Transport under Obstructed, Sloped Ceilings
 RESEARCH TECHNICAL REPORT Numerical Simulations of Sprinkler Activations and Spray Transport under Obstructed, Sloped Ceilings Numerical Simulations of Sprinkler Activations and Spray Transport under
Factors Affecting Efficiency of Water Mist Suppression of Solid Combustible Fires in Open Environment
 Factors Affecting Efficiency of Water Mist Suppression of Solid Combustible Fires in Open Environment Hong-Zeng (Bert) Yu FM Global 16 th International Water Mist Conference September 21-22, 2016 Vienna,
High Ceiling Protection
 High Ceiling Protection High Ceiling Protection An Investigation of Automatic Sprinkler Protection of Buildings with Non-Storage Occupancies and High Clearances Company Confidential 2 Background New architectural
RESEARCH TECHNICAL REPORT. SMART Sprinkler Protection for Highly Challenging Fires Phase 1: System Design and Function Evaluation
 RESEARCH TECHNICAL REPORT SMART Sprinkler Protection for Highly Challenging Fires Phase : System Design and Function Evaluation SMART Sprinkler Protection for Highly Challenging Fires Phase : System Design
ESFR PENDENT SPRINKLER VK510 (K25.2) TECHNICAL DATA
 TECHNICAL DATA") Page 1 of 7 1. DESCRIPTION Viking Early Suppression Fast Response (ESFR) Pendent Sprinkler VK510 incorporates the capability to suppress specific high-challenge fires. The addition of a larger K-Factor
Page 1 of 7 1. DESCRIPTION Viking Early Suppression Fast Response (ESFR) Pendent Sprinkler VK510 incorporates the capability to suppress specific high-challenge fires. The addition of a larger K-Factor
Experimental Study to Evaluate Smoke Stratification and Layer Height in Highly Ventilated Compartments
 Experimental Study to Evaluate Smoke Stratification and Layer Height in Highly Ventilated Compartments Jason Huczek a, Marc Janssens a, Kentaro Onaka b, Stephen Turner c a SwRI, 6220 Culebra Road, San
Sprinkler Identification Numbers
 Technical Services: Tel: (800) 381-9312 / Fax: (800) 791-50 Model Early Suppression Fast Response Pendent Sprinklers 16.8 K-factor General Description The Model Pendent Sprinklers (Ref. Figure 1) are Early
High challenge warehouse case study Summary
 High challenge warehouse case study Summary February 19, 2010 Richard Gallagher Michael Gollner Zurich Services Corporation Objectives Review the results of the high challenge warehouse workshop Recognize
Test One: The Uncontrolled Compartment Fire
 The University of Edinburgh BRE Centre for Fire Safety Engineering One Day Symposium on The Dalmarnock Fire Tests: Experiments & Modelling Test One: The Uncontrolled Compartment Fire Cecilia Abecassis
Requirements for the protection of High-Piled Combustible Storage (HPCS) Effective Date: January 2011
 Effective Date: January 2011") 1.0 GENERAL: Requirements for the protection of High-Piled Combustible Storage (HPCS) Effective Date: January 2011 1.1 PURPOSE -The intent of this guideline is to provide the requirements for the protection
1.0 GENERAL: Requirements for the protection of High-Piled Combustible Storage (HPCS) Effective Date: January 2011 1.1 PURPOSE -The intent of this guideline is to provide the requirements for the protection
Spray sprinkler system
 Protection, prevention and environmental impact of fire in a tire storage SNCP experience feedback report Spray sprinkler system Recommendations on fire protection in tyre storage facilities using spray
TECHNICAL DATA. * Refer the Approval Chart on page 120c and Design Criteria on page 120d for culus and FM approval requirements that must be followed.
 March 7, 2008 Sprinkler 120a Telephone: 269-945-9501 Technical Services 877-384-5464 Fax: 269-818-1680 Email: techsvcs@vikingcorp.com 1. DESCRIPTION Viking Early Suppression Fast Response (ESFR) Pendent
Model ESFR-25 Early Suppression, Fast Response Pendent Sprinklers 25.2 K-factor General Description
 Technical Services: Tel: (800) 381-9312 / Fax: (800) 791-5500 Email: techserv@tycofp.com Model ESFR-25 Early Suppression, Fast Response Pendent Sprinklers 25.2 K-factor General Description The Tyco Model
esfr pendent sprinkler vk510 (k25.2)
") Page 1 of 7 1. DESCRIPTION Viking Early Suppression Fast Response (ESFR) Pendent Sprinkler VK510 incorporates the capability to suppress specific high-challenge fires. The addition of a larger K-Factor
Page 1 of 7 1. DESCRIPTION Viking Early Suppression Fast Response (ESFR) Pendent Sprinkler VK510 incorporates the capability to suppress specific high-challenge fires. The addition of a larger K-Factor
ESFR PENDENT SPRINKLER VK500 (K14.0) TECHNICAL DATA
 TECHNICAL DATA") Page 1 of 6 1. DESCRIPTION Viking Early Suppression Fast Response (ESFR) Pendent Sprinkler VK500 is a fast response fusible element type sprinkler designed for early fire suppression. With a 14.0 (202
Page 1 of 6 1. DESCRIPTION Viking Early Suppression Fast Response (ESFR) Pendent Sprinkler VK500 is a fast response fusible element type sprinkler designed for early fire suppression. With a 14.0 (202
Storage Sprinkler U.S. Quick Reference Guide
 Storage U.S. Reference Guide This guide is intended for general reference only. Prior to the design, layout, and/or installation of any sprinkler system, please refer to Viking s technical documentation
The Loss prevention Council. Phase 1 report
 Phase 1 report Title: Investigation of the suitability of the Actual Delivered Density Apparatus (ADD) for the performance evaluation of standard sprinklers as described in Insurance Services project proposal
TECHNICAL DATA OBSOLETE
 November 2, 2007 Sprinkler 113a 1. DESCRIPTION The Viking Standard Response High Challenge Upright Large-Drop Sprinkler VK540 is a thermosensitive, glass-bulb sprinkler intended for use in protecting high
TECHNICAL DATA OBSOLETE. * Refer the Approval Chart on page 121c and Design Criteria on page 121d for FM approval requirements that must be followed.
 Sprinkler 121a 1. DESCRIPTION Viking Early Suppression Fast Response (ESFR) Upright Sprinkler VK520 is a fast response fusible element type sprinkler designed for early fire suppression. With a 14.0 (202
Food Service Technology Center
 Food Service Technology Center IR Energy Habanero HAB-M50 Gas Patio Heater Test Report Application of ASTM Standard Test Method FF2644-07 September 2014 Prepared by: Elan Frantz Trey Young Fisher-Nickel,
Fire Spread in Large Industrial Premises and Warehouses
 Anders Lönnermark, Haukur Ingason Fire Spread in Large Industrial Premises and Warehouses BRANDFORSK project 63-21 SP Swedish National Testing and Research Institute SP Fire Technology SP REPORT 25:21
TECHNICAL DATA. * Refer the Approval Charts and Design Criteria on pages 3-5 for culus Listing and FM Approval requirements that must be followed.
 Page of 5. DESCRIPTION Viking Early Suppression Fast Response (ESFR) Pendent Sprinkler VK506 incorporates the capability to suppress specific high-challenge fires. The addition of a larger K-Factor allows
Tire Storage. Michigan Fire Inspectors Society Fall Conference
 Tire Storage Michigan Fire Inspectors Society Fall Conference September 15, 2016 This material, including the illustrations, represent the opinion of the author and instructor. This material is not designed,
Chapter 17, Initiating Devices
 Chapter 17, Initiating Devices Summary. Chapter 17 was Chapter 5 in NFPA 72-2007. The term authority having jurisdiction is replaced in some sections by the term other governing laws, codes, or standards.
Model ESFR-17 Early Suppression, Fast Response Upright Sprinklers 16.8 K-factor General Description
 Technical Services: Tel: (800) 381-9312 / Fax: (800) 791-5500 Email: techserv@tycofp.com Model ESFR-17 Early Suppression, Fast Response Upright Sprinklers 16.8 K-factor General Description The Tyco Model
ICC CODE CORNER 2012 IFC Code & Commentary
 SECTION 910 SMOKE AND HEAT VENTS 910.1 General. Where required by this code or otherwise installed, smoke and heat vents or mechanical smoke exhaust systems and draft curtains shall conform to the requirements
Model ESFR-17 Dry Type Pendent Sprinklers Early Suppression Fast Response 16.8 K-factor General Description
 Technical Services 800-381-9312 +1-401-781-8220 www.tyco-fire.com Model ESFR-17 Dry Type Pendent Sprinklers Early Suppression Fast Response 16.8 K-factor General Description The TYCO Model ESFR-17 Dry
esfr pendent sprinkler vk510 (k25.2)
") February 27, 2009 Sprinkler 124a 1. DESCRIPTION Viking Early Suppression Fast Response (ESFR) Pendent Sprinkler VK510 incorporates the capability to suppress specific high-challenge fires. The addition
February 27, 2009 Sprinkler 124a 1. DESCRIPTION Viking Early Suppression Fast Response (ESFR) Pendent Sprinkler VK510 incorporates the capability to suppress specific high-challenge fires. The addition
Model/Sprinkler Identification Number JULY, 2011 WARNINGS
 Technical Services: Tel: (800) 381-9312 / Fax: (800) 791-5500 Series EC-11 & EC-14 11.2 and 14.0 K-factor Extended Coverage (Light and Ordinary Hazard) Upright, Pendent, and Recessed Pendent Sprinklers
Model JL-14 (SIN RA1812) K14.0 (200 metric) Early Suppression Fast Response Sprinkler
 K14.0 (200 metric) Early Suppression Fast Response Sprinkler") Bulletin 018 Rev. H Model JL-14 (SIN RA1812) K14.0 (200 metric) Early Suppression Fast Response Sprinkler Bulletin 018 Rev. H Product Description The Reliable Model JL-14 Early Suppression Fast Response
Bulletin 018 Rev. H Model JL-14 (SIN RA1812) K14.0 (200 metric) Early Suppression Fast Response Sprinkler Bulletin 018 Rev. H Product Description The Reliable Model JL-14 Early Suppression Fast Response
TECHNICAL DATA NOTICE
 Page 1 of 5 1. DESCRIPTION Viking Early Suppression Fast Response (ESFR) Upright Sprinkler VK520 is a fast response fusible element type sprinkler designed for early fire suppression. With a 14.0 (202
Series EC-11 and EC-14 Sprinklers, 11.2 K and 14.0 K Upright, and Pendent Extended Coverage Light and Ordinary Hazard General Description
 Technical Services 800-381-9312 +1-401-781-8220 www.tyco-fire.com Series EC-11 and EC-14 Sprinklers, 11.2 K and 14.0 K Upright, and Pendent Extended Coverage Light and Ordinary Hazard General Description
Obstructions and ESFR Sprinklers Phase 1
 Obstructions and ESFR Sprinklers Phase 1 Final Report Prepared by: Garner A. Palenske, P.E. William N. Fletcher Aon Fire Protection Engineering Corporation San Diego, CA October 2014 Fire Protection Research
COSTCO, SAN FRANCISCO A PRESCRIPTIVE AND PERFORMANCE BASED ANALYSIS OF FIRE PROTECTION SYSTEMS AND DESIGN
 COSTCO, SAN FRANCISCO A PRESCRIPTIVE AND PERFORMANCE BASED ANALYSIS OF FIRE PROTECTION SYSTEMS AND DESIGN Presented by Ian Levine June, 2016 Photo courtesy of Google Maps PRESENTATION OVERVIEW BUILDING
Plan Submittal Checklist
 City of Aurora Public Works Department HIGH-PILED COMBUSTIBLE STORAGE Plan Submittal Checklist Building Division 15151 E. Alameda Parkway, Ste 2400 Aurora, CO 80012 303-739-7420 Fax: 303-739-7551 Project
Thermal Sensitivity Evaluation of Recessed, Flush and Concealed Sprinklers
 Thermal Sensitivity Evaluation of Recessed, Flush and Concealed Sprinklers ROBERT G. BILL, JR, and GUNNAR HESKESTAD Factory Mutual Research Corporation 11 51 Boston-Providence Turnpike Norwood, MA 02062
esfr dry pendent sprinkler Vk502 (k14.0)
") Page 1 of 11 1. DESCRIPTION Viking Early Suppression Fast Response (ESFR) Dry Pendent Sprinkler VK502 is a fast response fusible element type sprinkler designed for use in storage areas subject to freezing
Page 1 of 11 1. DESCRIPTION Viking Early Suppression Fast Response (ESFR) Dry Pendent Sprinkler VK502 is a fast response fusible element type sprinkler designed for use in storage areas subject to freezing
Developing Sprinkler System Design Criteria for Flammable and Combustible Liquid Storage
 Developing Sprinkler System Design Criteria for Flammable and Combustible Liquid Storage David P. Nugent Aon Risk Consultants Introduction Safe handling and storage of flammable and combustible liquids
Series ELO-231B 11.2 K-factor Upright and Pendent Sprinklers. Standard Response, Standard Coverage, General Description
 Technical Services: Tel: (800) 381-9312 / Fax: (800) 791-5500 Customer Service/Sales: Tel: (215) 362-0700 / (800) 523-6512 Fax: (215) 362-5385 Series ELO-231B 11.2 K-factor Upright and Pendent Sprinklers
Series ELO-231 Upright and Pendent Sprinklers. Standard Response, Standard Coverage, General Description
 Technical Services: Tel: (800) 381-9312 / Fax: (800) 791-5500 Customer Service/Sales: Tel: (215) 362-0700 / (800) 523-6512 Fax: (215) 362-5385 Series ELO-231 Upright and Pendent Sprinklers Standard Response,
Model ESFR-17 Dry Type Pendent Sprinklers Early Suppression Fast Response 16.8 K-factor General Description
 Worldwide Contacts www.tyco-fire.com Model ESFR-17 Dry Type Pendent Sprinklers Early Suppression Fast Response 16.8 K-factor General Description The TYCO Model ESFR-17 Dry Type Pendent Sprinklers (TY7229)
Model ESFR K-factor Dry Type Pendent Sprinklers Early Suppression, Fast Response General Description
 Worldwide Contacts www.tyco-fire.com Model ESFR-17 16.8 K-factor Dry Type Pendent s Early Suppression, Fast Response General Description TYCO Model ESFR-17 Dry Type Pendent s are Early Suppression, Fast
SCHULTE & ASSOCIATES Building Code Consultants 880D Forest Avenue Evanston, IL /
 SCHULTE & ASSOCIATES Building Code Consultants 880D Forest Avenue Evanston, IL 60202 fpeschulte@aol.com 504/220-7475 A CRITIQUE OF HUGHES ASSOCIATES, INC. PAPER TITLED: Analysis of the Performance of Ganged
TECHNICAL DATA. Refer to the Approval Chart and Design Criteria for UL and FM Listing/Approval requirements that must be followed.
 Page 1 of 10 1. DESCRIPTION Viking Early Suppression Fast Response (ESFR) Dry Pendent Sprinkler VK504 is a fast response fusible element type sprinkler designed for use in storage areas subject to freezing
Series EC-11 and EC-14 Sprinklers, 11.2 K and 14.0 K Upright and Pendent Extended Coverage Light and Ordinary Hazard General Description
 Worldwide Contacts www.tyco-fire.com Series EC-11 and EC-14 Sprinklers, 11.2 K and 14.0 K and Pendent Extended Coverage Light and Ordinary Hazard General Description TYCO Series EC-11 and EC-14 Extended
Method for testing the suppression performance of fire suppression systems installed in engine compartments of buses and coaches
 2014-09-19 SP Method 4912 Method for testing the suppression performance of fire suppression systems installed in engine compartments of buses and coaches 2014-09-19 page 2 (17) Copyright This test method
IMO. 4 June 1999 GUIDELINES FOR THE APPROVAL OF ALTERNATIVE FIXED WATER-BASED FIRE-FIGHTING SYSTEMS FOR SPECIAL CATEGORY SPACES
 INTERNATIONAL MARITIME ORGANIZATION 4 ALBERT EMBANKMENT LONDON SE1 7SR Telephone: 0171-735 7611 Fax: 0171-587 3210 Telex: 23588 IMOLDN G Ref. T4/4.01 IMO E MSC/Circ.914 4 June 1999 GUIDELINES FOR THE APPROVAL
The first tunnel fire. Benefits of fire
 Benefits of fire suppression Quantifying the effects of suppression on energy release. This article by Fathi Tarada, managing director of fire safety, risk management, ventilation and CFD consultant Mosen
Certificate of Compliance
 Certificate of Compliance This certificate is issued for the following: KS103SSF, KS103MSF, AND KS110CTF PANELS AS CLASS 1 INTERIOR WALL AND CEILING PANELS FOR INSTALLATION WITH NO HEIGHT RESTRICTION Prepared
Series TY-B 2.8, 5.6, and 8.0 K-factor Upright, Pendent, and Recessed Pendent Sprinklers Standard Response, Standard Coverage General Description
 Technical Services: Tel: (800) 38-932 / Fax: (800) 79-5500 Series TY-B 2.8, 5.6, 8.0 K-factor Upright, Pendent, Recessed Pendent Sprinklers Stard Response, Stard Coverage General Description IMPORTANT
SPRINKLER TECHNOLOGY:
 SPRINKLER TECHNOLOGY: CURRENT STATE OF THE ART AND GLIMPSE INTO THE CRYSTAL BALL James Golinveaux Senior Fellow Tyco Fire Protection Products First known patent for automatic suppression system - 1723
WATER MIST FIRE PROTECTION SYSTEMS FOR INDUSTRIAL CABLE TUNNELS AND TURBINE HALLS
 WATER MIST FIRE PROTECTION SYSTEMS FOR INDUSTRIAL CABLE TUNNELS AND TURBINE HALLS Jukka Vaari 1, Amit Lior 2 1 2 VTT Technical Research Centre of Finland, Espoo, Finland Marioff Corporation Oy, Vantaa,
Model ESFR K-factor Dry Type Pendent Sprinklers Early Suppression, Fast Response General Description
 Worldwide Contacts www.tyco-fire.com Model ESFR-17 16.8 K-factor Dry Type Pendent s Early Suppression, Fast Response General Description TYCO Model ESFR-17 Dry Type Pendent s are Early Suppression, Fast
Design & Construction Standards, Revised January
 PART 1 GENERAL 1.01 Scope of Standard A. This standard provides general requirements of The University of Texas at Austin for fire-extinguishing systems other than water-based fire suppression systems.
SOUTHWEST RESEARCH INSTITUTE
 SOUTHWEST RESEARCH INSTITUTE 6220 CULEBRA ROAD 78238-5166 P.O. DRAWER 28510 78228-0510 SAN ANTONIO, TEXAS, USA (210) 684-5111 WWW.SWRI.ORG CHEMISTRY AND CHEMICAL ENGINEERING DIVISION FIRE TECHNOLOGY DEPARTMENT
Sprinkler Identification Numbers. TY3351 Horizontal TY3451 Vertical. Technical Data
 Worldwide Contacts www.tyco-fire.com Series TY-B 5.6 K-factor Standard Response, Standard Coverage General Description described in this data sheet are standard response - standard coverage, decorative
Box-in-Box Cold Storage Fire Protection Options
 Box-in-Box Cold Storage Fire Protection Options FireAustralia TYCO Model ESFR-17 Dry Type Pendent Sprinkler Jeffrey Barkley Tyco Fire Protection Products Objective Common Box-inBox Cold Storage Challenges
GUIDELINES FOR THE APPROVAL OF EQUIVALENT FIXED GAS FIRE-EXTINGUISHING SYSTEMS, AS REFERRED TO IN SOLAS 74, FOR MACHINERY SPACES AND CARGO PUMP-ROOMS
 12 December 1996 Ref. T4/4.01 GUIDELINES FOR THE APPROVAL OF EQUIVALENT FIXED GAS FIRE-EXTINGUISHING SYSTEMS, AS REFERRED TO IN SOLAS 74, FOR MACHINERY SPACES AND CARGO PUMP-ROOMS 1 The Maritime Safety
The Protection of Machinery Spaces by means of the Local Application of Water Mist. Dr. Tim R. Nichols CPhys FIFireE
 The Protection of Machinery Spaces by means of the Local Application of Water Mist Dr. Tim R. Nichols CPhys FIFireE 2017 Johnson Controls. All rights reserved. Tyco Fire Products LP is a subsidiary of
Series TY-FRB 5.6 K-factor Horizontal and Vertical Sidewall Sprinklers Quick Response, Standard Coverage General Description
 Worldwide Contacts www.tyco-fire.com Series TY-FRB 5.6 K-factor Horizontal Quick Response, Standard Coverage General Description described in this data sheet are quick response -standard coverage, decorative
Sprinkler Identification Numbers
 Worldwide Contacts www.tyco-fire.com Series TY-FRB 5.6 K-factor Horizontal Quick Response, Standard Coverage General Description IMPORTANT Always refer to Technical Data Sheet TFP700 for the INSTALLER
SFPE Austin/San Antonio Chapter Meeting
 SFPE Austin/San Antonio Chapter Meeting 14 May 2014 Kerry M. Bell, P.E. Principal Engineer UL LLC 2014 Underwriters Laboratories Inc. Overview of Discussion Updates on the following areas o Dry sprinkler
Series ELO K-factor Upright and Pendent Sprinklers Standard Response, Standard Coverage General Description
 Worldwide Contacts www.tyco-fire.com Series ELO-231 11.2 K-factor Upright and Pendent Sprinklers Standard Response, Standard Coverage General Description Response, Standard Coverage Upright and Pendent
Series EC K-factor Extended Coverage (Light Hazard) Pendent and Recessed Pendent Sprinklers General Description
 Pendent and Recessed Pendent Sprinklers General Description") Worldwide Contacts www.tyco-fire.com Series EC-8 8.0 K-factor Extended Coverage (Light Hazard) Pendent and Recessed Pendent Sprinklers General Description Pendent Sprinklers are decorative glass bulb sprinklers
Worldwide Contacts www.tyco-fire.com Series EC-8 8.0 K-factor Extended Coverage (Light Hazard) Pendent and Recessed Pendent Sprinklers General Description Pendent Sprinklers are decorative glass bulb sprinklers
ESFR sprinkler system
 Protection, prevention and environmental impact of fire in a tire storage SNCP experience feedback report ESFR sprinkler system Recommendations on fire protection in tyre storage facilities using ESFR
Artificial Trees and Fire Performance
 2017 NFPA Conference & Expo Artificial Trees and Fire Performance Presented by: Dwayne Sloan Manager, Principal Engineers Building Materials & Suppression UL LLC Learning Objectives Frame the Fire Problem
A. Hydraulic calculations shall be prepared in accordance with Chapter 23 of NFPA 13 with the following exceptions:
 SECTION 21 13 13 WET-PIPE FIRE SPRINKLER SYSTEM PART 1 - GENERAL 1.1 RELATED DOCUMENTS: A. The Conditions of the Contract and applicable requirements of Division 1, "General Requirements", and Section
HVLS Fans and Sprinkler Operation Phase 1 Research Program
 HVLS Fans and Sprinkler Operation Phase 1 Research Program Final Report Prepared by: Schirmer Engineering Corporation \ The Fire Protection Research Foundation One Batterymarch Park Quincy, MA, USA 02169-7471
Microgrid Fault Protection Based on Symmetrical and Differential Current Components
 Microgrid Fault Protection Based on Symmetrical and Differential Current Components Prepared for Public Interest Energy Research California Energy Commission Prepared by Hassan Nikkhajoei and Robert H.
Sprinkler Identification Numbers
 Worldwide Contacts www.tyco-fire.com Series EC-11 and EC-14 Sprinklers, 11.2 K and 14.0 K and Pendent Extended Coverage Light and Ordinary Hazard General Description Extended Coverage and Pendent Sprinklers
Smoke Layer Height and Heat Flow through a Door
 Smoke Layer Height and Heat Flow through a Door 2018 Smoke Layer Height and Heat Flow through a Door In this tutorial you will simulate a growing fire in the corner of a 5m x 5m room. The room has a 1m
Southern California Gas Company Customer Programs Department
 Appliance Test Report SCGAT140220A Revision 0 Issued Date: March 2014 Duke 613Q-G1V Gas Convection Oven Performance Test Per ASTM F1496-13 Southern California Gas Company Customer Programs Department Food
esfr dry pendent sprinkler Vk501 (k14.0)
") September 13, 2012 Sprinkler 122a 1. DESCRIPTION Viking Early Suppression Fast Response (ESFR) Dry Pendent Sprinkler VK501 is a fast response fusible element type sprinkler designed for use in storage
September 13, 2012 Sprinkler 122a 1. DESCRIPTION Viking Early Suppression Fast Response (ESFR) Dry Pendent Sprinkler VK501 is a fast response fusible element type sprinkler designed for use in storage
1. Revise and A to read as follows:
 NFPA 13D-2010 Standard for the Installation of Sprinkler Systems in One- and Two-Family Dwellings and Manufactured Homes TIA Log No.: 1028R Reference: 8.1.2, 8.1.3, A.8.1.2, and A.8.1.3 Comment Closing
Storage Sprinkler. Model LP-46 (SIN) V4603, K25, Standard Response Storage Upright Sprinkler, Patent Pending
 V4603, K25, Standard Response Storage Upright Sprinkler, Patent Pending") FireLock LP-46 Low Pressure Storage Sprinkler This storage sprinkler was designed for controlling fires in single, double and multiple row rack storage of up to Cartoned, Unexpanded, Group A plastic commodities
FireLock LP-46 Low Pressure Storage Sprinkler This storage sprinkler was designed for controlling fires in single, double and multiple row rack storage of up to Cartoned, Unexpanded, Group A plastic commodities
Summary of Comments (Washington Revisions November 7, 2000) Update November 27, 2000
 Update November 27, 2000") SAE Alternate Refrigerant Cooperative Research Program Summary of Comments (Washington Revisions November 7, 2000) Update November 27, 2000 To: Alternate Refrigerant Task Force Members From: Ward Atkinson
SAE Alternate Refrigerant Cooperative Research Program Summary of Comments (Washington Revisions November 7, 2000) Update November 27, 2000 To: Alternate Refrigerant Task Force Members From: Ward Atkinson
Sprinkler Identification Number (SIN)
") Worldwide Contacts www.tyco-fire.com Series DS-3 Dry-Type Sprinklers 11.2K Horizontal Sidewall Standard Response, Extended Coverage General Description TYCO Series DS-3 Dry-Type Sprinklers, 11.2K Horizontal
Worldwide Contacts www.tyco-fire.com Series DS-3 Dry-Type Sprinklers 11.2K Horizontal Sidewall Standard Response, Extended Coverage General Description TYCO Series DS-3 Dry-Type Sprinklers, 11.2K Horizontal
International Water Mist Conference, Istanbul October 22-23, 2014 The background and development of the guidelines in IMO Resolution A.
 International Water Mist Conference, Istanbul October 22-23, 2014 The background and development of the guidelines in IMO Resolution A.800(19) Magnus Arvidson SP Fire Research SP Technical Research Institute
Series TY-FRB 2.8, 4.2, 5.6, and 8.0 K-Factor Upright, Pendent, and Recessed Pendent Sprinklers Quick Response, Standard Coverage
 Worldwide Contacts www.tyco-fire.com Series 2.8,.2, 5.6, 8.0 K-Factor Upright, Pendent, Recessed Pendent Sprinklers Quick Response, Stard Coverage General Description IMPORTANT Always refer to Technical
Table EXIT ACCESS TRAVEL DISTANCE a OCCUPANCY SYSTEM SYSTEM. A, E, F-1, I-1, M, b,d R, S-1. B c. F-2, S-2, U c
 Table 1015.1 EXIT ACCESS TRAVEL DISTANCE a WITHOUT SPRINKLER WITH SPRINKLER OCCUPANCY SYSTEM SYSTEM A, E, F-1, I-1, M, 200 250 b,d R, S-1 B 200 300 c F-2, S-2, U 300 400 c No Change to Other Entries in
Validation of a Smoke Detection Performance Prediction Methodology. Volume 2. Large-scale room fire tests
 Validation of a Smoke Detection Performance Prediction Methodology Volume 2. Large-scale room fire tests Prepared by: Frederick W. Mowrer and James A. Milke University of Maryland Pravinray Gandhi Underwriters
Series TY-FRB 2.8, 4.2, 5.6, and 8.0 K-Factor Upright, Pendent, and Recessed Pendent Sprinklers Quick Response, Standard Coverage General Description
 Worldwide Contacts www.tyco-fire.com Series 2.8,.2,.6, 8.0 K-Factor Upright, Pendent, Recessed Pendent Sprinklers Quick Response, Stard Coverage General Description The TYCO Series, 2.8,.2,.6, 8.0 K-factor,