Piscataqua Region Environmental Planning Assessment
|
|
|
- Joshua West
- 5 years ago
- Views:
Transcription

 at University of New Hampshire Scholars'")
1 University of New Hampshire University of New Hampshire Scholars' Repository PREP Reports & Publications Institute for the Study of Earth, Oceans, and Space (EOS) Piscataqua Region Environmental Planning Assessment Derek Sowers Piscataqua Region Estuaries Partnership Follow this and additional works at: Part of the Marine Biology Commons Recommended Citation Sowers, D., (2010) Piscataqua Region Environmental Planning Assessment. Piscataqua Region Estuaries Partnership. University of New Hampshire Durham, NH This Report is brought to you for free and open access by the Institute for the Study of Earth, Oceans, and Space (EOS) at University of New Hampshire Scholars' Repository. It has been accepted for inclusion in PREP Reports & Publications by an authorized administrator of University of New Hampshire Scholars' Repository. For more information, please contact
2 Piscataqua Region Environmental Planning Assessment This report is available at University of New Hampshire Scholars' Repository:


3 Piscataqua Region Estuaries Partnership Pi s c ata q u a Re g i o n En v i r o n m e n ta l Pl a n n i n g Assessment An evaluation of environmental planning efforts and land use regulations as of 2009 for the 52 communities in the Piscataqua Region.
4 The Piscataqua Region Environmental Planning Assessment documents the current status of environmental planning efforts and land use regulations for each of the 52 communities in the Piscataqua Region watershed. A summary of 80 questions associated with municipal regulatory and non-regulatory approaches to resource management is included as well as recommended actions to improve natural resource protection across the watershed. Author: Derek Sowers Project Manager, Piscataqua Region Estuaries Partnership March 2010 This report was funded in part by the U.S. Environmental Protection Agency through an agreement with the University of New Hampshire and a grant from Barbara K. & Cyrus B. Sweet III Fund of the New Hampshire Charitable Foundation Piscataqua Region. Recommended Citation: Sowers, D., (2010) Piscataqua Region Environmental Planning Assessment. Piscataqua Region Estuaries Partnership. University of New Hampshire Durham, NH REPORT DISTRIBUTION AND DATA ACCESS The Piscataqua Region Environmental Planning Assessment (PREPA) report was distributed in March 2010 to planning boards, conservation commissions, town administrators, and municipal planning staff in all 52 municipalities in the Piscataqua Region Estuaries Partnership s focus area. Reports were also provided to the four regional planning commissions. An electronic copy (PDF format) is available on the PREP website at Municipal data collected and analyzed in this report are contained in a database maintained by PREP. To obtain a copy of the Microsoft Access database or this report, contact Derek Sowers at or derek.sowers@unh.edu. PREP intends to maintain and update the municipal data contained in this report; however, the schedule and process for conducting updates has not been finalized. Report corrections or updates to Derek Sowers at PREP. University of New Hampshire 131 Main Street, Nesmith Hall Durham, NH The Piscataqua Region Estuaries Partnership (PREP), formerly known as the New Hampshire Estuaries Project, was formed in 1995 with the mission to protect, restore, and monitor the health of the Hampton-Seabrook Estuary and Great Bay Estuary. PREP addresses a variety of water quality, land use, living resources, habitat protection, and habitat restoration issues in 52 communities located in coastal watersheds in Maine and New Hampshire. Printed on recycled paper PREP is one of 28 National Estuary Programs of U.S. Environmental Protection Agency (authorized under Section320 of the Clean Water Act) and is governed by a 27-person Management Committee comprised of representatives from Maine and New Hampshire municipalities, planning commissions, natural resource agencies, watershed groups, conservation organizations, energy producers, researchers, and anglers. PREP is administered through an agreement with the University of New Hampshire and implements a Comprehensive Conservation and Management Plan for the region s estuaries. Learn more at
5 Contents 5 ACKNOWLEDGEMENTS 6 EXECUTIVE SUMMARY Project Purpose... 7 Background and Statement of Need... 7 Limitations INTRODUCTION 9 METHODS 12 RESULTS AND ANALYSIS Municipal Regulations and Conservation Strategies...12 Conservation Fundamentals...12 Wildlife Habitat...14 Wetland Protection...14 Shoreland Buffers Stormwater Management...27 Erosion & Sediment Control Drinking Water Protection...37 Floodplain Management Impervious Surface Limits Other Regulatory Measures...42 Non-Regulatory Conservation Strategies...44 Public Availability of Electronic Maps...46 Comparison of Key Environmental Regulatory Standards: New Hampshire and Maine CONCLUSIONS AND RECOMMENDATIONS Priorities for Improvement at the Municipal Level...50 State Level Policy Differences PREP Management Plan: Municipal Environmental Planning Goals REFERENCES 56 APPENDICES Appendix A. Piscataqua Region Environmental Planning Assessment (PREPA) Form Appendix B. Wetland Buffer and Setback Regulations in the Piscataqua Region Watershed by Municipality...60 Appendix C. No Disturbance and/or Managed Buffer Widths (Pooled Results) for Different-Sized Waterbodies in the Piscataqua Region Watershed by Municipality Appendix D. Novel or Innovative Conservation Approaches
6 page Tables 13 Table 1. Fundamentals of Conservation Planning in the 52 Towns in the Piscataqua Region Watershed 13 Table 2. Status of Comprehensive Plans for Maine Municipalities in the Piscataqua Region Watershed 15 Table 3. Wildlife Habitat Consideration in Planning Decisions within the Piscataqua Region Watershed 16 Table 4. Municipal Wetland Protection Strategies in the Piscataqua Region Watershed 20 Table 5. How Do Municipalities Identify Wetlands Subject to Their Regulatory Jurisdiction? 29 Table 6. Location of Stormwater Regulations within Municipal Documents in the Piscataqua Region Watershed 30 Table 7. Stormwater Management Requirements of Municipal Regulations in the Piscataqua Region Watershed 31 Table 8. Stormwater Performance Standards of Municipal Regulations Relative to Model Ordinance Standards 33 Table 9. Location of Erosion & Sediment Control Regulations within Municipal Documents in the Piscataqua Region Watershed 33 Table 10. Erosion & Sediment Control Performance Standards of Municipal Regulations Relative to Model Ordinance Standards 34 Table 11. Erosion & Sediment Control Site Inspection Requirements by Municipalities in the Piscataqua Region Watershed 35 Table 12. Erosion & Sediment Control Technical Manual References by Municipality in the Piscataqua Region Watershed 37 Table 13. Drinking Water Protection Strategies of Municipalities in the Piscataqua Region Watershed 39 Table 14. Hazard Mitigation Plans by Municipality in the Piscataqua Region Watershed 40 Table 15. Floodplain Mapping and Development Prohibitions by Municipality in the Piscataqua Region Watershed 41 Table 16. Impervious Surface Limits (% of lot coverage) by Zoning Category in Municipalities in the Piscataqua Region Watershed 42 Table 17. Conservation Subdivision Requirements in Municipalities of the Piscataqua Region Watershed 43 Table 18. Other Regulatory Provisions 44 Table 19. Open Space Plans and Conservation Easements in Municipalities of the Piscataqua Region Watershed 45 Table 20. Investment of Public Municipal Funds in Land Conservation in the Piscataqua Region 46 Table 21. Renewable Energy Incentives and Committees 47 Table 22. Availability of Electronic Maps of Natural Resource Features and Overlay Districts by Municipality in the Piscataqua Region Watershed 48 Table 23. Comparison Table of New Hampshire and Maine State Regulations for Select Water Resource and Habitat Protection Issues 54 Table 24. Regulatory Municipal Planning Targets for PREP Management Plan 54 Table 25. Non-Regulatory Municipal Planning Targets for PREP Management Plan page Figures 7 Figure 1. Map of the Piscataqua Region Watershed 17 Figure 2. No Soil or Vegetation Disturbance Buffer Widths for Wetlands in the Piscataqua Region Watershed by Municipality 19 Figure 3. Development and Fertilizer Application Setbacks for Wetlands in the Piscataqua Region Watershed by Municipality 19 Figure 4. No Vegetation Disturbance Buffer Widths for Tidal Wetlands in the Piscataqua Region Watershed by Municipality 22 Figure 5. Environmental Services Provided by Various Shoreland Buffer Widths 22 Figure 6. Strahler Stream Order Diagram 22 Figure 7. No Disturbance Buffer Widths for Different-Sized Waterbodies in the Piscataqua Region Watershed by Municipality 23 Figure 8. Managed Buffer Widths for Different-Sized Waterbodies in the Piscataqua Region Watershed by Municipality 23 Figure 9. No Disturbance and/or Managed Buffer Widths for Different-Sized Waterbodies in the Piscataqua Region Watershed by Municipality 24 Flooding on the Exeter River in Exeter, NH 25 Figure 10. Buffers and Setbacks for Tidal Shorelands in the Piscataqua Region Watershed by Municipality 25 Figure 11. Septic Setback Distances for Different-Sized Waterbodies in the Piscataqua Region Watershed by Municipality 26 Figure 12. Primary Structure Setback Distances for Different-Sized Waterbodies in the Piscataqua Region Watershed by Municipality 26 Figure 13. Fertilizer Application Setback Distances for Different-Sized Waterbodies in the Piscataqua Region Watershed by Municipality

7 acknowledgements This project was made possible with generous grant support from the Barbara K. & Cyrus B. Sweet III Fund of the New Hampshire Charitable Foundation Piscataqua Region. PREP s Land Use Team and other interested parties helped guide the assessment questions and format. Participants for this project included: Phil Auger, UNH Cooperative Extension Emily Brunkhurst, New Hampshire Fish and Game Department Cynthia Copeland, Strafford Regional Planning Commission Ted Diers, New Hampshire Coastal Program Chris Fuert, Wells National Estuarine Research Reserve Dave Funk, Great Bay Stewards Brian Giles, Lamprey River Advisory Committee Jennifer Hunter, Piscataqua Region Estuaries Partnership Duane Hyde, The Nature Conservancy Rachel Kelly, Southern New Hampshire Regional Planning Commission JT Lockman, Southern Maine Regional Planning Commission Jamie Oman-Saltmarsh, Southern Maine Regional Planning Commission Fay Rubin, UNH Complex Systems Research Center Paul Schumacher, Southern Maine Regional Planning Commission Cliff Sinnott, Rockingham Planning Commission Michael Speltz, Society for the Protection of New Hampshire Forests Amanda Stone, UNH Cooperative Extension/ Natural Resources Outreach Coalition Theresa Walker, Rockingham Planning Commission Erika Washburn, University of New Hampshire Doctoral Candidate in Natural Resources The following planning staff collected much of the detailed municipal planning information reflected in this report: Theresa Walker and the circuit rider planning staff from the Rockingham Planning Commission; Cynthia Copeland and Bill Proulx from the Strafford Regional Planning Commission; Seth Spain and Jack Munn from the Southern New Hampshire Planning Commission; and Chris MacClinchy, Jamie Oman-Saltmarsh, and Paul Schumacher from the Southern Maine Regional Planning Commission. Dave Kellam from PREP created and managed the database used to compile and query the assessment results and completed the final report layout and design. Jill Scahill from PREP entered extensive assessment data into the database, compiled recommendations for every town, and assisted with the distribution of the report throughout the region. 5
 in the Piscataqua Region.")

8 EXECUTIVE SUMMARY The Piscataqua Region Environmental Planning Assessment (PREPA) was conducted to document the current status of environmental planning efforts and land use regulations for each of the 42 New Hampshire municipalities and 10 Maine municipalities (city and town governments) in the Piscataqua Region. The assessment involved analysis of over 80 questions associated with municipal regulatory and non-regulatory approaches to resource management. The assessment theme areas include land protection, wildlife habitat, stormwater management, erosion/sediment control, wetland and shoreland protections, floodplain management, and drinking water source protection, among others. Piscataqua Region Estuaries Partnership (PREP) staff and Land Use Team worked closely with a variety of stakeholders and the four regional planning commissions that service the Piscataqua Region on the development of the PREPA assessment form. For each of the 52 towns in the region, staff from the regional planning commissions reviewed municipal planning documents and interviewed key municipal representatives to complete an assessment form for each municipality. Data were collected in early This data was compiled by PREP into a database and analyzed for regional trends. Results for individual towns as well as regional trends are presented in this final project report. Differences between New Hampshire and Maine environmental policies are also evaluated for select issues pertaining to water quality and habitat protection. The assessment found that most municipalities have Master Plans or comprehensive plans that identify natural resource protection goals and strategies. Most municipalities also have active conservation commissions and have adopted open space protection plans, but many lack natural resource inventories that reflect the most up-to-date data and maps on wildlife habitat. Most municipalities have local wetland protections regulations, which often include some protection of upland buffer zones around wetlands. The assessment results indicate that overall there is poor consistency in environmental protection standards among municipal jurisdictions with regard to wetland and shoreland buffers and development setback requirements, stormwater management regulations, erosion and sediment control requirements, and impervious surface limits. The availability of electronic maps of natural resources and maps of regulatory protection overlay districts at the local level can be greatly improved. Implications of these results are that municipalities must coordinate more effectively with each other in order to provide a consistently high level of environmental protection to the critical resources in the Piscataqua Region and to better share the responsibility for effectively protecting and restoring water resources and wildlife habitat at the regional or watershed scale. Municipal improvements in wetland and shoreland buffer regulations, stormwater management regulations and performance standards, and erosion and sediment control regulations are top priorities to better protect water quality and aquatic habitat throughout the Piscataqua Region. Implementation of The Land Conservation Plan for New Hampshire s Coastal Watersheds and The Land Conservation Plan for Maine s Piscataqua Region Watersheds are top priorities for wildlife conservation action at the municipal and regional level. PREP used data from this assessment to develop measurable environmental planning goals for the Piscataqua Region. 6
 in the Piscataqua Region watershed.")
9 INTRODUCTION The Piscataqua Region Environmental Planning Assessment (PREPA) was conducted to document the current status of environmental planning efforts and land use regulations for each of the 52 municipalities (city and town governments) in the Piscataqua Region watershed. The assessment involved analysis of over 80 questions associated with municipal regulatory and non-regulatory approaches to resource management. The assessment theme areas include land protection, wildlife habitat, stormwater management, erosion and sediment control, wetland protections, floodplain management, and drinking water source protection, among others. Data were collected in early Figure 1. Map of the Piscataqua Region Watershed Project Purpose The overall purpose of this project was to determine the existing status of environmental planning and regulation in the 52 municipalities that comprise the watershed area for the Piscataqua Region that includes Great Bay and Hampton- Seabrook estuaries (See Figure 1). More specifically, the primary objectives of the project were to: Provide an updated and accurate information base to inform ongoing and emerging planning and environmental protection efforts Identify gaps and inconsistencies in the standards of environmental protection reflected in the current ordinances, development regulations, and natural resource protection strategies in each of the 52 municipalities Evaluate current strengths and weaknesses in municipal environmental protection efforts and provide feedback to each municipality on opportunities for improvement Guide the Piscataqua Region Estuaries Partnership (PREP) and its partners in targeting assistance to municipalities to make improvements over the next 10 years Understand the local and state land use policy frameworks that pertain to the 10 Maine municipalities within the watershed area that drains to the Great Bay estuary, and use this information to guide updated action plans for the PREP Management Plan Establish a standardized database that is updated periodically to track the status of environmental planning and protection standards throughout the PREP watershed Background and Statement of Need This project addresses several needs of the planning community, however, PREP completed the project primarily to guide the revision of the PREP Management Plan. Local municipalities have the most control over land use development patterns and practices in the Piscataqua Region watershed and are essential partners in meeting many of the goals identified in the PREP Management Plan. In order to work effectively with municipalities in implementing consistent and effective environmental protection standards across the watershed, it is necessary to understand the current regulations of each municipality and to identify the highest priority regulatory gaps among differing state and local political jurisdictions. In addition, many municipalities have a high level of interest and commitment to non-regulatory conservation activities such as voluntary permanent land conservation of both private and public lands. It is PREP s intention to support these voluntary conservation efforts and meet land conservation goals established in the PREP Management Plan. 7
10 PREP, formerly known as the New Hampshire Estuaries Project, completed the organization s first Management Plan for New Hampshire coastal watersheds in As part of this effort, a policy analysis document was completed called Regulation and Management of New Hampshire Estuaries: A Base Programs Analysis (Paulsen, 2000). The purpose of that report was to provide background on existing policies and management efforts aimed at protecting the estuaries of the state. This information was considered along with the technical characterization of the region s estuaries to develop appropriate Management Plan actions targeted at effectively addressing threats to Great Bay and Hampton- Seabrook Harbor. In essence, the Base Programs Analysis was a snapshot of the local, state, and federal management frameworks for the estuaries of the state of New Hampshire. Since the year 2000, there have been some important changes to New Hampshire s management framework and PREP expanded its focus area to include the entire watershed area that contributes to the Great Bay Estuary which includes portions of 10 municipalities in Maine that are subject to different state and local environmental regulations. While the Base Programs Analysis compiled some data on local regulations, this effort was limited to the 19 New Hampshire municipalities adjacent to tidal waters. PREP now works with all 52 municipalities in the Piscataqua Region that are part of the contributing watershed to the Great Bay and Hampton-Seabrook estuaries. This report is therefore meant to provide updated information on the status of municipal environmental planning efforts (both regulatory and non-regulatory) throughout the entire PREP focus area, and to highlight some of the key laws and regulations that pertain to the Maine municipalities with which PREP is just now beginning to coordinate. New Hampshire and Maine municipalities have a great deal of flexibility and responsibility for tailoring zoning and development standards to local conditions. Authority on land use decision making is primarily vested at the municipality level as opposed to the county level, which results in unique local regulations that apply to relatively small land areas. While both states have environmental laws and regulations that apply to all municipalities, the specific details of most land use regulations are still determined at the local level. To complicate things further, environmental protection standards can be defined in different portions of each municipality s zoning ordinances, site plan regulations, subdivision regulations, and/or building codes. This makes it challenging to understand the level of environmental protection provided within the jurisdiction of any one individual municipality, let alone across the larger coastal watershed region. Another significant hurdle in being able to see the big picture for the region is that municipal ordinances are subject to changes via annual municipal voting mechanisms, and site plan and subdivision planning regulations are subject to frequent changes via routine administrative rulemaking procedures. While state planning offices and regional planning commissions are able to track some information on municipal environmental regulations, the availability of detailed information on environmental standards among municipalities is generally lacking. Limitations This assessment document provides a fairly detailed overview of some key environmental planning mechanisms and standards across many political jurisdictions, and is a very useful tool for identifying ways to improve local and regional conservation measures. However, in interpreting the results of the assessment there are some important caveats: The assessment did not assess how well regulations are enforced. The assessment did not assess how frequently regulations are waived through variances. The assessment did not account for additional environmental protections that may be required by planning boards or zoning boards as special conditions associated with particular building permits or conditional use permits. The assessment did not collect data on all the planning tools that may contribute to smart growth in a community. Land use regulations are complex and are written differently for each municipality, which can lead to different interpretations by different people. Some municipalities have environmental standards that are very case specific to different zoning districts, parcel characteristics, or natural resource characteristics so it is difficult to summarize this variety with a yes/no question or a single value. The data reflected in the tables are meant to apply in general to the natural resources in the majority of land use cases. Most municipalities will have varying applicability standards, exemptions, and regulatory details that can alter how a particular regulation is applied to a specific land parcel. The process used to gather, compile, and ground-truth a large amount of land use planning information was rigorous for this project, but some mistakes or omissions are inevitable. The data were not collected to generate scores or grades to compare one municipality with another in terms of the effectiveness of their work on environmental protection. Data contained in this assessment were collected and analyzed in early to mid-2009, depending on the community, and may not reflect changes implemented by communities in
11 METHODS Step 1: Evaluate related planning assessment projects The Piscataqua Region Environmental Planning Assessment (PREPA) project was carefully developed so as not to replicate other planning-related surveys or questionnaires. Therefore, one of the first steps taken in the implementation of the project was to gather information about other planning-related assessments that had recently been completed or were planned for municipalities within the Piscataqua Region watershed. The content of each of these projects was evaluated by PREP staff to determine if the information needed for this project s purposes had already partially been gathered, and to see if any of the questions should be incorporated into the PREPA project to gather additional consistent data for each of the 52 municipalities in the PREP watershed. The following related projects were evaluated for their relevance to this project: I-93 Expansion Community Technical Assistance Program (CTAP) Survey. To assist communities in the I-93 region plan for growth, the New Hampshire Department of Transportation (NHDOT) committed to a comprehensive fiveyear $3.5M program to provide technical assistance to the 26 municipalities and cities influenced by the Interstate-93 improvements project (NHDOT, 2006). As part of this effort, the Southern New Hampshire Planning Commission and the Rockingham Planning Commission completed broad planning assessments for seven municipalities within the PREP watershed. Specifically, the Theme B: Environmental Protection, Land Use, and Open Space section of that assessment gathered some of the data that PREP was interested in obtaining. Some of the questions from the I-93 community assessment were incorporated into the PREPA assessment form. However, the type of information and level of detail needed by PREP was not sufficiently captured by the I-93 CTAP surveys, so the PREPA data were collected through an additional survey effort even for the seven PREP municipalities that had completed I-93 assessments. Isinglass River Management Plan (SRPC, 2008). The Isinglass River, a designated river under the New Hampshire River Management and Protection Program, runs through portions of three municipalities within the PREP watershed. The Management Plan was completed by the Strafford Regional Planning Commission for the Isinglass River Local Advisory Committee and contains some limited information on environmental regulations in the municipalities of Strafford, Barrington, and Rochester. New Hampshire Association of Conservation Commissions (NHACC) and Forest Society 2007 Survey of Conservation Commissions. PREP contacted the Executive Director of the NHACC and asked to review a copy of this recently completed survey and the results (Andrews, 2008). This statewide survey was developed primarily to explore in detail how municipalities pursue, implement, and track voluntary permanent land conservation activities. Some of the questions found in this survey were of interest to PREP and were integrated in a similar manner with the PREPA form. However, PREP needed to obtain a great deal of information on the status of environmental regulations and standards at the municipal level, and this information was mostly absent from the NHACC survey. A Social Landscape Analysis of Land Use Decision Making in the Towns of the Lamprey River Watershed (Washburn, 2008). This PhD dissertation work was being conducted by a University of New Hampshire student concurrent with the PREPA project. The research examined land use decision making processes within 12 PREP municipalities. PREP staff exchanged assessment question drafts with the student to determine overlap and to avoid duplication of effort. This research project had a social science emphasis and collected different information than that required by PREP. Step 2: Determine the scope, content, and format of the assessment After determining that the PREPA project would not replicate other completed or ongoing research efforts, PREP convened a project input meeting with the organization s Land Use Team, regional planning commission staff, and other interested parties to discuss the scope of the assessment and the type of information to collect. This meeting proved essential in reaching agreement on the core issues that would be included in the assessment (e.g., floodplains, stormwater, shoreland protections, etc.), and led to the approach of framing some of the assessment questions so that responses could be compared to generally accepted minimum environmental protection standards as reflected in the recentlycompleted Innovative Land Use Planning Techniques Guide Handbook (NHDES, 2008(a)). PREP developed several draft versions of the assessment form which were improved through comments from meeting participants and planning commission staff until the final format was completed. The final assessment form (Appendix A) included over 80 questions for which each municipality was surveyed. Step 3: Data collection PREP contracted with the four different regional planning commissions that are active within the PREP watershed to complete planning assessment forms for each municipality. Southern Maine 9
, Southern New Hampshire Planning Commission")
12 Regional Planning Commission completed assessments for the 10 Maine communities. Assessments for each of the PREP municipalities located in New Hampshire were completed by the Strafford Regional Planning Commission (18 municipalities), Southern New Hampshire Planning Commission (four municipalities), and Rockingham Planning Commission (20 municipalities). Each municipality s assessment form was completed by a planner based on his or her review of the municipality s master plan, zoning ordinances, site plan and subdivision regulations, and other publicly-available documents (e.g., open space plans, hazard mitigation plans, natural resource inventories, etc.) In order to confirm the results of the completed assessment form, the planner then interviewed a local expert knowledgeable about that municipality s environmental policy and planning efforts. Some of the local experts interviewed included code enforcement officers, municipal planners, planning board members, conservation commission members, town selectmen, and town council members. After the assessment results were confirmed through the interview process, the finalized assessment form was sent to PREP. Step 4: Data management, synthesis, and analysis. PREP staff built a customized Microsoft Access database to serve as a central repository for the project data collected for each municipality. A database format was preferred over simple spreadsheets because it enables the ability to query and extract select portions of the assessment data that may be of interest to a variety of users. The database is primarily organized by municipality and environmental planning topic (e.g. wetlands, shorelands, stormwater, etc.). The information from each completed assessment form was entered into the database. The database was then queried by topic area and results exported into Microsoft Excel spreadsheets. Results for some of the parameters assessed were compared to commonly accepted environmental planning standards and practices. Summary results across all 52 PREP watershed municipalities were calculated for each parameter. Data tables and graphs used to summarize and display the assessment results were compiled and included in this report. Data tables and graphs were reviewed by PREP staff to identify outliers that suggest a misinterpretation of the question by the 10

13 data collector, a data entry error, or outdated/erroneous data provided by municipal documents or representatives. This quality/ consistency control process led to some minor revisions in the assessment data. The majority of consistency issues occurred with the data on shoreland and wetland buffer and setback distance requirements. In some cases the meanings of no disturbance buffer, managed buffer, and setback distances were interpreted differently by different planners. Many municipal regulations have vague and confusing wording on where conservation overlay districts apply, in what cases they apply, and varying levels of protection by waterbody type. The data in the assessment is standardized to PREP-defined categories of protection level and may differ somewhat from any given municipality s definition or idea of a shoreland buffer or development setback. of local municipal protection standards or conservation efforts that can serve as models for other communities. A municipality interested in pursuing a conservation strategy already implemented by other municipalities can use this report to identify communities to contact in order to learn from their experience. The recommendation section of this report provides summaries of key areas where improvements should be made by municipalities to raise the standard of environmental protection across the region. Recommendations are provided to guide both PREP s updated Management Plan actions and municipal-level improvements that any municipality in the watershed can undertake. Data generated by this project potentially could be analyzed and summarized in many different ways. Analysis of the data revolved around several primary driving questions: How many municipalities within the PREP watershed are utilizing well-developed practical conservation mechanisms (permanent land protection, vegetated stream/wetland buffers, prime wetlands designations, etc.) that help accomplish PREP s environmental protection objectives? How do environmental protection standards codified in municipal regulations compare to scientifically defensible standards considered effective at protecting water resources and habitat? What is the level of consistency in municipal regulatory environmental protection throughout the PREP watershed across all political jurisdictions? This report presents simple summaries of the results primarily by tallying the number and percentage of municipalities for which the response to a question of interest was yes or no. This straightforward, albeit simplified, approach conveys generally how broadly practiced or utilized a given environmental planning activity is employed throughout the PREP watershed. For quantitative data results (e.g., the width of a development setback distance from a sensitive waterway), graphs are used to display the data relative to a minimum environmentally-protective standard that is based on scientific research and referenced in current regulatory policy guidance documents. Step 5: Complete final project report with recommendations for improvement Gaps, weaknesses, and inconsistencies in environmental protection across municipal jurisdictions are clearly evident in the assessment results. However, also clearly evident are good examples 11
14 RESULTS AND ANALYSIS PREP s assessment of municipal and state policies that affect water and habitat quality in the Piscataqua Region is included in this section. The municipal section presents the data that were collected and analyzed for municipalities which was the primary emphasis of this research effort. The state section provides a simple comparison of key environmental regulatory standards promulgated by relevant regulatory programs in New Hampshire and Maine. Municipal Regulations and Conservation Strategies This section is structured by planning issues of interest, which makes it easy to search and compare specific environmental standards among all 52 municipalities in the PREP watershed area. For each topic, key questions of interest are stated. The data collected by the project are intended to help answer these questions and inform future efforts to improve environmental protection. Assessment data are organized in this report according to these areas of interest: Conservation Fundamentals Wildlife Habitat Wildlife Habitat Wetland Protection Shoreland Buffers Stormwater Management Erosion & Sediment Control Drinking Water Protection Floodplain Management Impervious Surface Limits Other Regulatory Measures Non-Regulatory Conservation Tools Public Availability of Electronic Maps Distinction Between Natural Resource Protection Buffers and Setbacks While buffer regulations generally stipulate specifically what type of disturbance to soil and vegetation are prohibited or limited within a buffer zone, setbacks simply define how far away a particular structure or activity must be from a sensitive habitat area. Most setback regulations state a minimum distance in feet that a house or septic system must be located away from a wetland or stream, but are silent on what a homeowner or developer can do to the soil or vegetation within the area between the wetland/ stream and the house or septic system. In practice, this distinction between regulatory buffers and setbacks can make a big difference. A municipality could have a buffer requirement that any areas within a 100 of a stream must be maintained primarily as natural forest. However if that municipality had no buffer regulations and only required that houses/septics be located 100 back from a stream, then the area within 100 of the stream could potentially be legally converted completely to mowed lawn. Given these important differences between setbacks and buffers, this assessment intentionally defined them differently and tracked them separately during the data collection process. Conservation Fundamentals The intent of this section of the assessment is to understand if the municipality has in place some of the basic planning mechanisms commonly used to advance environmental conservation objectives. Key Questions: Who is working on environmental planning and enforcement? How are environmental planning goals formally recognized by municipalities? For many municipalities in New Hampshire and Maine, the local government advisory body tasked with identifying and pursuing conservation policy or actions at the local level is a group of appointed volunteer citizens who collectively serve on a Conservation Commission. Generally speaking, municipalities that lack active Conservation Commissions are likely to lack leadership capacity on advancing conservation initiatives through local government mechanisms such as protective ordinances or bond measures. As shown in Table 1, 94% of the 52 municipalities in the PREP watershed have an active Conservation Commission. It is worth noting that the 3 municipalities that do not have active commissions (Berwick, North Berwick, Lebanon) are all in Maine and constitute a large continuous land block in the Salmon Falls River watershed. Code enforcement officers are the primary means by which local regulations are enforced. Without effective enforcement, environmental protections reflected in written municipal regulations but not in land use practices mean very little. 100% of the municipalities assessed reported having someone who served at least part time in a code enforcement role. In some rural municipalities, code enforcement responsibility falls to the building inspector or even town selectmen. The quality of code enforcement that is able to be done by elected officials with many other administrative duties is dubious, and the potential for conflicts of interest are significant. Effectiveness of enforcement was not able to be assessed given the resources for this project. 12
15 Table 1. Fundamentals of Conservation Planning in the 52 Towns in the Piscataqua Region Watershed Conservation Commission? Code Enforcement Officer? Natural Resource Inventory Done? Natural Resource Inventory Year Adopted Natural Resource Chapter In Master Plan? Year Natural Resource Chapter Adopted Acton yes yes yes 2005 no N/A Barrington yes yes no N/A yes 2004 Berwick no yes yes N/A no N/A Brentwood yes yes yes 2006 no N/A Brookfield yes yes yes 2000 no 2006 Candia yes yes no N/A yes 2005 Chester yes yes yes 2006 yes 2008 Danville yes yes no N/A yes 2006 Deerfield yes yes yes 1991 yes 2009 Dover yes yes yes N/A yes 2000 Durham yes yes yes 2000 yes 2000 East Kingston yes yes no N/A yes 2005 Eliot yes yes yes N/A no N/A Epping yes yes no N/A yes 1997 Exeter yes yes no N/A yes 2006 Farmington yes yes no N/A yes 1998 Fremont yes yes yes 2007 yes 2008 Greenland yes yes yes N/A no N/A Hampton yes yes no N/A yes 2006 Hampton Falls yes yes yes N/A no N/A Kensington yes yes no N/A yes 2001 Kingston yes yes no N/A yes 2004 Kittery yes yes yes 2000 no N/A Lebanon no yes no N/A no N/A Lee yes yes no 2006 yes N/A Madbury yes yes yes 2002 yes 2002 Middleton yes yes yes 2000 yes 2007 Milton yes yes no N/A yes 2004 New Durham yes yes no N/A yes 2008 Newcastle yes yes yes 2002 yes 2002 Newfields yes yes no N/A yes 2008 Newington yes yes no N/A yes 2004 Newmarket yes yes yes 2001 yes 2001 North Berwick no yes yes N/A no N/A N. Hampton yes yes yes 1999 yes N/A Northwood yes yes yes 2004 yes 2004 Nottingham yes yes no N/A no N/A Portsmouth yes yes no N/A yes 2005 Raymond yes yes no N/A yes 2002 Rochester yes yes no N/A yes 2008 Rollinsford yes yes yes 2007 no N/A Rye yes yes no N/A yes 2006 Sandown yes yes no N/A yes 2005 Sanford yes yes yes 2004 no N/A Seabrook yes yes no N/A no N/A Somersworth yes yes no 2000 no N/A South Berwick yes yes yes N/A no N/A Strafford yes yes no N/A yes 2002 Stratham yes yes no 1998 yes N/A Wakefield yes yes no 2001 no 2001 Wells yes yes yes 2005 no N/A Yor k yes yes yes 2007 no N/A 49 yes (94%) 52 yes (100%) 25 yes (48%) 33 yes (79%)* * Question only applies to NH municipalities - column percentages are based solely on NH responses. A Natural Resource Inventory (NRI) usually consists of a series of maps showing geology, sensitive or significant habitats, water resources, wetlands, soils, conserved lands, etc., and an accompanying narrative document that explains the importance of these resources along with some recommendations on ways to protect them from development impacts. The NRI therefore serves as the primary information base upon which municipalities can develop zoning regulations and conservation overlay districts to conserve their natural resources. A NRI also provides information that town citizens should know about the location of sensitive areas and what natural resources they have on their land. Surprisingly, only 26 municipalities (50%) in the PREP watershed appear to have completed a NRI. Most of the municipalities that have completed a NRI have done so within the last ten years. Having a natural resource chapter as part of a municipal master plan is important because it provides a vision for how the community values its natural resources and outlines general goals and objective for meeting certain conservation targets. Ideally, the community development strategies described in a master plan should compliment and be consistent with the vision described in the natural resources chapter. Thirty three municipalities (79%) have a natural resource chapter in their master plan. Most municipalities who have a chapter have adopted it into their master plan within the last five-ten years. This question only applied to New Hampshire municipalities. In Maine, municipalities develop comprehensive plans that are roughly analogous to master plans for New Hampshire municipalities. Some municipalities opt to have the Maine State Planning Office review their community comprehensive plan for consistency with the goals and guidelines of Maine s Growth Management Act, which provides additional backup for the legality of the local regulations and enables the municipality to be eligible for certain state grant program funds. 90% of PREP s Maine communities have completed comprehensive plans, and 70% of the municipalities have received a consistency determination by the State Planning Office. Table 2. Status of Comprehensive Plans for Maine Municipalities in the Piscataqua Region Watershed N/A = not applicable or not reported Comprehensive Plan Approved? Year Comp Plan Approved Consistency Approval? Year of Consistency Approval Acton yes 2005 yes 2005 Berwick yes 1999 yes 1999 Eliot no N/A no N/A Kittery yes 2000 yes 2000 Lebanon yes N/A no N/A North Berwick yes 2009 yes 2008 Sanford yes 2002 yes 2002 South Berwick yes N/A yes N/A Wells yes 2005 yes 2005 Yor k yes N/A no N/A 9 yes (90%) 7 yes (70%) 13

16 Wildlife Habitat This portion of the assessment is meant to provide insight on how well important wildlife habitat is taken into consideration in land use development decisions and in municipality-led conservation planning efforts. A summary of results for all municipalities is shown in Table 3. Key Questions: Does the development permitting process seek opportunities to avoid major impacts on wildlife habitat and populations? Are municipalities working proactively to identify and offer stronger protections to sensitive or exemplary wildlife habitat? The first question in this section asks if the municipality requires mandatory pre-application meetings for development sites to address wildlife issues of concern (i.e. vernal pools, rare plants/ animals, raptor nesting sites, etc.) Pre-application meetings are a valuable mechanism that can proactively avoid unnecessary impacts to wildlife habitat prior to expending extensive design costs by the site developer. Only 31% of PREP municipalities responded yes to this question, indicating that many municipalities should be more proactive at discussing with developers how to minimize impacts to wildlife during the initial design phase of a proposed development project. In 2006, The Land Conservation Plan for New Hampshire's Coastal Watersheds (Zankel et al. 2006) was completed, and identified the most regionally important remaining lands for permanent land protection action to protect water quality and living resources in the NH seacoast region. 13% of PREP municipalities in NH have incorporated the Conservation Focus Areas identified in the plan into their Natural Resource Inventories (NRIs). While this is a relatively new plan, it is an excellent conservation planning resource that should be incorporated into every municipality s NRI to guide zoning decisions and local land protection efforts. One component of the NH Coastal Watersheds Plan is a model ordinance that municipalities can adopt to establish a conservation overlay district on mapped Conservation Focus Areas in order to limit fragmenting impacts of development within these sensitive land areas. Only one municipality (New Durham) in the PREP watershed has adopted a conservation overlay district based on the plan. A comparable plan for the Maine portion of PREP s watershed (which includes portions of 10 Maine communities) has just recently been completed and will be available in early This plan is called The Land Conservation Plan for Maine s Piscataqua Region Watersheds. Every state in the U.S. has developed a wildlife action plan intended to maintain critical habitats and populations of species of conservation and management concern. These plans were mandated and funded by the federal government through the State Wildlife Grants program (NHFG, 2005). These proactive plans are intended to help conserve wildlife and critical habitats before they become rarer and more costly to protect. The plans contain extensive data on actual and predicted occurrences of species and habitats of concern, and should be incorporated into municipal NRIs as key information for making informed land use development and conservation decisions. Wildlife Action Plans have been completed for both NH and ME, but only 17% of municipalities in the PREP watershed reported that they have incorporated this information into their NRIs. The New Hampshire Fish and Game Department has outreach staff and a municipal wildlife habitat audit process to assist New Hampshire municipalities in incorporating wildlife action plan data into local decision-making. In Maine, comparable assistance is provided to local municipalities through the Beginning with Habitat program led by the Maine Department of Inland Fisheries & Wildlife. Wetland Protection Key Questions: How many municipalities are currently using available wetland conservation planning tools (inventories, prime wetlands designation, buffers, setbacks, etc.)? How consistent are wetland habitat protections among municipalities? Wetlands receive some regulatory protection via Section 404 of the Clean Water Act, which regulates the discharge of dredged, excavated, or fill material in wetlands, streams, rivers, and other U.S. waters. The U.S. Army Corps of Engineers is the federal agency authorized to issue Section 404 Permits. Wetlands isolated from surface water connections are not always considered covered under the Army Corps jurisdictional authority. 14
17 Table 3. Wildlife Habitat Consideration in Planning Decisions within the Piscataqua Region Watershed Pre- Development Reviews for Wildlife Habitat? NH Coastal Conservation Plan part of Natural Resource Inventory?* NH Coastal Conservation Plan Overlay Zone?* State Wildlife Action Plan Data in Natural Resource Inventory?** Acton no N/A N/A yes Barrington no yes no yes Berwick no N/A N/A no Brentwood yes yes no yes Brookfield no yes no no Candia no no no no Chester yes no no no Danville yes no no no Deerfield no no no no Dover yes no no no Durham yes no no no East Kingston no no no no Eliot no N/A N/A no Epping no no no no Exeter yes no no no Farmington no no no no Fremont yes yes no yes Greenland no yes no yes Hampton no no no no Hampton Falls yes yes no yes Kensington no no no no Kingston yes no no no Kittery no N/A N/A no Lebanon no N/A N/A no Lee no no no no Madbury no no no no Middleton no no no no Milton no no no no New Durham yes no yes no Newcastle no no no no Newfields no no no no Newington no no no no Newmarket yes yes no yes North Berwick no N/A N/A no North Hampton yes no no no Northwood no no no no Nottingham no no no no Portsmouth yes no no no Raymond no no no no Rochester no no no no Rollinsford no no no no Rye yes no no no Sandown yes no no no Sanford no N/A N/A yes Seabrook no no no no Somersworth no no no no South Berwick no N/A N/A no Strafford no no no no Stratham yes no no no Wakefield no no no no Wells no N/A N/A no Yor k no N/A N/A yes 16 yes (31%) 7 yes (13%) 1 yes (2%) 9 yes (17%) N/A = not applicable or not reported Most U.S. states have separate state wetland protection laws, and seek to coordinate permit reviews with the Army Corps for development proposals in wetlands. Federal wetland protection authority only applies to activities immediately within the boundaries of a wetland habitat and do not extend to upland buffer areas adjacent to wetlands. New Hampshire s state wetland dredge and fill law covers wetlands, lakes, rivers, streams, upland tidal buffer zones, prime wetland buffer zones (100 ), and sand dunes. Maine s state wetland law applies to coastal wetlands, great ponds, freshwater wetlands, rivers, and streams. In both states, municipalities are legally authorized to enact local wetland protection regulations that can be more protective than state law including regulation of upland buffer areas adjacent to wetlands. This section of the assessment provides information on the types of regulatory wetland protection tools being used by municipalities within the PREP watershed. Table 4 summarizes some basic characteristics of local wetland protection regulations. 92% of municipalities have a local wetland protection provision included as part of their land use ordinance. Maine communities are required to adopt minimum protective standards consistent with state law. Four out of the ten Maine municipalities within the PREP watershed have adopted local wetland protection regulations more stringent than the minimum statewide requirements. 25% of municipalities in the PREP watershed take into account indirect impacts of development projects (e.g. stormwater runoff, wildlife disturbance, fragmentation, etc.) on wetland resources when making permitting decisions. In New Hampshire, specific wetlands deemed particularly sensitive, rare, or valuable can be identified by a municipality and designated as prime wetlands which provides additional state legal protection via more stringent permit review and impact avoidance analysis, 100 upland buffers, and consideration of indirect impacts. In Maine, the state designates significant wildlife habitats which include particular wetlands that receive additional protections. 44% of municipalities in the PREP watershed have wetlands that are considered either prime or significant. The designation of prime wetlands appears to be an under-utilized tool by many New Hampshire municipalities. Vernal pools are isolated seasonal wetlands that typically lack fish populations and are critical habitat for many amphibians and some rare species. Local protection of vernal pools is very important because vernal pools are numerous throughout New England, often do not show up on National Wetland Inventory maps, and provide habitat for amphibians, reptile, and invertebrate species that face serious threats to their long-term survival. 27% of municipalities have local regulations that explicitly offer protection to vernal pools. 15
18 Table 4. Municipal Wetland Protection Strategies in the Piscataqua Region Watershed Wetlands Ordinance? Regulations More Stringent Than State Minimum? (ME) Indirect Impacts Evaluated? Prime or Significant Wetlands Designated? Vernal Pools Explicitly Protected? Local Wetland Inventory in Past 15 Years? Acton yes yes no yes no no Barrington yes N/A no yes yes no Berwick yes no no yes no no Brentwood yes N/A no yes no yes Brookfield no N/A no no no yes Candia yes N/A yes no no no Chester yes N/A yes yes yes yes Danville yes N/A no no no no Deerfield yes N/A yes no no no Dover yes N/A yes no no no Durham yes N/A yes no yes yes East Kingston yes N/A no no no no Eliot yes no no yes no no Epping yes N/A no no no no Exeter yes N/A yes yes no yes Farmington yes N/A yes yes no yes Fremont yes N/A no yes no yes Greenland yes N/A no no no yes Hampton yes N/A no yes no yes Hampton Falls yes N/A no yes no yes Kensington yes N/A no no no no Kingston yes N/A yes no yes yes Kittery yes yes no yes no no Lebanon yes no no yes no no Lee yes N/A no no no no Madbury yes N/A yes yes yes yes Middleton yes N/A no no yes no Milton yes N/A no no no yes New Durham yes N/A no no yes yes Newcastle yes N/A yes no yes yes Newfields yes N/A no no no yes Newington yes N/A no yes yes yes Newmarket yes N/A no yes no yes North Berwick yes no no yes no no North Hampton yes N/A yes no no yes Northwood yes N/A no yes no yes Nottingham yes N/A no no yes yes Portsmouth yes N/A no no no yes Raymond yes N/A yes no no no Rochester yes N/A no no yes no Rollinsford yes N/A yes no no no Rye yes N/A no no yes yes Sandown yes N/A no no yes yes Sanford no no no yes no no Seabrook yes N/A no no no yes Somersworth yes N/A no yes no no South Berwick yes yes no yes no no Strafford yes N/A no no yes no Stratham yes N/A no no no yes Wakefield yes N/A no no no no Wells no no no yes no no Yor k yes yes no yes no yes 49 yes (94%) 4 yes (40%) 13 yes (25%) 23 yes (44%) 14 yes (27%) 27 yes (52%) One of the key wetland protection measures that municipalities can implement is to establish buffer zones around wetlands that limit disturbance to upland habitat immediately adjacent to wetlands. Related to this, municipalities can require minimum setback distances for the placement of septic systems or houses near wetlands. Upland buffers around wetlands are important for filtering stormwater, protecting wildlife habitat (transition zones between uplands and wetlands), and minimizing the possibility of drastic changes to wetland hydrology caused by nearby development. These buffers support the ongoing delivery of important functional services provide by wetlands, including flood control, water quality protection, wildlife habitat, and maintenance of base flow in streams and rivers. Given the importance of minimum wetlands and wetland buffers, it makes sense to have consistent levels of regulatory protection for these resources across the entire coastal watershed region. A key component of this assessment report was therefore to collect data on the width of both wetland buffers and development setback distances required by municipalities. Results are displayed for all municipalities in the PREP watershed in Figures 2-4. Buffer and setback widths for each municipality are shown relative to a suggested minimum protective standard of 100. The scientific rationale for the 100 standard is articulated in Buffers for Wetlands and Surface Waters (Chase et al. 1995) and is based primarily on what has been proven as an effective buffer width to address most water quality issues. The efficiency of nitrogen removal from vegetated buffers varies significantly depending on site specific conditions, however wide buffers (>50 m) have been shown to more consistently remove significant portions of nitrogen entering a riparian zone than narrow buffers (0 25 m) (Mayer et al. 2007). Given this variability, a 100 fertilizer application setback from wetlands and waterways is also scientifically defensible. For each of the fifty-two municipalities in the Piscataqua Region, municipal regulations were reviewed to assess the width of the wetland buffer or setback as measured from the edge of a wetland boundary. The assessment strove to be as quantitative as possible, so buffer and setback widths are shown in feet and results are summarized in bar graphs. The graphs are effective at showing the overall picture of buffer and setback distances across the entire watershed, but can be hard to read to view results for any given individual municipality. Tables showing the complete data set by municipality can be viewed in Appendix B. Figure 2 depicts the width of minimal disturbance buffers around wetlands as required by each municipality. Minimum disturbance buffers mean areas where activities that disturb the soil or significantly alter natural vegetation communities are not allowed. These buffers are the most protective of wetland resources in that they protect the integrity of the soil and vegetation adjacent to the wetland and thereby preserve the wildlife habitat, aes- 16
19 thetics, and full water quality filtering potential of the buffer. Two municipalities have a 100 buffer consistent with the full recommended protective standard. Two municipalities have 75 buffers. Seventeen other municipalities have some minimum disturbance buffer. Thirty-one municipalities have no minimum disturbance wetland buffer requirement. Given the abundance of wetlands in many seacoast communities, a full 100 minimum disturbance buffer on all wetlands may be politically challenging to adopt. However, even a 25 or 50 buffer provides significant environmental benefit as opposed to a lawn or parking lot immediately adjacent to a wetland. What is most striking about the results in Figure 2 is not that only two municipalities meet the 100 buffer standard, but rather that there is so much inconsistency in the level of protection offered to wetland buffers across municipal jurisdictions. Assuming that these standards are enforced, the implications of Figure 2 are that wetlands are significantly less protected in many municipalities in comparison to a few others, and that all municipalities are not equally sharing the responsibility for protecting water quality, minimizing flood risks, and conserving wetland/riparian wildlife habitat throughout the Piscataqua Region. Figure 3 depicts minimum setback requirements for how close a primary building structure or septic system can be built, and how close fertilizer can be applied, to a wetland in each municipality in the Piscataqua Region watershed. A 100 setback is shown as the suggested protective standard for reference. NH Department of Environmental Services (NHDES) rules require a minimum 50 setback between septic effluent disposal areas and poorly drained jurisdictional wetlands and a 75 setback on very poorly drained jurisdictional wetlands (NHDES, 2009). Municipalities have the authority to adopt more protective standards. It is immediately apparent that most of the municipalities that have not enacted wetland buffer protections do at least have some wetland setback regulations. Two municipalities lack any wetland setback requirements. Three municipalities have 125 setbacks for septic systems. Nineteen municipalities (37%) meet or exceed the recommended 100 setback standard for septic systems. Eleven municipalities (21%) meet the recommended 100 setback standard for primary building structures. Eighteen municipalities (35%) have the same required setback distances for both primary building structures and septic systems. Twenty-one municipalities (40%) have larger setback distances for septic systems than Figure 2. No Soil or Vegetation Disturbance Buffer Widths for Wetlands in the Piscataqua Region Watershed by Municipality 100 No Soil or No Vegetation Disturbance Buffer Width 100' Suggested Protective Standard Buffer Width (Feet) Acton Barrington Berwick Brentwood Brookfield Candia Chester Danville Deerfield Dover Durham East Kingston Eliot Epping Exeter Farmington Fremont Greenland Hampton Hampton Falls Kensington Kingston Kittery Lebanon Lee Madbury Middleton Milton New Durham Newcastle Newfields Newington Newmarket North Berwick N. Hampton Northwood Nottingham Portsmouth Raymond Rochester Rollinsford Rye Sandown Sanford Seabrook Somersworth South Berwick Strafford Stratham Wakefield Wells York 17
 define setback distances for the application of fertilizers adjacent to wetlands (with exemptions for agriculture).")
20 for buildings. Eight municipalities (15%) have larger setback distances for buildings than for septic systems. Only eight municipalities (15%) define setback distances for the application of fertilizers adjacent to wetlands (with exemptions for agriculture). The key conclusions from Figure 3 are that: wetland setback standards vary considerably among municipalities a slight majority (53%) of municipalities have different setback requirements for houses and septic systems a slight majority of municipalities (29 municipalities, 56%) do not meet the 100 protective standard setback for either buildings nor septic systems all municipalities except for one do not meet the suggested protective standard for fertilizer application setback Wetlands are significantly less protected in many municipalities in comparison to a few others, and that all municipalities are not equally sharing the responsibility for protecting water quality, minimizing flood risks, and conserving wetland/riparian wildlife habitat throughout the Piscataqua Region. There are twenty-two municipalities in the Piscataqua Region that have tidal shoreline frontage. Given that development disturbances and polluted runoff from tidal shorelands directly and immediately affect the estuaries, these areas warrant particular attention. Tidal wetlands are some of the most ecologically productive habitats on Earth, have experienced extensive losses due to filling by man, and can be negatively impacted by stormwater runoff pollution. A minimum 100 buffer of natural forested vegetation is recommended for uplands adjacent to tidal wetlands (Chase et al. 1995). This assessment tracked the width of no vegetation disturbance buffers (minimum disturbance areas) adjacent to tidal wetlands as reflected in municipal regulations. Results are shown in Figure 4. Note that some municipalities shown as having no buffers, do have managed buffers that allow for manipulation of vegetation Figure 4 is for buffers that are almost completely unmanaged natural vegetation. Ten municipalities (45%) lack requirements for unmanaged buffer areas adjacent to tidal wetlands. Only two municipalities meet the recommended standard. There is significant overlap in buffers associated with tidal wetlands and tidal shorelands refer to the tidal shorelands section of the assessment for more in-depth analysis of shoreland buffers. 18
21 Figure 3. Development and Fertilizer Application Setbacks for Wetlands in the Piscataqua Region Watershed by Municipality 125 Septic Setback Building Setback Fertilizer Application Setback Suggested Protective Standard for Setback of Buildings, Septic Systems, and Fertilizer Application 100 Width in Feet Acton Barrington Berwick Brentwood Brookfield Candia Chester Danville Deerfield Dover Durham East Kingston Eliot Epping Exeter Farmington Fremont Greenland Hampton Hampton Falls Kensington Kingston Kittery Lebanon Lee Madbury Middleton Milton New Durham Newcastle Newfields Newington Newmarket North Berwick N. Hampton Northwood Nottingham Portsmouth Raymond Rochester Rollinsford Rye Sandown Sanford Seabrook Somersworth South Berwick Strafford Stratham Wakefield Wells York Figure 4. No Vegetation Disturbance Buffer Widths for Tidal Wetlands in the Piscataqua Region Watershed by Municipality 100 No Vegetation Disturbance Buffer on Tidal Wetlands 100' Suggested Minimum protective Standard Buffer Width (Feet) Dover Durham Eliot Exeter Greenland Hampton Hampton Falls Kittery Madbury Newcastle Newfields Newington Newmarket North Hampton Portsmouth Rollinsford Rye Seabrook South Berwick Stratham Wells York 19
22 Based on the data summarized in Table 5, Most municipalities rely on National Wetland Inventory maps created by the U.S. Fish and Wildlife Service (40% of municipalities) or hydric soils maps developed by the Natural Resource Conservation Service (48% of municipalities) to map the approximate distribution of wetlands within their jurisdiction. These maps are based on interpretation of aerial photography (NWI) or interpolation between soil profile sample plots (soils maps), and generally do not accurately map small wetlands or identify exact boundaries between wetlands and uplands. Some municipalities choose to hire a wetland expert to more thoroughly map and characterize local wetland habitats by conducting a local wetland inventory. 52% of municipalities in the PREP watershed have had some form of local wetland inventory in the past 15 years (Table 5). Almost all municipalities (88%) require a certified wetland specialist to conduct on-site wetland delineations to determine precise wetland boundaries on parcels proposed for development. Shoreland Buffers Key Questions: What level of protection do municipal regulations provide to different waterbody types and sizes? How consistent are requirements to protect undisturbed vegetated areas along streams and lakes? How consistent are the requirements to set back new buildings or septic systems from streams and lakes? The simplest and most effective way to protect streams, rivers, lakes and estuaries is to leave an area of undisturbed native vegetation adjacent to the water body. These undisturbed areas act as filters for pollutants and provide important wildlife habitat. Preserving and restoring riparian buffers is essential to surface water quality protection (NHDES, 2008(a)). Since almost all surface waters ultimately drain to the ocean within the PREP watershed, the water quality protection offered to even very small intermittent streams directly affects water quality conditions in the Great Bay and Hampton-Seabrook estuaries. Therefore, the purpose of this portion of the assessment is to characterize the level of protection offered through municipal regulations to upland buffers adjacent to streams, brooks, rivers, ponds, and lakes. Some shoreland protection regulations only apply to waterbodies of a certain size or designation. For instance, in New Hampshire, the state s Comprehensive Shoreland Protection Act (CSPA) only applies to fourth order streams (larger rivers), rivers that are specifically designated under the state s River Management and Protection Program, and tidal shorelands. This leaves the shoreland areas of many smaller streams and rivers unprotected from Table 5. How Do Municipalities Identify Wetlands Subject to Their Regulatory Jurisdiction? Use National Wetland Inventory Maps? Use NRCS Hydric Soils Maps? Use Local Wetland Inventory Maps? Use On-site Delineations? Acton yes no no yes Barrington no no no yes Berwick yes no no yes Brentwood yes yes yes yes Brookfield yes yes yes yes Candia yes yes no yes Chester no yes yes yes Danville no yes no no Deerfield no yes yes yes Dover no no no yes Durham no no no yes East Kingston no yes no yes Eliot yes no no yes Epping no yes no yes Exeter yes yes yes yes Farmington no no yes yes Fremont yes yes yes yes Greenland yes no no no Hampton no yes yes yes Hampton Falls no yes yes yes Kensington no yes no yes Kingston yes yes no yes Kittery no no no yes Lebanon yes no no yes Lee no no no no Madbury no no no yes Middleton yes yes no yes Milton no no no yes New Durham yes yes yes yes Newcastle yes no yes yes Newfields no yes no yes Newington yes yes yes yes Newmarket yes yes yes yes North Berwick yes no no yes North Hampton no no yes yes Northwood no no yes yes Nottingham no no no yes Portsmouth yes yes yes yes Raymond no no no yes Rochester yes yes no yes Rollinsford no no no yes Rye no yes yes yes Sandown no yes yes yes Sanford yes no no yes Seabrook no yes no no Somersworth no no no yes South Berwick yes no no no Strafford no no no yes Stratham no yes no yes Wakefield no no no no Wells no no no yes Yor k no no no yes 21 yes (40%) 25 yes (48%) 18 yes (35%) 46 yes (88%) 20

23 development disturbance. Small stream tributaries usually make up the majority of stream miles in a watershed and have a direct impact on the water quality of the larger river segments. Without enforceable regulations, shoreland areas can be converted from natural vegetation to lawns, buildings, parking lots, and other incompatible land uses that negatively impact water quality. Clearly, strong local regulations protecting the shorelands of streams are critical to protecting the long-term water quality of the Piscataqua Region s surface waters. A minimum 100-foot buffer width is recommended as a standard width for all surface waters and wetlands in New Hampshire in Buffers for Wetlands and Surface Waters: A Guidebook for New Hampshire Communities (Chase et al. 1995). This recommendation is based on the width of buffer which provides essential water quality protection, although larger buffers are often necessary to provide quality habitat for certain wildlife species. Buffers of less than 35 feet have not been found to sustain long-term protection of aquatic communities. There is no one magic number at which a shoreland buffer is wide enough to meet all environmental objectives - generally speaking, bigger is better when it comes to protecting water quality and maintaining wildlife habitat. Figure 5 provides a summary of the environmental services provided by different buffer widths. The efficiency of nitrogen removal from vegetated buffers varies significantly depending on site specific conditions, however wide buffers (>50 m) have been shown to more consistently remove significant portions of nitrogen entering a riparian zone than narrow buffers (0 25 m) (Mayer et al. 2007). Given this variability, a 100 fertilizer application setback from wetlands and waterways is also scientifically defensible. In order to understand as clearly as possible which surface water buffers are protected by local regulations, data for this portion of the assessment was collected for the following waterbody types: In general, streams of higher order are larger than those of lower order. Rivers are examples of higher order streams. The size of a stream is one parameter that is sometimes used by municipalities to determine the width of the shoreland buffer. Figure 6 presents a simplistic diagram of a stream network showing how stream order numbers are determined. For the purposes of this assessment, municipal regulations were categorized according to the following assessment categories: No vegetation disturbance buffer An area where only minimal disturbance to natural soil and vegetation is allowable. Removal of hazard trees and maintenance of small footpaths allowed, but otherwise the area is left in a natural vegetated condition. Managed buffer An area generally intended to support a well distributed functional cover of trees, shrubs, and groundcover, but tree thinning, landscaping, and some accessory structures (decks, gazebos, etc.) may be allowed. Septic setback The minimum distance required between the edge of the waterway and an on-site septic system. Primary structure setback The minimum distance required between the edge of the waterway and a primary building structure. Fertilizer application setback - The minimum distance required between the edge of the waterway and application of fertilizer. 1st order streams (intermittent or perennial headwater streams) 2nd order streams (formed when two 1st order streams come together) 3rd order streams (formed when two 2nd order streams come together) 4th order and higher streams (formed at the confluence of two third order or larger streams) Lakes/great ponds Tidal waters 21
 fisheries habitat - 75 feet nutrient removal - 125 feet")

24 Figure 5. Environmental Services Provided by Various Shoreland Buffer Widths stream bank stabilization - 50 feet SERVICE - BUFFER WIDTH (feet from water) fisheries habitat - 75 feet nutrient removal feet flood control feet sediment control feet wildlife habitat feet human land use Source: adapted from Connecticut River Joint Commission, Figure 6. Strahler Stream Order Diagram For each of the fifty-two municipalities in the Piscataqua Region, municipal regulations were reviewed to assess which waterbodies receive shoreland buffer and setback protections, the width of the buffer or setback as measured from the top of streambanks, and the nature of the protection offered by the buffer. The assessment strove to be as quantitative as possible, so buffer widths are shown in feet and results are summarized in bar graphs. The graphs are effective at showing the overall picture of buffer and setback distances across the entire watershed, but can be hard to read to view results for any given individual municipality. Tables showing the complete data set by municipality can be viewed in Appendix C. It is important to note that the results shown generally do not apply to agricultural and forestry land uses, as municipalities often exempt these land uses from local ordinance buffer provisions and defer to separate state-level rules and best management practices that are intended to apply to these land uses. The most protective type of stream buffer is a no vegetation disturbance buffer. Undisturbed natural forest cover provides maximum water quality filtering and wildlife benefits. Results for municipal regulations that appeared to fit this assessment category are shown in. A minimum suggested standard of 25 is shown for reference purposes. This 25 minimum is based a three-tiered buffer model, and is a minimum in combination with at least an additional managed buffer zone (Schueler and Holland, 2000). Fourteen municipalities (27%) have no disturbance buffers that apply to at least some streams, lakes, and ponds within their jurisdiction. Figure 7. No Disturbance Buffer Widths for Different-Sized Waterbodies in the Piscataqua Region Watershed by Municipality 1st Order Stream 2nd Order Stream 3rd Order Stream 4th Order + Streams Lakes/Great Ponds ' Suggested Minimum Protective Standard if used in combination with managed buffer area 75 Buffer Width (Feet) Acton Barrington Berwick Brentwood Brookfield Candia Chester Danville Deerfield Dover Durham East Kingston Eliot Epping Exeter Farmington Fremont Greenland Hampton Hampton Falls Kensington Kingston Kittery Lebanon Lee Madbury Middleton Milton New Durham Newcastle Newfields Newington Newmarket North Berwick North Hampton Northwood Nottingham Portsmouth Raymond Rochester Rollinsford Rye Sandown Sanford Seabrook Somersworth South Berwick Strafford Stratham Wakefield Wells York 22
25 While many municipalities lack strict no disturbance buffers along shorelines, most of them do have conservation overlay districts that provide managed buffer areas to at least some waterbodies within their jurisdiction. These managed areas may allow limited tree thinning, landscaping, and some accessory structures, but are generally intended to support a well distributed functional cover of trees, shrubs, and groundcover within the buffer area. Results for municipal regulations that appeared to fit this assessment category are shown in Figure 8. While data on no disturbance and managed buffer areas were collected separately in the assessment, in practice these areas can overlap and compliment each other. Therefore, it is useful to pool results for both buffer types in order to get an overall picture of either type of shoreland protection across the Piscataqua Region. Figure 9 depicts these pooled results, and provides the most complete picture of the presence of local shoreland regulatory protections of any kind throughout the region. Municipalities that are shown to have no buffers on Figure 9 (15 municipalities), lack any functional regulatory protections to upland areas immediately adjacent to waterways within their municipality. Figure 8. Managed Buffer Widths for Different-Sized Waterbodies in the Piscataqua Region Watershed by Municipality 150 1st Order Stream 2nd Order Stream 3rd Order Stream 4th Order + Streams Lakes/Great Ponds Suggested Minimum Protective Standard 1st order streams Suggested Minimum Protective Standard all other streams/lakes 125 Buffer Width in Feet Acton Barrington Berwick Brentwood Brookfield Candia Chester Danville Deerfield Dover Durham East Kingston Eliot Epping Exeter Farmington Fremont Greenland Hampton Hampton Falls Kensington Kingston Kittery Lebanon Lee Madbury Middleton Milton New Durham Newcastle Newfields Newington Newmarket North Berwick North Hampton Northwood Nottingham Portsmouth Raymond Rochester Rollinsford Rye Sandown Sanford Seabrook Somersworth South Berwick Strafford Stratham Wakefield Wells York Figure 9. No Disturbance and/or Managed Buffer Widths for Different-Sized Waterbodies in the Piscataqua Region Watershed by Municipality 150 1st Order Stream 2nd Order Stream 3rd Order Stream 4th Order + Streams Lakes/Great Ponds Suggested Minimum Protective Standard 1st order streams Suggested Minimum Protective Standard all other streams/lakes Buffer Width in Feet Acton Barrington Berwick Brentwood Brookfield Candia Chester Danville Deerfield Dover Durham East Kingston Eliot Epping Exeter Farmington Fremont Greenland Hampton Hampton Falls Kensington Kingston Kittery Lebanon Lee Madbury Middleton Milton New Durham Newcastle Newfields Newington Newmarket North Berwick North Hampton Northwood Nottingham Portsmouth Raymond Rochester Rollinsford Rye Sandown Sanford Seabrook Somersworth South Berwick Strafford 25 Stratham Wakefield Wells York 23

 have a no disturbance upland buffer defined adjacent to tidal shorelands, and all of them were narrower in width than the recommended minimum of 100.")

26 There are twenty-two municipalities in the PREP watershed that have tidal shorelands within their jurisdiction. Since tidal shorelands are sometimes subject to different regulations than non-tidal shorelands, this was measured separately in this planning assessment. Figure 10 depicts the width of tidal setbacks and buffers for each of the twenty-two municipalities. Only five municipalities (23%) have a no disturbance upland buffer defined adjacent to tidal shorelands, and all of them were narrower in width than the recommended minimum of 100. However, seventeen municipalities (77%) have a managed buffer area defined, and of these nine (41%) did meet or exceed the 100 standard. With regard to minimum setback distances between septic systems and tidal shorelines, most municipalities reported requiring the same standards as their respective state regulations require (75 in NH and 100 in ME). By default, septic systems installed in any municipality that reported no local setback requirement or a distance less than the state standard, would still need to meet state requirements. It is notable that eight municipalities (36%) had local setback requirements that exceeded state requirements, and thus provide a more protective standard than the state minimum. Of these municipalities, one municipality (Exeter) is a true standout with a 300 setback requirement at least double any other municipality. Eleven municipalities (50%) met or exceeded the minimum recommended protective standard of a 100 setback between tidal shorelines and a primary building structure (typically a house). Eleven municipalities (50%) also required the same setback distance for a primary structure as for a septic system. The Town of Exeter was again a standout in this category with a 300 primary structure setback requirement. Only three municipalities (14%) reported any required setback for the application of fertilizer adjacent to tidal shorelands: Durham (150 ), Newcastle (25 ), and Newmarket (25 ). Durham is an obvious standout in this category. standard, would still need to meet state requirements. Twenty-six municipalities (50%) in the PREP watershed meet the recommended 100 septic setback standard for most waterbody types. Eight municipalities (15%) had local septic setback requirements that exceeded the 100 recommended standard for at least some waterbody types. The Town of Exeter was a standout, with 300 septic setback requirements applying to 3rd and 4th order streams (larger streams/rivers). Figure 12 shows the minimum setback distances between a primary structure (typically a single family home) and the shoreline of waterbodies of different sizes/types as reported by each of the fifty-two municipalities in the Piscataqua Region. Most of the Maine municipalities are consistent with each other, with a 75 setback on all streams/rivers, and a 100 setback on great ponds and lakes. These setbacks are the minimum standards required by Maine s Mandatory Shoreland Zoning Act. Ten municipalities (19%) reported no local setback requirements for primary structures. Twenty-three municipalities (44%) met or exceeded the 100 recommended standard for at least some waterbodies, which also means that a majority of municipalities did not meet this standard for any waterbody type. The Town of Exeter was again a standout in this category with a 300 primary structure setback required on larger rivers. The Town of Rollinsford reported a 250 setback that applies only to 4th order streams or higher, which is either a dramatic departure from the town s standard for smaller rivers (50 ) or an error on the assessment form. Figure 11 shows the minimum allowed distances between various size waterbodies and the installation of on-site septic treatment systems as defined in the regulations of each of the fifty-two municipalities in the Piscataqua Region. The New Hampshire Department of Environmental Services (NHDES) rules require 75 setback between surface waters and septic effluent disposal areas (NHDES, 2009). The State of Maine has required a 100 setback from waterways since at least 1974 (State of Maine, 2009). By default, septic systems installed in any municipality that reported no local setback requirement or a distance less than the state 24
27 Figure 10. Buffers and Setbacks for Tidal Shorelands in the Piscataqua Region Watershed by Municipality 300 1st Order Stream 2nd Order Stream 3rd Order Stream 4th Order + Streams Lakes/Great Ponds Suggested Minimum Protective Standard for Buffer Widths on Tidal Shorelands Dover Durham Eliot Exeter Greenland Hampton Hampton Falls Kittery Madbury Newcastle Newfields Newington Newmarket North Hampton Portsmouth Rollinsford Rye Buffer/Setback Width (Feet) Seabrook South Berwick Stratham Wells York Figure 11. Septic Setback Distances for Different-Sized Waterbodies in the Piscataqua Region Watershed by Municipality 1st Order Stream 2nd Order Stream 3rd Order Stream 4th Order + Streams Lakes/Great Ponds Suggested Protective Standard for Septic Setback Width Setback Width (Feet) Acton Barrington Berwick Brentwood Brookfield Candia Chester Danville Deerfield Dover Durham East Kingston Eliot Epping Exeter Farmington Fremont Greenland Hampton Hampton Falls Kensington Kingston Kittery Lebanon Lee Madbury Middleton Milton New Durham Newcastle Newfields Newington Newmarket North Berwick North Hampton Northwood Nottingham Portsmouth Raymond Rochester Rollinsford Rye Sandown Sanford Seabrook Somersworth South Berwick Strafford Stratham Wakefield Wells York 25
28 Figure 12. Primary Structure Setback Distances for Different-Sized Waterbodies in the Piscataqua Region Watershed by Municipality 1st Order Stream 2nd Order Stream 3rd Order Stream 4th Order + Streams Lakes/Great Ponds Suggested Protective Standard for Primary Structure Setback Setback Distance in Feet Acton Barrington Berwick Brentwood Brookfield Candia Chester Danville Deerfield Dover Durham East Kingston Eliot Epping Exeter Farmington Fremont Greenland Hampton Hampton Falls Kensington Kingston Kittery Lebanon Lee Madbury Middleton Milton New Durham Newcastle Newfields Newington Newmarket North Berwick North Hampton Northwood Nottingham Portsmouth Raymond Rochester Rollinsford Rye Sandown Sanford Seabrook Somersworth South Berwick Strafford Stratham Wakefield Wells York Figure 13 displays the minimum setback distances between application of fertilizer and the shoreline of waterbodies of different sizes/types as reported by each of the fifty-two municipalities in the Piscataqua Region. The results shown do not apply to agricultural land, as this land use is typically exempt from local ordinance buffer provisions. Forty-four municipalities (85%) report no local requirements for minimum distances between the application of fertilizer adjacent to any size stream, pond, or lake. Of the municipalities that did have some requirement, six municipalities only stipulated a 25 fertilizer setback on select waterbodies, one municipality (Barrington) met the 100 recommended standard for one waterbody type, and one municipality (Durham, 150 ) exceeded the 100 standard for most waterbody types. The Town of Durham was clearly a standout in this category. Even with strong fertilizer setback standards in municipal regulations, improved practices on the ground are unlikely without strong enforcement and extensive public outreach. Given the well-documented detrimental impacts of nitrogen loading to the Great Bay estuary and potentially the nearshore ocean, requirements for larger fertilizer application setbacks (and public outreach on the importance of them) is a logical priority for future improvements. Figure 13. Fertilizer Application Setback Distances for Different-Sized Waterbodies in the Piscataqua Region Watershed by Municipality 1st Order Stream 2nd Order Stream 3rd Order Stream 4th Order + Streams Lakes/Great Ponds 150 Suggested Protective Standard for Fertilizer Application Setback 125 Setback Width (Feet) Acton Barrington Berwick Brentwood Brookfield Candia Chester Danville Deerfield Dover Durham East Kingston Eliot Epping Exeter Farmington Fremont Greenland Hampton Hampton Falls Kensington Kingston Kittery Lebanon Lee Madbury Middleton Milton New Durham Newcastle Newfields Newington Newmarket North Berwick North Hampton Northwood Nottingham Portsmouth Raymond Rochester Rollinsford Rye Sandown Sanford Seabrook Somersworth South Berwick Strafford Stratham Wakefield Wells York 26

29 Stormwater Management Key Questions: Where are stormwater management regulations found in each municipality? How do the standards for each municipality compare with current state recommendations and innovative new practices? Nonpoint source (NPS) pollution remains the Nation's largest source of water quality problems. This source of pollution is hard to control because most NPS inputs result from many common land use practices that are widely spread across the landscape and largely unregulated. NPS stormwater runoff from agricultural lands and urbanized areas generally contribute the largest loads of contaminants (sediment, fertilizers, bacteria, metals, etc.) to receiving waters. Agriculture is not a dominant land use in coastal New Hampshire. More prominent water quality threats are being posed by the rapid population growth and subsequent urbanization of the region. Forested land in a natural state provides excellent protection of water quality. As more and more acres of forest are converted to impervious surfaces (roads, parking lots, roofs, etc.), precipitation is much more likely to pick up contaminants and transport them directly to streams, rivers, lakes, and estuaries. Conventional development practices and patterns have increased the volume and pollution load of stormwater runoff in Piscataqua Region watersheds. As the population of the watershed has grown dramatically in the last 20 years, development has created new impervious surfaces at an average rate of nearly 1,500 acres per year. Nitrogen concentrations in Great Bay have increased by 44 percent in the past 28 years (PREP, 2009). Many river, lake, and estuarine waterbodies in the Piscataqua Region are officially listed as failing to meet water quality standards established under the federal Clean Water Act for a variety of beneficial uses such as support of aquatic life, recreation, and shellfish harvesting. Clearly, a business as usual approach to future land development (and redevelopment) will result in further degradation of the region s water resources with subsequent negative impacts for both human and wildlife communities. In addition, municipalities in particular are often shouldered with the costs of addressing infrastructure failures and water quality problems that result from poor regional stormwater management planning. Municipalities and developers must find ways to minimize land disturbance, preserve more of the natural hydrology of the landscape, and provide effective treatment for the volume, rate, and water quality of the stormwater generated at development sites. While very large development projects are now being required to meet new more stringent stormwater management standards via state and federal regulations, smaller scale projects are generally unregulated and often lack adequate stormwater management controls. For instance, the New Hampshire Department of Environmental Services (NHDES) Alteration of Terrain permit program mostly only applies to projects disturbing a land area > 100,000 sq. ft (2.3 acres). Given that much of the future development pressure in the Piscataqua Region will involve individual development sites smaller than two acres, the burden of ensuring effective stormwater management will largely be the responsibility of municipal governments. In addition, more than half of the municipalities in the region now qualify as Phase II communities under the federal Clean Water Act and will be required to develop and implement effective stormwater management control strategies in order to avoid potential fines for non-compliance. This section of the regional planning assessment gathered information about: where stormwater regulations are found in each municipality and if the regulations define a minimum area of land disturbance that would clearly trigger the application of the regulations to a development site (Table 6), and what stormwater management performance standards are required for development projects subject to municipal permitting processes (Tables 7 and 8). Municipalities in New Hampshire and Maine typically incorporate stormwater management regulations into either their subdivision and site plan review regulations, or into their zoning ordinance. Some communities have stormwater management requirements scattered throughout all three categories, which in some cases complicates effective implementation and enforcement. Requiring stormwater management for only subdivision proposals can result in a lack of stormwater management requirements for commercial site plan projects. Requiring stormwater 27
30 management for only projects that meet site plan review criteria can result in a lack of stormwater management requirements for subdivision proposals. Therefore, if a community chooses not to have an overarching stormwater management section in their zoning ordinance, it is recommended that they address stormwater management requirements for development projects in both their site plan review and subdivision regulations. Perhaps the most efficient and effective method for local management of stormwater is for a municipality to adopt a stormwater management section or article in the local zoning ordinance. NHDES provides a model ordinance for this approach (NH- DES 2008(a)). This method would enable the regulations to be applied to all re-development and new development projects, and would increase awareness of stormwater management among developers, building inspectors, Planning Board and Conservation Commission members, and residents. One of the drawbacks of this approach is that changes to the zoning ordinance language typically requires a public vote - whereas site plan and subdivision regulations are changed through routine administrative public hearing processes by municipal planning and zoning boards. While having sections on stormwater management in three different places (zoning ordinance, site plan review regulations, and subdivision regulations) can be confusing, it also offers some potential benefits. A municipality could adopt an article in the local zoning ordinance that establishes the required elements and broad performance standards that stormwater management control plans must meet to qualify for a development permit, but then specify the technical regulatory details on stormwater management in the municipality s site plan and subdivision regulations. Stormwater management is an ever-evolving field and technical standards and recommendations are likely to rapidly change over time. Amendments to site plan and subdivision regulations can be much more easily updated than ordinance language, so this approach could provide the desired flexibility for a municipality wanting to make frequent technical updates without tampering with the overarching stormwater management ordinance language. Table 6 summarizes the data collected for each municipality pertaining to where their stormwater management regulations are located. Only two municipalities (4%) reported having a standalone stormwater management ordinance (separate from their zoning ordinance) in place at the time of the assessment. Thirtyfive municipalities (67%) reported having stormwater management provisions in their site plan regulations, forty-two (81%) reported having them in their subdivision regulations, fourteen (27%) reported having a stormwater management section as part of their zoning ordinance, and six municipalities (12%) reported having essentially no stormwater management regulations. Nineteen municipalities (37%), had stormwater regulations in either there site plan or subdivision regulations but not both which can present problems as discussed in the above introduction paragraphs. Nine municipalities (17%) had stormwater management provisions in three different places: site plan review regulations, subdivision regulations, and zoning ordinance. Most of these nine municipalities are in Maine, suggesting that this may be a typical approach in that region. Only one municipality (North Hampton) appears to have a stormwater management section in their zoning ordinance, but no stormwater provisions in their site plan and subdivision regulations. The NHDES model ordinance suggests that any development disturbing greater than 20,000 square feet (just less than half an acre) of land should be required to complete a stormwater management plan, while federal permit requirements for stormwater management plans are triggered at 43,560 square feet (1 acre) of disturbance. The threshold of disturbance which triggers the application of any municipality s stormwater management requirements is thus an important determinant of what types of projects the regulations apply to and whether or not the local regulations are theoretically redundant with federal permit requirements. Since projects larger than 43,560 square feet are supposed to be covered by existing federal permit requirements, the priority regulatory gap for local municipalities to address is projects below this threshold that are still likely (especially cumulatively) to contribute stormwater volume and pollution to receiving waters. The last column in Table 6 summarizes the disturbance threshold at which each municipality s stormwater regulation requirements are currently triggered. The most remarkable insight from this column is that thirty-four municipalities (65%) do not have a clearly defined disturbance threshold which implies that it is currently unclear to developers, citizens, and municipal representatives when and how to apply their stormwater management regulations to development proposals. For municipalities that have defined a disturbance threshold, nine municipalities (17%) have a threshold at or below the 20,000 square feet standard proposed by NHDES, and nine municipalities (17%) have higher thresholds than recommended mostly at 40,000 square feet. In summary, a large majority of municipalities (83%) have either no defined threshold, or a defined threshold significantly above what is recommended. 28

31 Table 6. Location of Stormwater Regulations within Municipal Documents in the Piscataqua Region Watershed Stormwater Ordinance Site Plan Regulations Subdivision Regulations Zoning Ordinance No Stormwater Regulations Soil Disturbance Threshold For Regulations (sq. ft.) Acton no yes yes yes no 40,000 Barrington no yes yes no no ND Berwick no yes yes yes no 40,000 Brentwood no no yes no yes ND Brookfield no yes yes yes no 20,000 Candia no no yes no no ND Chester no no yes no no ND Danville no yes yes no no ND Deerfield no yes yes no no ND Dover no yes yes no no 43,560 Durham no yes no no no ND East Kingston no no yes no yes ND Eliot yes yes yes yes no ND Epping no yes yes no no ND Exeter no yes yes no no 40,000 Farmington no yes yes no no ND Fremont no yes yes no no ND Greenland no yes yes no no 20,000 Hampton no yes yes no no ND Hampton Falls no yes no no yes ND Kensington no no yes no no ND Kingston no yes yes no no 20,000 Kittery no yes no no no ND Lebanon no no yes yes no 40,000 Lee no yes yes no no ND Madbury no no yes yes no ND Middleton no yes no no no ND Milton no no no no no ND New Durham no yes yes yes no 500 Newcastle no yes yes no no 20,000 Newfields no no yes no yes ND Newington no yes no no no 20,000 Newmarket no yes yes no no ND North Berwick no no yes yes no 40,000 North Hampton no no no yes no ND Northwood no yes no no no ND Nottingham no no no no yes ND Portsmouth no yes yes yes no ND Raymond no yes yes no no 20,000 Rochester yes no yes no no ND Rollinsford no yes yes no no ND Rye no no yes yes no ND Sandown no yes yes no no 50,000 Sanford no yes yes no no ND Seabrook no yes yes yes no 40,000 Somersworth no no yes no no ND South Berwick no no no no yes ND Strafford no yes yes no no 1 Stratham no yes yes no no 20,000 Wakefield no no yes no no 43,560 Wells no yes yes yes no ND Yor k no yes yes yes no ND ND = not defined 2 yes (4%) 35 yes (67%) 42 yes (81%) 14 yes (27%) 6 yes (12%) 34 ND (65%) Simply tracking whether or not a municipality has stormwater management regulations on the books does not reveal how well those regulations meet current recommended standards for issues such as peak flow control, groundwater recharge, and water quality protection. The stormwater management standards recommended in the NHDES Model Ordinance for Permanent (Post- Construction) Stormwater Management (NHDES, 2008(a)) were used as the basis for comparison with existing municipal regulatory standards, with results summarized for all municipalities in Tables 7 and 8. Thirty municipalities (58%) are considered by the Environmental Protection Agency as federal Clean Water Act Phase II MS4 communities, which are required to address non-point source pollution associated with their municipal separate storm sewer systems (thus the term MS4 ). This is important because effectively regulating and enforcing improved stormwater management practices at the municipal level is the primary means to address non-point source pollution in an urbanized setting. In practice, few of the MS4 municipalities in the Piscataqua Region have stormwater regulations that meet current recommended standards, and thus will fail to adequately address urban/suburban sources of pollution if significant corrective steps are not implemented. 29

32 Table 7. Stormwater Management Requirements of Municipal Regulations in the Piscataqua Region Watershed NPDES Phase II Community? LID Required? Mimic Pre Development Hydrology? Maximize On- Site Infiltration? Surety Required From Developer? Does Municipality Have A Stormwater Utility? Acton no no yes yes no no Barrington no no yes no no no Berwick yes yes no yes no no Brentwood yes no no no yes no Brookfield no no no no yes no Candia no no no no yes no Chester yes no no no yes no Danville yes no no no yes no Deerfield no no no no no no Dover yes yes no yes no no Durham yes no yes yes yes no East Kingston yes no no no no no Eliot yes no yes no no no Epping no no yes yes yes no Exeter yes no no yes yes no Farmington no no yes no no no Fremont no no yes no yes no Greenland yes yes yes no no no Hampton yes yes yes yes yes no Hampton Falls yes no no no yes no Kensington yes no yes no no no Kingston yes no yes no yes no Kittery yes no yes no no no Lebanon no no no no no no Lee yes no no no no no Madbury yes no no no no no Middleton no no no no no no Milton yes no no no no no New Durham no no no no yes no Newcastle yes no yes yes yes no Newfields no no no no yes no Newington yes yes yes yes yes no Newmarket no no no no no no North Berwick no no no yes no no North Hampton yes no no no no no Northwood yes no yes no yes no Nottingham no no no no no no Portsmouth yes no no no yes no Raymond no no no yes yes no Rochester yes no no no no no Rollinsford yes no yes no yes no Rye yes no yes no yes no Sandown yes no no no yes no Sanford no no no yes no no Seabrook yes no yes no yes no Somersworth yes no yes yes yes no South Berwick yes no no no yes no Strafford no no no no yes no Stratham yes no no yes yes no Wakefield no no no no yes no Wells no yes no yes yes no Yor k no no no no no no 31 yes (60%) 6 yes (12%) 19 yes (37%) 15 yes (29%) 29 yes (56%) 0 yes (0%) Requiring that Low Impact Development (LID) approaches are used for all significant new development and re-development is one tool that municipalities have to minimize and treat stormwater issues at their source. Only six municipalities (12%) report currently requiring that developers use LID approaches. Nineteen municipalities (37%) report requiring developers to demonstrate that the post-development condition of the site will mimic pre-development hydrology. Requiring that developers maximize on-site infiltration of precipitation and stormwater is an effective way to guide developers to cover less of a lot with impervious surfaces, to retain groundwater recharge on a site, and to minimize the amount of stormwater that must be retained and treated using structural stormwater management systems (such as retention ponds, swales, hydrodynamic separators, etc.). Fifteen municipalities (29%) indicate that their current regulations require maximizing on-site infiltration. Requiring a stormwater management surety (i.e. performance bond) from a developer prior to issuing a development permit is an effective way to safeguard the municipality from developments that fail to properly construct or maintain their stormwater systems. Twenty-nine municipalities (56%) indicated that they currently require a stormwater management surety from developers. Addressing polluted stormwater associated with municipalitymanaged storm sewer systems is a challenging and expensive undertaking especially given that much of the existing development that contributes stormwater to these networks was not designed to provide water quality treatment. To comply with Clean Water Act standards, many municipalities will need to institute a long-term stormwater management effort that will likely require a reliable revenue source similar to the way municipalities fund community drinking water or sewer treatment plants. One way to raise the required revenue is through the use of a municipal stormwater utility fund. These funds are being established in larger cities throughout the U.S., but no municipalities in the Piscataqua Region currently have such a fund. 30
33 Table 8. Stormwater Performance Standards of Municipal Regulations Relative to Model Ordinance Standards EIC < 10% of Site? * Ponds Designed for 50 yr 24 hr Storm? Infiltration Devices Designed for 10yr 24 hr Storm? Post Dev. Match Pre Dev. Peak Flow for 10 and 50 yr 24 hr Storm? Post Dev. Runoff Volume = % Pre Dev.? Acton no no no no no Barrington no yes no yes no Berwick no no no no no Brentwood no no yes yes no Brookfield no no no no no Candia no no no no no Chester no no no yes no Danville no yes yes yes no Deerfield no yes yes no no Dover no no yes no no Durham no no no yes no East Kingston no no no no no Eliot no no no no no Epping no yes yes yes no Exeter no no yes no no Farmington no no no yes no Fremont no yes yes yes no Greenland no no yes yes no Hampton no yes yes yes no Hampton Falls no yes yes yes no Kensington no yes yes no no Kingston no no no yes no Kittery no no no no no Lebanon no no no yes no Lee no no no no yes Madbury no no no no no Middleton no no no no no Milton no no no no no New Durham yes no no yes yes Newcastle no no yes no no Newfields no no yes no no Newington no yes yes yes yes Newmarket yes no no no no North Berwick no no no no no North Hampton no no yes no no Northwood no no yes yes yes Nottingham no no no no no Portsmouth no yes yes no no Raymond no no no no yes Rochester no no no yes no Rollinsford no no no no no Rye no yes yes yes no Sandown no no yes no no Sanford no no no yes no Seabrook no yes yes yes no Somersworth no no no no no South Berwick no no no no no Strafford no no no no no Stratham no no no yes no Wakefield no no no yes no Wells no yes no no no Yor k no yes no no no 2 yes (4%) 14 yes (27%) *"EIC" = effective impervious cover 20 yes (38%) 22 yes (42%) 5 (10%) A great deal of research has documented that when roughly 10% or more of the land area of a watershed is covered with impervious surfaces, water quality typically becomes impaired. One tool to reduce the amount of new impervious surfaces on developing lots is to establish a cap on impervious surfaces. Impervious cover that does not contribute directly to stormwater runoff from a site can be considered disconnected from surface waters and subtracted from the total impervious cover calculation for a development site. Any impervious surfaces that are not disconnected from surface waters are considered effective impervious cover (NHDES, 2008(a)). For a developer to comply with a 10% effective impervious cover cap, they will often have to protect natural hydrology patterns and utilize LID techniques all of which results in reducing the generation of stormwater runoff from the site and providing more assurance that new developments do not cumulatively further impair water quality in local waterways. Only two municipalities (4%) in the Piscataqua Region currently utilize a 10% effective impervious cover cap requirement for at least certain types of developments in specific zoning districts. Several of the assessment questions in Table 8 relate to whether or not existing municipal stormwater management regulations meet current recommended engineering design standards. This is important because stormwater management systems that are not designed to manage the volume and runoff rates of water generated by large storm events will be ineffective at protecting streams and rivers from negative flooding impacts and water quality problems. Fourteen municipalities (27%) meet the current recommended design storm standards for stormwater detention ponds, twenty municipalities (38%) meet current standards for infiltration devices, twenty-two municipalities (42%) meet standards for peak flow control, and five municipalities (10%) meet standards for overall stormwater volume control. In summary, for all stormwater management performance standards evaluated, the significant majority of municipalities (58%-96% depending on the standard evaluated) do not meet current standards. Therefore, locally-permitted development that is not otherwise regulated for stormwater management by state or federal laws is unlikely to adequately protect Piscataqua Region municipalities from further negative flooding and water quality impacts. The implementation and enforcement of clear, consistent, modern stormwater management regulations for both new development and redevelopment within the Piscataqua Region is thus a top priority. 31
34 Erosion & Sediment Control Key Questions: How clear are the requirements for controlling sediment runoff at development sites? How do the standards for each municipality compare with current state recommendations and how often are on-site inspections conducted? When development or re-development of a site occurs, the disturbance of vegetation and soils combined with increased runoff from impervious surfaces creates very high potential for soil erosion from the site and delivery of polluted runoff from the site to adjacent waterways. Negative impacts associated with poor erosion and sediment control include: streambank erosion, flooding/sedimentation of adjacent properties, destabilization of steep slopes, and pollution of waterways with sediment, chemical contaminants, and excessive nutrient loading (NHDES 2008(a)). This section discusses erosion and sediment control practices that relate primarily to the short term management of stormwater during the construction phase of a development project. Longterm post-development stormwater management practices are generally covered in the Stormwater Management section of this report. While these topics are discussed and evaluated separately in this document, in reality municipal policies for both topics should be tightly coupled for consistency, and could be covered in one ordinance or set of development regulations. Table 9 summarizes the data collected for each municipality pertaining to erosion and sediment control regulations. Only two municipalities (4%) reported having a stand-alone stormwater management ordinance (apparently separate from their zoning ordinance) in place at the time of the assessment. Thirty-two municipalities (62%) reported having erosion and sediment control provisions in their site plan regulations, forty-three (83%) reported having them in their subdivision regulations, thirteen (25%) reported having a erosion and sediment control section as part of their zoning ordinance, and two municipalities (4%) reported having essentially no erosion and sediment control regulations. Nineteen municipalities (37%), had erosion and sediment control regulations in either there site plan or subdivision regulations but not both which is the same result as the stormwater regulations and indicates a likely gap in regulatory oversight for certain types of development projects. Nine municipalities (17%) had erosion and sediment control provisions in three different places: site plan review regulations, subdivision regulations, and zoning ordinance. Only two municipalities (Farmington and Middleton) appear to have an erosion and sediment control section in their zoning ordinance, but no erosion and sediment control provisions in their site plan and subdivision regulations. The 2008 NHDES model ordinance suggests that any development disturbing greater than 20,000 square feet (just less than half an acre) of land should be required to comply with specific erosion and sediment control standards and practices. The threshold of disturbance which triggers the application of any municipality s stormwater management requirements is thus an important determinant of what types of projects will be subject to the regulations. The last column in Table 9 summarizes the disturbance threshold at which each municipality s erosion & sediment control regulations are currently triggered. The most remarkable insight from this column is that thirty-one municipalities (60%) do not have a clearly defined disturbance threshold which implies that it is currently unclear to developers, citizens, and municipal representatives when and how to apply their erosion and sediment control regulations to development proposals. This result is consistent with the lack of clear applicability standards for long-term stormwater management noted in the previous section of this report. For municipalities that have defined a disturbance threshold, sixteen municipalities (31%) have a threshold at or below the 20,000 square feet standard proposed by NHDES, four municipalities (8%) have higher thresholds than recommended, and one municipality applies erosion and sediment control regulations if 2 or more lots are developed. In summary, a majority of municipalities (67%) have either no defined threshold, or a defined threshold significantly above what is recommended. Table 10 summarizes municipal survey results for several erosion and sediment control performance standards recommended by NHDES. Thirty-eight municipalities (73%) require a surety from developers as a mechanism to ensure proper erosion and sediment control. Twenty-six municipalities (50%) report that they require erosion and sediment and stormwater management control measures to be designed and installed to control the postdevelopment peak rate of runoff so that it does not exceed predevelopment runoff for the two-year, 10-year, and 25-year/24- hour storm event. Forty-four municipalities (85%) do not define a post-development peak runoff rate associated with erosion and sediment control regulations. 32
35 Table 9. Location of Erosion & Sediment Control Regulations within Municipal Documents in the Piscataqua Region Watershed Table 10. Erosion & Sediment Control Performance Standards of Municipal Regulations Relative to Model Ordinance Standards E&S Control Ordinance? Site Plan Regulations Subdivision Regulations Zoning Ordinance No Existing Regs. Soil Disturbance Threshold For Regulations (square feet) Acton no yes yes yes no ND Barrington no yes yes no no ND Berwick no yes yes yes no ND Brentwood no yes yes no no 20,000 Brookfield yes yes yes yes no 20,000 Candia no no yes no no ND Chester no no yes no no 20,000 Danville no yes yes no no 2 lots Deerfield no yes yes no no ND Dover no yes yes no no 43,560 Durham no yes yes yes no ND East Kingston no yes no no no ND Eliot no yes yes yes no ND Epping no no yes no no ND Exeter no yes yes no no 10,000 Farmington no no no yes no 50 Fremont no no yes no no ND Greenland no yes yes no no 20,000 Hampton no yes yes no no ND Hampton Falls no yes yes no no 20,000 Kensington no no yes no no ND Kingston no yes yes no no 20,000 Kittery no yes no no no ND Lebanon no no yes no no ND Lee no no yes no no ND Madbury no no no no yes ND Middleton no no no yes no ND Milton no no no no no ND New Durham no yes yes yes no 500 Newcastle no no yes no no 20,000 Newfields no yes no no no 20,000 Newington no no no no yes ND Newmarket no no yes yes no 43,560 North Berwick no no yes yes no ND North Hampton no no yes no no 20,000 Northwood no yes yes yes no ND Nottingham no no yes no no 20,000 Portsmouth no yes yes no no ND Raymond yes yes yes no no 20,000 Rochester no yes yes no no ND Rollinsford no yes yes no no 1,000 Rye no yes yes no no ND Sandown no no yes no no 50,000 Sanford no yes yes no no ND Seabrook no yes yes no no 40,000 Somersworth no yes yes no no ND South Berwick no yes yes yes no ND Strafford no no yes no no 1 Stratham no no yes no no ND Wakefield no yes yes no no ND Wells no yes no yes no ND Yor k no yes yes no no ND 2 yes (4%) 32 yes (62%) 43 yes (83%) 13 yes (25%) 2 yes (4%) 31 ND (60%) E&S Surety Required From Developers? Post Dev Match Pre Dev. Peak Flow for 2, 10 and 25 yr 24 hr Storm? What Peak Flow Standard is Required? Acton no no State Regs. Barrington yes yes ND Berwick no yes ND Brentwood yes no ND Brookfield yes no ND Candia yes no ND Chester yes yes ND Danville yes yes ND Deerfield yes no ND Dover yes no 10 yr 24hr storm Durham yes yes ND East Kingston yes no ND Eliot no yes ND Epping yes yes ND Exeter yes yes ND Farmington yes no ND Fremont yes yes ND Greenland yes yes ND Hampton yes yes ND Hampton Falls yes no ND Kensington yes yes ND Kingston yes yes ND Kittery no yes ND Lebanon no no ND Lee yes yes ND Madbury no no ND Middleton yes no ND Milton no no ND New Durham yes yes ND Newcastle yes yes ND Newfields yes no ND Newington yes no ND Newmarket no no 25 year storm North Berwick no no 25 year storm North Hampton yes no ND Northwood yes yes ND Nottingham no no ND Portsmouth yes yes 2 yr, 24 hr storm event Raymond yes yes ND Rochester yes no ND Rollinsford no yes ND Rye yes yes ND Sandown no no 10 year storm Sanford yes yes ND Seabrook no no ND Somersworth no no ND South Berwick yes yes ND Strafford yes no NH DOT Standard Stratham yes yes ND Wakefield yes yes 50 year/24 hr storm Wells yes no ND Yor k yes no ND 38 yes (73%) 26 yes (50%) 44 ND (85%) ND = not defined ND = not defined 33
36 The NHDES model ordinance for erosion and sediment control recommends five separate site inspections by a representative of the municipality (who can be a hired consultant) coinciding with the various phases of the development project. The intent is to have cooperative municipal involvement in avoiding impacts through better site design, ensuring measures are installed and maintained correctly during construction, and that long-term erosion control and stormwater management systems are working as intended after all construction is completed. Only 19% of municipalities inspect the development site prior to approving erosion and sediment control plans. This initial inspection is a prime opportunity for the municipality to ground truth the permit application information and to work with the developer proactively on avoiding unnecessary impacts before they happen. The fact that 81% of Piscataqua Region municipalities do not practice this is a lost opportunity for resource protection. Most municipalities (75%) focus their inspection attention on the installation of short-term erosion and sediment control best management practices (BMPs). Only 23% of municipalities inspect these systems to see how they actually performed at controlling erosion and sedimentation during or following a storm event. 42% of municipalities report inspecting semi-permanent and permanent stormwater control measures following installation. 23% of municipalities conduct a final inspection that certifies both short term and long term measures are working properly post-development. The site inspection composite score is a quick summary of how many inspections the municipality conducts (with the maximum ideal being 5). Six municipalities scored fives, four municipalities scored fours, five municipalities scored threes, seven municipalities scored twos, twenty municipalities scored ones, and ten municipalities scored zeros. The average for the region is 1.8 inspections per major development. Most of this inspection attention is directed at verifying the installation of BMPs and stormwater systems, but not at how they actually perform. These results imply that within many municipalities development sites will appear to have good BMPs in place, but that their actual performance in stopping erosion and preventing water quality degradation currently lacks adequate evaluation and enforcement. Table 11. Erosion & Sediment Control Site Inspection Requirements by Municipalities in the Piscataqua Region Watershed Pre Plan Approval Site Walk Post-Install of E&S Best Management Practices Post-Storm Inspection of Temporary Measures Post-Install Inspection of Permanent Measures Final Inspection of Full System Site Inspection Composite Score (0-5) Acton yes yes no yes no 3 Barrington yes yes yes yes yes 5 Berwick yes yes no yes no 3 Brentwood no no no yes no 1 Brookfield no no no no no 0 Candia no yes no no no 1 Chester no yes no no yes 2 Danville no yes no no no 1 Deerfield no yes no no no 1 Dover yes yes yes yes yes 5 Durham no yes yes yes no 3 East Kingston no yes no no no 1 Eliot yes yes no yes no 3 Epping no yes no no no 1 Exeter no yes no yes no 2 Farmington no yes yes yes no 3 Fremont no yes no yes no 2 Greenland no yes no no no 1 Hampton no yes no no no 1 Hampton Falls no yes no no no 1 Kensington no yes no no no 1 Kingston no yes no yes no 2 Kittery no no no no no 0 Lebanon yes no no no no 1 Lee yes yes yes yes yes 5 Madbury no no no no no 0 Middleton no no no no no 0 Milton no no no no no 0 New Durham no no no no no 0 Newcastle no yes no no no 1 Newfields no yes no no no 1 Newington no yes no no no 1 Newmarket no yes yes yes yes 4 North Berwick no yes no no no 1 North Hampton yes yes yes yes yes 5 Northwood no yes yes yes yes 4 Nottingham no no no no no 0 Portsmouth no yes no yes no 2 Raymond no yes no no no 1 Rochester yes yes yes yes yes 5 Rollinsford yes yes yes yes yes 5 Rye no no no yes no 1 Sandown no yes no no no 1 Sanford no yes no no no 1 Seabrook no yes no no no 1 Somersworth no no no no no 0 South Berwick no yes no no yes 2 Strafford no yes yes yes yes 4 Stratham no yes yes yes yes 4 Wakefield no no no no no 0 Wells no yes no yes no 2 Yor k no no no no no 0 10 yes (19%) 39 yes (75%) 12 yes (23%) 22 yes (42%) 12 yes (23%) AVG =
37 There are many technical reference manuals on sediment and erosion control BMPs. However, many of the older manuals are out of date and may not reflect the current state of scientific and regulatory knowledge. Table 12 summarizes how many municipalities make reference to a technical manual, and if so, which manual is referenced. Thirty-five municipalities (67%) have references to technical manuals, but most appear to be out of date. In New Hampshire, the most current technical manual was completed in 2008: The New Hampshire Stormwater Manual: Volume 3: Erosion and Sediment Controls During Construction (NHDES, 2008(b)). In Maine, the most current manual appears to be the 2003 Maine Erosion and Sediment Control BMPs (MDEP, 2003). It would benefit Piscataqua Region municipalities to make sure their regulations refer permit applicants to the most up to date technical manuals available. Table 12. Erosion & Sediment Control Technical Manual References by Municipality in the Piscataqua Region Watershed Regulations Refer to Best Management Practices Manual? Manual Name Acton yes Maine Erosion and Sediment Control Handbook for Construction: Best Management Practices Barrington yes Subdivision and Individual Sewage Disposal System Design Rules, NHDES Berwick yes Maine Erosion and Sediment Control Handbook for Construction: Best Management Practices Brentwood yes RCCD Erosion and Sediment Control Design Handbook Brookfield Candia no no Chester yes Stormwater Management and Erosion and Sediment Control Handbook Rockingham County Conservation District Handbook Danville yes RCCD Stormwater Management and Erosion Control Handbook NH DOT Manual on Drainage Design for Highways Deerfield Dover Durham East Kingston Eliot Epping yes yes yes no yes no Innovative Stormwater Treatment Technologies Stormwater Management and Erosion and Sediment Control Handbook for Urban and Developing Areas in New Hampshire, NHDES 1. Best Management Practices to Control Nonpoint Source Pollution: A Guide for Citizens and Town Officials, NHDES, January Stormwater Management and Erosion and Sediment Control for Urban and Developing Areas in New Hampshire, NHDES Exeter yes RCCD Erosion and Sediment Control Handbook Farmington no Fremont yes RCCD Stormwater Management and Erosion Control Handbook Greenland yes RCCD Stormwater Management and Erosion and Sediment Control Handbook Hampton yes RCCD Erosion and Sediment Control Handbook Hampton Falls yes RCCD Erosion Control and Sediment Control Handbook Kensington yes RCCD Erosion and Sediment Control Handbook Kingston yes RCCD Stormwater Management and Erosion Control Handbook Kittery Lebanon Lee no no no Madbury yes NHDES manual Table 12. continued on next page 35
38 Table 12. continued Regulations Refer to Best Management Practices Manual? Manual Name Middleton yes RCCD - Stormwater Management and Erosion and Sediment Control Handbook Milton New Durham no yes Stormwater Management and Erosion and Sediment Control Handbook for Urban and Developing Areas in New Hampshire 1992 Newcastle yes RCCD Erosion and Sediment Control Handbook Newfields yes RCCD Erosion and Sediment Control Handbook Newington Newmarket no no North Berwick yes York County Soil and Water Conservation District North Hampton yes RCCD Erosion and Sediment Control Design Handbook for NH Northwood no Nottingham yes Erosion and Sediment Control Design Handbook for Developing Areas of NH (RCCD) Portsmouth no Raymond yes Stormwater Management and Erosion and Sediment Control Handbook for Urban and Developing Areas in New Hampshire Rochester yes Erosion and Sediment Control Design Handbook, USDA Soil Conservation Service. Rollinsford yes Strafford County Conservation District Standards Rye yes Urban Hydrology for Small Watersheds, Soil Conservation Service and RCCD Erosion and Sediment Control Handbook Sandown yes RCCD Erosion and Sediment Control Handbook Sanford Seabrook Somersworth no no no South Berwick yes Most recent NRCS guide Strafford yes Best Management Practices for Erosion Control on Timber Harvesting Operations in New Hampshire, 2004 Stratham yes RCCD Stormwater Management and Erosion Control Handbook Wakefield yes Erosion and Sediment Control Design Handbook for Developing Areas of New Hampshire Wells Yor k yes no 35 yes (67%) Maine Erosion and Sedimentation Control Handbook for Construction, Maine Department of Environmental Protection and the Cumberland County Soil and Water Conservation District,
39 Drinking Water Protection Key Question: What planning tools are municipalities using to protect their drinking water supplies? In the Piscataqua Region, public drinking water systems depend on both groundwater and surface water supplies. These sources include bedrock aquifers (commonly known as deep or artesian aquifers), stratified drift aquifers (commonly known as sand and gravel aquifers), rivers, lakes and reservoirs (NHDES, 2008(a)). In the New Hampshire portion of the PREP watershed alone, there are 122 community drinking water systems (103 domestic residential systems and 19 multi-use systems) that service about 60% of the resident population (Horn et al., 2008). The rest of the population is served by private individual wells, which are regulated differently than community systems and were not the focus of this portion of the PREP planning assessment project. Community water systems are required to meet strict federal Safe Drinking Water Act standards that specify maximum allowable concentrations of drinking water contaminants. Removing contaminants from supply water sources is extremely expensive and can be technically challenging to achieve. Thus, prevention of pollution to drinking water resources is the safest and most cost-effective approach to ensuring reliable long-term supplies of viable clean drinking water. The most effective way to protect drinking water sources is by controlling land uses - either through acquisition of the land or easements, or through land use controls. Land use controls can include zoning ordinances, site plan review regulations, and subdivision regulations (NHDES, 2008(a)). Protecting clean community drinking water supplies requires a multi-faceted approach involving mapping sourcewater areas, conserving land, restricting certain types of development over aquifers and adjacent to surface waters, effective control over both point and non-point sources of pollution, and education of municipal officials and private landowners. Drinking water supply areas often cross political jurisdictions, complicating effective planning and protection measures. Some community water systems rely on groundwater, some on surface waters (rivers, lakes, reservoirs), and some on a combination of both. Given this diversity of sources, a municipality s strategy for drinking water protection should be carefully tailored to site-specific conditions and based on a good understanding of the key contributing areas that warrant special protections. This portion of the assessment gathered basic information on whether or not a municipality is utilizing common planning and regulatory tools to understand and protect their drinking water resources. Results for all municipalities are summarized in Table 13. Table 13. Drinking Water Protection Strategies of Municipalities in the Piscataqua Region Watershed Wellhead Protection Regulations? Aquifer Protection Regulations? Source Water Protection District? Prohibition on Large Ground Water Withdrawals & Export? Water Resource Mgmt. Plan in Master or Comp Plan? Acton no yes no yes yes Barrington yes yes no no no Berwick no yes no no no Brentwood no yes no no yes Brookfield no no no no no Candia no no no no no Chester no yes no no yes Danville no no no no no Deerfield no yes no no no Dover yes yes yes no yes Durham no yes no no no East Kingston no no no no no Eliot no no no no yes Epping no yes no no yes Exeter no yes no no yes Farmington yes yes no yes yes Fremont no yes no no yes Greenland no yes no no yes Hampton no yes no no yes Hampton Falls no yes no yes yes Kensington no no no no no Kingston no yes no no yes Kittery no no no no no Lebanon no no no no no Lee no yes no no yes Madbury yes yes no no yes Middleton no yes no no no Milton yes yes yes no yes New Durham yes yes yes no yes Newcastle no no no no no Newfields no yes no no yes Newington no no no no yes Newmarket yes yes no no yes North Berwick no yes no no no North Hampton no yes no no yes Northwood yes yes no no yes Nottingham no yes no yes no Portsmouth no no no no yes Raymond yes yes no no yes Rochester no yes no no yes Rollinsford yes yes no no no Rye no yes no no no Sandown no no no no no Sanford yes yes yes no no Seabrook no yes no no no Somersworth yes yes no no no South Berwick yes yes no no no Strafford no no no no no Stratham no yes no no no Wakefield yes yes no no no Wells no yes yes yes yes Yor k no no yes no yes 14 yes (27%) 38 yes (73%) 6 yes (12%) 5 yes (10%) 27 yes (52%) 37

40 To protect groundwater sources, municipalities can adopt regulations that restrict land use development within wellhead and aquifer protection areas. These regulations are often in the form of an overlay district within the municipal zoning ordinance, and typically prohibit uses such as gas stations, wrecking yards, landfills, large parking lots, etc., and can also limit the overall amount of impervious surfaces in order to retain infiltration capacity of the landscape for the recharge of aquifers. Fourteen municipalities in the Piscataqua Region (27%) have adopted wellhead protection regulations that typically restrict certain land uses within a defined radius of a public water supply well. Thirty-eight municipalities (73%) have adopted aquifer protection regulations that affect land use above mapped aquifers of significance. To protect surface water supplies, municipalities can map surface water contributing areas and define a sourcewater protection district or overlay that protects natural water quality buffers (a wide zone of natural vegetation along a reservoir for instance). Six municipalities in the Piscataqua Region (12%) have implemented this approach. Some communities are concerned about protecting not only the quality of their local water resources, but also the quantity. Large groundwater withdrawals taken for export out of a municipality or watershed for commercial spring water businesses for example have the potential to impact other local water users and alter hydrologic regimes for local wetlands and waterways. Permits are required for these types of activities, but are usually handled at the state level. Some municipalities wish to have more of a role in the decision-making process on these issues, and have adopted local regulations that require local review and/or prohibit large withdrawals for export. Five municipalities (10%) have adopted local regulations that prohibit large groundwater withdrawals for export purposes. Floodplain Management Key Question: How actively are municipalities working to keep development out of dynamic floodplain areas and reduce flood hazards? Restricting development from floodplains makes sense both for protecting human life and property as well as for protecting the ecological function and water quality of river systems. The Piscataqua Region experienced highly destructive 100 year storm events in both 2006 and According to the 2006 report Climate Change in the U.S. Northeast, the frequency and intensity of heavy rainfall events in New England are increasing due to climate change (Frumhoff et al. 2007). The implications of this are that flood hazards can be expected to get more severe and that floodplain maps for the region that were developed using low resolution topography data and outdated precipitation data almost certainly under-represent the vulnerability of the region s floodplain areas to both inundation and erosion flood hazards. As shown in Table 14, fifty municipalities in the Piscataqua Region (96%) participate in the National Flood Insurance Program (NFIP) that is overseen by the Federal Emergency Management Agency (FEMA). Enrollment in this program by a community allows residents to buy federally-backed flood insurance. To be eligible for this program, a municipality must meet specific minimum floodplain management and planning guidelines established by FEMA. Thirty-nine municipalities (75%) reported having some prohibitions on development within floodplains. However, it is not clear from the current assessment how many municipalities in the region have adopted restrictions on floodplain development that exceed the minimum NFIP requirements. The basis for many of the drinking water protection measures discussed above should be articulated in the Master Plan (NH) or Comprehensive Plan (ME) for a municipality. Including a water resource protection evaluation or strategy in these plans helps guide the community planning process and can put the municipality in a stronger legal position if any of their regulatory protection strategies are challenged in court. Twenty-seven municipalities (52%) have incorporated a water resource management and protection plan into their municipal Master Plan or Comprehensive Plan. 38

41 Forty-seven municipalities in the Piscataqua Region (90%) have completed local Hazard Mitigation Plans. All municipalities in the New Hampshire portion of the Piscataqua Region have completed these plans, and half of the ten Maine municipalities have completed their plans. Completion of these plans has led to changes in local floodplain management regulations in five municipalities (10%) within the Piscataqua Region. Table 14. Hazard Mitigation Plans by Municipality in the Piscataqua Region Watershed National Flood Insurance Program Community? Hazard Mitigation Plan Completed? Date Adopted? Has Plan Changed Floodplain Management Regulations? Explain Regulation Changes As detailed in Table 15, twenty-five municipalities (48%) have electronic maps that document areas of past flood damage, and thirtyeight municipalities (73%) have a mapped floodplain overlay district. Floodplain management and hazard mitigation planning at the local level are complex technical issues that are difficult to assess and categorize via a summary survey of municipal environmental regulations. What is clear from this section of the assessment is that there has been a great deal of effort by Piscataqua Region communities and regional planning commissions on implementing floodplain management approaches (at least stringent enough to satisfy the minimum NFIP requirements) and on developing local hazard mitigation plans. It is not possible to know from this assessment to what extent certain communities have adopted floodplain development restrictions significantly above and beyond basic NFIP requirements, and how well communities are implementing their hazard mitigation plans in practice. Acton yes no no Barrington yes yes 2003 no Berwick no no no Brentwood yes yes 2008 no Brookfield yes yes 2006 no Candia yes yes 2005 yes Chester yes yes 2005 no Danville yes yes 2009 no Deerfield yes yes 2007 no Dover yes yes 2004 yes Durham yes yes 2005 no East Kingston yes yes 2007 no Eliot yes yes 2004 no Epping yes yes 2004 no Exeter yes yes 2006 no Farmington yes yes 2006 no Fremont yes yes 2009 no Greenland yes yes 2006 no Hampton yes yes 2005 no Hampton Falls yes yes 2006 no Kensington yes yes 2007 no Kingston yes yes 2008 no Kittery yes yes 2005 no Lebanon yes no - no Lee yes yes 2005 no Madbury no yes 2007 no Middleton yes yes 2005 no Milton yes yes 2005 no New Durham yes yes 2004 no Newcastle yes yes 2008 no Newfields yes yes 2009 no Newington yes yes 2007 no Newmarket yes yes 2006 no North Berwick yes no no North Hampton yes yes 2005 no Northwood yes yes 2005 no Nottingham yes yes 2005 yes Portsmouth yes yes 2005 no Raymond yes yes 2003 yes Rochester yes yes 2003 no Rollinsford yes yes 2004 no Rye yes yes 2005 yes Sandown yes yes 2009 no Sanford yes yes no Seabrook yes yes 2005 no Somersworth yes yes 2003 no South Berwick yes yes 2005 no Strafford yes yes 2005 no Stratham yes yes 2008 no Wakefield yes yes 2005 no Wells yes yes 2005 no Yor k yes no no 14 yes (27%) 38 yes (73%) 6 yes (12%) 5 yes (10%) *all Maine municipalities have not completed hazard mitigation plans chapter 113 of city code Town will work on a Fluvial Erosion Hazard Ordinance '07 Floodplain Development and Building Ordinance 27 yes (52%) 39
42 Table 15. Floodplain Mapping and Development Prohibitions by Municipality in the Piscataqua Region Watershed Electronic Maps of Past Flood Damage Available? Mapped Floodplain Overlay District? Prohibitions on Floodplain Development? Acton no yes yes Barrington yes yes no Berwick no no yes Brentwood yes yes yes Brookfield yes yes yes Candia no no yes Chester no yes yes Danville yes yes yes Deerfield no no yes Dover no no yes Durham no yes yes East Kingston yes yes no Eliot no yes yes Epping no yes yes Exeter yes yes yes Farmington no yes no Fremont yes yes yes Greenland yes yes no Hampton yes yes yes Hampton Falls yes yes yes Kensington yes yes no Kingston yes yes no Kittery no no yes Lebanon no no yes Lee no yes yes Madbury no no no Middleton no yes yes Milton no no yes New Durham yes no yes Newcastle yes yes yes Newfields yes yes no Newington yes yes yes Newmarket no yes yes North Berwick no yes yes North Hampton yes yes no Northwood no yes yes Nottingham no yes yes Portsmouth yes yes yes Raymond no no no Rochester yes yes yes Rollinsford yes yes yes Rye yes yes yes Sandown yes yes yes Sanford no no no Seabrook yes yes no Somersworth no no no South Berwick no yes yes Strafford yes no yes Stratham yes yes yes Wakefield no yes yes Wells no no yes Yor k no yes yes 25 yes (48%) 38 yes (73%) 39 yes (75%) Impervious Surface Limits Impervious surfaces such as paved parking lots, roadways, and building roofs increase the pollutant load, sediment load, volume, and velocity of stormwater flowing into rivers and estuaries. Studies conducted in other regions of the country have demonstrated water quality deterioration where impervious surfaces cover greater than 10 percent of the watershed area (CWP, 2003). In 2005, a study in the New Hampshire Seacoast Region demonstrated that the percent of urban land use within stream buffer zones and the percent of impervious surface in a watershed can be used as indicators of stream quality (Deacon et al. 2005). Overall within the Piscataqua Region, the area of impervious surfaces has grown from 28,710 acres in 1990 to 42,618 acres in 2000 to 50,351 acres in On a percentage basis, 4.3 percent, 6.3 percent, and 7.5 percent of the land area in the watershed was covered by impervious surfaces in 1990, 2000, and 2005, respectively. The number of watersheds with greater than 10 percent impervious surface cover was two in 1990, eight in 2000, and nine in In 2005, 16 of the 52 municipalities in the watershed had greater than 10 percent impervious surface cover. Between 1990 and 2000, an average of 1,391 acres of impervious surfaces per year were added to the watershed, and 1,547 acres per year were added between 2000 and 2005 (PREP, 2009). All of these summary statistics show that impervious surfaces continue to be added to the watershed at a steady rate of nearly 1,500 acres per year, which amounts to 0.2 percent of the land area in the watershed each year. The median imperviousness per capita for the 52 municipalities in the watershed grew from acres per person in 1990 to acres per person in 2000 to acres per person in The median value for 2005 was higher than the median of the PREP goals for the individual municipalities (0.169 acres per person). These statistics are clear evidence that land consumption per person in the Piscataqua Region watersheds is still increasing. One of the tools which municipalities can utilize to slow the growth in impervious surfaces and better protect water quality is to establish percent impervious surface caps for specific development zones (e.g. residential, commercial, industrial, etc.) Defining a limit to how much of a lot can be converted to impervious surfaces is a commonly used tool in aquifer protection overlay districts, but not currently widely used for other zones. However, given recent advances in low impact development (LID) techniques such as pervious pavement and green roofs, there are now practical ways to reduce impervious surfaces associated with most types of development. Defining a maximum impervious percentage cap within a zoning district is important because it requires 40
43 developers to think more creatively about preserving natural attributes of a development site during the early design phase, and it provides incentives for the use of LID techniques. For example, the 2008 NHDES model stormwater management ordinance recommends defining a cap of 10% effective impervious surface for residential-style development. Table 16 summarizes data on impervious surface limits by different zoning types for all municipalities in the Piscataqua Region. A slight majority of municipalities (58%) have defined impervious surface limits for land uses above important aquifers, but these limits range from 5%-65% impervious cover. Higher percentages of impervious cover would severely impact aquifer recharge and are highly likely to introduce contaminants into an aquifer essentially defeating the purpose of an aquifer protection overlay. Twenty-two municipalities (42%) have no defined limits on impervious cover above an aquifer area. It is recommended that municipalities with impervious cover limits over 10%, or no defined limits for impervious cover above their aquifers, strengthen protections for these important areas which are often relied upon for drinking water and maintenance of stream baseflows. Many municipalities have zoning districts that are somewhat unique, but nevertheless for the purposes of this assessment they can generally be lumped into broad zoning category types such as rural, residential, urban, commercial, and agricultural. For most of these zoning categories, the majority of municipalities (between 64%-81%) had no defined cap on impervious surfaces. However, for the commercial/industrial zone a slight majority of municipalities (52%) had defined caps, but they were often quite high. In summary, for most municipalities and most zoning categories, impervious surface caps are largely undefined. In areas where a cap is defined, it is usually too high to effectively control the ongoing rapid hardening of the watershed landscape, drive innovation in the use of LID practices, reduce negative impacts from the generation of excessive stormwater runoff, and protect the water quality of the region. Table 16. Impervious Surface Limits (% of lot coverage) by Zoning Category in Municipalities in the Piscataqua Region Watershed Aquifer Protection Area Rural Zone Residential Zone Urban Zone Commercial / Industrial Zone Agricultural Zone Acton Barrington ND ND 50 ND 50 ND Berwick Brentwood ND ND ND ND Brookfield ND ND ND ND ND ND Candia ND ND ND ND ND ND Chester Danville ND ND ND ND ND ND Deerfield ND ND ND ND ND ND Dover 20 ND ND ND Durham ND 100 ND East Kingston ND ND ND ND ND ND Eliot ND ND ND ND 70 ND Epping ND 75 ND Exeter ND ND ND ND Farmington 10 ND ND ND ND ND Fremont 10 ND ND ND ND ND Greenland 20 ND ND ND ND ND Hampton 60 ND 85 ND 85 ND Hampton Falls 20 ND 30 ND ND ND Kensington ND ND ND ND 60 ND Kingston 50 ND ND ND 70 ND Kittery ND ND ND ND ND ND Lebanon ND ND ND ND ND ND Lee 10 ND ND ND 25 ND Madbury 20 ND 25 ND Middleton 20 ND ND ND ND ND Milton ND ND ND ND ND ND New Durham ND ND Newcastle ND ND 20 ND ND ND Newfields 25 ND ND ND ND ND Newington ND ND ND ND ND ND Newmarket ND 10 ND ND ND ND North Berwick North Hampton 20 ND ND ND ND ND Northwood ND ND ND ND 50 ND Nottingham 10 ND ND ND 50 ND Portsmouth ND ND ND Raymond 20 ND ND ND ND ND Rochester 40 ND 30 ND Rollinsford Rye 35 ND 30 ND 75 ND Sandown ND ND ND ND ND ND Sanford ND ND ND ND 70 ND Seabrook ND ND ND ND ND ND Somersworth ND ND ND ND 40 ND South Berwick Strafford ND ND ND ND ND ND Stratham 20 ND Wakefield NA Wells ND Yor k ND ND ND ND ND ND 22 ND (42%) 38 ND (73%) 33 ND (64%) 42 ND (81%) 25 ND (48%) 41 ND (77%) ND = not defined 41
44 Other Regulatory Measures The purpose of this section of the assessment was to simply evaluate specific environmental regulatory tools that were not covered by the other issue topics. One tool that municipalities have used to try to limit sprawl-type development and protect undisturbed natural areas is to require new planned subdivision development projects to be designed and constructed as conservation subdivisions. A basic conservation subdivision ordinance requires that a certain percentage of the overall lot proposed for development is left relatively undisturbed and permanently protected as open space and/or conservation land. More sophisticated conservation subdivision ordinances require careful site-specific evaluation of development parcel s wildlife, habitat, water resources, and relationship to nearby conservation lands in order to maximize preservation of environmental values while allowing clustered development at higher density in a portion of the lot. Conservation subdivisions often allow the same overall density of units on a parcel as a conventional subdivision development, but just cluster them together more closely. While the use of conservation subdivisions aims to protect open space, it is not a tool that necessarily aligns tightly with overall wildlife habitat conservation and land protection strategies at the local level (although it should), so it was not incorporated into the wildlife habitat and voluntary conservation strategies sections of this report. Table 17 summarizes whether or not municipalities in the Piscataqua Region have a mandatory conservation subdivision requirement, and if so how much open space is required. Thirteen towns (25%) require the use of conservation subdivisions. Some towns have conservation subdivision development regulations, but they are optional at the discretion of the developer. Even when a town has a conservation subdivision requirement, the minimum open space as a percent of the lot area varies widely between 0-60%. Conservation subdivisions are a tool that should be used by more municipalities, and should be refined to better link conservation lands and protect wildlife values of a site as much as possible. Table 18 summarizes the use of steep slope protection regulations, development impact fees, and septic regulations more stringent than state minimum requirements for all towns within the Piscataqua Region. Table 17. Conservation Subdivision Requirements in Municipalities of the Piscataqua Region Watershed Mandatory Conservation Subdivision Regulations? Minimum Open Space as % of Lot Area Acton no 60 Barrington no 0 Berwick no 0 Brentwood no 0 Brookfield yes 5 Candia no 0 Chester no 50 Danville no 0 Deerfield yes 50 Dover yes 50 Durham yes East Kingston no 0 Eliot no 0 Epping no 0 Exeter no 0 Farmington no 0 Fremont no 0 Greenland no 50 Hampton no 0 Hampton Falls no 0 Kensington yes 0 Kingston no 0 Kittery no 0 Lebanon no 0 Lee yes 0 Madbury no 25 Middleton no 0 Milton yes 50 New Durham no 50 Newcastle no 0 Newfields yes 50 Newington no 0 Newmarket no 0 North Berwick no 0 North Hampton no 50 Northwood no 0 Nottingham no 0 Portsmouth no 0 Raymond yes 50 Rochester no 0 Rollinsford yes 40 Rye no 0 Sandown no 0 Sanford yes 40 Seabrook no 0 Somersworth no 0 South Berwick yes 50 Strafford no 40 Stratham no 35 Wakefield yes 0 Wells no 35 Yor k no yes (25%) 42

45 Table 18. Other Regulatory Provisions Steep Slope Protection Ordinance? Development Impact Fee? Septic Regulations More Stringent Than State? Acton yes no yes Barrington no yes no Berwick yes no yes Brentwood no yes yes Brookfield yes no yes Candia no no no Chester no no yes Danville no yes no Deerfield no yes no Dover yes yes yes Durham no yes yes East Kingston no yes no Eliot no no no Epping no yes no Exeter no no no Farmington no yes no Fremont no yes yes Greenland no no no Hampton no yes no Hampton Falls no yes no Kensington no no no Kingston no yes yes Kittery no yes no Lebanon yes no no Lee no no yes Madbury no no no Middleton yes no yes Milton no yes no New Durham yes yes no Newcastle yes no no Newfields no yes no Newington no no no Newmarket yes yes no North Berwick yes yes no North Hampton no no no Northwood yes no no Nottingham no no yes Portsmouth no yes no Raymond yes yes no Rochester no yes no Rollinsford no yes yes Rye no no yes Sandown no yes no Sanford no yes no Seabrook no yes no Somersworth no no no South Berwick no no no Strafford no no yes Stratham no no yes Wakefield no yes no Wells no yes no Yor k yes no yes 13 yes (25%) 28 yes (54%) 17 yes (33%) The coastal plain within the Piscataqua Region is fairly flat and broad adjacent to the Atlantic Ocean, but many towns (particularly those located in the headwaters of the region s rivers) have local areas of steep slopes that are poorly suited for development. Development on steep slopes can contribute disproportionately high loading of polluted stormwater, impact regionally rare habitat types, create serious erosion and sedimentation problems, and significantly detract from the aesthetics of the region. Thirteen towns (25%) have a steep slope protection ordinance that restricts development activities in steep areas. Development impact fees are typically paid as a condition of receiving development permits from a municipality, and must be directly used to help pay for public services and/or infrastructure affected in some way by new development. While towns may not use a majority of these fees for direct environmental conservation projects, the fees can serve as a disincentive to develop virgin land in rural areas of a town. Twenty-eight towns (54%) report having some sort of development impact fee. While both New Hampshire and Maine have state regulations that stipulate minimum standards for the siting, design, and installation of septic systems, municipalities are also granted authority by the states to enact more stringent (i.e. more environmentally protective) local regulations. Seventeen towns (33%) in the Piscataqua Region have septic regulations more stringent than those required by the state. 43

46 Non-Regulatory Conservation Strategies While much of this planning assessment effort was aimed at understanding the diversity of regulatory approaches and standards being used at the municipal level throughout the region, this section focused on non-regulatory conservation planning and action. Key Questions: How are towns working to protect land and water resources using voluntary or market-based incentives? Are there planning and incentive programs related to energy use and renewable energy? As shown in Table 19, thirty-six towns (69%) have completed open space plans or land protection plans specific to their town. The level of detail found within these plans varies greatly between towns, and the plans may not reflect conservation priorities from state, regional, or federal conservation plans. These plans often include prioritization criteria related to scenic views, farmland, historical value, recreational value, etc. and thus may not identify the highest conservation priorities from a conservation biology or water quality protection standpoint. Nevertheless, they are important conservation planning tools at the municipal level, and incorporating regionally significant Conservation Focus Areas identified in the Land Conservation Plan for New Hampshire s Coastal Watersheds and the Land Conservation Plan for Maine s Piscataqua Region Watersheds into these local plans is a priority implementation mechanism for accomplishing regional land protection strategies. Table 19. Open Space Plans and Conservation Easements in Municipalities of the Piscataqua Region Watershed Open Space Plan or Land Protection Plan? Year Adopted: Actively Working on Land Conservation Projects in Past Year? Conservation Easements Placed on Publicly Owned Lands? Conservation Easements Held By Town Regularly Monitored? Acton no no no no Barrington no yes yes yes Berwick no no no no Brentwood yes 2006 yes yes yes Brookfield yes in process no no no Candia yes 2001 yes no yes Chester yes 2005 yes no yes Danville no yes yes yes Deerfield yes NA yes no no Dover yes 2000 yes no yes Durham no yes yes yes East Kingston yes yes yes yes Eliot no yes no no Epping yes yes yes yes Exeter yes yes yes yes Farmington no yes yes yes Fremont yes 2004 yes yes yes Greenland no no no no Hampton yes yes yes yes Hampton Falls yes yes yes yes Kensington yes yes yes yes Kingston yes 2002 yes yes yes Kittery no yes yes no Lebanon no no no no Lee yes 2006 yes yes yes Madbury yes 2007 no no no Middleton yes no yes yes Milton yes 2007 yes no yes New Durham yes 2008 yes no no Newcastle yes 2002 yes no yes Newfields no yes yes yes Newington yes yes yes yes Newmarket yes 2007 no yes yes North Berwick yes no no no North Hampton yes 2006 yes yes yes Northwood yes 2007 yes no no Nottingham no yes yes yes Portsmouth yes yes yes yes Raymond yes 2003 yes no yes Rochester yes 2008, 2007 yes yes yes Rollinsford yes 2005 yes no yes Rye yes yes yes yes Sandown yes yes yes yes Sanford yes yes no no Seabrook no yes yes no Somersworth yes 2000 yes no no South Berwick yes yes yes no Strafford yes 2002 yes yes no Stratham no yes yes yes Wakefield yes Amended 2008 no no no Wells no yes yes yes Yor k no yes no no 36 yes (69%) 42 yes (81%) 30 yes (58%) 33 yes (63%) 44
 reported that they actively worked on a land conservation project within the past year.")
47 There is a great deal of land conservation work that is being implemented with support from local municipalities throughout the region (Table 19). Forty-two municipalities (81%) reported that they actively worked on a land conservation project within the past year. Thirty municipalities (58%) reported that conservation easements have been established on at least some townowned properties. Thirty-three municipalities (63%) indicated that they actively monitor conservation easements that are held by the municipality. In addition to engaging in land conservation projects, many municipalities are also investing significantly in permanent land protection via the purchase of conservation easements and/or full fee title ownership (Table 20). One fundraising mechanism utilized by New Hampshire municipalities for land conservation (and other conservation-oriented activities) is to establish a conservation fund that receives money from land use change tax (LUCT) proceeds. In New Hampshire, land that is in current use as rural or undeveloped land is lightly taxed until that land is developed at which time the landowner must pay a one-time LUCT fee to the municipality. Many municipalities designate at least a portion of this revenue towards a dedicated conservation fund that is often used to help acquire conservation land for the public. Twenty nine municipalities in the New Hampshire portion of the region (69% of NH municipalities) allocate some portion of their land use change tax revenue to a conservation fund. The percentage of LUCT revenue allocated for conservation varies between 5-100%, with most municipalities allocating 50% or 100% towards the conservation fund. Thirty-three municipalities (63%) reported spending public funds raised via a municipal bond or appropriation on land conservation projects. Seventeen municipalities reported spending a million dollars or more since the year The overall municipal cash investment in land conservation since 2000 as reported by the fifty-two municipalities in the Piscataqua Region is $47,724,559 which is almost certainly an under-estimate. Table 20. Investment of Public Municipal Funds in Land Conservation in the Piscataqua Region Land Use Change Tax Money For Conservation Fund? (NH)* % of Land Use Change Tax Allocated to Conservation Fund Public Funds Spent on Land Conservation? Total Value of Public Funds for Land Conservation Since 2000 Acton N/A N/A no $0 Barrington yes 50 yes $800,000 Berwick N/A N/A no $0 Brentwood no 0 yes $2,500,000 Brookfield no 0 no $0 Candia yes 100 yes $216,742 Chester yes 100 yes $3,000,000 Danville yes 100 yes $150,000 Deerfield yes 50 yes $1,200,000 Dover yes 100 yes $3,164,717 Durham yes 100 yes $2,500,000 East Kingston yes 50 yes $4,000,000 Eliot N/A N/A no $0 Epping no 0 yes $150,000 Exeter no 0 yes $2,500,000 Farmington yes 100 yes $0 Fremont yes 50 yes $1,500,000 Greenland no 0 no $0 Hampton yes 50 yes $200,000 Hampton Falls no 0 yes $3,000,000 Kensington yes 50 yes $1,500,000 Kingston no 0 yes $2,000,000 Kittery N/A N/A yes $0 Lebanon N/A N/A no $0 Lee yes 5 yes $3,503,100 Madbury no 0 no $0 Middleton yes 100 yes $0 Milton yes 50 no $0 New Durham yes 100 no $0 Newcastle no 0 no $0 Newfields yes 50 yes $2,000,000 Newington yes 100 yes $50,000 Newmarket yes 50 yes $200,000 North Berwick N/A N/A no $0 North Hampton yes 100 yes $4,000,000 Northwood no 0 yes $0 Nottingham yes 100 yes $850,000 Portsmouth yes 100 no $200,000 Raymond yes 30 no $0 Rochester yes 0 no $0 Rollinsford yes 0 yes $0 Rye yes 50 yes $2,000,000 Sandown yes 100 yes $1,500,000 Sanford N/A N/A no $0 Seabrook no 0 no $0 Somersworth no 0 no $0 South Berwick N/A N/A yes $40,000 Strafford yes 100 no $0 Stratham yes 100 yes $5,000,000 Wakefield no 0 no $0 Wells N/A N/A yes $0 Yor k N/A N/A yes $0 29 yes (69%) 33 yes (63%) $47,724,559 * Maine does not have Land Use Change Tax provisions. 45
48 As show in Table 21, seven municipalities (13%) provide some form of incentives to encourage the use of renewable energy sources. Thirty-one municipalities (60%) have formed carbon or energy efficiency committees to evaluate ways to increase the efficiency of municipally-owned buildings, provide recommendations on ways to reduce greenhouse gas emissions, or explore renewable energy incentive programs for their municipality. The fact that a majority of municipalities have these committees in place seems to demonstrate a high level of citizen interest in climate change issues and local sustainability efforts. Public Availability of Electronic Maps One of the challenges to improving protection and effective management of natural resources (both within and between municipalities) is getting citizens and decision-makers to understand the spatial relationships between natural resources and development patterns and practices. Ensuring the public has easy access to good map products is one way to help address this challenge. Good maps provide essential context for developing town Master and Comprehensive Plans, determining zoning districts, and identifying important conservation overlay districts, among many other uses. Thus, this section of the assessment evaluated whether or not municipalities have electronic versions of maps that can be easily accessed by citizens. This section was not intended to gauge how municipalities or citizens may utilize statewide online map server tools such as NH GRANIT or MEGIS. In order for citizens to better protect natural resources in their municipality, they first need to know what they have and where it is. Twenty-nine municipalities (56%) have electronic maps of the key Natural Resource Inventory features within their jurisdiction available to the public (Figure 14). This implies that for the other half of the region s municipalities, it could be very challenging for a citizen to find out where the important streams, wetlands, farmlands, wildlife habitat, etc. are located within their municipality. Many municipalities have conservation overlay districts that apply special regulatory protections to shorelands, wetlands, waterways, and other environmentally sensitive areas. It is important for municipal officials as well as citizens to be fully aware of where these overlay districts are and which landowners are affected. Therefore, maps showing the jurisdictional coverage of these regulations should be easily available for community members to access and view. Very few citizens are likely to take the time to seek out paper maps that are kept at a municipal office. Electronic versions of maps can easily be posted on a community website, viewed, downloaded, and printed. However, according to this assessment, only twelve municipalities (23%) currently have electronic maps of conservation overlay districts available to the public (Figure 15). Table 21. Renewable Energy Incentives and Committees Renewable Energy Incentives? Carbon or Energy Task Force? Acton no no Barrington yes yes Berwick no no Brentwood no yes Brookfield no no Candia no no Chester yes no Danville no yes Deerfield no yes Dover yes yes Durham yes yes East Kingston no yes Eliot no yes Epping yes yes Exeter no yes Farmington no no Fremont no yes Greenland no no Hampton no yes Hampton Falls no yes Kensington no yes Kingston no yes Kittery no yes Lebanon no no Lee no no Madbury no no Middleton no no Milton no yes New Durham yes no Newcastle no yes Newfields no yes Newington no yes Newmarket yes yes North Berwick no no North Hampton no yes Northwood no no Nottingham no no Portsmouth no yes Raymond no no Rochester no yes Rollinsford no no Rye no yes Sandown no yes Sanford no no Seabrook no yes Somersworth no no South Berwick no yes Strafford no yes Stratham no yes Wakefield no no Wells no no Yor k no yes 7 yes (13%) 31 yes (60%) 46

49 Table 22. Availability of Electronic Maps of Natural Resource Features and Overlay Districts by Municipality in the Piscataqua Region Watershed Electronic Maps of Natural Resource Inventory Features Available to the Public? Electronic Maps of Conservation Overlay Districts Available to the Public? Acton no yes Barrington yes no Berwick no no Brentwood yes no Brookfield no no Candia no no Chester no no Danville yes no Deerfield yes no Dover yes yes Durham yes yes East Kingston yes no Eliot no no Epping no no Exeter no no Farmington no no Fremont yes yes Greenland yes no Hampton no no Hampton Falls yes no Kensington yes no Kingston no no Kittery yes no Lebanon no no Lee yes no Madbury no no Middleton no no Milton no no New Durham no yes Newcastle yes no Newfields no no Newington yes no Newmarket yes yes North Berwick yes yes North Hampton yes no Northwood no no Nottingham no no Portsmouth yes no Raymond no no Rochester no no Rollinsford yes yes Rye yes no Sandown yes no Sanford yes yes Seabrook yes no Somersworth no no South Berwick yes yes Strafford yes no Stratham yes no Wakefield yes no Wells no yes Yor k yes yes 29 yes (56%) 12 yes (23%) Improved access to, and use of, natural resource maps is a critical priority that will enable municipalities to make smarter planning decisions, identify priority areas for land protection, and coordinate inter-municipal conservation strategies for issues such as drinking water protection and wildlife habitat preservation. 47
50 Comparison of Key Environmental Regulatory Standards: New Hampshire and Maine This section of the report provides a quick comparison between major state-level environmental regulations between New Hampshire and Maine. Given PREP s emphasis on protecting water quality and critical wildlife habitats, Table 23 focuses on several key state laws and implementing rules of most relevance to PREP s mission, and is not intended to be a comprehensive list of environmental regulations for either state. The comparison table is useful for highlighting differences and similarities in protected resources and state-level environmental standards. Table 23. Comparison Table of New Hampshire and Maine State Regulations for Select Water Resource and Habitat Protection Issues Shoreland Protection Requirements Erosion & Sediment Control Requirements Minimum Septic Setback From Waterway Requirements NEW HAMPSHIRE MAINE Law or Rule: Env-Wq CMR 241 Regulatory Authority: NHDES Subsurface Systems Bureau Subsurface Wastewater Program Summary Description: NEW HAMPSHIRE 75 feet 100 MAINE Law or Rule: RSA 485-A:6, VIII; RSA 485-A:17 Erosion and Sediment Control Law Regulatory Authority: NHDES Alteration of Terrain Program MDEP NOTE: NH does not issue National Pollution Discharge Elimination System (NPDES) permits Summary Description: NEW HAMPSHIRE Land disturbances > 1 acre covered under federal EPA NPDES Construction General Permit requirements MAINE Law or Rule: Comprehensive Shoreland Protection Act Mandatory Shoreland Zoning Act Regulatory Authority: NHDES Summary Description: Wetlands & Waterways Shoreland areas covered by the Act are limited to 4th order + stream segments, lakes, tidal waters, and state designated river segments Does not apply to most 3rd order and lower streams State administers regulations (towns may opt to adopt complimentary local regulations) Protected shoreland zone extends 250 feet from the waterway reference line and consists of three zones: waterfront buffer (0-50 ), woodland buffer ( ), and NEW HAMPSHIRE MDEP and municipal governments Shoreland areas are areas within 250 feet of the normal high water line of any great pond, river, saltwater body, or of the upland edge of a coastal or freshwater wetland; and within 75 feet of the normal high water line of a stream Does not apply to first order streams Municipalities implement law through adopting local regulations that must be approved by MDEP 75 primary structure setback on wetlands & streams, 100 on great ponds & some rivers, 25 in General Development District MAINE Law or Rule: State Law RSA 482-A Natural Resource Protection Act Rules Chapter 310 Regulatory Authority: NHDES Wetlands Bureau Summary Description: Major projects in sand dunes, tidal wetlands, or bogs, within 100 feet of the highest observable tide line, >20,000 sq.ft., >20 cu.yds from waterways, 200 linear ft. of shoreline/stream mitigation required Minor and minimum impact projects require permit, but often no mitigation Mitigation may be creation, restoration, in lieu fee, preservation of uplands 100 wetland buffers required on designated prime wetlands MDEP Projects fall into Tier 1, 2, or 3 depending on impact with higher levels of scrutiny as tiers increase No mitigation for <500 sq.ft in wetlands of special significance or <15,000 sq. ft. in freshwater wetland not of special significance, <150 of shoreline alteration Mitigation may be creation, restoration, enhancement of wetlands, or preservation of uplands 250 managed buffer zone around vernal pools designated significant wildlife habitat Activities that disturb the landscape take reasonable measures to prevent erosion and sedimentation in adjacent waterways. No permit is required but this law is referenced in the permit for the Stormwater Management Law 48
51 Stormwater Management Requirements NEW HAMPSHIRE MAINE Law or Rule: RSA 485-A:6, VIII; RSA 485-A:17 Stormwater Management Law Maine Construction General Permit Regulatory Authority: NHDES Alteration of Terrain Program NOTE: NH does not issue National Pollution Discharge Elimination System (NPDES) permits MDEP (Stormwater Management Law) NPDES permits handled by MDEP (Maine Construction General Permit) Summary Description: Permit required for contiguous ground disturbance >100,000 sq.ft. or >50,000 sq.ft. in protected shoreland area AoT permit by rule applies to smaller sites Peak flow control for 10 and 50 year storm, but with large exemption loophole Must treat Water Quality Volume, Water Quality Flow and Groundwater Recharge Volume Applies to 1 acre+ of disturbed area Permit-by-rule is necessary for a project with one acre or more of disturbed area but less than 1 acre impervious area (20,000 square feet for most-at-risk lakes and urban impaired streams) and less than 5 acres of developed area Peak flow control for 2, 10, 25 year storms Re-development does not need to improve stormwater mgmt. Standards don t mention Water Quality Volume, Water Quality Flow and Groundwater Recharge Volume Instream Flow Protection NEW HAMPSHIRE MAINE Law or Rule: RSA 483 Chapter 587 Regulatory Authority: NHDES Rivers Management and Protection Program MDEP Sustainable Water Use Program Summary Description: Hydropower Relicensing Rivers Management and Protection Program requires flow protection for Designated Rivers. NEW HAMPSHIRE Establishes stream flow and lake water level standards to maintain natural variation of flow and water level MAINE Law or Rule: N/A Maine Waterway Development and Conservation Act Regulatory Authority: MDEP Summary Description: Federal Clean Water Act requires state certification that hydropower projects comply with state water quality standards State must certify that continued operation of the project will comply with Maine s water quality standards. Agricultural Nutrient Management NEW HAMPSHIRE MAINE Law or Rule: Agricultural Nutrient Management (ANM) Program Maine Nutrient Management Law Regulatory Authority: NH Department of Agriculture, Markets, & Food Summary Description: Technical assistance in applying BMPs to private operations Grants up to $2500/year to farmers very small program Ban on winter manure spreading Nutrient Management Grant Program and Loan Program Some agriculture operations required to develop a Nutrient Management Plan Established a Nutrient Management Review Board to make recommendations pertaining to Nutrient Management Wildlife Habitat NEW HAMPSHIRE MAINE Law or Rule: State Law RSA 482-A Natural Resource Protection Act: Chapter 335 Regulatory Authority: NHDES Wetlands Bureau Summary Description: Wetlands, waterways, and sand dunes protected by Wetland Bureau, but no other wildlife habitat protection provisions comparable to Maine Significant wildlife habitat mapping by MIF&W, permitting by MDEP Permits needed for work in coastal sand dune systems, coastal wetlands, significant wildlife habitat, fragile mountain areas, freshwater wetlands, great ponds and rivers, streams or brooks Significant wildlife habitats include: wading bird and waterfowl habitat, shorebird feeding and roosting areas, deer wintering areas, and significant vernal pools 49
52 CONCLUSIONS AND RECOMMENDATIONS Based on analysis of the municipal and state environmental regulations and policy in the Piscataqua Region, this section summarizes gaps, inconsistencies, and highest priority opportunities for improvements. The suggestions and priorities in this section apply generally to the region as a whole, and may or may not apply to any specific municipality. Residents and representatives from a specific community can review the data for their town for each of the issue evaluated by this assessment in order to identify areas in need of improvement. In addition, recommendations tailored to each individual town were sent with the cover letter for this report when it was mailed to municipal decision-makers. Municipalities are also encouraged to contact PREP for a copy of the completed assessment form for their town, and to provide corrections and updates to the data presented in this report. Priorities for Improvement at the Municipal Level Conservation Fundamentals Half of the municipalities report having a completed Natural Resource Inventory (NRI). NRIs should be completed and regularly updated for all municipalities in the Piscataqua Region. All municipalities are encouraged to have active Conservation Commissions. Currently 79% of New Hampshire municipalities have a Natural Resource Chapter in their Master Plan. PREP recommends that all New Hampshire municipalities incorporate a Natural Resource Chapter in their Master Plan. Wildlife Habitat Pre-application meetings for development projects are a valuable mechanism that can proactively avoid unnecessary impacts to wildlife habitat prior to expending extensive design costs by the site developer. 69% of PREP municipalities to not appear to implement this practice, indicating that many municipalities should be more proactive at discussing with developers how to minimize impacts to wildlife during the initial design phase of a proposed development project. Only 13% of PREP municipalities in NH have incorporated the Conservation Focus Areas (CFAs) identified in The Land Conservation Plan for New Hampshire s Coastal Watersheds into their Natural Resource Inventories (NRIs). These mapped CFAs represent the best remaining places to protect the highest quality wildlife habitat in the region and should be used by municipalities to prioritize permanent land protection projects. CFAs for the Maine portion of PREP s watershed have also recently been identified in the The Land Conservation Plan for Maine s Piscataqua Region Watersheds. Both the New Hampshire and Maine conservation plans contain model ordinances that municipalities can adopt to establish conservation overlay districts over mapped CFAs to help limit fragmentation of these areas from unrestricted development. In order to protect the best remaining blocks of high quality wildlife habitat in the region, PREP recommends that municipalities adopt these CFA protection overlay districts. Wildlife Action Plans have been completed for both New Hampshire and Maine, but only 17% of the PREP municipalities reported that they have incorporated this information into their NRIs. New Hampshire Fish and Game can provide technical assistance and grant funding to help New Hampshire communities integrate wildlife habitat protection into municipal planning activities. In Maine, comparable assistance is provided to local municipalities through the Beginning with Habitat program led by the Maine Department of Inland Fisheries & Wildlife. Wetland Protection 44% of municipalities in the PREP watershed have wetlands that are considered either prime or significant. In New Hampshire, there are 29 municipalities that have not designated any prime wetlands. PREP recommends that these towns conduct a prime wetland evaluation using a certified wetland scientist and nominate particularly important wetlands for additional protections offered through prime wetland designation. 27% of municipalities have local regulations that explicitly offer protection to vernal pools. PREP recommends that the other 73% of municipalities in the region amend their wetland protection ordinances to ensure protection of vernal pool wetland habitat and their associated upland buffers. Minimum required setback distances between developments and wetlands vary considerably among municipalities. A majority of municipalities (56%) do not meet the 100 suggested protective standard setback for neither buildings nor septic systems. PREP recommends that municipalities that do not currently meet this protective standard amend their regulations to ensure the protection of wetland habitat and water quality. 50
53 Shoreland Buffers 29% of municipalities lack any regulatory protections for shoreland buffers within their municipality. Within municipalities that have some form of shoreland buffer regulations, the width of the buffers is typically inadequate to protect water quality and provide quality riparian wildlife habitat. Buffer width regulations vary dramatically among municipalities in the region, and as a whole fail to protect water resources. PREP recommends that all municipalities adopt local regulations that protect undisturbed native vegetation buffer zones in uplands adjacent to all waterways to at least the minimum recommended standard of 75 on 1st order streams and 100 on all other waterways. This recommendation is a top priority for the protection of the region s water resources. 56% of municipalities do not require the recommended 100 setback distance between a primary structure (typically a single family home) and the shoreline of waterbodies of different sizes/types. PREP recommends that all municipalities adopt regulations that require new primary structures to be located at least 100 away from waterways. 85% of municipalities report no local requirements for minimum distances between the application of fertilizer adjacent to any size stream, pond, or lake. Only 14% of municipalities with tidal shorelands reported any required setback for the application of fertilizer adjacent to tide lands. Given the well-documented detrimental impacts of nitrogen loading to rivers and estuaries, requirements for larger fertilizer application setbacks (and public outreach on the importance of them) is a high priority for improvement. Stormwater Management / Erosion & Sediment Control The majority of municipalities do not clearly define the size of land disturbance at which their stormwater management and erosion & sediment control regulations should be applied to development projects. In addition, most communities in the region (58%-96% depending on the standard evaluated) lack stormwater management performance standards necessary to protect water quality and provide flood protection. Erosion & sediment control regulations and inspection oversight varies considerably among municipal jurisdictions. PREP recommends that all municipalities update and adopt integrated stormwater management and erosion & sediment control ordinances and/or site plan and subdivision regulations that clearly specify the types/ sizes of development projects covered by the regulations, and require that stormwater management standards recommended by state model ordinances are addressed in new development and re-development projects. This recommendation is a top priority for the protection of the region s water resources. PREP recommends that all municipalities require developers to protect undisturbed areas in a development lot, minimize new impervious surfaces by requiring caps on effective impervious cover, and utilize Low Impact Development (LID) techniques to the maximum extent practicable. Drinking Water Protection 27% of municipalities have adopted wellhead protection regulations, 73% have adopted aquifer protection regulations, 12% have a sourcewater protection district or overlay, and 52% have incorporated a water resource management and protection plan into their municipal Master Plan or Comprehensive Plan. Overall, there is a great deal of drinking water protection planning and implementation that needs to be continued at the municipal and watershed-scale inter-municipal level within the Piscataqua Region. PREP recommends that municipalities implement a comprehensive drinking water protection strategy that recognizes the regional shared nature of this resource and works to protect groundwater and surface water supplies through both voluntary land conservation action and responsible land use regulatory controls in sensitive sourcewater areas. Both New Hampshire and Maine have state drinking water protection programs that provide technical and financial assistance to municipalities for this purpose. PREP recommends that municipalities with impervious cover limits over 10%, or no defined limits for impervious cover above their aquifers, strengthen protections for these important areas which are often relied upon for drinking water and maintenance of stream baseflows. Floodplain Management 96% of Piscataqua Region municipalities participate in the National Flood Insurance Program (NFIP), 90% have completed local Hazard Mitigation Plans, and 75% reported having some prohibitions on development within floodplains. There has been a great deal of effort by Piscataqua Region communities and regional planning commissions on floodplain and hazard mitigation planning. PREP recommends that municipalities build on this important work by adopting floodplain development restrictions that are more protective than basic NFIP requirements and pursuing fluvial erosion hazard (FEH) studies and overlay districts to better preserve floodplain functions and keep development out of harm s way. 51
54 Impervious Surface Limits For most municipalities and most zoning categories, impervious surface caps are largely undefined. In areas where a cap is defined, it is usually too high to effectively control the ongoing rapid hardening of the watershed landscape, drive innovation in the use of LID practices, reduce negative impacts from the generation of excessive stormwater runoff, and protect the water quality of the region. PREP recommends that municipalities explore the use of impervious surface or effective impervious surface caps tailored to individual zoning districts in order to meet these objectives. Other Regulatory Measures 25% of Piscataqua Region municipalities require the use of conservation subdivisions. PREP recommends that all towns consider requiring conservation subdivisions that protect at least 50% of the developable land as permanently conserved natural areas. Good model ordinances for conservation subdivisions are available for both New Hampshire and Maine. Ordinance provisions should ensure that wildlife values of a particular subdivision site are preserved as much as possible through good site design and retaining linkages to adjacent protected lands. 25% of Piscataqua Region municipalities have a steep slope protection ordinance that restricts development activities in very steep areas. PREP recommends that all municipalities consider a steep slope ordinance to minimize disturbance of vegetation and soils that are subject to high erosion potential. 33% of Piscataqua Region municipalities have septic regulations more stringent than the minimum state regulatory requirements. Given the high potential of septic systems to contribute to nutrient and bacteria loading of the region s waterways, PREP recommends that municipalities consider more stringent siting and design requirements as supported by scientific research and local conditions. Non-Regulatory Conservation Tools The Land Conservation Plan for New Hampshire s Coastal Watersheds and The Land Conservation Plan for Maine s Piscataqua Region Watersheds identify the most regionally significant conservation priorities for the protection of high quality wildlife habitat and water quality. PREP recommends that all municipalities incorporate the Conservation Focus Areas identified in these plans into their local open space plans as top priority areas for permanent land protection. 69% of New Hampshire towns currently allocate some portion of their land use change tax (LUCT) revenue to a conservation fund. The percentage of LUCT revenue allocated for conservation varies between 5-100%, with most towns allocating 50% or 100% towards the conservation fund. Conservation funds are often used to help the municipality secure permanent public conservation land. PREP recommends that all New Hampshire municipalities establish a conservation fund to collect 100% of the proceeds from LUCT revenue. A majority of municipalities in the Piscataqua Region have invested significant resources in the permanent protection of public conservation land via bonds for land acquisition, partnering with land trusts, securing private and federal land conservation grants, placing conservation easements on municipality-owned property, etc. PREP recommends that all municipalities within in the region pursue permanent land conservation opportunities as the most effective way to protect water resources and wildlife habitat over the long term. 13% of Piscataqua Region municipalities provide some form of incentives to encourage the use of renewable energy sources, and 60% have formed carbon or energy efficiency committees to evaluate ways to increase the efficiency of town-owned buildings, provide recommendations on ways to reduce greenhouse gas emissions, or explore renewable energy incentive programs for their municipality. PREP recommends that all municipalities establish active citizen committees on energy sustainability issues to help guide municipal improvements. Public Availability of Electronic Maps Improved access to, and use of, natural resource maps is a critical priority that will enable municipalities to make smarter planning decisions, identify priority areas for land protection, and coordinate inter-municipal conservation strategies for issues such as drinking water protection and wildlife habitat preservation. PREP recommends that every municipality produce maps of their natural resources and conservation overlay districts in electronic form suitable for website posting and disseminate this information to their constituents. 52
55 State Level Policy Differences This section of the report is not intended to make recommendations for state-level policy improvements or to reconcile interstate differences in environmental protection standards. This section will highlight select differences between New Hampshire and Maine state environmental policies, and note the implications for municipal governments interested in ensuring protection of resources that may not be adequately covered by state regulations. The topics covered are limited to those summarized in Table 23. Shoreland Protection New Hampshire s Comprehensive Shoreland Protection Act generally does not have jurisdiction for streams that are 3rd order or smaller which in most watersheds means that a majority of stream miles are not covered by the Act. Protecting shorelands in almost all smaller streams and rivers is therefore left up to New Hampshire municipalities. In Maine, the Mandatory Shoreland Zoning Act generally does not apply to first order streams, so only local regulations can fill in this regulatory gap in protection. Wetlands Protection In New Hampshire, the state wetlands protection law does not have jurisdiction over upland buffers adjacent to wetlands, so regulation of wetland buffers is at the discretion of each municipality. State regulations allow municipalities to nominate particularly important wetlands as prime wetlands thus providing a higher level of protection to local resources without having to oversee permitting programs for those areas. Wetland buffer requirements do apply to wetlands in Maine that are mapped as significant wildlife habitat, but not to all wetlands. Septic Setbacks From Wetlands/Waterways NHDES rules require a minimum 50 setback between septic effluent disposal areas and poorly drained jurisdictional wetlands and 75 setback on very poorly drained jurisdictional wetlands or waterways. Maine s Subsurface Wastewater Program generally requires 100 setbacks from wetlands/waterways. Municipalities may want to adopt a minimum standard of 100 setback for consistency with Maine, or adopt a larger minimum distance to ensure a higher level of protection for certain waterways. In-stream Flow Protection In the near term, New Hampshire in-stream flow protection studies and management measures are likely to only happen on designated river segments. Thus, municipalities wishing to protect in-stream flows or sustainably manage their water withdrawals should support inclusion of their rivers in the state s River Management and Protection Program. Maine s Sustainable Water Use Program operates under a more comprehensive legislative authority. Wildlife Habitat Protection Under Maine s Natural Resource Protection Act Chapter 335 rules, permits are needed for most development projects in mapped significant wildlife habitat areas such as wading bird and waterfowl habitat, shorebird feeding and roosting areas, deer wintering areas, and significant vernal pools. Outside of New Hampshire s wetland dredge and fill law, similar regulatory habitat protections are not offered by the state of New Hampshire, and individual municipalities are responsible for providing any additional regulatory protections to important wildlife habitat areas. Stormwater Management / Erosion & Sediment Control New Hampshire s Alteration of Terrain Program requires a stormwater management plan for projects causing contiguous ground disturbance >100,000 sq.ft. or >50,000 sq.ft. in protected shoreland areas. EPA Construction General permits will require a stormwater management plan for projects larger than one acre. Many projects smaller than these thresholds can cause significant stormwater pollution impacts that will go unregulated in the absence of local stormwater management regulations. Maine s stormwater state-level stormwater regulatory requirements generally apply to one acre or larger projects in most areas, or 20,000 square feet (about half an acre) projects for most-at-risk lakes and urban impaired streams. Maine municipalities may wish to require stormwater management plans for smaller size projects and define stricter standards pertaining to Water Quality Volume, Water Quality Flow and Groundwater Recharge Volume calculations for a proposed development site. 53
56 PREP Management Plan: Municipal Environmental Planning Goals A primary impetus for this project was the need for updated information to guide the revision and updating of the PREP Comprehensive Conservation and Management Plan (CCMP) for the Piscataqua Region. This Plan provides a blueprint for action to address critical threats to the water resources and ecological integrity of the Piscataqua Region. After more than a year of work and extensive engagement with regional stakeholders, PREP is now in the process of finalizing the revised CCMP that will be used to guide PREP and its partners for at least the next ten years ( ) of monitoring, protection, and restoration work. The PREPA assessment project provided critical data to inform the CCMP update process, and PREP has used this data to develop measurable environmental planning goals for the Piscataqua Region. These goals are described in Tables 24 and 25 below and progress on these goals will be tracked by PREP using this report as a baseline. Table 24. Regulatory Municipal Planning Targets for PREP Management Plan R1 Target Description 2020 Goal Current Status Implementation Mechanisms Municipalities have requirements for conservation subdivisions. 75% (39 towns) 25% (13 towns) Zoning Ordinances, Subdivision Regulations R2 Municipalities have conservation overlay districts that include Conservation Focus Areas identified in The Land Conservation Plan for New Hampshire s Coastal Watersheds or the Land Conservation Plan for Maine s Piscataqua Region Watersheds. 25% (13 towns) 2% (1 town) Municipal Zoning Ordinances R3 Municipalities have designated prime or significant wetlands under NH/ME law, or have comparable local wetland protections. 75% (39 towns) 44% (23 towns) Local Wetland Assessments, Prime Wetlands Designations (NH), Significant Wetlands (ME) R4 Municipalities have at least 75 wide shoreland buffer protections on first order streams and at least 100 on all second order and higher streams, rivers, ponds, and lakes.* 75% (39 towns) 17% (1st order) 13% (2nd+) 10% both (5 towns) Municipal Zoning Ordinances R5 Municipalities have adopted fluvial erosion hazard (FEH) zone overlays and development restrictions. 25% (13 towns) 0% FEH Studies/Maps, Zoning Ordinances R6 Municipalities have a cap of 10% effective impervious cover for new development in residentially zoned lots of 1 acre or more.*** 50% (26 towns) 0% Zoning Ordinances, Site Plan & Subdivision Regulations R7 Municipalities require that Low Impact Development (LID) techniques are used to the maximum extent practicable for new development and redevelopment.** 75% (39 towns) 10% (5 towns) Municipal Zoning/Building Codes, Site Plan & Subdivision Regulations R8 Municipal stormwater management regulations reflect the minimum NHDES model ordinance design criteria for water quality volume/flow (WQV/WQF), groundwater recharge volume (GRV), and peak flow control. ** 75% (39 towns) 8% (4 towns) Stormwater Ordinance and/or Site Plan & Subdivision Regulations R9 Municipalities require at least 4 separate site inspections of development sites for compliance with stormwater/e&s requirements as recommended by NHDES model ordinance.** 75% (39 towns) 10% (5 towns) Stormwater/E&S Ordinances and/or Site Plan & Subdivision Regulations * Based on minimum recommended buffer widths from the Center for Watershed Protection ** About 60% of towns are considered Phase II communities under the Clean Water Act. ***About 40% of towns exceed or will soon exceed 10% impervious cover. Table 25. Non-Regulatory Municipal Planning Targets for PREP Management Plan NR1 NR2 NR3 Target Description 2020 Goal Current Status Implementation Mechanisms Municipalities have completed Natural Resource Inventories (NRIs). 100% (52 towns) 48% (25 towns) Municipal Natural Resource Inventories New Hampshire municipalities have a Natural Resource Chapter in their Master Plan. Municipalities have conservation plans that include Conservation Focus Areas identified in The Land Conservation Plan for New Hampshire s Coastal Watersheds or the Land Conservation Plan for Maine s Piscataqua Region Watersheds. 100% (52 towns 100% (52 towns) 79% (41 towns) Chapter in Municipal Master Plans 69% have open space plans (CFA overlap unknown) Municipal Open Space / Conservation Plans NR4 Municipalities have completed and adopted a drinking water source protection plan. 50% (26 towns) 12% (6 towns) Sourcewater Protection Plans, Zoning Overlays, Land Acquisitions NR5 Municipalities have electronic maps of Natural Resource Inventory features and environmental zoning district overlays that are available to the public. 100% (52 towns) 56% (NRI) 23% (zoning overlays) GIS Maps, Databases, Web-servers (Municipal and/or Central Repository 54
57 REFERENCES Andrews, Carol New Hampshire Association of Conservation Commissions (NHACC) and Forest Society 2007 Survey of Conservation Commissions. Personal Communication. Chase, V.P., Deming, L., Latawiec, F Buffers for Wetlands and Surface Waters: A Guidebook for New Hampshire Municipalities. Audubon Society of New Hampshire. Connecticut River Joint Commission Introduction to Riparian Buffers Fact Sheets Series. URL: CWP Impacts of Impervious Cover on Aquatic Systems. Watershed Protection Research Monograph Number 1. Center for Watershed Protection, Ellicott City, MD. March Available from: Deacon, J.R., Soule, S.A., and Smith, T.E Effects of urbanization on stream quality at selected sites in the Seacoast region in New Hampshire, : U.S. Geological Survey Scientific Investigations Report , 18 p. Frumhoff, P.C., J.J. McCarthy, J.M. Melillo, S.C. Moser, and D.J. Wuebbles Confronting Climate Change in the U.S. Northeast: Science, Impacts, and Solutions. Synthesis report of the Northeast Climate Impacts Assessment (NECIA). Cambridge, MA: Union of Concerned Scientists (UCS). Horn, M.A., Moore, R.B., Hayes, Laura, and Flanagan, S.M Methods for and estimates of 2003 and projected water use in the Seacoast region, southeastern New Hampshire: U.S. Geological Survey Scientific Investigations Report , 87 p., plus 2 appendices on CD ROM. Maine Department of Environmental Protection (MDEP) Maine Erosion and Sediment Control BMPs. DEPLW0588. Bureau of Land and Water Quality, Maine Department of Environmental Protection. Augusta, ME. Mayer, P.M., Reynolds, S., McCuthen, M., and Canfield, T Meta-Analysis of Nitrogen Removal in Riparian Buffers. Journal of Environmental Quality 36: New Hampshire Department of Environmental Services (NHDES) New Hampshire Code of Administrative Rules. URL: organization/commissioner/legal/rules/documents/env-wq1000.pdf. page 49. New Hampshire Department of Environmental Services (NHDES). 2008(a). Innovative Land Use Planning Techniques Guide Handbook: A Handbook for Sustainable Development. Regional Environmental Planning Program, State of New Hampshire. New Hampshire Department of Environmental Services (NHDES). 2008(b). The NH Stormwater Manual Volume 3: Erosion and Sediment Controls During Construction. Written by Comprehensive Environmental Inc. and the New Hampshire Department of Environmental Services. Concord, NH. New Hampshire Department of Environmental Services (NHDOT) CTAP: I-93 Community Technical Assistance Program Web Site, New Hampshire Department of Transportation. August 21, New Hampshire Fish and Game Department (NHFG) New Hampshire Wildlife Action Plan. New Hampshire Fish and Game Department, Concord, NH. Paulsen, C Regulation and Management of New Hampshire Estuaries: A Base Programs Analysis. A Report to the New Hampshire Estuaries Project. Submitted by New Hampshire Fish and Game and the Great Bay National Estuarine Research Reserve. Piscataqua Region Estuaries Partnership (PREP) State of the Estuaries Piscataqua Region Estuaries Partnership, Durham, NH. Schueler, T. and Holland, H The Practice of Watershed Protection. Center for Watershed Protection. Ellicott City, MD. State of Maine, State of Maine Subsurface Wastewater Program Past Rules. URL: Strafford Regional Planning Commission (SRPC), Isinglass River Management Plan Prepared for the Isinglass River Local Advisory Committee. Washburn, PhD Candidate Research. A Social Landscape Analysis of Land Use Decision Making in the Towns of the Lamprey River Watershed (unpublished). Ocean Process Analysis Laboratory, University of New Hampshire. Personal Communication. 55

")
58 APPENDICES Appendix A. Piscataqua Region Environmental Planning Assessment (PREPA) Form 56

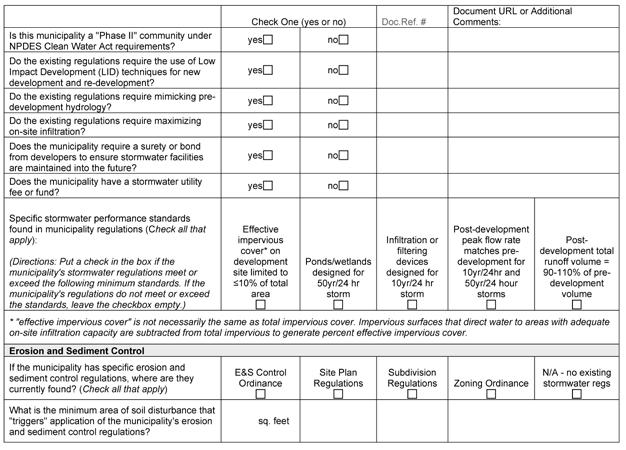
59 57


60 58

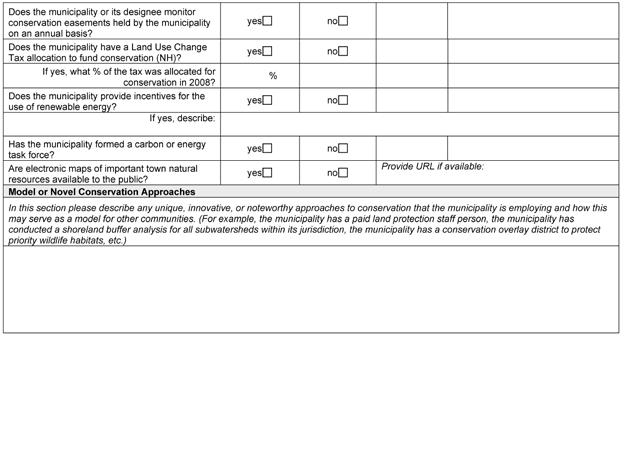
61 59
62 Appendix B. Wetland Buffer and Setback Regulations in the Piscataqua Region Watershed by Municipality No Disturbance Buffer Width Septic Setback Building Setback Fertilizer Application Setback Acton Barrington Berwick Brentwood Brookfield Candia Chester Danville Deerfield Dover Durham East Kingston Eliot Epping Exeter Farmington Fremont Greenland Hampton Hampton Falls Kensington Kingston Kittery Lebanon Lee Madbury Middleton Milton New Durham Newcastle Newfields Newington Newmarket North Berwick North Hampton Northwood Nottingham Portsmouth Raymond Rochester Rollinsford Rye Sandown Sanford Seabrook Somersworth South Berwick Strafford Stratham Wakefield Wells Yor k Appendix C. No Disturbance and/or Managed Buffer Widths (Pooled Results) for Different-Sized Waterbodies in the Piscataqua Region Watershed by Municipality 1st Order Stream 2nd Order Stream 3rd Order Stream 4th Order+ Streams Lakes & Great Ponds Acton Barrington Berwick Brentwood Brookfield Candia Chester Danville Deerfield Dover Durham East Kingston Eliot Epping Exeter Farmington Fremont Greenland Hampton Hampton Falls Kensington Kingston Kittery Lebanon Lee Madbury Middleton Milton New Durham Newcastle Newfields Newington Newmarket North Berwick North Hampton Northwood Nottingham Portsmouth Raymond Rochester Rollinsford Rye Sandown Sanford Seabrook Somersworth South Berwick Strafford Stratham Wakefield Wells Yor k zeros 20 zeros 18 zeros 17 zeros 19 zeros 60
63 Appendix D. Novel or Innovative Conservation Approaches This appendix is meant to highlight some examples of novel or highly innovative conservation approaches or outreach communication methods that some towns in the Piscataqua Region are implementing. Understanding approaches to conservation that other communities have successfully utilized is a powerful source of ideas. In addition, it is often very useful to discuss lessons learned with someone who has tried a conservation approach prior to tackling it anew in one s own community. The following table lists some examples and is not intended to be an exhaustive list or to highlight the good work that is being done in every single community. Novel or Innovative Conservation Approaches Brentwood Worked with PREP to develop a Citizen s Guide to Land Use Regulations Protecting Critical Water Resources, 2008 ( edu/resources/pdf/a-citizens-guide-tob-08.pdf) Chester Growth Management Ordinance (Zoning Ordinance, Article 13). Dover Epping Exeter Kensington Kingston New Durham Newcastle Newfields Newmarket North Berwick Within the City Code Chapter , The Transfer of Development Rights (TDR), Amended in 2003, is used as a tool to conserve land and open space. Established a consensus-based/roundtable process to facilitate review of all land use regulations and policies in town that are preventing innovative land use and natural resource protection. Adopted an ordinance permitting energy efficiency and sustainable design, and creating Epping 25% in 25 - a series of goals regarding energy consumption, purchasing, and generation. Adopted regulations requiring an Environmental Impact Assessment if requested by planners Section 9.8 Site Plan and Subdivision Regulations - Natural Resource protection Fluvial Geomorphology Study of the Exeter River Watershed identified opportunities to restore and mitigate sites with erosion, failed culverts, etc. along the Exeter River, Little River, and Bloody/Dudley Brook. Kensington has adopted regulations governing tree removal in new development, which requires a review of Natural Heritage Bureau records- Kingston s wetlands regulations are based on a point system that places value on vernal pools, fish habitat, endangered species, shoreland protection, etc. The more points accrued, the greater the buffer requirement, between feet. First town in the NH coastal watershed to adopt the Land Conservation Plan for New Hampshire s Coastal Watershed s Conservation Overlay District in ordinance at 2008 Town Meeting. Conservation Commission has developed an excellent brochure describing what the CC does as well as significant natural resources on the island, such as the Pitch Pine Barren. Completed a conservation easement stewardship and monitoring and assessment of Newfields Conservation lands and other open spaces through PREP s CTAP program ( Newmarket has a Residential Open Space Design Development by Special Use Permit provision which allows an optional, flexible method of residential development to protect, large, contiguous parcels of open space throughout the town and minimizes fragmentation of open space, habitat and conservation lands. Town has an open space impact fee. North Hampton The North Hampton Conservation Commission has worked with PREP to complete a public education newsletter about the importance of wetlands and buffers. ( The CC has completed a Conservation Audit and Stewardship Plan which identifies all conservation land in town in need of monitoring. The Plan was funded by PREP. ( Nottingham Portsmouth Raymond The Nottingham Conservation Commission (NCC) and the Natural Resource Committee (NNRC) is proposing that the town establish a voluntary greenway (Four Generals Greenway) River signs at all road crossings In the 2005 Master Plan the City developed the Mayor s Blue Ribbon committee on Sustainable Practices Conducting an ecological assessment of City-owned open space and completed a vernal pool inventory. Completed a restoration plan for Hodgson Brook, an impaired waterway. Has established a landscaped stormwater/rain garden site for developers and homeowners to tour. USGS Fordway Brook Study & proposed Fluvial Overlay Ordinance Seabrook The town is working with the RPC and NHCP to develop mitigation strategies to protect against flooding due to climate change. 61

64 Piscataqua Region Estuaries Partnership University of New Hampshire 131 Main Street, Nesmith Hall Durham, NH
Assessment of Key Municipal Planning Regulations for. Derek Sowers Conservation Program Manager Piscataqua Region Estuaries Partnership
 Assessment of Key Municipal Planning Regulations for Water Quality Protection in the Piscataqua Region Derek Sowers Conservation Program Manager Piscataqua Region Estuaries Partnership The Physical Piscataqua
How much of the Piscataqua Region watershed is currently covered by impervious surfaces and how has it changed over time?
 Indicator: Question How much of the Piscataqua Region watershed is currently covered by impervious surfaces and how has it changed over time? Short Answer In 2015, 5.6% of the land area of the Piscataqua
Developing 2015 High-Resolution Impervious Cover Estimates for the 52 Towns in the Piscataqua Region Estuaries Partnership: Final Report
 University of New Hampshire University of New Hampshire Scholars' Repository PREP Reports & Publications Institute for the Study of Earth, Oceans, and Space (EOS) 6-2017 Developing 2015 High-Resolution
LAMPREY RIVER SUBWATERSHED
 LAMPREY RIVER SUBWATERSHED PISCATAQUA REGION ENVIRONMENTAL PLANNING ASSESSMENT 05 Lamprey River Subwatershed, including: Candia, Deerfield, Epping, Newmarket, Northwood, Nottingham, Raymond www.prepestuaries.org
Shoreland Protection in Maine Communities of the Piscataqua River Estuary
 University of New Hampshire University of New Hampshire Scholars' Repository PREP Reports & Publications Institute for the Study of Earth, Oceans, and Space (EOS) 5-2010 Shoreland Protection in Maine Communities
Shoreland Buffer Module for GRANIT Data Mapper
 University of New Hampshire University of New Hampshire Scholars' Repository PREP Publications Institute for the Study of Earth, Oceans, and Space (EOS) 12-31-2006 Shoreland Buffer Module for GRANIT Data
Town of Peru Comprehensive Plan Executive Summary
 Town of Peru Comprehensive Plan Executive Communities that plan grow by choice, not by chance. A plan makes growth thoughtful, understandable, and predictable. A plan shows that a community is managing
Innovative Land Use Techniques
 Innovative Land Use Techniques A Handbook for Sustainable Development Eric Williams, Assistant Administrator, NHDES Carolyn Russell, Principal Planner, NHDES Cliff Sinnott, Executive Director, RPC Jill
Freshwater Wetlands Inventory Outreach Activities for the Freshwater Wetland Mitigation Inventory of Nineteen Coastal Communities Report
 University of New Hampshire University of New Hampshire Scholars' Repository PREP Reports & Publications Institute for the Study of Earth, Oceans, and Space (EOS) 10-2004 Freshwater Wetlands Inventory
TOWN OF SPRINGFIELD, NEW HAMPSHIRE
 TOWN OF SPRINGFIELD, NEW HAMPSHIRE NATURAL RESOURCES INVENTORY EXECUTIVE SUMMARY March 2008 Prepared by: Watershed to Wildlife, Inc. Natural Resource Consultants 42 Mill Street, Suite 3 Littleton, NH 03561
COMMUNITY RESILIENCE IN COASTAL NEW HAMPSHIRE
 COMMUNITY RESILIENCE IN COASTAL NEW HAMPSHIRE Kirsten Howard Coastal Resilience Specialist New Hampshire Department of Environmental Services Coastal Program Kirsten.Howard@des.nh.gov Coastal Hazard Vulnerability
DRAFT SCOPE FOR THE DRAFT ENVIRONMENTAL IMPACT STATEMENT FOR HUDSON HIGHLANDS RESERVE TOWN OF PHILIPSTOWN, NEW YORK June 5, 2018
 DRAFT SCOPE FOR THE DRAFT ENVIRONMENTAL IMPACT STATEMENT FOR HUDSON HIGHLANDS RESERVE TOWN OF PHILIPSTOWN, NEW YORK June 5, 2018 Project Name: Project Location SEQRA Classification of Project: Lead Agency:
Shoreline Master Program Town of La Conner, Washington
 Shoreline Master Program Town of La Conner, Washington Department of Ecology approval effective Adopted September 24, 2013 by Town of La Conner Ordinance No.1106 Amended May 13, 2014 by Town of La Conner
Rocky Areas Project Guidance HABITAT
 Rocky Areas Project Guidance HABITAT Introduction Rocky habitats are surface areas dominated by exposed rock, such as mountain peaks, inland cliffs, buttes and rocky outcrops. In many cases, rocky areas
Preparing New Hampshire for Projected Storm Surge, Sea-Level Rise, and Extreme Precipitation
 NEW HAMPSHIRE COASTAL RISK AND HAZARDS COMMISSION Preparing New Hampshire for Projected Storm Surge, Sea-Level Rise, and Extreme Precipitation July 14, 2017 The Beaches Conference Wells High School Wells,
Riparian Buffer on the Bushkill Creek. Policies
 Riparian Buffer on the Bushkill Creek Riparian buffers provide numerous benefits to landowners and the community by protecting groundwater recharge areas, providing flood control, providing stormwater
10 Implementation. Implementation. Responsibility for Implementation. Blueprint for Bloomsburg. Town of Bloomsburg Comprehensive Plan 10-1
 Implementation 10 Implementation This chapter overviews how to use the comprehensive plan as a land use and programming tool for the Town of Bloomsburg and recommends annual review of the plan by the Town
FAQ S about Restoration Planning FROM THE Department of Ecology WEBSITE:
 FAQ S about Restoration Planning FROM THE Department of Ecology WEBSITE: http://www.ecy.wa.gov/programs/sea/sma/st_guide/smp/restoration/qanda.html Notations in parentheses are staff notes directing you
WASHINGTON COUNTY OREGON
 WASHINGTON COUNTY OREGON LONG RANGE PLANNING DIVISION North Bethany Subarea Stream Corridors: Existing Regulations In Oregon, there is a distinct difference between the land use rules that apply in rural
River Road New Castle Marsh Restoration Recommendations
 University of New Hampshire University of New Hampshire Scholars' Repository PREP Reports & Publications Institute for the Study of Earth, Oceans, and Space (EOS) 6-2010 River Road New Castle Marsh Restoration
Staff will be providing an overview of the project need, purpose and intent for consideration as part of the Amendment cycle.
 Agenda Item D-2 City of Tacoma Planning and Development Services To: Planning Commission From: Stephen Atkinson, Planning Services Division Subject: Open Space Corridors Project Meeting Date: March 1,
Table of Contents TABLE OF CONTENTS SECTION TITLE PAGE
 TABLE OF CONTENTS SECTION TITLE PAGE 1 INTRODUCTION AND OVERVIEW 1-1 1.1 Purpose and Need 1-1 1.2 Goals and Objectives 1-3 1.3 Overview of the Planning Process 1-5 1.4 Federal and State Requirements and
Planning for and Managing Open Space and Natural Areas
 Planning for and Managing Open Space and Natural Areas Increasingly, development proposals in Delaware include large amounts of open space and natural areas. While open space is important as a community
Infrastructure, Development and Enterprise Services. Natural Heritage Action Plan (NHAP) Project Initiation
 Project Initiation") Staff Report To Service Area Committee of the Whole Infrastructure, Development and Enterprise Services Date Monday, March 6, 2017 Subject Natural Heritage Action Plan (NHAP) Project Initiation Report
Staff Report To Service Area Committee of the Whole Infrastructure, Development and Enterprise Services Date Monday, March 6, 2017 Subject Natural Heritage Action Plan (NHAP) Project Initiation Report
CONSERVATION ELEMENT GOALS, OBJECTIVES, AND POLICIES
 CONSERVATION ELEMENT GOALS, OBJECTIVES, AND POLICIES Goal 4 To conserve, manage, appropriately use and protect the natural resources of the City ensuring continued resource availability and environmental
Town of Bedford, NH. CTAP Community Planning Road Map. Prepared for the I-93 Community Technical Assistance Program
 Town of Bedford, NH CTAP Community Planning Road Map Prepared for the I-93 Community Technical Assistance Program Adopted by Bedford Planning Board January 26, 2009 1 Introduction The development of this
Pennsylvania Stormwater Best Management Practices Manual. Chapter 1. Introduction and Purpose
 Pennsylvania Stormwater Best Management Practices Manual Chapter 1 Introduction and Purpose Chapter 1 Introduction and Purpose 1.1 Purpose of this Manual 1 1.2 How to Use this Manual...1 1.3 Overview
Proposed Comprehensive Plan Amendments. November 2015 General Referendum
 Proposed Comprehensive Plan Amendments To be considered at the November 2015 General Referendum Draft: June 30, 2015 1. Adopt by reference, The York Village Master Plan, dated April 2015 within Volume
Central Lake Ontario Conservation Conservation Lands Master Plan
 Conservation Lands Master Plan Top 13 Frequently Asked Questions 1. What are conservation lands? Where are these conservation lands located in the Central Lake Ontario Conservation watershed? Conservation
Chapter WAC SHORELINE MASTER PROGRAM GUIDELINES. Table of Contents WAC AUTHORITY, PURPOSE AND EFFECTS OF GUIDELINES.
 Chapter 173-26 WAC SHORELINE MASTER PROGRAM GUIDELINES Table of Contents WAC 173-26-171 AUTHORITY, PURPOSE AND EFFECTS OF GUIDELINES. 5 WAC 173-26-176 GENERAL POLICY GOALS OF THE ACT AND GUIDELINES FOR
Chapter 2: Strategies for Local Governments Chapter 3: Site Assessment and Design for Low Impact Development. Break Out Group 10:30 am to 12 pm
 Chapter 2: Strategies for Local Governments Chapter 3: Site Assessment and Design for Low Impact Development Break Out Group 10:30 am to 12 pm A Low Impact Development Manual for Coastal South Carolina
20 International Conference of The Coastal Society THE ROLE OF PLANNED UNIT DEVELOPMENTS IN ENVIRONMENTAL MANAGEMENT IN THE COASTAL ZONE
 th 20 International Conference of The Coastal Society THE ROLE OF PLANNED UNIT DEVELOPMENTS IN ENVIRONMENTAL MANAGEMENT IN THE COASTAL ZONE Kathleen E. Semon, University of South Carolina Braxton C. Davis,
CHAPTER Committee Substitute for Senate Bill No. 1472
 CHAPTER 2007-99 Committee Substitute for Senate Bill No. 1472 An act relating to beaches and shores; amending s. 161.021, F.S.; amending a definition; amending s. 161.085, F.S.; restricting the use of
Benchmark Nonpoint Source Management Approaches In Other States
 Governor s Environmental Advisory Council 2007 Nonpoint Source Pollution Control Initiative Benchmark Nonpoint Source Management Approaches In Other States Governor s Environmental Advisory Council April
TOWN OF BETHLEHEM OPEN SPACE CONSERVATION PLAN PUBLIC MEETING: OCTOBER 12, 2017
 TOWN OF BETHLEHEM OPEN SPACE CONSERVATION PLAN PUBLIC MEETING: OCTOBER 12, 2017 Welcome and Agenda 6:00 6:45: Open House, Part One 6:45 7:15: Presentation and Questions 7:15 8:00: Open House, Part Two
STATE OF NEW HAMPSHIRE. RSA Chapter 482-A. Water Division/Wetlands Bureau
 STATE OF NEW HAMPSHIRE Aquatic Resource Mitigation Fund RSA Chapter 482-A Fiscal Year 2012 Report Water Division/Wetlands Bureau December 6, 2012 Introduction Compensation for unavoidable wetland impacts
Improve Neighborhood Design and Reduce Non Point Source Water Pollution
 HOW TO Planning Guide Improve Neighborhood Design and Reduce Non Point Source Water Pollution This document was funded by a grant from the New Hampshire Coastal Program with funding from the National Oceanic
3. VISION AND GOALS. Vision Statement. Goals, Objectives and Policies
 Vision Statement Queen Creek s interconnected network of parks, trails, open spaces and recreation opportunities provide safe and diverse activities and programs that sustain its unique, small town, equestrian
COMMUNITY ENVIRONMENTAL MANAGEMENT
 COMMUNITY ENVIRONMENTAL MANAGEMENT CEM HANDBOOK FOR COMMUNITY CONSERVATION PLANNING ----- Draft ----- Prepared by the CENTER FOR COMMUNITY ENVIRONMENTAL MANAGEMENT in association with the NEW YORK STATE
Public Visioning City of Kelso Planning Commission
 Shoreline Master Program Update Public Visioning City of Kelso Planning Commission November 13, 2012 Schedule Jurisdiction Inventory Analysis Visioning Topics Process Governing Principles Structure of
Town of Raymond, New Hampshire
 Completed CTAP Community Planning Assessment Summary Report & Questionnaire Prepared on Behalf of the Town of Raymond By: The Southern New Hampshire Planning Commission EXECUTIVE SUMMARY Community Planning
Green Infrastructure Policies and Ordinances
 Green Infrastructure Policies and Ordinances October 23, 2013 By Karen Firehock, Green Infrastructure Center 2013 Georgia Urban Forest Council s 23 rd Annual Conference The mission of the nonprofit Green
APPENDIX A SIMPLIFIED APPROACH TO STORMWATER MANAGEMENT FOR SMALL PROJECTS. In West Sadsbury Township, Chester County, Pennsylvania
 APPENDIX A SIMPLIFIED APPROACH TO STORMWATER MANAGEMENT FOR SMALL PROJECTS In West Sadsbury Township, Chester County, Pennsylvania TABLE OF CONTENTS I. Introduction 3 II. Importance of Stormwater Management
Options for addressing City of Edmonds Alternatives to Ecology s Required Changes addressing Edmonds Marsh Buffers and Setbacks.
 Options for addressing City of Edmonds Alternatives to Ecology s Required Changes addressing Edmonds Marsh Buffers and Setbacks. This document presents Ecology s response to the City of Edmonds alternatives
Town of Cobourg Heritage Master Plan. Statutory Public Meeting
 Town of Cobourg Heritage Master Plan Statutory Public Meeting April 25 th 2016 Presentation Overview 1. Introduction 2. Project background and schedule overview 3. Review of strategic direction content
Glenborough at Easton Land Use Master Plan
 Implementation 114 9.0 IMPLEMENTATION 9.1 OVERVIEW This chapter summarizes the administrative procedures necessary to implement the proposed land use plan, infrastructure improvements, development standards,
Chapter 10 IMPLEMENTATION RECOMMENDATIONS
 Chapter 10 IMPLEMENTATION RECOMMENDATIONS The recommended land use plan presented in the previous chapter provides a design for the attainment of the urban and rural development and open space preservation
STORMWATER MANAGEMENT CODES ANALYSIS RICHLAND COUNTY, SC SITE PLANNING ROUNDTABLE
 STORMWATER MANAGEMENT CODES ANALYSIS RICHLAND COUNTY, SC SITE PLANNING ROUNDTABLE Codes analyses for each subcommittee were completed to assist participants of the Richland County Site Planning Roundtable.
STORMWATER GREEN INFRASTRUCTURE AND PLANNING/ZONING BOARDS
 STORMWATER GREEN INFRASTRUCTURE AND PLANNING/ZONING BOARDS Source: Center for Watershed Protection, 2007 Southern Tier Central Regional Planning & Development Board Chemung County Stormwater Team OUTLINE
ROGUE VALLEY SEWER SERVICES STORMWATER MANAGEMENT PROGRAM (SWMP)
") ROGUE VALLEY SEWER SERVICES STORMWATER MANAGEMENT PROGRAM (SWMP) 1.0 INTRODUCTION This Stormwater Management Program (SWMP) for Rogue Valley Sewer Services (RVS) has been developed to meet the Municipal
ROGUE VALLEY SEWER SERVICES STORMWATER MANAGEMENT PROGRAM (SWMP) 1.0 INTRODUCTION This Stormwater Management Program (SWMP) for Rogue Valley Sewer Services (RVS) has been developed to meet the Municipal
City of Mahtomedi Park System Plan Public Hearing Draft: September 13, 2006
 Chapter 6: IMPLEMENTATION INTRODUCTION Earlier chapters of this Plan analyzed existing conditions, identified park and recreation needs, and proposed park, trail, and open space recommendations. This chapter
Fire Sprinklers Working Group Final Report
 Introduction The Building Act received Royal Assent on March 25, 2015. The Act aims to establish more consistent building requirements across British Columbia and create a more robust and modern building
STAFF REPORT SAUSALITO CITY COUNCIL
 STAFF REPORT SAUSALITO CITY COUNCIL MEETING DATE: January 8, 2019 AGENDA TITLE: LEAD DEPARTMENT: Southern Marin Fire District Lessons Learned Update Report Southern Marin Fire District, Fire Chief Chris
City of Missoula and Missoula County Open Space Planning Open House
 City of Missoula and Missoula County Open Space Planning Open House FEBRUARY 6, 2018 The following slides contain the display board content from the open house. Please use boards to answer questions in
RFP REQUEST FOR PROPOSALS CITY OF PORTSMOUTH, NH. DESIGN ENGINEERING SERVICES North Mill Pond Trail and Greenway
 RFP 61-18 REQUEST FOR PROPOSALS CITY OF PORTSMOUTH, NH DESIGN ENGINEERING SERVICES North Mill Pond Trail and Greenway Sealed Requests for Proposals, plainly marked RFP 61-18 Design Engineering Services
Eelgrass Distribution in the Great Bay Estuary and Piscataqua River for 2013
 University of New Hampshire University of New Hampshire Scholars' Repository PREP Publications Institute for the Study of Earth, Oceans, and Space (EOS) 5-17-2014 Eelgrass Distribution in the Great Bay
Municipal Comprehensive and Open Space Plans
 Appendix 13-A Local Historic Policy Municipal Comprehensive and Open Space Plans Oxford Regional Comprehensive Plan (1969) The Oxford Regional Comprehensive Plan serves as the Comprehensive Plan for Oxford
Plan Overview. Manhattan Area 2035 Reflections and Progress. Chapter 1: Introduction. Background
 Plan Overview The Manhattan Urban Area Comprehensive Plan (the Comprehensive Plan) is a joint planning initiative of the City of Manhattan, Pottawatomie County, and Riley County. The 2014 Comprehensive
April 11, 2016 Park Board Chair and Commissioners General Manager Vancouver Board of Parks and Recreation New Brighton Salt Marsh - Preferred Concept
 TO: FROM: SUBJECT: April 11, 2016 Park Board Chair and Commissioners General Manager Vancouver Board of Parks and Recreation New Brighton Salt Marsh - Preferred Concept RECOMMENDATION A. THAT the Vancouver
Creating Complete Roadway Corridors:
 Creating Complete Roadway Corridors: The AASHTO Guide to Transportation Landscape Architecture and Environmental Design NCHRP Project 15-33 Status Report AASHTO Standing Committee on Design Technical Committee
HAZARD MITIGATION GOALS AND OBJECTIVES
 SEWRPC Community Assistance Planning Report No. 282, 2nd Edition CITY OF MILWAUKEE ALL HAZARDS MITIGATION PLAN UPDATE Chapter IV HAZARD MITIGATION GOALS AND OBJECTIVES [NOTE: Throughout this plan update
Lake O the Pines Master Plan Revision Public Information Meeting April 25 & 27, 2017
 Lake O the Pines Master Plan Revision Public Information Meeting April 25 & 27, 2017 Presented By Matthew Like, Lake Manager U.S. Army Corps of Engineers Fort Worth District US Army Corps of Engineers
Chapter 4 - Preparation of Stormwater Site Plans
 Chapter 4 - Preparation of Stormwater Site Plans The Stormwater Site Plan is the comprehensive report containing all of the technical information and analysis necessary for the City to evaluate a proposed
Preface. Erie. Scranton. Allentown. Pittsburgh. Harrisburg. Philadelphia
 The Southern Alleghenies Region The Southern Alleghenies Region spans the Laurel Highlands and Allegheny Front in the west across the Appalachians to the east. It is comprised of Blair, Bedford, Cambria,
Understanding the Varying Viewpoints of the Water Utility Provider and Landscape Contractor
 Understanding the Varying Viewpoints of the Water Utility Provider and Landscape Contractor Debra Lane, CLIA, Water Conservation Representative City of Santa Rosa, CA Introduction Water agencies in the
systems is available on the Colorado Wetland Information Center (CWIC) website.
 website.") Colorado Natural Heritage Program Wetland Program Plan -- Dec 2015 Status Update and Addendum -- The Colorado Natural Heritage Program (CNHP) developed a Wetland Program Plan (WPP) in 2010 for the planning
Colorado Natural Heritage Program Wetland Program Plan -- Dec 2015 Status Update and Addendum -- The Colorado Natural Heritage Program (CNHP) developed a Wetland Program Plan (WPP) in 2010 for the planning
How To Get the Development You Planned
 How To Planning Series Prepared by Strafford Regional Planning Commission. Funded by the NH Office of State Planning How To Get the Development You Planned The purpose of the master plan is... to guide
Master Plan for Preservation and Scenic Conservation (1995)
") 3.2 Master Plan for Preservation and Scenic Conservation (1995) The Master Plan for Preservation and Scenic Conservation was developed under the direction of the Guilford Preservation Alliance in the 1980s
3.2 Master Plan for Preservation and Scenic Conservation (1995) The Master Plan for Preservation and Scenic Conservation was developed under the direction of the Guilford Preservation Alliance in the 1980s
CITY OF CHARLOTTESVILLE, VIRGINIA CITY COUNCIL AGENDA
 CITY OF CHARLOTTESVILLE, VIRGINIA CITY COUNCIL AGENDA Agenda Date: December 16, 2013 Action Required: Adoption of Resolution Presenter: Staff Contacts: Title: James E. Tolbert, AICP, Director of NDS James
Whitemarsh Township Greenway Plan
 Whitemarsh Township Greenway Plan Prepared for: Whitemarsh Township August 16, 2007 Table of Contents Table of Contents... i Introduction... 1 Study Area Setting... 2 Regional Setting... 2 Township Character...
Green Infrastructure. by Karen Engel, NYS DEC. NYS Department of Environmental Conservation
 Green Infrastructure by Karen Engel, NYS DEC What is Green Infrastructure? For some it s all about water Green Infrastructure techniques use soils and vegetation to infiltrate, evapotranspirate, and/or
Summary of Action Strategies
 Strategic Action Plan 6 Summary of Action Strategies Action Strategy Categories: 1. Organization and Management 2. Implementation 3. Marketing and Promotion This chapter summarizes all of the action strategies
Town of Washington Master Plan & Regulatory Audit: Interim Results
 Town of Washington Master Plan & Regulatory Audit: Interim Results May 20, 2008 Presented by: 30 Bank Street Lebanon, NH 03766 www.uvlsrpc.org Introduction & Purpose Compare the Master Plan to the regulations
C h a p t e r 3 E V A L U A T I O N A N D D E S I G N A T I O N. Background
 Part Two GOALS Part 2: Restoration work at Kingston (Historic Site 79-019-13) Upper Marlboro, 2009 C h a p t e r 3 E V A L U A T I O N A N D D E S I G N A T I O N Background The Inventory of Historic Resources
THREE-STEP DESIGN PROCESS FOR OPEN SPACE SUBDIVISIONS
 00216106.DOC NMA/RRK 1/30/14 THREE-STEP DESIGN PROCESS FOR OPEN SPACE SUBDIVISIONS Open space subdivisions, sometimes called cluster developments, maintain a significant portion of a development site in
Chapter 2: Vision, Goals and Strategies
 Chapter 2: Vision, Goals and Lake Elmo Today & Tomorrow Comprehensive Plan 2040 2 VISION, GOALS & STRATEGIES - DRAFT 4-6-2018 INTRODUCTION Comprehensive Plan Purpose Perhapse the most important objective
Green Infrastructure Codes and Ordinances
 1 Green Infrastructure Codes and Ordinances Emily Vail Hudson River Estuary Program NYS Department of Environmental Conservation New York State Water Resources Institute at Cornell University March 19,
CONCLUSION AND IMPLEMENTATION
 Lisbon s Vision CONCLUSION AND IMPLEMENTATION 7 Lisbon residents clearly appreciate the character, amenities, and opportunities that define our community. This Plan of Conservation and Development identifies
Westport Master Plan. Town of Westport. Master Plan Master Plan Update Committee. Westport, Massachusetts
 Town of Westport Master Plan 2004 Master Plan Update Committee Westport, Massachusetts Open Space and Recreation 5-1 Table of Contents Table of Contents... i List of Tables... ix List of Figures... ix
Highlands Region Stormwater Management Program Guidance
 DRAFT Highlands Region Stormwater Management Program Guidance Release Date: January 2016 Abstract This guidance document provides an overview of the Highlands Stormwater Management Program. It is intended
RECREATION, OPEN SPACE AND GREENWAYS ELEMENT GOALS, OBJECTIVES, AND POLICIES
 RECREATION, OPEN SPACE AND GREENWAYS ELEMENT GOALS, OBJECTIVES, AND POLICIES GOAL R-1: DEVELOP A RECREATION, OPEN SPACE AND GREENWAYS SYSTEM AS AN INTEGRAL COMPONENT OF AN OVERALL, COUNTY-WIDE ECONOMIC
A Delta Renewed: A Guide to Science Based Ecological Restoration in the Delta
 A Delta Renewed: A Guide to Science Based Ecological Restoration in the Delta J. Letitia Grenier, San Francisco Estuary Institute, letitia@sfei.org Julie Beagle, San Francisco Estuary Institute, julieb@sfei.org
CITY OF ST. AUGUSTA STEARNS COUNTY MINNESOTA ORDIANCE NO AN ORDINANCE ESTABLISHING REGULATIONS FOR STORMWATER MANAGEMENT
 CITY OF ST. AUGUSTA STEARNS COUNTY MINNESOTA ORDIANCE NO. 2017-05 AN ORDINANCE ESTABLISHING REGULATIONS FOR STORMWATER MANAGEMENT In the interest of the health, safety, and welfare of its citizens, the
Draft Rhode Island Stormwater Design and Installation Standards Manual
 Draft Rhode Island Stormwater Design and Installation Standards Manual Summary The May 2009 Public Review Draft version of the RI Stormwater Design and Installation Standards Manual consists of approximately
Oregon s Planning Program History. Oregon s Planning Program History. Oregon s Planning Program History. Oregon s Planning Program History
 Planning the Oregon Way: Planning 101 for Planners and Permit Technicians Central Oregon Planners Network Meeting June 29, 2016 There is a shameless threat to our environment and to the whole quality of
SALISBURY TOMORROW Our Vision
 SALISBURY TOMORROW Our Vision Salisbury is committed to supporting a high quality of life and sense of community for all residents. These commitments need to be reflected in our community programs, services
Minnesota Department of Natural Resource - Natural Resource Guidance Checklist Conserving Natural Resources through Density Bonuses
 Minnesota Department of Natural Resource - Natural Resource Guidance Checklist Conserving Natural Resources through Density Bonuses NRDB Why Use Density Bonuses & This Checklist Local units of government
Chapter 1. Introduction
 Chapter 1. Introduction Purpose This (manual) outlines planning tools and requirements to reduce urban runoff pollution to the maximum extent practicable (MEP) from new development and redevelopment projects.
Heights, Elk Grove, Folsom, Galt, Rancho Cordova and Sacramento. For more information, see the Glossary.
 1 Introduction Purpose This Stormwater Quality Design Manual for the Sacramento and South Placer Regions (manual) outlines planning tools and requirements to reduce urban runoff pollution to the maximum
St. Croix County Shoreland Overlay Zoning Districts. Public Hearing Community Development Committee December 19, 2013
 St. Croix County Shoreland Overlay Zoning Districts Public Hearing Community Development Committee December 19, 2013 Timeline CDC Review October 17 Public Information Meeting October 29 (6:00-8:00 pm)
STEWARDSHIP OF LONG ISLAND SOUND S ECOLOGICAL AND RECREATIONAL RESOURCES
 STEWARDSHIP OF LONG ISLAND SOUND S ECOLOGICAL AND RECREATIONAL RESOURCES Robin Kriesberg, Save the Sound, Inc. Thomas Halavik, US Fish and Wildlife Service Coastal Program An Initiative to Identify, Protect
WETLANDS PROTECTION ACT REFERENCE MANUAL
 WETLANDS PROTECTION ACT REFERENCE MANUAL Table of Contents 1. Wetlands Protection Program a. Wetlands Protection Act: M.G.L. c.131, 40: http://www.mass.gov/legis/laws/mgl/131-40.htm b. Restricted Wetlands:
Chesapeake Bay Critical Area Conservation Plan
 The Maryland-National Capital Park and Planning Commission Prince George s County Planning Department Development Review Division 301-952-3530 Note: Staff reports can be accessed at www.mncppc.org/pgco/planning/plan.htm.
Plat Requirements CHECKLIST FOR SITE PLAN REVIEW
 This checklist is to be used as a guide for complying with the Town of Hollis Site Plan Regulations. It is to be used for each individual site plan review application submitted. Applicants are encouraged
Samuel E. Paul War Memorial Recreation Area Natural Resource Inventory
 Samuel E. Paul War Memorial Recreation Area Natural Resource Inventory Created By: Timothy Rosadini Keene State College Environmental Studies Acknowledgments I would like to acknowledge the following people
CITY OF HOLLY SPRINGS STORMWATER UTILITY FREQUENTLY ASKED QUESTIONS
 CITY OF HOLLY SPRINGS STORMWATER UTILITY FREQUENTLY ASKED QUESTIONS GENERAL What is a Stormwater Utility and why is it needed in Holly Springs? A Stormwater Utility is an entity responsible for the daily
Planning for Staten. Habitat Restoration and Green Infrastructure. Island s North Shore
 Habitat Restoration and Green Infrastructure Planning for Staten Island s North Shore Community Board 1 March 1, 2018 NYC Parks Forestry, Horticulture, and Natural Resources Funded by the NYS Department
4. What are the goals of the Kawarthas, Naturally Connected project? 7. What are watersheds and why are they being used as the project boundaries?
 Frequently Asked Questions (FAQs) 1. What are Natural Heritage Systems (NHS)? 2. Why are they important? 3. Which areas of the province have undertaken NHS projects? 4. What are the goals of the Kawarthas,
Your town s subdivision or land use ordinance standards should reference the following street standards, for example:
 Your town s subdivision or land use ordinance standards should reference the following street standards, for example: Streets shall be designed to move traffic safely and in a way that minimizes environmental
1.0 INTRODUCTION 1.1 TH 14 WEST STUDY AREA Project Description Functional Classification Purpose of the Project
 1.0 INTRODUCTION 1.1 TH 14 WEST STUDY AREA 1.1.1 Project Description The Trunk Highway (TH) 14 West Corridor is a two-lane roadway approximately 22 miles in length. Located in Nicollet County, the corridor