ECOLOGICAL INVENTORY EXPANSION AND ENVIRONMENTAL BEST PRACTICES REPORT
|
|
|
- Dinah Gibbs
- 5 years ago
- Views:
Transcription

1 ECOLOGICAL INVENTORY EXPANSION AND ENVIRONMENTAL BEST PRACTICES REPORT FINAL REPORT Submitted to: City of Airdrie O2 Planning + Design Inc. November 6, 2013
2 ACKNOWLEDGEMENTS Contributing authors for this report included the following individuals: Andy Thomas Bill Souter George Roman Douglas Olson Feedback, guidance, and editing were provided by the City of Airdrie Planning, Engineering and Parks staff: Jeff Greene Jennifer Stevenson O2 Planning + Design Inc. i
3 EXECUTIVE SUMMARY The City of Airdrie continues to experience significant population growth. This growth has created a long-term demand for more residential, commercial and industrial development, much of which can only be accommodated by the acquisition of new lands beyond the current City limits. The City is currently in the process of identifying land that is capable of accommodating this demand. At present this land is under the jurisdiction of Rocky View County. Much of the land identified as suitable for future growth also contains important individual natural features such as wetlands and stream corridors that have significant ecological value. The true value of these natural features becomes apparent when the interrelationships between them are truly understood. Considered together, these individual natural elements form a far more significant interconnected network which offers a range of benefits to the natural developed fabric of the greater region. Increasing recognition of these benefits has led to use of the term ecological infrastructure to describe an interconnected network of natural features of ecological significance. The benefits of this network are now being viewed in terms of their ability to provide ecological services. Examples of ecological services include the management of storm water runoff provided by healthy riparian vegetation in watersheds; the maintenance of water quality provided by riparian vegetation and the facilitation of wildlife migration offered by connected areas of natural vegetation. While some services may be seen as valuable in a qualitative sense, others have the potential to be evaluated quantitatively. For example what are the relative monetary costs of upgrading existing stormwater infrastructure to handle runoff from a new subdivision versus the costs of building that subdivision using low impact development guidelines that would reduce that stormwater runoff in the first place? A detailed analysis of the potential goods and services offered by the identified ecological infrastructure elements is beyond the scope of this study. This document instead presents an updated inventory of ecological features in areas currently being considered by the City of Airdrie for future annexation. A combination of GIS analyses and field visits were used to first identify key natural features and then to rank them according to their ecological significance. The intention of this document is as a guide to inform development planning in a way that protects networks of natural features not only for their ecological value but also for the value of the services they can provide to enable Airdrie to manage its long-term growth in a sustainable manner. O2 Planning + Design Inc. ii
4 CONTENTS 1. INTRODUCTION Purpose and Scope Background Structure of Report STUDY AREA PROFILE Study Area Location Airdrie History of Growth Previous Growth Studies Growth Management Policies Study Area Landscape Context Regional Context Terrain Streams and Drainage Wetlands Agriculture Vegetation Existing Open Space Study Area - Land Use and Land Cover (LULC) Introduction Generalized LULC Results Generalized LULC Full Study Area ( Ha.) Generalized LULC City of Airdrie (3, Ha.) Generalized LULC Airdrie Growth Area (4, Ha.) IDENTIFICATION OF ECOLOGICAL INVENTORY FEATURES Introduction Ecological Inventory Features Introduction Riparian Corridors Natural /Semi-Natural Grassland Steep Slopes Trees and Shrubs O2 Planning + Design Inc. iii
5 3.2.6 Wetlands Wetland Complexes Natural Feature Size Class Analysis Wildlife Stepping Stone Analysis Flood Risk Data IDENTIFICATION AND RANKING OF ECOLOGICALLY SIGNIFICANT SITES Preliminary Site Identification GIS Site Identification Calculation of Ecological Significance Values Non-Weighted Ecological Significance Value Analysis Weighted Ecological Significance Value Analysis Spatial Definition of Ecological Hotspots Boundaries Ecological Inventory and Field Observations Within Defined Sites Ecological Hotspots Northeast Northeast Site A Northeast Site Site B Ecological Hotspots - East East Site Site C Ecological Hotspots Southeast Southeast Site Site D Ecological Hotspots Southwest Southwest Site Site G Southwest Site Site H Southwest Site Site L Southwest Site Site M Ecological Hotspots Northwest Northwest Site N and Site O Northwest Site Site P Northwest Site Q Ranking of Ecological Hotspots Key Ranking Criteria Additional Ranking Criteria O2 Planning + Design Inc. iv
6 Proximity to Existing Open Space Proximity to Land Cleared for New Development Final Ranking Scheme Recommendations REVIEW OF ENVIRONMENTAL POLICIES AND RECOMMENDED BEST PRACTICES IN OTHER JURISDICTIONS Introduction Calgary Metropolitan Plan Wetlands Riparian Buffers Regional Corridors Large Natural Vegetation Patches Ridges and Escarpments City of Calgary Water Air Land City of Edmonton Natural Areas Wetlands North Saskatchewan River Valley and Ravine System Parks and Open Space Water Air City of Red Deer Environmental Partnership Programs Nose Creek Watershed Partnership Bow River Basin Council Alberta Low Impact Development Partnership Provincial Policies Alberta Provincial Land Use Framework O2 Planning + Design Inc. v
7 Alberta Environment Alberta Sustainable Resource Development British Columbia BC Ministry of Environment Guidelines for Urban and Rural Land Development RECOMMENDED ENVIRONMENTAL BEST PRACTICES FOR AIRDRIE Ecological Inventory Data Riparian Corridors Ridges and Escarpments Natural Vegetation Wetlands Water Parks and Open Space Design Standards REFERENCES APPENDIX A. REVIEW OF PREVIOUS AIRDRIE GROWTH STUDIES APPENDIX B. LULC: GIS / IMAGE-BASED CLASSIFICATION METHODOLOGY APPENDIX C. CURRENT GROWTH MANAGEMENT POLICY FRAMEWORK APPENDIX D. SITE PHOTOS APPENDIX E. ECOLOGICAL INVENTORY SUPPLEMENTARY REPORT O2 Planning + Design Inc. vi
8 LIST OF FIGURES Figure 1 - Study Area... 4 Figure 2 - Terrain and Slopes... 6 Figure 3 - Drainage, Wetlands and Flood Prone Areas... 7 Figure 4 - Generalized Land Use and Land Cover Figure 5 - Ecological Inventory Elements: Natural and Semi-Natural Features Figure 6 - Flood Zones, Wetland Complexes and Wildlife Stepping Stones Figure 7 - Natural Feature Size Distribution Figure 8 - Preliminary Areas of Interest. (Boundaries are generalized and for illustration only). 21 Figure 9 - GIS Ecological Hoptspots - Non-Weighted Analysis Results Figure 10 - GIS Ecological Hotspots Weighted Analysis Results Figure 11 - GIS-Defined Ecological Hotspot Boundaries Figure 12 - Ecological Inventory Map. Northeast Sites A and B Figure 13 - Ecological Inventory Map. East Site C Figure 14 - Ecological Inventory Map. Southeast Site D Figure 15 - Ecological Inventory Map. Southwest Site G and H Figure 16 - Ecological Inventory Map. Southwest Site L Figure 17 - Ecological Inventory Map. Southwest Site M Figure 18 - Ecological Inventory Map. Northwest Sites O and N Figure 19 - Ecological Inventory Map. Northwest Site P Figure 20 - Ecological Inventory Map. Northwest Site Q Figure 21 - Ecological Hotspot Ranking (Non-Weighted Analysis) Figure 22 - Ecological Hotspot Ranking (Weighted Analysis) Figure 23 - Comprehensive Ecological Hotspot Ranking (Non-Weighted) Figure 24 - Comprehensive Ecological Hotspot Ranking (Weighted) LIST OF TABLES Table 1 - Generalized Land Use and Land Cover - Entire Study Area ( Ha) Table 2 - Generalized Land Use and Land Cover - City of Airdrie (3, Ha) Table 3 - Generalized Land Use and Land Cover - Potential Growth (4, Ha) Table 4 - Ecological Inventory Significance Value - Input Data Values Table 5 - Properties of GIS-Defined Ecologically Significant Areas Table 6 - Ecological Hotspot Ranking - Key Criteria Table 7 - Non-Weighted Ecological Ranking Effects of Proximity to Existing Open Space and Development Threats Table 8 - Weighted Ecological Ranking Effects of Proximity to Existing Open Space and Development Threats O2 Planning + Design Inc. vii
9 1. INTRODUCTION The City of Airdrie continues to experience significant growth. As a result, more land is required to accommodate the projected population increase over the long term. Over the last decade, a series of growth studies have been commissioned to help identify the amount of land required for long-term growth and the optimal distribution of new development to serve this growth. In 2003, the City of Airdrie annexed 1,163 hectares of land from Rocky View County and re-defined the City limits as they exist in Growth studies since the 2003 annexation have focused on the land supply required to accommodate Airdrie s projected population growth in the long-term (50 years). It has been concluded that the land within City limits that is either vacant or currently zoned for development will be insufficient to accommodate the long-term population growth that has been projected. In response to these studies, the City is in the process of identifying land currently held by Rocky View County that would meet its long-term growth requirements. The land under consideration includes a number of important natural features such as riparian corridors, wetlands, ridges and patches of natural vegetation. For this reason, an updated inventory of ecological features is required as is an assessment of the relative importance of significant groups of such features. The interrelationships and connections between individual components of high ecological value create what is known as ecological infrastructure. Features such as wetlands, riparian corridors, and patches of natural vegetation each perform vital hydrological and biodiversity functions on their own, but when considered as components in an integrated ecological infrastructure, the value of these functions is far more significant. For this reason, this study employs analyses that detect and ranks clusters or hotspots of ecological inventory elements. In much the same way that a well balanced and connected physical, social, and economic infrastructure is vital to the health of a city, a strong, healthy, and interconnected ecological infrastructure is critical to providing services such as runoff control, regulation of water quality, and protection of natural habitat. The ability to assign definitive value to these ecological services has important implications for urban planning. For example, the opportunity cost of not employing low impact development strategies to reduce surface runoff can be weighed directly against the cost of upgrading existing man-made storm water management systems to mitigate the negative effects of that decision. An inventory of ecological features is required before such complex analyses can be performed. 1.1 Purpose and Scope The purpose of this study is to update the ecological inventory, identify clusters or hotspots of ecological significance and rank these areas based on their potential to provide ecological services. The culmination of these analyses is an environmental best practices report that will identify practices used in other regional jurisdictions that can be applied to effectively manage development near the ecological significant features identified in the Airdrie growth region. 1.2 Background The project study area encompasses an area of km 2 of which 33.5km 2 (3,355 hectares) is within Airdrie City limits. The primary focus of this study is undeveloped land within current City limits and the 45.61km 2 (4,561 hectares) of land located between current City limits and the study area boundary. This area contains 101 quarter sections of land currently under the jurisdiction of Rocky View County. 1.3 Structure of Report A profile of the study area, including its historical and projected growth trends, is presented in Chapter 2. An overview of the natural environment of the wider region is then summarized. This includes the O2 Planning + Design Inc. 1
10 characteristics of the Foothills Fescue natural sub-region and an overview of the physical geography within the study area. The distribution of regional-scale natural features such as riparian corridors, wetlands and natural vegetation patches is also outlined. An overview of the current state of the study area is described based on results from a generalized land use and land cover (LULC) analysis. The LULC analysis describes the distribution of commercial, industrial, and residential land use as well as agricultural land, parks, green space, and natural areas. Statistics on the relative coverage of different land use and land cover types help summarize the state of the landscape both within current city limits and in the area identified for possible future growth. Chapter 3 provides a review of the methods used to identify and create GIS datasets of key ecological features such as steep slopes, wetland complexes, wildlife stepping-stones, and green corridors. Chapter 4 examines the steps used to identify and rank the key areas of ecological significance within the study area. GIS based ranking results are presented and an initial ranking scheme for ecologically significant sites is proposed. Additional considerations such as immediate threats from development and the potential of sites to be integrated into existing park networks are also factored into the ranking process. Chapter 4 also contains site descriptions for each of the identified ecological hotspots based on field observations. Chapter 5 is an environmental land use best practices report. In addition to a review of policies used in other jurisdictions, it contains a brief review of some key principles of ecological infrastructure and the ecological goods and services they provide. The primary functions of natural features such as slopes, wetlands and riparian corridors are explored as a foundation for examining why the implementation of best practices is so important in protecting them from development. The importance of interactions between individual components is emphasized as is the desirability of maintaining connectivity and avoiding fragmentation in the landscape. The functional relationships supported by a healthy ecological infrastructure are investigated and the importance of growth plans that recognize the importance of these relationships is stressed. A review of ecological best practices from other regional jurisdictions is then provided. These include the environmental policies of Calgary, Edmonton, Red Deer as well as provincial policies in Alberta and British Columbia. Specific policies and practices are identified for key mapped elements and the rationale, benefits and challenges of adopting such practices are discussed. Chapter 6 compares the City s current environmental policy in the context of best practices used in other jurisdictions. Best practices already proposed by the City of Airdrie are summarized and compared to those in use by other municipalities as well as those proposed by the Nose Creek Watershed Partnership and the Calgary Regional Plan. Potential improvements on current policy are suggested. O2 Planning + Design Inc. 2
11 2. STUDY AREA PROFILE 2.1 Study Area Location The project study area (Figure 1) encompasses an area of km 2 (7,911 hectares) of which 3,355 hectares is within Airdrie City limits. The primary focus of study is undeveloped land within current City limits and the 4,556 hectares of land located between current City limits and the study area boundary. The study area represents land identified by the City of Airdrie as having potential for annexation. This area is a potential two quarter section expansion of the current city limit in areas to the west and north, and a four quarter section width expansion in areas east of current City limits. 2.2 Airdrie History of Growth At the time of the 2009 census, the population of the City of Airdrie stood at 38,091. In 2000, the population of Airdrie was just over 19,000 and at that time it had not been forecast to exceed 31,000 until 2011 (City of Airdrie, 2001). The average growth rate over the last 15 years has been 5.9% (City of Airdrie, 2008a) exceeding the rate predicted in some of the earlier growth studies. Airdrie is now one of the fastest growing municipalities in Alberta. To accommodate this growth the City of Airdrie annexed 1,163 hectares of land from Rocky View County on July 1 st The annexation included five quarter sections north of Highway 567, six quarter sections south of Yankee Valley Boulevard and west of 8 th Street, and eight quarter sections south of Yankee Valley Road and east of QEII Highway (City of Airdrie, 2005b). Although the recent growth rates exceeded earlier estimates, the root causes of the growth have been fairly consistent. These include the following: Population migration to the greater Calgary area both from within Alberta and from other Provinces Desirable industrial development opportunities close to the Calgary International Airport Strategic location on QE II Highway Better access to and more interaction with the northern edge of Calgary as the developed fringe of Calgary moves towards Airdrie Relatively lower housing costs compared to Calgary Family oriented community offering high quality of life and a small town atmosphere (City of Airdrie, 2001) With the addition of annexed land in 2003, there is no immediate danger that the demand for land will outstrip supply. However the rate at which land is being developed is proceeding at a pace far greater than the rate that was presumed when the annexation plans were being drafted in An increase in average density from 6.7 units to 7.5 units negotiated as part of the 2003 Growth Area Management Plan has helped offset the greater than anticipated population growth (City of Airdrie, 2008a), but it is clear that more land will be required to accommodate growth projected to occur in the next 30 to 50 years Previous Growth Studies There have been three major growth studies over the past decade in addition to reports addressing growth principles and a comprehensive open space plan. These reports generally address the importance of minimizing the impact on natural features by development. However none to date have focused primarily on identifying and ranking areas of high value ecological infrastructure prior to the implementation of growth planning. A summary of these studies is contained in Appendix A. O2 Planning + Design Inc. 3

12 Figure 1 - Study Area O2 Planning + Design Inc. 4
13 2.2.2 Growth Management Policies The challenge in the growth area is not finding sufficient land for development but finding suitable land that does not adversely impact ecologically significant areas or displace valuable agricultural land. Existing growth management policies address these concerns to varying degrees. A review of the current growth management policy framework is provided in Appendix C. 2.3 Study Area Landscape Context Regional Context The greater Calgary region including Airdrie is located in an area of the Parkland Natural Ecoregion (Natural Regions Committee, 2006) that is transitioned by the Foothills Parkland, Central Parkland and Foothills Fescue natural subregions. The study area is almost entirely in the Foothills Fescue natural subregion. The western edge of the study area occupies the transition zone between foothills fescue and central parkland. The Foothills Fescue subregion is characterized by cool winters, warm summers and above average precipitation relative to other grassland subregions. Dominant soils are chernozems that support grassland vegetation communities including rough fescue, blue bunch fescue and oat grass (Natural Regions Committee, 2006). Native grasslands in this sub-region include rough fescue and Parry s oat grass. Grass subspecies include bluegrasses, northern wheat grass and june grass (City of Airdrie, 2006a). Most natural grasslands have been displaced by agriculture and invasive species Terrain Elevation ranges from a maximum of 1168 metres along the western edge of the study area to a minimum of 1078 metres in the Nose Creek Valley at the southern edge of the study area. Nose Creek flows from north to south through the study area and topography reflects this. High ground is located along the western and eastern fringes of the study area with low ground nearest the Nose Creek channel. Terrain is level to gently undulating and becomes more rolling in western parts of the study area. Steep slopes occur in more undulating parts of the study area. The significant natural slopes occur along several tributaries that feed into Nose Creek from the northwest and northeast (Figure 2) Streams and Drainage The study area is within the Nose Creek watershed. Nose Creek drains south and is fed by a number of small tributaries leading in from the northwest and northeast. Alberta Environment has identified areas of Nose Creek prone to flooding and has established boundaries for the floodway and flood fringe (Figure 3) Wetlands Wetlands occur in poorly drained parts of the study area. Significant wetland features occur along the southern boundary of Airdrie and in the eastern part of the study area (Figure 3). Wetlands are a mix of open water, marsh and worked marsh features. O2 Planning + Design Inc. 5

14 Figure 2 - Terrain and Slopes O2 Planning + Design Inc. 6

15 Figure 3 - Drainage, Wetlands and Flood Prone Areas O2 Planning + Design Inc. 7
16 2.3.5 Agriculture The dominant land use outside of the City limits is agricultural. Agricultural use is a mix of cropland and pasture land for cattle grazing Vegetation The study area is largely devoid of significant natural woodlands. The exception is the northeast which contains scattered wooded areas comprised primarily of aspen. Remaining wooded areas occur in the riparian zones of Nose Creek and its associated tributaries although large dense patches of mature trees are rare. Much of the original native grassland has been cultivated and most of the study area is dominated by non-native invasive species Existing Open Space Existing open space within City limits is a mix of natural and semi-natural green space, outdoor sports and recreation areas and pathways. New developments are required to set aside green space as well as demonstrate how it will connect with existing green space (Appendix C-4 and C-5). 2.4 Study Area - Land Use and Land Cover (LULC) Introduction Prior to identifying specific elements of ecological infrastructure, a land use and land cover (LULC) analysis was performed on the entire study area to assess the relative distribution of both natural and non-natural surface types. The initial LULC layer was created using a combination of GIS analysis, airphoto interpretation and field observations. A detailed technical description of LULC methodology is provided in Appendix B. Component classes were combined into broad LULC types. The generalized LULC analysis provides a quick summary of land types within a) the entire study area, b) Airdrie City limits and most importantly c) the potential growth region outside City limits Generalized LULC Results. The generalized LULC classification uses 13 broad classes. Each of the 13 classes is sourced from a larger number of sub-classes derived from GIS data, image interpretation, field observation or a combination thereof: The broad LULC classes area as follows: Roads Rail Rural Farmstead Developed Land Commercial Developed Land Industrial Developed Land Residential New Development Cleared Land or Land under Construction Undifferentiated Urban / Anthropogenic Cropland O2 Planning + Design Inc. 8
17 Grassland Trees Water (Includes Open Water Wetlands) Wetlands (Marsh) Generalized LULC Full Study Area ( Ha.) Generalized LULC for the study area is shown in Figure 4. LULC analysis was extended outside the study area bounds to give a better regional context in LULC maps. Table 1 contains a statistical summary of the relative proportion of each class over the entire study area. However, these statistics are only based on LULC within the study area boundary. O2 Planning + Design Inc. 9

18 Figure 4 - Generalized Land Use and Land Cover O2 Planning + Design Inc. 10
19 Table 1 - Generalized Land Use and Land Cover - Entire Study Area ( Ha) Generalized LULC Class % Cover (Area in Ha.) within Study Area Grass or Pasture 33.99% ( ) Cropland 32.60% ( ) Trees 1.59% (125.79) Water (Including Open Water Wetlands) 1.13% (89.40) Wetlands - Marsh 1.82% (143.99) CP Rail 0.07% (5.54) Roads 6.89% (545.09) Undifferentiated Urban / Anthropogenic 1.49% (117.89) Developed Land - Commercial 1.07% (84.65) Developed Land - Residential 7.57% (598.89) Developed Land - Industrial 2.14% (169.30) New Development (Cleared Land/Construction Site) 8.38% (662.97) Rural Farmstead 1.26% (99.68) The generalized LULC shows that grassland and cropland account for nearly equal proportions of the land cover for the total study area at 33.99% and 32.6% respectively. As discussed previously there is some overlap between these two classes due to the difficulty of interpreting the separation between cropland, grassland and rangeland from airphotos. Although the developed areas of Airdrie and Rocky View County have a major visual presence on the LULC map, when averaged over the entire study area their footprints are relatively small. Existing commercial, residential and industrial development accounts for just under 11% of land cover in the study area. Developed land cover is 19.24% when roads, rail and miscellaneous urban/anthropogenic features are added to existing commercial, residential and industrial areas. The 19.24% developed cover increases to 27.6% when new developments (cleared land / construction areas) are included in the calculation of developed areas Generalized LULC City of Airdrie (3, Ha.) Table 2 - Generalized Land Use and Land Cover - City of Airdrie (3, Ha) Generalized LULC Class % Cover (Area in Ha.) within Airdrie Limits Grass or Pasture 26.76% (897.76) Cropland 9.12% (305.96) Trees 1.26% (42.27) Water (Including Open Water Wetlands) 2.55% (85.55) Wetlands - Marsh 1.14% (38.25) CP Rail 0.15% (5.03) Roads 13.44% (450.89) Undifferentiated Urban / Anthropogenic 1.39% (46.63) Developed Land - Commercial 2.52% (84.54) Developed Land - Residential 16.43% (551.21) Developed Land - Industrial 5.06% (169.76) New Development Cleared Land / Construction Site 19.76% (662.95) Rural Farmstead 0.41% (13.75) Within City limits the distribution of generalized LULC classes is very different. As would be expected the proportion of cropland is low at only 9.12%. However the proportion of grassland is still relatively high at 26.76%. This value includes not only pasture and rangeland at the edge of the city, but also parks, green O2 Planning + Design Inc. 11
20 space and recreational facilities within City limits. Existing residential, commercial and industrial development represents 16.43%, 2.52% and 5.06% of land use respectively. Existing commercial, industrial and residential areas, combined with roads, rail and other urban features brings the total developed footprint within City limits to 39%. This value does not consider land cleared or under construction for new developments. When this land is added the total developed footprint increases to 58.75% of all land within City limits Generalized LULC Airdrie Growth Area (4, Ha.) Table 3 - Generalized Land Use and Land Cover - Potential Growth (4, Ha) Generalized LULC Class % Cover within Growth Area Grass or Pasture 39.27% ( ) Cropland 49.9% ( ) Trees 1.83% (83.38) Water (Including Open Water Wetlands) 0.09% (4.10) Wetlands - Marsh 2.33% (106.17) CP Rail 0.02% (0.91) Roads 2.06% (93.86) Undifferentiated Urban / Anthropogenic 1.56% (71.08) Developed Land - Commercial 0% (0) Developed Land - Residential 1.06% (48.30) Developed Land - Industrial 0% (0) New Development Cleared Land / Construction Site 0% (0) Rural Farmstead 1.89% (86.12) The growth area is land outside of City Limits and within the study area boundary. This 4561 hectare area is overwhelmingly rural in nature. Cropland and grassland together account for 89% of all land cover. Development is limited to rural residential properties, farmsteads, and roads. These land uses account for only 6.6% of the growth area. The remaining land cover is comprised of woodland areas and wetlands. The challenge in the growth area is not finding sufficient land for development but finding suitable land that does not adversely impact ecologically significant areas or displace valuable agricultural land. Existing growth management policies address these concerns to varying degrees. The current growth management policy framework is described in Appendix C. O2 Planning + Design Inc. 12
21 3. IDENTIFICATION OF ECOLOGICAL INVENTORY FEATURES 3.1 Introduction A GIS-based ecological inventory datasets requires the identification and extraction of representative data of natural features. An ecological inventory includes natural features such as slopes, riparian corridors, woodland areas, wetlands and data relating to wildlife habitat. Ecological Inventory data is created by first separating the broad Land Use Land Cover (LULC) layer into natural and non-natural landscape features. Specific features of ecological significance are then identified from the natural land cover. 3.2 Ecological Inventory Features Introduction Creating an updated ecological inventory was performed by extracting natural features from the generalized LULC layer in combination with airphoto interpretation and spatial modeling. The following features were identified as priority elements of ecological inventory to be identified and compiled as GIS datasets: Riparian Corridors Natural / Semi-Natural Grassland Patches Steep Slopes Trees and Shrubs Wetlands Wetland Complexes Wildlife Connectivity Features ( Stepping Stones ) Areas Prone to Flooding Riparian Corridors Riparian Corridors are some of the most important ecological features in the study area. They provide moisture and shelter in a landscape that is generally dry and windswept. They also serve as connections to allow the movement of wildlife through the landscape. Riparian corridors were identified through the interpretation of high resolution aerial imagery. Within City limits, cm colour orthoimagery was used. Outside of City limits 50cm Rocky View County colour orthoimagery was used. Riparian corridors were digitized from the airphotos at a scale of 1:5000. This scale allowed for the recognition of subtle vegetation boundaries and terrain variations that denote the natural boundaries of these features. Areas within riparian corridors typically appear much greener in than the surrounding non-riparian landscape. GIS stream data was first used to identify the centre lines of potential riparian corridors. GIS polygon features were then digitized from the imagery along natural vegetation boundaries at the top of the slopes and escarpments that clearly mark the outer edge of such corridors Care was taken to reflect the fragmentation of riparian features by roads and other linear disturbances. In these cases polygons were not continued across the obstruction but split into two features. Using this digitizing method, five major riparian corridors were identified. They include the Nose Creek corridor and O2 Planning + Design Inc. 13
22 corridors associated with three creeks in the western part of the study area, and one creek in the east of the study area (Figure 5) Natural /Semi-Natural Grassland While it was not possible to identify native grassland from aerial photography, an attempt was made to interpret and digitize patches of natural, semi-natural grassland or rangeland. These areas of grassland appear different than the linear grassy features associated with riparian corridors. Typically they were more regular in shape and were located sporadically throughout the study area surrounded by cropland. Subsequent field visits allowed ground conditions to be cross-referenced with the image interpretation to better characterize these areas. These natural or semi-natural grassland patches are non-cropped areas consisting of relatively continuous areas of mixed non-native grassland or cattle-grazed rangeland (Figure 5). Although they do not have the true habitat value that large patches of native grassland would offer, they nonetheless represent large areas of open cover that can facilitate wildlife movement as well as offering some benefits in terms of soil stability and water management Steep Slopes Steep slopes were identified using GIS analysis performed on both a 2m Digital Elevation Model (DEM) derived from Rocky View County contour data and a 10m AltaLIS DEM used with permission from the Calgary Metropolitan Plan (CMP). The Surface Analysis Slope function in ArcGIS Spatial Analyst was used to create slope maps from the DEM data. These slope maps were then reclassified to show only slopes exceeding 15% in grade. Identified areas were then converted from raster to polygons. This procedure was performed on both the 2m Rocky View and 10m AltaLIS data. Despite its higher resolution the 2m data produced angular, grainy and disjointed slope features. The AltaLIS 10m slope classification produced broader, smoother and more contiguous slope features. These slope features are used in this study. Editing was performed on the output steep slope polygons in order to remove edge artifacts and manmade steep slopes formed by major highway intersections within City limits. The result is a mapped layer of naturally occurring steep slopes. These slopes are primarily associated with the riparian corridor features digitized from airphotos (Figure 5) Trees and Shrubs Clusters of trees and shrubs are a significant ecological inventory element in the Airdrie area largely because the landscape in the study area is so noticeably devoid of woodland. Consequently even small patches of shrubs and trees can add additional value to areas already identified as having ecological value. Initial identification of woodland areas was performed by digitizing polygons around larger stands visible in airphotos. These digitized woodland areas form part of the generalized LULC analysis (Figure 4). Extraction of tree stands in high detail using manual airphoto interpretation was not practical. Despite the relatively small study area there are many hundreds of tree and shrub clusters. Instead, an automated moving window analysis was performed on the airphoto data to detect areas of high variance. Large variation in image colour and texture in a small area can be used to detect areas of high landscape heterogeneity. Stands of trees and shrubs located in comparatively featureless grass or agricultural fields are uniquely suited to this kind of detection algorithm. Variance in the Airdrie 2008 and Rocky View County 2007 airphoto imagery was extracted using a 3x3 moving window in ArcGIS Spatial Analyst to obtain the standard deviation of image pixel values within the window. The values were then squared and the resulting raster output was classified into 25 classes using an unsupervised classification in Erdas Imagine. Classes corresponding closely to the location of O2 Planning + Design Inc. 14
23 tree stands were isolated and exported as GIS polygons. Some manual editing was required to remove misclassified features. Overall, the variance approach produces an accurate spatial summary of significant tree and shrub clusters in considerably less time than could be achieved through manual interpretation (Figure 5) Wetlands Wetland data was extracted directly from the Ducks Unlimited GIS datasets (Figure 5). Inclusion in the wetland ecological inventory was restricted to features identified by Ducks Unlimited as being either open water, marsh or worked (agricultural) marsh. The smaller worked agricultural marshes do not have the higher biodiversity of the other classes, but they still perform important ecological functions. Dugouts and other man-made features were not included in the wetland ecological layer however Wetland Complexes Wetland complexes are defined as areas consisting of two or more wetlands connected within 200m where the total wetland surface is greater than 5 hectares (BCMOFR, 1995). Wetland complexes were identified by reclassifying the generalized land cover map into a simple binary raster image in which all wetland and floodplain features are assigned a value of 1 and all other classes are assigned a value of 0. Wetland features were assigned unique identifiers using the ArcGIS Region Group function. A euclidean distance analysis was then performed on the wetlands to a distance of 100 metres. The output raster features were assigned a value of 1 and assigned unique wetland complex identification numbers. Complexes were retained if they contained two or more wetlands with a combined area equal to or exceeding 0.5 hectares. Selected complexes were exported as shapefiles and used in the ecological inventory ranking analysis (Figure 6). Wetlands within such complexes are assigned a higher score due to the higher ecological value inherent in connected wetland areas Natural Feature Size Class Analysis One component of ecological inventory analysis is the relative size distribution of natural features (natural patches). Landscapes may contain a few large features, numerous small features or a mix of both (Figure 7). To perform this analysis, the generalized LULC features were divided into natural classes (grasslands, lakes, rivers wetlands and trees) and non-natural classes (built up areas, roads, rail, and crop land). Features were converted to a binary raster with natural features assigned a value of 1 and non-natural features assigned a value of 0. The binary raster was grouped using the Region Group tool in ArcGIS Spatial Analyst using a spatial connectivity setting of four. This ensures that cells from two features that are connected only by the diagonal corners of individual pixels are not considered as one group. The resultant natural clusters were converted to polygons and classified into discrete size classes: <2 ha ha ha ha ha >10000 ha O2 Planning + Design Inc. 15
24 3.2.9 Wildlife Stepping Stone Analysis Natural patches that are isolated from one another can still function as part of a wildlife corridor depending on the characteristics, size and relative distance to neighbouring patches. Separated patches that act as a connected corridor are termed stepping stones. This concept is highly species specific (as are the natural patch requirements). For this analysis, stepping stone analysis was performed for two broad species groups; small mammals and meso-carnivores (Figure 6). Natural patch features between 2 and 100 hectares in size were identified as potential small mammal stepping stones, while natural patches 100 to 1000 hectares in size were identified as potential mesocarnivore stepping stones. The connection criteria required were, for small mammals, a distance of less than 200 metres from another natural patch 2 to 100 hectares in size. For meso-carnivores, a distance of less than 500 metres from another natural patch 100 to 1000 hectares in size was required. Natural patches which met the size requirements to be stepping stones but did not have the requisite connection distance were defined as isolated stepping stones. In the ecological inventory assessment, natural features which qualify as wildlife stepping stones are assigned a higher score Flood Risk Data Alberta Environment GIS data related to flooding was added as the final ecological inventory component. Two GIS datasets were acquired for Nose Creek - the floodway and the flood fringe (Figure 6). The floodway is the area of most risk and indicates an area where development, other than open space is not permitted. Inclusion of the flood data as ranking criteria for ecologically sensitive areas reflects the importance of considering flood prone areas in both planning and environmental protection (Golder Associates, 2006), but also underscores the importance of maintaining the Nose Creek floodway as environmental reserve to prevent inappropriate development. In the ranking analysis, ecological features which fall within the floodway and flood fringe as identified by Alberta Environment score higher than similar areas outside the flood risk zone. Ranking ecologically significant areas within the floodway higher is consistent with goals and policies set out in the Intermunicipal Development Plan which recognizes the Nose Creek floodway as an area of significant environmental value. The Airdrie City Plan also recognizes the importance of the Nose Creek floodway. Environmental Sustainability Policy specifically states that no development other than parks shall be permitted to occur within the floodway of Nose Creek. While less stringent policies apply to the flood fringe, areas of ecological significance that are located within the flood fringe could be considered to have a greater reason to be designated as open space than similar areas outside it. O2 Planning + Design Inc. 16
25 Figure 5 - Ecological Inventory Elements: Natural and Semi-Natural Features O2 Planning + Design Inc. 17

26 Figure 6 - Flood Zones, Wetland Complexes and Wildlife Stepping Stones O2 Planning + Design Inc. 18
27 Figure 7 - Natural Feature Size Distribution O2 Planning + Design Inc. 19
28 4. IDENTIFICATION AND RANKING OF ECOLOGICALLY SIGNIFICANT SITES With individual ecological inventory elements identified and extracted as GIS layers, the next step was to locate clusters of such elements. These ecological hotspots represent areas where several disparate features are concentrated in a small area. Potential areas of interest were initially identified during meetings with City Engineering, Planning and Parks staff. GIS analysis performed independently subsequently confirmed those locations as ecologically significant in addition to locating other sites of interest. Once identified, the boundaries of these ecological hotspots were spatially defined based on their relative value and ranked on a number of criteria. Field visits were used to confirm ecological inventory elements. Terminology In this section and those following it, areas of significant ecological interest are referred to in several ways including ecological hotspots, areas of ecological significance, high ecological significance values and clusters of ecological inventory elements. 4.1 Preliminary Site Identification Initial site identification was achieved via discussion with parks, planning and engineering staff at the City of Airdrie. Their detailed knowledge of the area was used to identify a number of areas of interest. Thirteen sites were identified in total. Some sites contained multiple locations, but were grouped in such a way as to be considered single sites for the purposes of discussion. The areas of interest identified in these initial discussions are shown in Figure 8. Site boundaries shown are representational only and do not reflect the actual extent of any specific ecological features. The areas of interest primarily correspond to tributaries of Nose Creek (Sites 8, 9 and 10); undeveloped areas of the Nose Creek floodplain (Sites 6 and 12); undeveloped locations near the downtown area (Site 13); wooded areas (Site 1) and locations with wetlands (Sites 4, 5 and 7). 4.2 GIS Site Identification Calculation of Ecological Significance Values GIS Analysis was used to locate areas with high ecological significance values (ecological hotspots) and to compare the results to the areas of interest. The purpose was to see if there was agreement between the sites picked through local knowledge of the area and sites identified independently through GIS analysis. Initial identification of ecologically significant areas was performed by assembling the various ecological inventory GIS datasets described in Section 3.2 and performing overlay analyses to identify clusters of multiple features. Each feature was assigned a base value (1) and a weighted value. The value of ecological clusters was based on a) how many features overlapped and b) how those features values were weighted. Areas of high ecological value ( ecological hotspots ) were defined in both cases as areas where the sum score of ecological value was greater than the average for the whole study area. O2 Planning + Design Inc. 20
29 Figure 8 - Preliminary Areas of Interest. (Boundaries are generalized and for illustration only) O2 Planning + Design Inc. 21
30 Table 4 shows the input features used to calculate sum scores of ecological significance and the values assigned to base and weighted analyses. Table 4 - Ecological Inventory Significance Value - Input Data Values Ecological Inventory Layer Base (Non-Weighted) Weighted Score Score Natural / Semi Natural Grassland Patches 1 1 Riparian Corridors 1 3 Meso-Carnivore Stepping Stones 1 1 Isolated Stepping Stones 1 1 Steep Slopes 1 2 Trees and Shrubs 1 2 Wetland Open Water 1 3 Wetland - Marsh 1 2 Wetland Marsh (Worked) 1 1 Wetland Complex 1 2 Floodway 1 3 Flood Fringe 1 2 These analyses did not apply additional weight to natural features based on their size, focusing instead on the number of interactions between individual ecological inventory elements Non-Weighted Ecological Significance Value Analysis This methodology considered all input ecological inventory components to be of equal value (1). The input layers were merged together using the union command in ArcInfo. ArcInfo was used because it allows the operation to be performed on more than two datasets. On completion of the union, the total value of all the input layers base score attribute fields were calculated and added to a new field. The total score value is a simple sum-total of the number of individual ecological features that overlap at any location. The average sum-total for the entire study area is 1.72, meaning that, in areas where multiple ecological features are found, the average number of overlapping features is Areas where the number of overlapping ecological data layers exceeded this value were defined as having above average ecological value, and were consequently considered as ecological hotspots. Figure 9 shows the distribution of areas with above average ecological significance value. It also illustrates the analysis results outside of the study area boundary. However, the average ecological significance value was calculated using data clipped to the study area boundary. Figure 9 also shows the boundaries of the areas of interest. It can be seen that the GIS analysis produced above average ecological significance values in all but four (Sites 3, 7a, 9b and 9c) of the areas of interest. The GIS analysis also identified areas of above average ecological value that had not been previously noted. O2 Planning + Design Inc. 22

31 Figure 9 - GIS Ecological Hotspots - Non-Weighted Analysis Results O2 Planning + Design Inc. 23
32 The highest values occur in Site 6 and in the floodplain area south of Site 12. A linear feature of above average ecological significance value follows the floodplain of Nose Creek through the entire study area. The largest area of above average ecological significance is Site 4 where a collection of interconnected wetlands form a significant ecological hotspot Weighted Ecological Significance Value Analysis To verify that the GIS overlay methodology could reliably locate the same areas of ecological significance independently, the ecological significance values were recalculated and remapped using the weighted multipliers show in Table 4. The weighted values recognize that certain ecological inventory elements are significantly more important than others. The weighted values were based on the relative value of each feature s potential ability to provide ecological services and on specific policy recognition of certain features as important. Riparian corridors were assigned the highest weighting score of 3 because of the multiple functions they provide in maintaining water quality, controlling runoff, facilitating wildlife movement and their potential to be integrated into open space networks. Similarly, open water wetlands received a weighting of 3 due to the importance of the surface-ground water connections they provide; their role as habitat for local and migratory bird species and their role in helping to manage storm water runoff and preserve water quality. The Nose Creek floodway also received a weighted score of 3. This reflects the specific policies of the Municipal Development Plan that expressly prohibit development (other than open space) within its extent. This weighting also underscores the importance of Nose Creek as identified in the Intermunicipal Development Plan and, in combination with other clusters of ecological inventory features, may help identify locations for future incorporation into the open space network. Steep slopes received a weighting of 2 due to their scenic value, the natural wildlife corridors along their crests and the potentially negative impacts of development on or near those crests. These negative impacts include destabilization and erosion which in turn reduce downstream water quality and an increase in imperviousness which increases overland flow, further exposing steep slopes to erosion. The weighting of 2 for trees and shrubs is intended to acknowledge the significance of natural wooded areas. However in this analysis all treed areas are weighted equally. The weighting of trees is a reflection of their rarity in the landscape and of the valuable services they provide in reducing wind and, when present in larger patches, offering valuable interior habitat for wildlife. Artificial shelter belts and other small planted areas also have value in terms of their integration into future open space and parks. Marsh wetlands received a weighting of 2. They provide similar functions as open water wetlands, but their value is less significant due to variable water levels. Wetland complexes were assigned a weighting of 2 in recognition of their importance in providing interconnectivity in the landscape. Flood fringe areas were weighted at 2 due to the potential hazards of development and their inherent suitability to be integrated into existing riparian open space networks. As with the non-weighted analysis, all the individual ecological features were merged together using the union command in ArcInfo. On completion of the union the total value of all the input layers weighted score attribute fields were calculated and added to a new field. This field contains the sum-total and weighted value of the number of individual ecological features that overlap at any location. The mean value of weighted of overlapping features for the entire study area is 3. Overlapping areas with a score equal or exceeding 3 were defined as ecological hotspots. Figure 10 shows the distribution of ecological hotspots as calculated using the weighted overlay approach. O2 Planning + Design Inc. 24
33 Figure 10 - GIS Ecological Hotspots Weighted Analysis Results O2 Planning + Design Inc. 25
34 The weighted analysis produces the same pattern of ecological hotspots as the non-weighted analysis. The weighted analysis more clearly identifies the Nose Creek corridor and wetland areas as peak ecological hotspots, as would be expected due to the weighting bias towards input features of this type. Only three of the discussed sites were not identified in the GIS methodology (Site 3, 7b and Site 9c). The weighted GIS analysis performed as well as the non-weighted analysis in identifying independently, the initial sites of interest noted by the City Spatial Definition of Ecological Hotspots Boundaries The GIS non-weighted and weighted ecological feature analyses were both able to pick out the same areas of ecological value that had identified as areas of interest. The weighted analysis provided more detail in the calculated hotspots due to the greater range in potential values and strong bias towards highlighting locations within floodplains, riparian corridors and wetland areas. The next step was to define boundaries for the identified ecological hotspots. The boundaries of the identified areas of interest were general in nature. The GIS approach allows ecological hotspot boundaries to be defined by simple statistical rules. In this case, edges of ecological hotspots were simply defined as areas with above-average ecological significance values. Statistically defined boundaries allow areas to be ranked based on size and the number of ecologically significant within the boundaries. Using a GIS methodology to define the boundaries of areas of high ecological value also provides a means for robust ranking of the same areas. Ecological hotspots were spatially defined using GIS analysis based on the following conditions: 1) Areas with ecological significance values above the mean value for the study area 2) Located within areas of interest Hotspots identified by GIS that were outside the bounds of areas of interest were included if they were of both above average size and ecological significance value. In some cases there were clear connections between hotspots identified by GIS which resulted in their boundaries extending beyond the general areas of interest. In one case (Site 7b) GIS analysis did not result in above average scores despite the location being identified as a Class 2 wetland. Due to the known significance of this feature, its boundary was included. GIS hotspot mapping was performed for both the weighted and non-weighted analysis results. In both cases ecological scores relative to the study area average define the hotspot boundaries (Figure 11). O2 Planning + Design Inc. 26
35 Figure 11 - GIS-Defined Ecological Hotspot Boundaries O2 Planning + Design Inc. 27
36 GIS analysis identified a total of 12 ecological hotspots using the decision rules outlined. They are identified by alphabetic notation and by the quadrant of the study area within which they are located. The weighted and non-weighted overlay analysis resulted in boundaries of above average ecological value that were identical for most sites. In sites where the edges differ (NW Site N, SW Site M, East Site C), the results from weighted analysis generally exhibit larger and more contiguous boundaries. An exception is SE Site D which has a larger boundary from the non-weighted analysis. Some sites (specifically SW Site L) are comprised of more than one part, but are considered as one site due to the close location of individual parts. Table 5 - Properties of GIS-Defined Ecologically Significant Areas Area of Interest ID GIS Hotspot ID (Non-Weighted) GIS Hotspot ID (Weighted) GIS Hotspot Area Ha.(Non- Weighted) GIS Hotspot Area Ha.(Weighted) Site 1 NE Site A NE Site A ha ha. Site 2 NE Site B NE Site B 7.82 ha ha. Site 3 No GIS Hotspot No GIS Hotspot Site 4 East Site C East Site C ha ha. Site 5 SE Site D SE Site D ha ha. Site 6 SW Site G SW Site G ha ha. Site 7a/7b SW Site H SW Site H ha ha. Site 8 SW Site L SW Site L ha ha. Site 9a/9b SW Site M SW Site M Site 10 NW Site N NW Site N ha ha. Site 10 NW Site O NW Site O 0.48 ha ha. Site 12 NW Site P NW Site P ha ha. Site 13a/13b NW Site Q NW Site Q ha ha. 4.3 Ecological Inventory and Field Observations Within Defined Sites GIS analysis produces definitive hotspot boundaries within which an inventory of ecologically significant features can be generated. Field observations were made within the 12 sites to verify the desktop analysis and to note any discrepancies between GIS mapped conditions and conditions on the ground. In the following sections, site summaries for each of the 12 hotspots are presented. They include mapped inventory features and descriptions of observed field conditions. Terminology The term ecological significance value is used frequently in this section. It describes the weighted or non-weighted GIS score of each site based on the number and type of overlapping features. The average ecological significance value is the score (weighted = 3.0 and non-weighted = 1.72) for the entire area. Sites boundaries are defined as areas within which the local score (weighted and non-weighted) exceeds this average. Ranking is based on the degree to which local site values exceed the average. The overall site ecological significance value is the average score within the site (not to be confused with the average score for the study area). Small locations within each site may exceed the overall value due to local clustering of a large number of ecological features. The highest ecological significance value describes these within-site hotspots and is quantified via the weighted and non-weighted maximum value. O2 Planning + Design Inc. 28
37 4.3.1 Ecological Hotspots Northeast Northeast Site A (Twp27-Rge29-Sec14-NW and NE) GIS Analysis identified a cluster of natural features spread over the northern portion of these two quarter sections that scored above average in both weighted and non-weighted overlay analysis (Figure 12) The GIS-derived ecological inventory within the bounds of this ecological hotspot is as follows: Natural / Semi-Natural Grassland Small Mammal Stepping Stone Meso-Carnivore Stepping Stone Marsh Wetland Trees and Shrubs There are five ecologically significant features within the bounds of the site. The non-weighted and weighted overall site ecological significance values are 3.7 and 4.6 respectively. The highest ecological significance value occurs near a small marshy wetland GIS feature. At this point all five ecological layers overlap giving a non-weighted and weighted score of 5 and 7 respectively. This site covers an area of approximately 45 hectares and scored high due to areas of semi-natural grassland combined with dense clusters of tree cover. In addition, the size of the semi-natural grassland is sufficient for this location to be considered as both a meso carnivore and small mammal stepping stone. Landowner permission was granted for field confirmation in Section 14 NW only. Consequently it was not possible to get access or a close view of the small marsh wetland located in the northeast. Field observations noted that the grass was actively grazed by cattle. The clusters of trees were comprised primarily of aspen. Some tree stands contained downed limbs and evidence of wood piles. Consequently the smaller stands were thin and offered little potential to support habitat favoured by interior species. The larger wooded areas were more intact however, with less evidence of human disturbance. Tree density was much higher and the understory was much better developed. Although there were no wildlife sightings during the field visit, the larger aspen stands looked to offer suitable habitat conditions for deer. Despite the heavily grazed nature of this site, it contained the largest proportion of woodland of all sites visited. O2 Planning + Design Inc. 29

38 Figure 12 - Ecological Inventory Map. Northeast Sites A and B O2 Planning + Design Inc. 30
39 Northeast Site Site B. (Twp27-Rge29-Sec24-SE and SW) GIS analysis identified this site as containing a relatively large patch of natural or semi-natural grassland. This patch is large enough (43.7 hectares) to meet the criteria for both a meso-carnivore and a small mammal stepping stone, although only a small portion (8 ha.) is located within the study area. The GISderived ecological inventory within the bounds of this ecological hotspot is as follows: Natural / Semi-Natural Grassland Small Mammal Stepping Stone Meso-Carnivore Stepping Stone Open Water Wetland Trees and Shrubs There are five ecologically significant features within the bounds of the site (Figure 12). The nonweighted and weighted overall site ecological significance values are 3.16 and 4.0 respectively. The highest ecological significance value occurs near the open water GIS feature. At this point four ecological layers overlap giving a non-weighted and weighted maximum score of 4 and 6 respectively. A field visit was made to Section 24 NW where the landowner gave field crew a tour of the property. The wetland that was picked up as hotspot in the GIS analysis is actually a man-made pond. The landowner described how the pond developed after a small dam was constructed 30 years ago to the north of the wetland s current location. According to the landowner, the open water pond is fed primarily by runoff, not groundwater. Ducks were present on the pond during the field visit. The landowner has planted approximately 3000 saplings around the pond and along the access road between the pond and the house. Although within the bounds of the ecological hotspot, this quarter section contains a former RCMP shooting range. This is located immediately to the north of the landowner s house. Soil from this site is currently being tested for lead contamination with the goal of restoring the soil to safe levels. The man-made pond and efforts to plant trees give this site a relatively high score despite its relatively small size and location at the extreme northeast of the study area Ecological Hotspots - East East Site Site C GIS analysis identified the largest ecological hotspot in the entire study area in the wetland complex east of Airdrie City limits. Non-weighted and weighted GIS analysis identified areas of 117 and 122 hectares respectively. These numbers refer only to the area within the study area however. Site boundaries extend east and north of the study area edge. The site boundaries are defined by the edge of the wetland complex and by a riparian corridor leading towards the south east corner of Airdrie. This site appears as a major ecological hotspot due to the close proximity of multiple wetlands and riparian corridors. The GIS-derived ecological inventory within the bounds of this ecological hotspot is as follows: Natural/Semi-Natural Grassland Riparian Corridor Isolated Stepping Stone Wetland Complex O2 Planning + Design Inc. 31
40 Open Water Wetland Marsh Wetland Trees and Shrubs Steep Slopes There are eight ecologically significant features within the bounds of the site (Figure 13), although the average non-weighted and weighted site ecological significance values are 2.6 and 5.4 respectively. The highest ecological significance values occur near the edges of wetlands and in the riparian corridor extending southwest from the main hotspot. At these points the non-weighted and weighted maximum ecological significance values are 4 and 10 respectively. Due to the large sprawling area occupied by this hotspot, fieldwork proved challenging. Permission to access the entire area occupied by this cluster was not available so field observations performed in the authorized areas and from nearby public roads were used to inform decisions and guide further GIS analysis in areas where fieldwork could not be performed. Landowner permission was granted for Twp 27, Rge. 28, Section 7 SW and NW. Field observations were performed along the western edge of the wetlands in these quarter sections. GIS data identified the wetlands as being of the marsh class. Field observation revealed a network of open water wetlands however. These two quarter sections were used for cattle grazing. Cattle were spotted during the field visit and evidence of widespread cattle activity was clearly visible along the edges of the wetland and in the grassland to the west. The effects of extensive cattle grazing on water quality in the wetlands are not known. Highway 567 divides the wetland complex in the north part of this site but culverts maintain water flow underneath the highway. O2 Planning + Design Inc. 32

41 Figure 13 - Ecological Inventory Map. East Site C O2 Planning + Design Inc. 33
42 4.3.3 Ecological Hotspots Southeast Southeast Site Site D (Twp26-Rge29-Sec34NE and Sec35NW) GIS analysis identified this small but diverse hotspot in the southeast part of the study area. Bisected by Range Road 292, the primary features in this cluster are two wetlands, which although identified in the GIS data as marsh, contained open water during a field visit. Despite their relatively small size and being divided by the road, these wetlands appeared to be in good health. The wetland west of Range Road 292 had a well developed buffer of marshy vegetation, while ducks were observed at the wetland on the east side of the road. The GIS-derived ecological inventory within the bounds of this ecological hotspot is as follows: Natural/Semi-Natural Grassland Meso-Carnivore Stepping Stone Wetland Complex Marsh Wetland Trees and Shrubs Steep Slopes There are six ecologically significant features within the bounds of the site boundary (Figure 14). The non-weighted and weighted overall site ecological significance values are 2.91 and 4.98 respectively. The highest ecological significance values correspond to the wetlands and steep slopes surrounding them. Non-weighted and weighted maximum values in these areas are 5 and 8 respectively. This site is on the edge of a wetland complex, another factor that contributed to its high score in the GIS analysis. Other high scoring natural features are steep slopes and a relatively large patch of natural or semi-natural grassland that is large enough to form a meso carnivore stepping stone. A coyote was observed during the field visit. The hilly area in southeast corner of Section 34 NE was home to a mix of rough grass and shrub types and appeared relatively undisturbed compared to the cropland surrounding it. A couple of marshy wetlands identified in GIS data could not be located definitively and could be intermittent in nature. None of the land within the hotspot boundary showed any evidence of cattle grazing. O2 Planning + Design Inc. 34

43 Figure 14 - Ecological Inventory Map. Southeast Site D O2 Planning + Design Inc. 35
44 4.3.4 Ecological Hotspots Southwest Southwest Site Site G (Twp26-Rge01-Sec25 SE and NE) This 58 hectare hotspot is located in the eastern parts of Section 25 SE and NE between the QEII Highway and the CP Rail line. GIS analysis picked up a cluster of ecological features comprised of a riparian corridor along Nose Creek, a contiguous patch of semi-natural grassland, steep slopes and marshy wetlands. Nose Creek and the surrounding wetlands were identified as a wetland complex. In addition the size of the contiguous patch of semi-natural grassland is sufficient to be considered both a meso-carnivore and small mammal stepping stone. The GIS-derived ecological inventory within the bounds of this ecological hotspot is as follows: Natural/Semi-Natural Grassland Riparian Corridor Small Mammal Stepping Stone Meso-Carnivore Stepping Stone Wetland Complex Marsh Wetland Steep Slopes Floodway Flood Fringe There are nine ecologically significant features within the bounds of the hotspot boundary (Figure 15). The non-weighted and weighted overall site ecological significance values are 4.4 and 7.23 respectively. The highest ecological significance values occur in the floodplain of Nose Creek in the southern half of the site. Non-weighted and weighted maximum values in this location are 7 and 14 respectively. A field survey of this site was not able to be completed at the time of writing. Due to the high GISderived value of this area, a detailed field study is recommended Southwest Site Site H (Twp26-Rge01-Sec25 NW, SW and Sec26 NE, SE) This 57 hectare ecological hotspot is spread across four quarter sections. Initial GIS analysis identified this site due to a collection of marshy wetland features, the largest of which run north to south and are divided by Range Road 11. GIS analysis also picked up the relatively large contiguous patch of seminatural grassland as a potential meso-carnivore and small mammal stepping stone. The GIS-derived ecological inventory within the bounds of this ecological hotspot is as follows: Natural/Semi-Natural Grassland Small Mammal Stepping Stone Meso-Carnivore Stepping Stone Wetland Complex Marsh Wetland Trees and Shrubs O2 Planning + Design Inc. 36
45 Steep Slopes There are seven ecologically significant features within the hotspot boundary (Figure 15). The nonweighted and weighted overall site ecological significance values are 3.66 and 6.0 respectively. The highest ecological significance values occur in the areas of marshy flat land each side of Range Road 11. Non-weighted and weighted maximum values in this location are 6 and 9 respectively. Cursory field observations were made from vehicle transects of Range Road 11. Vehicle observations confirmed large areas of semi-natural grassland each side of the highway. The marshy wetlands identified in GIS data were not readily apparent as anything more than very flat areas of grass and scrubland. A small open water area was visible in the northeast part of Section 34 SE. This appeared to be a man-made dugout. Field survey to determine the state of the mapped wetlands is recommended. A known wetland was picked up in the GIS ecological inventory (Figure 15) but scored below average in the GIS analysis. Due to the known significance of the feature its boundaries were added as an element to the hotspot boundaries for SW Site H. O2 Planning + Design Inc. 37

46 Figure 15 - Ecological Inventory Map. Southwest Site G and H O2 Planning + Design Inc. 38
47 Southwest Site Site L This site was detected in the GIS analysis due to the presence of a stream corridor, steep slopes and large contiguous patches of semi-natural grassland concentrated in a relatively small area. This 94 hectare site also meets the criteria to be considered as both a meso-carnivore and small mammal stepping stone. This site is divided into two distinct areas by Range Road 12 although a culvert maintains connectivity along the creek between the two parts. This natural feature cluster is spread across 8 quarter sections, 3 of which are within City limits. The GIS-derived ecological inventory within the bounds of this ecological hotspot is as follows: Natural/Semi-Natural Grassland Riparian Corridor Small Mammal Stepping Stone Meso-Carnivore Stepping Stone Open Water Wetland Marsh Wetland Trees and Shrubs Steep Slopes There are eight ecologically significant features within the site boundary (Figure 16). The non- weighted and weighted overall site ecological significance values are 3.27 and 4.6 respectively. The non-weighted and weighted maximum ecological significance values (5.0, 7.0) occur in the grassy riparian corridor of the creek. Field visits were performed to assess this site. On the east side of Range Road 12 landowner authorization was limited to Twp26-Rge01 Sec 35 SE and SW. This site visit confirmed a patch of Aspen woodland that appeared to be a remnant of a larger natural stand. The creek that traverses the site was narrow, intermittent and slow moving. Grassland along the creek corridor was dense and waist high in places. It was a mixture of several non-native species. The eastern edge of the site is bounded by the edge of a large construction area associated with the Mattamy development. The boundary coincided with the top of slope on the east side of the creek. The creek flows through a wide grassy area in section 35 SE. None of the grassland in this area showed any evidence of cattle grazing. No native species were observed. West of Range Road 12 the site exhibited similar characteristics, namely a small creek flowing through semi-natural grassland. Topography on this side of the road was much more pronounced with several steep slopes exceeding 15%. There was no evidence of cattle grazing in this location, although the landowner had a number of horses which had free range of the property. Marshy wetland features in the GIS data were not readily apparent in the field visits by anything more than patterns resulting from differences in vegetation. There was only one small patch of naturally occurring woodland in this part of the site. Despite its small size it was dense and appeared to be largely undisturbed. O2 Planning + Design Inc. 39

48 Figure 16 - Ecological Inventory Map. Southwest Site L O2 Planning + Design Inc. 40
49 Southwest Site Site M (Twp27-Rge01-Sec03 SW and SE) This location scored above average in GIS analysis due to the occurrence of large patches of seminatural grassland, a riparian corridor and steep slopes (Figure 17). Located along the northern edge of Township Road 270, western portions of this 21 hectare site had non-weighted and weighted overall site ecological significance values are 3.43 and 5.18 respectively. Non-weighted and weighted maximum scores of 4 and 7 occurred along the steep banks of the creek. The GIS-derived ecological inventory within the bounds of this ecological hotspot is as follows: Natural / Semi-Natural Grassland Riparian Corridor Small Mammal Stepping Stone Meso Carnivore Stepping Stone Steep Slopes Field visits to Section 3 SE confirmed the existence of a small slow flowing boggy creek surrounded by sleep slopes. Many of these slopes showed evidence of erosion and slumping. The grassland had clear evidence of heavy cattle grazing and cattle footprints were also apparent in the marshy areas along the creek. Grassland was a mix of non-native species. Although the steep slopes along the creek were prone to erosion they were relatively small in terms of overall height. O2 Planning + Design Inc. 41

50 Figure 17 - Ecological Inventory Map. Southwest Site M O2 Planning + Design Inc. 42
51 4.3.5 Ecological Hotspots Northwest Northwest Site N and Site O (Twp27-Rge01-Sec 15 SW and SE, Sec 10 NE) & (Twp27-Rge01-Sec9 NE) GIS analysis identified this feature running through three quarter sections (Site N) and the northwest corner of neighbouring quarter section 9 NE (Site O). Steep slopes located along a riparian corridor resulted in non-weighted and weighted overall site ecological significance values are 2.3 and 4.7 respectively. The highest ecological significance values (non-weighted and weighted) were 4 and 8. The weighted GIS analysis produced a larger and more contiguous hotspot due to more features scoring above average (Figure 18). Site N is cut into two parts by Highway 567. Although both parts were characterized by steep sloped riparian corridors and semi-natural grassland vegetation, the part north of the highway was deemed to be of lower quality due to extensive cattle grazing. The GIS-based ecological inventory for Site N is as follows: Natural / Semi-Natural Grassland Riparian Corridor Steep Slopes Marsh Wetlands Trees and Shrubs Field visits to the southern part of Site N (Section 10NE) confirmed a riparian corridor with high steep slopes and marshy vegetation. The southwest slopes contained rural residential development. The northeast slopes were semi-natural grassland. Although the slopes were steep and high there was no evidence of erosion or slumping. Some north facing slopes contained clusters of shrubs and small trees. Deer were observed in this area. The southern part of the site is cut off from the northern half by the highway. A culvert allows drainage between the two parts. The northern part of the site (Section 15 SW and SE) had evidence of heavy cattle grazing so the grassland areas were of lower quality. Two wetlands were observed in Section SE. Although identified as marsh in the GIS data, open water was observed in both during the field visit. Heavy cattle traffic was clearly evident by broken up ground and exposed soil near the creek and the wetlands. Site O is a small section of riparian corridor what runs through a quarter section of land recently been acquired by the City of Airdrie (Twp27-Rge01-Sec09NE). The extreme north west of this quarter section is traversed by an identified ecological hotspot. The GIS-based ecological inventory for Site O is as follows: Natural / Semi-Natural Grassland Riparian Corridor Steep Slopes Trees and Shrubs Field confirmation in this area showed the same narrow slow moving creek surrounded by steep grassy slopes. Slopes did not appear to be as high as further downstream. There also did not appear to be evidence of major cattle activity. The non-weighted and weighted overall site ecological significance values are 1.78 and 3.67 respectively. The non-weighted and weighted maximum scores were 2 and 5. O2 Planning + Design Inc. 43

52 Figure 18 - Ecological Inventory Map. Northwest Sites O and N O2 Planning + Design Inc. 44
53 Northwest Site Site P (Twp27-Rge01-Sec 14 NE and SE) This site is located in two quarter sections, one within Airdrie City limits and one in Rocky View County (Figure 19). GIS analysis picked up a cluster of ecological features in the Nose Creek floodplain and riparian corridor and in a large area of open grassland in Section 14 SE. Both the narrow riparian corridor and broad grassland area were identified as potential meso-carnivore and small mammal stepping stones. Section 14 SE also marks the northern end of a linear wetland complex feature that follows Nose Creek to the south. The GIS-based ecological inventory for this location is as follows: Small Mammal Stepping Stone Meso Carnivore Stepping Stone Wetland Complex Riparian Corridor Floodway Flood Fringe Trees and Shrubs The non-weighted and weighted overall site ecological significance values are 3.25 and 6.7 respectively. Maximum ecological scores occur in the oval shaped grassland area in Section 14 SE. The nonweighted and weighted maximum scores are 6 and 12 respectively, the second highest of all identified hotspots. Field visits to this site showed extensive development activity on all sides. The floodplain of Nose Creek remained as open space as directed in the Airdrie City Plan. There were extensive areas of exposed ground and retention ponds in the areas under construction. Although the floodplain areas are protected from development, a more extensive search for and study of native plant species may be warranted. O2 Planning + Design Inc. 45

54 Figure 19 - Ecological Inventory Map. Northwest Site P O2 Planning + Design Inc. 46
55 Northwest Site Q An evaluation of this site was requested due to its inner city location along Nose Creek. Currently the land within the site is open mixed grassland, but development is occurring on all sides. This site is of interest for integration into the existing Nose Creek park system. GIS analysis picked up a cluster of ecological features in a 16 hectare area along Nose Creek. The inventory of features is as follows: Wetland Complex Riparian Corridor Nose Creek Floodway Nose Creek Flood fringe Despite its small size, this hotspot ranks high when the weighting factors applied to the Nose Creek floodway area factored in. The non-weighted and weighted overall site ecological significance values are 2.41 and 5.54 respectively. The non-weighted and weighted maximum values are 4 and 10 respectively. O2 Planning + Design Inc. 47

56 Figure 20 - Ecological Inventory Map. Northwest Site Q O2 Planning + Design Inc. 48
57 4.4 Ranking of Ecological Hotspots The calculated values of above-average ecological significance were used as the initial basis for ranking the 12 sites areas. Subsequent ranking exercises also considered connections to existing open space and immediate development threats Key Ranking Criteria Key Ranking criteria for the hotspots are listed below: Number of ecologically significant features within hotspot Average ecological significance value within hotspot Maximum ecological significance value within hotspot Weighted average ecological significance value within hotspot Weighted maximum ecological significance value within hotspot Non-Weighted Hotspot area (ha.) Weighted Hotspot area (ha.) Each site was assigned a value from 1 to 12 for each criterion based on the number of inventory features, hotspot size, average and maximum ecological significance values. Average ranking scores for all input criteria were calculated and these average scores were assigned a value of 1 to 12 with the highest average overall rank value scoring 1. This ranking exercise was performed on both the non-weighted and weighted analysis statistics. Site ranking based on the key criteria are listed in Table 6. Table 6 - Ecological Hotspot Ranking - Key Criteria GIS Hotspot Ranking (Non -Weighted Stats) NE Site A 6 10 NE Site B 9 11 East Site C 5 2 SE Site D 8 9 SW Site G 1 1 SW Site H 3 4 SW Site L 3 5 SW Site M 7 8 NW Site N 10 8 NW Site O NW Site P 4 3 NW Site Q 11 6 Ranking (Weighted Stats) Ranking results for weighted and non-weighted analysis show SW Site G as the top ranked site. This is a reflection of its relatively large size and diversity of floodplain ecological features (Figure 15 shows the ecological inventory and ecological significance scores for this site. Section 4.3 contains a detailed description and maps of this and all other ranked sites.) O2 Planning + Design Inc. 49
58 Non-weighted analysis results (Figure 21) show that SW Sites H and L score joint 3 rd due to their large size and, in the case of Site L, the presence of a long riparian corridor running through the entire site. The weighted analysis (Figure 22) identifies East Site C and NW Site P in 2 nd and 3 rd place respectively. This reflects the additional weight that this method assigns to wetland and floodplain areas. There are differences in the ranking results produced by each method. Because the non-weighted method considers all ecological features to be equal in importance, the overall size of the hotspot and the number of individual features within it become a major influence on rank. The weighted method assigns extra value for specific ecological features (Table 4 outlines the weighting parameters assigned). The weighting effect skews average rank in the favour of areas with a number of higher ranking features. The total area of the hotspot and the number of individual ecological elements is less important than the presence of high value features such as open water wetlands, floodplains and riparian corridors. Based on specific policies and best practices which specifically stress the importance of these features, the weighted ranking results are considered more representative of the true value of the ecological infrastructure than the non-weighted ranking results. O2 Planning + Design Inc. 50
59 Figure 21 - Ecological Hotspot Ranking (Non-Weighted Analysis) O2 Planning + Design Inc. 51
60 Figure 22 - Ecological Hotspot Ranking (Weighted Analysis) O2 Planning + Design Inc. 52
61 4.4.2 Additional Ranking Criteria Two additional criteria were factored into the ranking. The first was the proximity of identified hotspots boundaries to existing open space and trail network. The second was the proximity of hotspots to areas cleared for construction as identified in the generalized LULC. The latter is an indicator of the threat level of future development to these hotspots. Hotspots with boundaries that currently touch the edge of cleared and graded land have the highest exposure to future growth Proximity to Existing Open Space ArcGIS was used to identify spatial interaction of hotspot boundaries with existing open space. GIS data for parks, open space and green space was combined into a single layer. A spatial location selection was performed between this layer and both weighted and non- weighted hotspot boundaries. A buffer of 10m was applied to the spatial selection to account for hotspots that were separated from existing parks and open space by a typical road width. Green areas bisected by 10m roads can still be considered connected in the context of a larger linear recreational open space network. The spatial selection identified four sites with edges 10m or less from an existing open space element. Because the shape and size of hotspot boundaries are slightly different depending on whether they represent weighted or non-weighted analysis, some selected sites differed between the two. Sites within 10m of existing open space that were common to both weighted and non-weighted boundaries were SW Site G, SW Site L, NW Site P and NW Site Q. In addition the weighted hotspot boundaries of East Site C and NW Site N were also within 10m of existing open space. Hotspots that were identified as connected to open existing space were assigned an extra point in a new open space ranking category. This point was then considered in the overall average ranking. These results do not imply that the entire area within the hotspot boundaries should be designated as open space. It merely recognizes and acknowledges the recreational potential of active connections to ecologically significant by the existing network of parks, trails, green corridors and recreational areas Proximity to Land Cleared for New Development ArcGIS was used to identify ecological hotspots in close proximity to areas cleared in preparation for development. These areas are used as an indicator of the immediacy of development threats to the identified hotspots. Cleared areas represent the outer edge of development and indicate the general direction in which similar development will spread in the future. A spatial selection was performed between the ecological hotspot boundaries and Class 103 (land cleared for development) from the GIS-based LULC layer. The selection was set to identify hotspot boundaries that intersected the boundary of cleared land. Using both weighted and non-weighted boundaries, five ecological hotspots were identified as being in under threat from development. East Site C, SW Site G, SW Site L, NW Site P and NW Site Q. Hotspots that were identified as under development threat were assigned an extra point in a new development threat ranking category. This extra point, and any extra points assigned due to open space proximity were then considered in calculation of overall rank. These results do not suggest that the entire hotspot is at immediate risk from development. It is the edge of identified hotspots adjacent to land cleared for future construction that is clearly at the most immediate risk. However, opportunities to secure linear recreational corridors could be jeopardized by not recognizing and securing key areas within all of these affected hotspots at the earliest opportunity. O2 Planning + Design Inc. 53
62 4.4.3 Final Ranking Scheme We concluded that the best ranking method for the 12 identified ecological hotspots should consider not only the ecological statistics, but also proximity to existing open space and immediate development threats. Accounting for connections to existing open space networks recognizes that parts of the ecological hotspot have potential to be integrated into the open space plans of future Community Area Structure Plans and Neighbourhood Plans. Accounting for the proximity to land cleared for development adds a temporal domain to the otherwise spatial analysis. It flags ecological hotspots that are on the front line of future development and increases their rank accordingly. Table 7 shows the non-weighted ecological hotspot ranking before and after proximity to open space and cleared development land are accounted for. In this scenario all ecological features are considered to be of equal importance, but points are added if the corresponding hotspots are connected to open space or threatened by future development. Numbers in parenthesis show the change in average rank resulting from the consideration of spatial connectivity to open land or cleared sites. Because connectivity to parks and cleared land are just two of several ranking criteria, their presence will not necessarily affect the overall average rank of a particular site. Table 7 - Non-Weighted Ecological Ranking Effects of Proximity to Existing Open Space and Development Threats GIS Hotspot Original Ranking Score (Derived from Non- Weighted Statistical Analysis) New Ranking Score and Change due to Proximity to Open Space and Cleared Land Open Space Connections and Development Threats NE Site A 6 6 None NE Site B 9 10 None East Site C 5 5 Cleared Land SE Site D 8 8 None SW Site G 1 1 Open Space and Cleared Land SW Site H 3 4 None SW Site L 3 2 (Increased in Rank by 1) Open Space and Cleared Land SW Site M 7 7 None NW Site N None NW Site O None NW Site P 4 3 (Increased in Rank by 1) Open Space and Cleared Land NW Site Q 11 9 (Increased in Rank by 2) Open Space and Cleared Southwest Site L moves from 3 rd to 2 nd place due to a connection to the existing open space network and the presence of development threats. Northwest Site P moves from 4 th to 3 rd place due to the same connections. NW Site Q moves from 11 th to 9 th place due to the presence of open space connections and the existence of development threats. East Site C has a boundary affected by future development but this does not sufficiently outweigh the other ranking criteria to affect a change in average rank. Table 8 shows the weighted ecological hotspot ranking before and after proximity to open space and cleared development land are accounted for. Numbers in parenthesis show the change in average rank resulting from the consideration of spatial connectivity to open land or cleared sites. O2 Planning + Design Inc. 54
63 Table 8 - Weighted Ecological Ranking Effects of Proximity to Existing Open Space and Development Threats GIS Hotspot Original Ranking Score (Derived from Weighted Statistical Analysis) New Ranking Score and Change due to Proximity to Open Space and Cleared Land Open Space Connections and Development Threats NE Site A None NE Site B None East Site C 2 2 Open Space and Cleared Land SE Site D 9 9 None SW Site G 1 1 Open Space and Cleared Land SW Site H 4 6 None SW Site L 5 4 (Increased in Rank by 1) Open Space and Cleared Land SW Site M 8 8 None NW Site N 8 7 (Increased in Rank by 1) Open Space NW Site O None NW Site P 3 3 Open Space and Cleared Land NW Site Q 6 5 (Increased in Rank by 1) Open Space and Cleared Land The top ranked sites in the weighted ecological analysis are less affected by the proximity of parks and development threats. The top 3 sites maintain their previous rank. SW Site L moves from 5 th to 4 th place due to proximity to both parks and development threats. Lower ranked sites NW Site Q and NW Site N also increase rank by 1 point due to the same proximity Recommendations Based on the results in Table 7 and Table 8, protecting specific areas within SW Site G, SW Site L, East Site C and NW Site P should be a priority. Doing so will achieve the dual goals of preserving existing ecological infrastructure while offering opportunities to expand existing parks and open space. Figure 23 illustrates the results of the new ranking from Table 7 with a numerical and colour coded ranking. It is clear that applying best practices within the top 3 ranked sites (SW Site G, SW Site L and NW Site P) will result in the mitigation of the negative effects of development in riparian areas, while expanding open space, particularly linear open space, out to future communities in a radial pattern. Strategic planning for the 4 th and 5 th ranked hotspots in Figure 23 should also be considered. Figure 24 shows the new site rankings from Table 8. The 1 st and 3 rd ranked sites are the same as in Figure 23. The 2 nd ranked site is East Site C in this scenario. This reflects the strong bias of the weighted ranking method towards wetlands. The 4 th ranked site (SW Site L) still corresponds to the 3 rd ranked site in the non-weighted analysis. Based on these results, applying best practices to maximize protection in the top four ranked sites would serve dual purposes of preserving existing ecological infrastructure while providing opportunities to expand radially the network of open space. While efforts should be made to preserve existing ecological inventory in all 12 identified sites, prioritizing efforts in SW Site G, SW Site L, NW Site P and East Site C will have the greatest benefit in the short term due to the high ecological value of these sites and the connections they share with the existing open space network. Furthermore, these four sites are located on the front line of development pressure. Land cleared for future development either intersect the boundaries of all these sites, indicating an invasive trend of development pressure radiating outwards into these ecologically sensitive areas. O2 Planning + Design Inc. 55
64 Figure 23 - Comprehensive Ecological Hotspot Ranking (Non-Weighted) O2 Planning + Design Inc. 56
 O2 Planning + Design Inc.")
65 Figure 24 - Comprehensive Ecological Hotspot Ranking (Weighted) O2 Planning + Design Inc. 57
66 5. REVIEW OF ENVIRONMENTAL POLICIES AND RECOMMENDED BEST PRACTICES IN OTHER JURISDICTIONS 5.1 Introduction The degree to which the importance of ecologically sensitive areas is valued by municipalities is reflected in the management policies in place to protect them. Municipalities have in place varying policies and regulations for the management of ecologically significant areas. Some of these policies may specify minimal requirements to reduce development impacts, while others may reflect an in-depth understanding of the importance of natural features and the interactions between them. Before exploring management practices utilized by municipalities, it is worthwhile to summarize why the protection of natural features and the interactions between them is so important. The concept of ecological infrastructure is useful in this regard. The ecological infrastructure is a collection of natural features such as stream corridors, ridges and wetlands. While important in their own right, the interactions and linkages between them provide functions and services of greater value. In this section an overview of the concepts of ecological infrastructure and green networks are provided and the key components of these networks are identified. While it is not in the scope of this study to model the level of ecological services provided by identified ecological inventory hotspots, an understanding of the linkages between ecological inventory elements helps inform the ranking process and underscore the importance of best management practices to protect such areas. Ecological infrastructure or green networks refer to a network of well-vegetated and well connected lands and wetlands that operate both within urban centres and rural areas. They differ from simple open space because they are multi-functional and provide essential ecological services such as clean water, clean air, wildlife habitat and recreation (O2 Planning + Design Inc., 2008). Examples of ecological services provided by ecological infrastructure include: Protecting and recharging water supplies Managing peak flows and providing flood control Filtering and conveying storm water runoff Fostering and protecting biodiversity Allowing species movement through the landscape Recycling of nutrients Removing / absorbing particulate pollution and other gaseous pollutants from the air. Sequestering and storing atmospheric CO2 Moderating the heat island effect of urban areas Municipalities are increasingly recognizing the importance of integrating the ecological infrastructure into the urban infrastructure. This is reflected in the environmental policy provisions of their Municipal Development Plans and in wider regional plans. The following sections provide an overview of some of the environmental policies and best practices in place as part of the Calgary Metropolitan Plan and also by the cities of Calgary, Edmonton and Red Deer. 5.2 Calgary Metropolitan Plan The Calgary Metropolitan Plan (CMP) sets out broad policies and best practices for the management of environmentally sensitive areas. Member municipalities are encouraged to adopt these best practices in O2 Planning + Design Inc. 58
67 areas not subject to existing municipal policies. The Draft CMP outlined several general environmental goals and best practices. The final plan was adopted in June, Ecological Infrastructure CMP and member municipalities acknowledge the effect that population growth and development pressures have on the environment and will endeavor to align and coordinate local, regional and intermunicipal plans to protect the region s identified ecological infrastructure. Landscape Connectivity Wherever possible, member municipalities should work together to maintain or enhance landscape connectivity across the region to ensure the health and integrity of the ecological system. Riparian Areas As a region, member municipalities must protect and enhance the ecological functioning of riparian areas. Watershed Protection CMP will identify and pursue options and opportunities to support member municipalities in their efforts to actively protect critical watershed areas for the benefit of the region. Ecosystem Diversity CMP and member municipalities will strive to maintain the diversity of species and ecosystem types in the region. Five major regional ecological infrastructure elements were referenced in the draft Calgary Metropolitan Plan (CMP). Wetlands Riparian Buffers Regional Corridors Large Patches of Natural Vegetation Ridges and Escarpments In the greater Calgary region some lands containing these elements are protected by existing parks and the provincial green zone. In the study area for this project, most of these features are in private stewardship Wetlands Wetlands and their buffer areas serve multiple ecological functions. They serve as a connection between surface and ground water, slow soil erosion, re-charge aquifers and help control floodwaters. Wetlands provide productive habitat for both local and migratory bird species. Of particular importance are clusters of multiple wetlands known as wetland complexes. These areas have high biodiversity and provide functions similar to that of large patches of natural vegetation. The CMP recognizes the vital role of wetlands and has stressed that a no net loss of wetlands policy be adopted by its member municipalities. This approach aims to plan development that avoids, minimizes and mitigates impacts to wetlands. Recommended actions include the provision of permanent vegetation in buffer areas. Natural vegetation buffers are preferable and the width of the buffer is dependent on the type of wetland, the sensitivity of the landscape and the local conditions of the site. O2 Planning + Design Inc. 59
68 5.2.2 Riparian Buffers Riparian buffers are the vegetated areas adjacent to rivers and streams. The benefits they provide are similar to wetlands. Riparian buffers maintain water quality by filtering out dissolved substances. Riparian buffers also have runoff control functions and as such are important in flood control. Because of their linear nature riparian corridors provide effective corridors to facilitate wildlife movement. Similar to wetlands, the CMP recommends that riparian areas be protected with a buffer of natural vegetation. Member municipalities are encouraged to establish buffers as wide as possible and discourage development within those buffered areas. Ideally riparian buffers should include the floodplain, valley slopes and some adjacent dry upland areas (O2 Planning and Design, 2008) Regional Corridors Regional corridors follow major river and stream valleys, often including areas with sensitive alluvial soils. Major river and stream courses have important influences on water quality and also form a broad network of connectivity for many species of wildlife. Cottonwood forests thrive in regional corridors and provide unique habitat for a range of plant and animal species. Because large sections of regional corridors are located in privately owned land, landowner support is needed to encourage preservation of these features and provide education about the importance of maintaining connections across multiple land uses at the regional scale. CMP policy encourages municipalities to protect and restore regional corridors and discourage building development in such areas due to the vulnerability of alluvial soils to contamination. As with riparian corridors, the width of regional corridors depends on local topography and vegetation. Minimum recommended protection widths should include the floodplain, valley sides and upland areas Large Natural Vegetation Patches Large patches of natural vegetation provide important habitat and biodiversity functions in areas outside of riparian and regional corridors. Species which avoid human disturbance are dependent on these large patches. Fragmentation of large patches by roads and other development reduces habitat and impedes movement of wildlife populations across the landscape. Fragmentation of large patches increases the proportion of edge habitat relative to interior habitat. Interior habitat tends to support rare species that are often of conservation importance. Different species have different natural patch size tolerances based on the size of their home range. The CMP encourages all municipalities to work together to protect patches of natural vegetation over 1000 hectares in size. Development should be avoided in these areas but if this is not possible the following approaches should be considered: Develop on the outer boundary of the patch. This preserves the ratio of edge to interior habitat. Cluster development to limit disturbances to smaller contained areas rather than dispersing it through the patch. Re-vegetate disturbed areas with native species to limit the spread of invasive species Build roads and linear disturbances on the edge of the patch rather than through it Ridges and Escarpments Ridges are similar to stream corridors in that they are continuous linear landscape features that provide natural corridors for wildlife movement and landscape connectivity. In addition they are areas of high scenic value. O2 Planning + Design Inc. 60
69 The CMP recommends the protection of ridge tops and escarpments for reasons of public safety, erosion control, protection of scenic quality and wildlife movement. 5.3 City of Calgary The City of Calgary's Environmental Policy was originally approved in 1992, and was amended and updated again in 2001 and The 2007 revision was titled "The City of Calgary's Environmental Action Plan"(City of Calgary, 2007a). Its recommendations are broad and most of the detailed policies which influence specific development policies near ecologically sensitive areas are outlined in City bylaws. The City of Calgary's Environmental Action Plan (EAP) focuses on five theme areas: Water Air Land Materials and Waste Management Community Sustainability Each theme area outlines goals, targets, policies, and activities for ensuring that the City of Calgary continues to grow in a sustainable manner. Of most relevance to this study are the first three areas: water, air and land Water The City of Calgary s environmental policy theme for water is focused on the protection of water resources. This recognizes the necessity of clean water for human health and the health of ecosystems. The City of Calgary has a commitment to protecting the safety and long-term sustainability of its water supply while showing environmental leadership in its water conservation programs. Specific goals include: Conserve water. Reduce per capita water demand to 350 litres per day by All residential units metered by Keep peak demand to less than 1,000 mega-litres per day to Reduce water losses from City operations and distribution systems. Ensure and protect water quality. Provide safe, reliable quality drinking water that meets or exceeds standards established by Health Canada and the Government of Alberta. Meet effluent standards established by the Government of Alberta. Keep Total Suspended Solids (TSS) loading at or below the 2005 level. Maintain dissolved oxygen in the Bow River at the level required by fish life. Protect regional watersheds. The City s guiding policy on water management contains some specifics on ongoing and new activities that illustrate best practices management near ecologically sensitive areas. The Council has initiated O2 Planning + Design Inc. 61
70 retrofits to existing stormwater systems including the evaluation of source control retrofit opportunities and Alberta Low Impact Development Retrofit pilot projects. City Council also supports ongoing research and partnership projects relating to green roofs, water reuse and bio-retention, erosion and sediment control training and enforcement and the promotion of Alberta Low Impact Development Partnership practices. In terms of regional water management, the City of Calgary is a member of several multi-stakeholder watershed protection partnerships including the Bow River Basin Council, Elbow River Watershed Partnership and Nose Creek Watershed Partnership. Consistent with the Calgary Metropolitan Plan, the City s Wetlands Conservation Plan calls for no net loss of significant wetlands. Ongoing efforts under this plan call for wetlands to be considered during the development process and the mitigation of the loss of wetland function. Where possible, the policy recommends integrating wetlands into the City s open space system and the acquisition of wetlands through Environmental Reserve dedication and other means. In May 2007, City Council approved an Environmental Reserve Setback policy to protect streams, rivers and wetlands from pollution (City of Calgary, 2007b). The policy requires variable setback widths for development to be applied to water bodies qualifying as environmental reserve. The new policy replaces previous practice of providing a minimum six metre buffer width adjacent to water bodies. The new policy provides for setback widths from six to fifty metres based on water body type, local conditions and current best practices recommendations relating to watershed protection (City of Calgary, 2007b) Air Reduce greenhouse gas emissions and energy use. Reduce City of Calgary corporate greenhouse gas emissions to 50 per cent below the 1990 level by Protect and improve air quality. Meet federal and provincial ambient air objectives for priority air contaminants. Provide a level of transit service competitive with vehicle travel. Build and maintain a network of pathways and bikeways to provide a seamless recreation and transportation system for non-motorized modes Land Efficient use of land Increase intensification of land use. Provide mixed-use neighbourhoods. Support sustainable development and building practices. Rehabilitate contaminated land. Maintain and protect local ecosystems. Ensure no net loss of significant wetlands. Plant one tree for every two citizens. Maintain the integrity of a high-quality and diverse park and open space system. O2 Planning + Design Inc. 62
71 In terms of land management, the City of Calgary s Environmental Action Plan calls for increased density and infill development to reduce the impacts of urban sprawl on surrounding land. These initiatives are guided by Calgary s Municipal Development Plan (The Calgary Plan) which specifies new residential development densities at a minimum of seven units per acre and intensification through infill development. The Environmental Development Review Policy is an ongoing strategy that seeks to ensure all land-use development applications consider environmental conditions and determine the environmental suitability of intended uses as part of the planning approval process. Currently in development is the City of Trees Urban Forest Strategic Plan whose goal is to continue partnerships with local organizations to plant trees on public land and grow the urban forest by one percent per decade to a 20 percent city-wide canopy cover. City Council environmental priorities include an ongoing commitment to restore and repair riparian environments through tree planting. The City of Calgary makes its Environmental Policy accountable through use of the EnviroSystem (an ISO registered Environmental Management System) to manage environmental risks and ensure that environmental considerations are integrated into corporate policy development and decision making. EnviroSystem is also used to regularly audit and evaluate regulatory compliance through annual reports to the council, administration and the public (City of Calgary, 2007b). 5.4 City of Edmonton The latest Municipal Development Plan (MDP) for the City of Edmonton was adopted in October of 2008 and Section 6.0 outlines the policies concerning the natural environment (City of Edmonton, 2008). As stated in the MDP, the City of Edmonton's goal statement for natural environment is: "Edmonton protects, preserves and enhances its natural environment by maintaining the integrity and interconnectivity of its natural areas, river valley, water resources, parks and open spaces, recognizing that these elements for a functioning ecological network within the Capital Region." Edmonton s natural environment policy recognizes the importance of ecologically sensitive areas as a whole, rather than a series of separate elements. It also acknowledges the risks presented by development to such areas. The City s natural environment policy focuses on six key areas: Natural Areas Wetlands North Saskatchewan River Valley and Ravine System Parks and Open Space Water Air In each case, broad objectives are stated and are supported by a list of policies in place to support that objective Natural Areas The City s policy objectives for natural areas are as follows: Protect, preserve, and enhance a system of conserved natural areas within a functioning and interconnected ecological network. O2 Planning + Design Inc. 63
72 Restore ecologically degraded and or damaged ecological systems and linkages to protect, expand and enhance biodiversity. Examples of policies to support these objectives include the following: Acquire and manage the most ecologically sensitive areas in Edmonton. Determine appropriate buffer areas around the periphery of natural areas identified for protection. Acquire critical natural linkages and buffer zones to ensure natural areas of ecological value remain sustainable within an urban context. Work with the Capital Region Board and adjacent municipalities to acquire, protect and restore natural systems and linkages, recognizing that Edmonton s ecological network is part of a larger regional network. Require new developments adjacent to natural areas to demonstrate that they have incorporated ecological design best practices to mitigate negative consequences. Lands and features that meet the definition of environmental reserve, but are not claimed by the Province should be taken by the City as environmental reserve and protected Wetlands Edmonton s policy objective for wetlands is as follows: Protect, manage and integrate natural wetlands into new and existing developments as key assets in Edmonton's ecological network. In addition to all natural area policies, specific wetland policies to support this objective include the following: Cooperate with the Government of Alberta to actively support and complement its wetland policy through the following actions: In partnership with the Province, the Capital Region Board and adjacent municipalities, develop a comprehensive plan for wetland conservation and the integration of wetlands into the urban environment. Where appropriate, acquire wetlands, riparian areas and buffers according to the Municipal Government Act definition of Environmental Reserve. Work with land owners to see that compensation required by the Province as a result of the alteration or destruction of wetlands is carried out within City boundaries North Saskatchewan River Valley and Ravine System The City of Edmonton s policy objectives for river valley and ravines are as follows: Protect, preserve and enhance the North Saskatchewan River Valley and Ravine System as Edmonton's greatest natural asset. Protect, preserve, promote and improve the North Saskatchewan River Valley and Ravine System as an accessible year round place for recreation and activity for people of all ages. Mitigate the impact of development upon the natural functions and character of the North Saskatchewan River Valley and Ravine System. Policies to support these objectives include the following: O2 Planning + Design Inc. 64
73 The City will work in partnership with local, regional and provincial organizations to conserve, protect, restore and enhance the North Saskatchewan River Valley and Ravine System for its ecological, recreational, aesthetic, educational and natural resource value. Ensure that the North Saskatchewan River Valley and Ravine System remains integrated and connected with other natural areas across the city Ensure that the North Saskatchewan River Valley and Ravine System remains primarily an area of unstructured, low intensity and passive recreation. Ensure that lands within the North Saskatchewan River Valley and Ravine System Area Redevelopment Plan boundary will be acquired for natural areas protection and parks purposes. Maintain adequate separation between new urban development and the North Saskatchewan River Valley and Ravine System through the City s Top of Bank Policy with viewscapes and public access to the River Valley preserved. Require development projects within the North Saskatchewan River Valley and Ravine System to undertake an Environmental Impact Assessment as specified in the North Saskatchewan River Valley Area Redevelopment Plan (Bylaw No. 7188) Parks and Open Space Edmonton s policy objectives with respect to parks and open space are as follows: Utilize parks and open spaces to complement and enhance biodiversity, linkages, habitat and the overall health of Edmonton's ecological network. Expand and enhance Edmonton's inventory of parks and open spaces for the ecological, health, recreation and educational benefits they provide. Specific policies to support these objectives include: Link parks and open spaces with natural systems through development and design to strengthen the connectivity of Edmonton s ecological network, where feasible. Maintain a healthy urban forest by continuing to invest in and expand the City s tree inventory, and adopt a no net loss approach to the replacement of public trees. Design parks and open spaces to include and maximize the use of ecological design bestpractices. Actively explore and seek out new ways of acquiring, funding and managing parks and open spaces Water The City s policy objectives for water are as follows: Mitigate impacts upon Edmonton s water resources by ensuring that new developments in Edmonton embody an exemplary standard of ecological design. Protect, maintain and continually enhance the water quality of the North Saskatchewan watershed. Water resources are conserved and used efficiently by the public, industry and the City of Edmonton. Policies to support these objectives include: O2 Planning + Design Inc. 65
74 Require new development to demonstrate that it has incorporated ecological design best practices into the design of neighbourhoods and buildings to reduce stormwater runoff. Work proactively with provincial, regional and municipal neighbours, citizens and non-profit groups, such as the River Valley Alliance, by participating in activities and supporting organizations that work to maintain the integrity of the North Saskatchewan watershed. Support the best management practices and principles of Edmonton s Stormwater Quality Control Strategy. Integrate indigenous vegetation, specifically low-maintenance drought tolerant species into City landscaping. Design, arrange and locate new infrastructure and buildings to mitigate impacts upon the water system Air Edmonton s policy objective for air is to monitor and improve air quality. Policies in place to support this objective include: Collaborate with other orders of government and stakeholders to protect air quality for future generations by supporting public transportation, car pooling, walking or cycling. Support a reduction in residential, industrial, institutional and commercial building emissions through the promotion of Leadership in Energy and Environmental Design. 5.5 City of Red Deer Red Deer s Municipal Development Plan contains goals and policies for environmental and ecological management. The environmental and ecological management goals of the Red Deer MDP are: To preserve and integrate significant natural areas into the open space system To foster the creation and maintenance of attractive, clean and ecologically responsible natural and built environments To recognize and promote environmental sustainability initiatives and trends in land development The City of Red Deer MDP contains a number of environmental and ecological management policies which, while broad in scope, do indicate some specific management practices. Many of the policies refer to the City s Natural Area / Ecospace Classification and Prioritization System as one of the key elements of City planning. This is a broad-based classification of natural areas into stream, treed, wetland and other natural features. Key environmental and ecological policies include: The City shall continue to use the Natural Area / Ecospace Classification and Prioritization System as one of the key elements in land use planning for Red Deer as it pertains to: Significant natural features decisions on how to treat these features shall be made in detailed plans, Working with Red Deer County, Lacombe County and other interested parties in creating and implementing a regional approach to the conservation of key natural areas and functions, Expanding the Natural Area / Ecospace Classification and Prioritization System to identify continuous wildlife corridors and key wildlife habitat and greenways in and around Red Deer that should be protected as growth and development occurs. O2 Planning + Design Inc. 66
75 The timing of conservation planning and efforts ensure that planning efforts to conserve natural features in and around Red Deer are initiated in advance of urban expansion or development of the surrounding lands. The City of Red Deer MDP does specify the requirement for environmental reserves and setbacks in areas unsuitable for development. However, the exact widths of such setbacks are not specified in the MDP. Red Deer has specific policies for the maintenance of green infrastructure, implementation of an ecological management system and urban forestry: The City should incorporate significant natural features as part of the overall infrastructure systems. This should include using existing wetlands as storm water management facilities and planning and preserving shrubs and trees to preserve air quality. The City shall develop and refine an ecological management system that is incorporated into a citywide geographic information system (GIS) to help plan for, manage and establish the values of natural capital features with a view towards: Providing an integrated and sustainable approach to manage ecological features in established and new growth areas Developing tools to better analyze information such as natural habitat features in areas of projected growth The City shall structure its urban forestry initiatives to ensure that it continues to play a significant role in the future landscape and form of the urban forest in new land developments. 5.6 Environmental Partnership Programs Many of the environmental policies adopted by municipalities are guided by their membership in various environmental partnership programs. It is from the diverse membership within these programs that best management practices are developed and refined Nose Creek Watershed Partnership The Nose Creek Watershed Partnership is a multi-stakeholder group whose stated goal is to protect the riparian areas and to help improve water quality in Nose Creek to its natural levels. The Partnership s strategies for achieving this goal include conducting water quantity and quality research, identifying contamination and initiating clean up and stewardship measures. Partnership members include Alberta Environment, City of Calgary, City of Airdrie, Rocky View County, Bow River Basin Council and others. One major goal of the Partnership is to address inconsistencies in the level of protection afforded to Nose Creek by the various municipalities through which it flows. Riparian setbacks range from 6m (Municipal Government Act), 15m (City of Airdrie Landuse Bylaw) to 30m for undeveloped land within Calgary (City of Calgary Landuse Bylaw). No riparian setback widths are currently specified in the Provincial Public Lands, Water or Environmental Protection and Enhancement Acts (The Nose Creek Watershed Partnership, 2008). The 2008 Nose Creek Watershed Water Management Plan outlines several objectives, recommendations and implementation strategies (Nose Creek Watershed Partnership, 2008): Water Conservation Objectives Integrated Stormwater Management Protection of Natural Features Riparian Protection O2 Planning + Design Inc. 67
76 Water Quality Protection Source Water Protection Mitigation, Compensation, Restoration Cumulative Effects Of these, the protection of riparian areas and natural features is of most relevance to this study. The study recommends specific best practices for the protection of natural hydrology, escarpments and wetlands. Of specific interest to the protection of hydrology and riparian corridors are the best practices recommendations for setbacks. The Nose Creek Watershed Water Management Plan proposes the following setbacks to mitigate the impacts of development: The riparian setback width should be determined on a site-specific basis based on the greatest of three criteria: the 1:100 year floodplain, the meander belt (20x the full bank width) and the width of escarpments (slopes >15%) that lie adjacent to the meander belt and/or floodplain. The setback should be applied to both perennial and intermittent streams. Within this defined setback zone, the Study recommends no further development or site alteration be allowed. Permitted uses within the zone include existing development, agriculture, recreational areas, natural areas and pathways. Public access within the riparian zone should be controlled so as to mitigate negative effects on riparian function. Specific recommendations include the use of pervious materials for pathways, confining pathways to areas above the 1:100 year floodplain; and limiting or avoiding bridges in active channel areas. The Study has specific recommendations to mitigate the effects of developments near steep slopes with considerations for their proximity to watercourses. The base recommendation is that all land with 15% or greater slopes should be designated as environmental reserve. This recommendation is consistent with MDP policies. When slopes form part of riparian corridors, the Study recommends the following best practices: Where land is situated adjacent to or includes the banks of any watercourse, including coulees, ravines, gullies, valleys and where the slope of the bank adjacent to any watercourse is in excess of 15%, buildings or other structures should not be permitted: 12m from the top of bank where the height of bank is less than 6m A distance equal to 2x height of bank from the top of bank where the height of bank is between 6m and 23m 46m from the top of bank where the height of bank is more than 23m The Nose Creek Watershed Water Management Plan offers specific setbacks for wetlands as a minimum of 30m. Best practice recommendations for vegetation and erosion control focus on minimizing the disturbance to existing vegetation and re-vegetating developed areas as soon as possible. This study recommends implementation of sediment and erosion control best practices according to the City of Calgary s Sediment and Erosion Control Manual. The Nose Creek Watershed Water Management Plan also offers recommendations on best practices for new developments to mitigate negative environmental effects. This study recommends that the following planning and design criteria be incorporated into new developments: Preserve existing topography and natural features Protect surface water and groundwater resources Adopt compact development forms Adopt alternative site development standards O2 Planning + Design Inc. 68
77 Re-Create natural habitats within development areas. One criticism of the environmental protection recommendations in these types of studies is that the increased slope, wetland and riparian setbacks reduce the area of developable land Nose Creek Watershed Partnership, 2007). In some cases the reduction may be sufficient to impinge upon the municipalities existing growth management goals. Some concern has been expressed that the reduction in developable land due to increased setbacks requirements may actually encourage urban sprawl. One way to address the apparent conflict between accommodating growth while increasing setback provisions is to use compact development forms. The Nose Creek Watershed Water Management Plan provides examples of compact neighbourhood designs such as clustered single dwellings, medium density townhouses, low rise and high rise apartments. These can compensate for the reduction in developable land due to recommended environmental best practice implementation because they allow the same population density while enabling the protection of natural features Bow River Basin Council The Bow River Basin Council (BRBC) is a multi-stakeholder, charitable organization dedicated to conducting activities for the improvement and protection of the waters of the Bow River Basin, considering riparian zones, aquatic ecosystems, water quality and quantity and the effects of land use on surface and groundwater. Many BRBC initiatives can be applied to other watersheds. Of specific interest are recommendations regarding subdivision development (Bow River Basin Council, 2002). The 2002 BRBC Report entitled Protecting Riparian Areas: Creative Approaches to Subdivision Development in the Bow River Basin provides applicable information on why protection of riparian areas is important, the benefits of such protection and more specifically, how the thoughtful design of subdivisions can be compatible with riparian area preservation. This report stresses the value of riparian areas, not just in ecological terms, but in terms of financial benefits to municipalities. Recognizing financial savings through the preservation of riparian zones is important as it places a tangible value on natural features that can be conveyed to municipalities and developers more easily than ecological values. Benefits to preserving natural riparian areas include the following (Bow River Basin Council, 2002): Lower development costs due to fewer disturbances Less infrastructure and associated maintenance Reduced need for herbicides through preservation of natural vegetation Appeal to homebuyers with concern for environment Buyers prepared to pay fair market value for land, will pay substantially more than for conventional lots Natural areas add visual diversity to a development Conservation agencies interested in riparian habitats may provide technical and financial assistance Riparian wooded areas may provide financial value through carbon dioxide emissions credits The BRBC Protecting Riparian Areas Report identifies best management practices for protecting riparian areas, that while not as specific as those outlined in the Nose Creek report, can be applied to mitigate development impacts in any riparian area: Endeavor to maintain a balance amongst all uses, while preserving the natural beauty and wildlife of the area O2 Planning + Design Inc. 69
78 Prevent / minimize soil erosion associated with land use activities Prevent disturbance (i.e. construction, cultivation, deepening, additional ponding etc.) within riparian area Retain slopes in their natural state. Construction and earth moving on slopes could result in landslides, mudflows and property damage. As a result, riparian areas in the proximity of slopes could be adversely affected Minimize the use of drainage channels for culverts because these destroy riparian habitat and streams. Even minor changes to wetland drainage will cause habitat loss The stormwater best management practices outlined by the Bow River Basin Council are based on Provincial recommendations that can be applied to developments in any watershed. The goal of stormwater management best practices is to retain as much of the natural runoff characteristics and infiltration components of the undeveloped system as possible and reduce or prevent water quality degradation (Alberta Environment, 1999). The most desirable stormwater management practice is the preservation of naturally vegetated streamside forests (Bow River Basin Council, 2002). The widest possible forested buffer is the preferred practice. The wider the buffer, the greater the opportunity for sediments and contaminants to be captured before entering the watercourse. The most effective buffer structure consists of three zones, streamside to top-of-bank, middle zone (inland from top-of-bank) and outer zone (between middle zone and the nearest permanent structure). The streamside buffers provide habitat, control erosion and provide noise and visual screening. The middle zone provides for groundwater recharge and pollutant capture. The outer zone absorbs runoff and captures sediment. Preserving natural shrubs and trees is the top priority for the streamside zone. The best practice for the middle zone is to designate its extent as the 1:100 year flood plain width plus any adjacent steep slopes (Bow River Basin Council, 2002). This is also consistent with best management practices recommended in the Nose Creek Watershed Water Management Plan Study. Also consistent with the Nose Creek study are recommended land uses for the outer zone. The BRBC report describes suitable land use in this zone as including open unpaved space, playing fields, gardens, playgrounds and other common activity areas. Other stormwater management best practices include the preservation of natural wetlands and the construction of artificial wetlands to manage overland runoff. The Bow River Basin Council report contains best management practices for the construction stage of new developments. The goal of these practices is to reduce erosion and control sediment discharge into streams and riparian zones. The key best management practice is to ensure that an erosion and sediment control plan is in place prior to the start of land clearing and development for a new subdivision. Components of this plan should include the following (Bow River Basin Council, 2002): Stockpiles should be located away from watercourses and environmentally sensitive areas Control on-site drainage through temporary storage facilities Use dust control measures such as water trucks, mulching or temporary vegetation Establish rainfall and water erosion controls using structural options such as sediment traps and basins, inlet filters, straw barriers, sand bags, terracing, paving, blankets and non-structural such as temporary and permanent seed planning, mulching, sod installation, netting, erosion control blankets and weed control. Upon completion of subdivision development there are a number of riparian management and protection best management practices that should be implemented. These include maintaining natural vegetation on stream banks or replanting with native shrubs and trees in areas that have been disturbed. Replanting with non-native species should be avoided. Other best management practices include using mulch to O2 Planning + Design Inc. 70
79 reduce water and maintenance needs, fencing off sensitive areas or areas being re-established and educating surrounding homeowners to respect and use riparian areas carefully (Bow River Basin Council, 2002) Alberta Low Impact Development Partnership The Alberta Low Impact Development Partnership focuses on public education and outreach to enable various levels of government and other stakeholders to implement low impact development initiatives. Low impact development (LID) initiatives are one way to balance urban growth with the need to protect the natural environment. Low impact development is not a land use planning strategy. It is instead a series of practical techniques that can be applied to new or existing developments to address issues of water quantity and quality. Implementation of LID practices can aid in the protection of riparian areas, maintenance of water quality and management of runoff. Conservation landscaping is a key principle of LID best practices. Specific examples include: Rain Gardens Use of indigenous vegetation or plans that thrive without irrigation (xeriscaping) Absorbent landscaping (e.g. thicker soil depths up to 12 inches) Bio-retention areas Permeable pavement Bio/vegetated swales Green roofs Integration of stormwater management to irrigate landscaped areas (e.g. parking lots designed to drain to vegetated islands) In terms of stormwater capture and re-use, key LID best practices include: Industrial capture and re-use Purple pipe systems (flushing toilets with re-used water) Rainwater harvesting Stormwater harvesting in storm ponds for re-use as irrigation water or other non-potable use 5.7 Provincial Policies Alberta Land use planning in Alberta has generally been addressed by policies at several scales from provincial to municipal. In many cases there is no consistent policy framework to guide local development to conform to a broad regional land use plan. The new Provincial Land Use Framework is a significant step in addressing this issue. O2 Planning + Design Inc. 71
80 Provincial Land Use Framework The Provincial Land Use Framework aims to balance economic growth with social and environmental goals. The Framework creates 7 land regions within which industrial activity, municipal development, infrastructure, recreation and conservation interests will be planned and managed on the regional scale. The Land Use Framework uses 7 strategies to improve land use decision making: 1. Establish 7 regional land regions and plans 2. Create a land-use secretariat and establish a regional advisory council for each region 3. Manage the impacts of development on land, water and air 4. Develop a strategy for conservation and stewardship on private and public lands 5. Promote efficient use of land to reduce the footprint of human activities on Alberta s landscape 6. Establish an information, monitoring and knowledge system to contribute to continuous improvement of land use planning and decision making 7. Inclusion of aboriginal peoples in land use planning Aside from the legislation needed to support the framework, immediate priorities are the development of metropolitan plans for Calgary and Edmonton, and development of regional plans for the Lower Athabasca and South Saskatchewan regions. When formally adopted, the Land Use Framework will require municipalities to ensure that their development plans conform with and address the provincial directions laid out in the regional plans. Municipal planning documents will have to be updated to reflect these new directions. The exact requirements of municipal planning are not known at this point as the South Saskatchewan Regional Plan is currently under development. Until the adoption of legislation to support the Land Use Framework is complete, environmental policies will continue to operate under existing regulations within current departments, primarily Alberta Environment and Sustainable Resource Development Alberta Environment Alberta Environment is responsible for the development of regulations, standards, guidelines and codes of practice through several key Acts. Environmental Protection and Enhancement Act The purpose of this Act is to support and promote the protection, enhancement and wise use of the environment. Numerous regulations, standards and codes of practice are contained in the Act including: Activities Designation Approvals, inspections, abatement and enforcement Conservation and reclamation Environmental assessment Environmental protection and enhancement Waste Control O2 Planning + Design Inc. 72
81 Wastewater and storm drainage Water Act The Act focuses on managing and protecting Alberta s water and on streamlining the administrative process. Key regulations within the Act include: Bow, Oldman and South Saskatchewan river basin water allocation order Drinking water legislation Drinking water quality Water regulation, offences and penalties Climate Change and Emissions Management Act Alberta is the first jurisdiction in North American to impose comprehensive regulations requiring large facilities in various sectors to reduce their greenhouse gas emissions. The goal of the Act is a reduction by 2020 of specific greenhouse gas emissions relative to GDP to an amount equal or less than 50% of 1990 levels Alberta Sustainable Resource Development The following acts are under the primary responsibility of the Alberta Sustainable Resource Development (ASRD): Boundary Surveys Act Expropriation Act Fisheries (Alberta) Act Forest and Prairie Protection Act Forest Reserves Act Forests Act Public Lands Act Surface Rights Act Surveys Act Wildlife Act In addition SRD shares responsibility for parts of various Acts including the Environmental Protection and Enhancement Act British Columbia BC Ministry of Environment Guidelines for Urban and Rural Land Development The BC Ministry of Environment published the document "Develop with Care Environmental Guidelines for Urban and Rural Land Development in British Columbia." This document outlines the provincial development guidelines that developments in BC should meet or exceed. O2 Planning + Design Inc. 73
82 Chapter 4 of the document (BC Ministry of Environment, 2006) discusses the legal requirements, objectives, and guidelines for developing near environmentally valuable resources. The term "environmentally valuable resources" refers to all features, sites, and species whose presence enhances the natural biodiversity of an area. Some examples of environmentally valuable resources are ecosystems such as natural meadows or grasslands, specialized or rare habitats, and habitat for species at risk. The report outlines the benefits of protecting environmentally valuable areas. Most of the benefits stated are similar to those recognized for ecological infrastructure (Section 5.1). The report also provides examples of direct economic calculations of the benefits of protecting environmentally valuable areas. These include: Improved value: Properties adjacent to green space are worth 5-15% more than properties that are not. This provides greater returns for the developer and higher property tax revenue for the local government. Reduced development costs: Clustering buildings to preserve green space translates into lower costs for land clearing and infrastructure development. Natural riparian vegetation along streams and wetlands can dramatically reduce the need for expensive storm sewer infrastructure. Free Services: Ecological services such as stormwater management, oxygen production, atmospheric pollutant absorption and plant pollination are provided by healthy ecosystems free of charge. Wetlands in the lower Fraser Valley are estimated to provide at least $230 million per year in waste cleaning services alone. The City of North Vancouver spends approximately $100,000 per year maintaining over 5000 street trees, but these trees provide a benefit of over $500,000 per year in energy savings, greenhouse gas reduction, aesthetic benefits and property value increases. Costs of not protecting the environment; One lower mainland community that removed riparian vegetation and expanded the amount of impervious surface subsequently experienced flood damage requiring more than $40 million in remedial projects. Guidelines for the protection of environmentally valuable resources include: Inventory and Identification Site Planning and Design Protection During Development Protection After Development Restoration of Disturbed Area Inventory and Identification Inventory and identification guidelines include conducting preliminary and detailed ground survey. Inventory should be conducted in several seasons and the detailed site inventory should be prepared by appropriate qualified professionals. Inventory should include identification of wildlife corridors, potential wildlife conflicts and consultation of Provincial wildlife registries to determine if recovery plans are required. Site Planning and Design Guidelines for site planning and design include working with local government to avoid development in areas where ecologically valuable resources have been identified. Tax credits that encourage the protection of natural areas are one strategy that can be used. Parkland dedication, conservation covenants, management agreements or acquisition by local government or land trust are others. In terms of site design, preservation of round patches which provide interior habitat and long strips of habitat which provide wildlife corridors is encouraged. This may mean varying development density so O2 Planning + Design Inc. 74
83 that higher densities in part of the development offset the lower densities required to protect natural areas in another part of the development. The report recommends the establishment of buffer areas around sensitive features. In urban areas the recommended buffer width for riparian zones and wetlands is 30m. Legislated riparian buffer widths range from 5m to 30m depending on site conditions. Creation or retention of wildlife travel corridors is another key recommendation of the BC Environment report. Wherever possible, existing corridors should be protected. Corridors can be created by leaving strips of natural vegetation or by including buffer areas of vegetation along recreation trails. Protection of aquatic and riparian ecosystems is a specifically emphasized in site planning and design. The primary goal is to ensure that the natural (pre-development) hydrological cycle will be maintained after development. Changes in hydrological flow can turn seasonal wetlands into permanent wetlands with corresponding impacts on habitat. Conversely seasonal wetlands should never be drained or filled. Building away from floodplains, maintaining riparian vegetation cover and minimizing stream crossings are also recommended site planning and design practices. Protection During Development The Report emphasizes that protection of existing ecosystems is much cheaper and more effective than ecosystem restoration and enhancement. The recommendations are fairly standard and do not differ significantly from best practices proposed by the Nose Creek Partnership. Recommendations include fencing off sensitive areas, avoiding damage from machinery, preventing unauthorized access in the protected area and scheduling construction to avoid sensitive time periods. The BC Wildlife Act outlines sensitive periods for various species of bird and fish. Other best practices involve erosion and sediment control to prevent silt-laden waters from entering into nearby streams and wetlands and restriction of pesticide use near riparian areas Protection After Development The BC Environment report recommends permanent fencing to limit access to environmentally valuable areas and buffer areas to add further protection. Recreational use should be planned carefully, specifically planning trails and pathways to avoid sensitive areas; installing signage and educational tools to inform the public about the importance of ecologically sensitive areas; and restricting off-leash dog areas near sensitive areas. Restoration of Disturbed Areas The report recommends restoration of disturbed areas by re-planting with native trees, shrubs and grasses; restoring raptor habitats with nest boxes or platforms if necessary and performing restoration in the context of a detailed plan prepared by qualified professionals. O2 Planning + Design Inc. 75
84 6. RECOMMENDED ENVIRONMENTAL BEST PRACTICES FOR AIRDRIE The environmental provisions in the Airdrie City Plan already address some key environmental issues. Based on a review of policies in other jurisdictions a number of recommendations can be made to enhance these existing provisions. The following sections outline appropriate best management practices identified from other jurisdictions that would be of benefit to protecting Airdrie s ecological resources. Due to the balance of accommodating population growth while preserving ecologically sensitive areas, these recommendations may need to be considered on a site-by-site basis. 6.1 Ecological Inventory Data The City should integrate the collected ecological inventory data with existing municipal GIS data. This strategy is used by the City of Red Deer to assist in planning efforts which consider important ecological areas. As recommended in the BC Ministry of Environment development guidelines report, periodic ground survey of identified ecological areas during different seasons may be valuable for refining habitat rankings and wildlife observations. 6.2 Riparian Corridors The City may consider adopting setback best practices as outlined in the Nose Creek Watershed Water Management Plan in areas where it would not adversely affect desired housing targets. These setback best practices (detailed in Section 5.6) would consider flood zones, meander belts and escarpments in the calculation of setbacks, rather than just the flood zone alone. Following the example of the City of Edmonton river valley and ravine system, Airdrie may consider integrating riparian corridors into existing open space and ensuring that recreational activities within riparian corridors are primarily passive and low intensity. Acquisition of riparian corridors prior to development and designation of such areas for parks is another recommended strategy. Assessment and evaluation of the recommendations in the Bow River Basin Council s Protecting Riparian Areas: Creative Approaches to Subdivision Development in the Bow River Basin is recommended. Adoption of the recommendations where they do not impinge upon growth management targets should be considered. To maintain consistency with the goals of the Calgary Metropolitan Plan, the City of Airdrie should ensure that the integrity of CMP-identified regional corridors are preserved (Section 5.2.3). One way of achieving this is to protect the lower reaches of riparian corridors that form tributaries with the larger regional corridor. Protection of riparian corridors can also reduce the need for expensive stormwater infrastructure. 6.3 Ridges and Escarpments Consistent with recommendations in the CMP and top-of-bank policies adopted by the City of Edmonton, ridges and escarpments should be preserved as natural open space wherever possible. They facilitate the movement of wildlife, maintain landscape connectivity and represent areas of high scenic value and recreational potential. Ridge top setbacks can serve the dual goal of protecting riparian corridors, while providing recreational opportunities. Where practical, the Nose Creek Watershed Water Management Plan setback recommendations should be considered (Section 5.6.1). These recommendations calculate setback width as a function of slope height and proximity to riparian corridors. O2 Planning + Design Inc. 76
85 6.4 Natural Vegetation The City should make efforts to preserve any large patches of natural vegetation. One example is the wooded area in the northeast of the study area. Development in this area should proceed in a manner so as to preserve interior habitat. The City should continue with and emphasize further, the distinction between natural, naturalized and manicured landscaping. Due to the long history of agricultural use in the region, there is little true natural (or native) vegetation. However, various species of non-native grasses form a naturalized landscape that reflects the character of the prairie landscape and have adapted to the climate and moisture regime of the region. While it is recognized that a manicured landscape can be desirable and appropriate for some areas, the City should wherever possible opt for naturalized landscaping in new developments. Such landscaping requires lower maintenance, offers a better protection against soil erosion and riparian damage and is more in keeping with the character of the rural landscape outside City limits. Naturalized landscaping can reproduce on a small scale the natural habitats found in non-developed rural areas. It is also valuable in simulating the runoff characteristics of non-developed areas thereby helping to offset the negative hydrological impacts of large areas of impervious developed surfaces. 6.5 Wetlands The City should aim for no net loss of wetlands. Where possible wetlands and a buffer of vegetation around them should be preserved. Buffer widths should be calculated based on local site conditions, but the 30m width recommended by the Nose Creek Watershed Water Management Plan is considered best practice. Integration of existing wetlands into the stormwater management infrastructure is a policy adopted by Red Deer (Section 5.5). 6.6 Water Maintaining the quantity and quality of water in Nose Creek and its tributaries should be the primary goal of any water policies. The City of Edmonton (Section 5.4.5) has adopted policies that form a useful framework. These include strict ecological design standards for new developments, stormwater best management and participation in activities and supporting organizations that work to maintain water quality in the local area and the wider watershed. 6.7 Parks and Open Space Recommendations for parks and open space include acquisition of riparian corridors as just described. In addition, planning the park and open space network to link with existing natural areas will help to maintain ecological connectivity and wildlife corridors. The City may wish to consider a comprehensive tree management program and expansion of the urban forest. The BC Ministry of Environment Report (Section ) provides examples of the cost savings that can be realized by investing in the urban forest. Nose Creek should form the central corridor in the parks and open space system. Ecologically significant areas adjacent to Nose Creek identified in this study can be set aside as open space to the extent that is deemed appropriate. A more challenging issue is the strategy for the Nose Creek open space within developed areas of the City. There are a series of narrow park and open space elements that follow Nose Creek through the middle of Airdrie. Since these areas are already confined by surrounding development it is not possible to implement the same open space plans here as could be adopted in newly-acquired land. The best strategy for these areas would increase connectivity of existing trails and pathways and promote more passive recreational uses. Actively planning or allowing natural reversion to naturalized O2 Planning + Design Inc. 77
86 vegetation would provide conformity with newly-acquired open space areas. This may meet with some resistance in areas where landscaping is currently manicured. 6.8 Design Standards Changes in design at the neighbourhood plan scale can accommodate population targets while minimizing impact on ecologically valuable areas. With ecological inventory integrated in to the City s GIS, variable density neighbourhood designs can be evaluated. Clustering dwellings and varying density in consideration of existing natural features serves dual goals of protecting ecologically sensitive areas while providing a mix of housing options and individuality in neighbourhood design. This design strategy also reduces land clearing and infrastructure development costs The City should investigate the application of Low Impact Design (LID) best practices for both future developments and as retrofits to existing developments. LID best practices are one way to reduce environmental impacts without requiring major changes to planned build-out footprints. O2 Planning + Design Inc. 78
87 REFERENCES Alberta Environment Stormwater Management Guidelines for the Province of Alberta. (Available online at Alberta Environment Land-use Framework. Edmonton, Alberta. (Available online at useframework-final-dec pdf) BCMOFR (British Columbia Ministry of Forests and Range) Riparian Management Area Guidebook. (Available online at BC Ministry of Environment Develop with Care Environmental Guidelines for Urban and Rural Land Development in British Columbia (Available online at Resources.pdf) Bow River Basin Council Protecting Riparian Areas: Creative Approaches to Subdivision Development in the Bow River Basin. A Guide for Municipalities, Developers and Landowners. (Available online at Calgary Regional Partnership Calgary Metropolitan Plan. (Available online at City of Airdrie City of Airdrie Growth Study Prepared by Brown and Associates Planning Group et. al. City of Airdrie / Rocky View County Intermunicipal Development Plan. Airdrie City Council, August 7, Bylaw No. B-21/2001. Rocky View County Council, 2001 July 31, Bylaw No. C City of Airdrie. 2004a. Growth Area Management Plan. Prepared by IBI Group City of Airdrie. 2004b. Airdrie City Plan. Municipal Development Plan City of Airdrie. 2004c. Southeast Airdrie Community Area Structure Plan. Prepared by Brown and Associates Planning Group Ltd et al. Prepared for Highview Communities et. al. City of Airdrie. 2004d. Luxstone Park Estates Area Structure Plan. Prepared by Planning Protocol Inc. City of Airdrie. 2005a. A Principled Approach to Growth. Prepared by IBI Group. City of Airdrie, 2005b. Bylaw Chinook Winds Community Area Structure Plan in the City of Airdrie, AB. Prepared by Urban Systems. City of Airdrie. 2005c. South Airdrie Community Area Structure Plan. Prepared by Focus Corporation. City of Airdrie. 2005d. West Airdrie Community Structure Plan. Prepared by New View Consulting. Prepared for Genesis Land Development Corp. City of Airdrie. 2006a. City of Airdrie Great Places. Prepared by Dillon Consulting and Sandalack and Associates. City of Airdrie. 2006b. The Cooper s Town Area Structure Plan. Prepared by Southwell Trapp and Associates. City of Airdrie, 2006c. Northwest Community Area Structure Plan (Bylaw No. B-55/2005). Prepared by Brown Associates et. al. City of Airdrie Northeast Airdrie Community Area Structure Plan (Bylaw No. B-21/2007). Prepared by D.A.Watt Consulting and David Jacobs Consulting for Northeast Airdrie CASP Owners Group. City of Airdrie. 2008a. Airdrie Comprehensive Growth Study. Prepared by Dillon Consulting et. al. O2 Planning + Design Inc. 79
88 City of Airdrie. 2008b. The City of Airdrie Guidelines for the Preparation of Community Area Structure Plans, Neighbourhood Structure Plans, and Area Redevelopment Plans. City of Calgary. 2007a. The City of Calgary s Environmental Action Plan (The City of Calgary s Environmental Policy (Policy Number UEP001)). (Available online at City of Calgary. 2007b. EnviroSystem Annual Report The City of Calgary s Performance in Environmental Management. Available online at City of Edmonton Draft Municipal Development Plan. Section 6.0 Natural Environment. (Available online at Natural_Environment_Draft_MDP.pdf) Golder Associates Ltd Nose Creek Flood Risk Mapping Study City of Airdrie. Prepared for Alberta Environment, Northern Region, River Engineering Team. Natural Regions Committee Natural regions and subregions of Alberta.Government of Alberta, Alberta Environment, Alberta Sustainable Resource Development, Compiled by D.J. Downing and W.W. Pettapiece. The Nose Creek Watershed Partnership Memorandum Nose Creek Water Management Plan Comments. Submitted by City of Airdrie October 29, 2007 (Available online at %20B.%20%20Public%20Consultation%20Summary/Airdrie%20Memo.pdf) The Nose Creek Watershed Partnership The Nose Creek Watershed Management Plan. Prepared by Palliser Environmental Services Ltd. (Available online at 0Watershed%20Water%20Management%20Plan.pdf) O2 Planning + Design, Inc., Ecological Infrastructure The Green Network. Internal Review Document. Sanchez-Azofeifa, G. A. et. al Alberta Ground Cover Characterization (AGCC) Training and Procedures Manual. Earth Observation Systems Laboratory, Department of Earth and Atmospheric Sciences, University of Alberta, Edmonton, Alberta and Alberta Biodiversity Monitoring Program. O2 Planning + Design Inc. 80
89 APPENDIX A. REVIEW OF PREVIOUS AIRDRIE GROWTH STUDIES A.1. City of Airdrie Growth Study 2000 The primary purpose of this study was to identify the amount of land that would be needed to accommodate the long-term growth of the City as it was envisioned at that time. Its intent was to inform and finalize the Intermunicipal Development Plan (IDP) between the City of Airdrie and Rocky View County and to guide the future annexation of lands from the County (City of Airdrie, 2001). While land evaluation exercises performed as part of this study did consider natural features, they were often viewed in the context of barriers to development rather than for their inherent ecological value. Natural features were assessed alongside numerous other parameters in terms of influencing the development potential of peripheral lands. The conclusion of the study was that lands to the north, southwest and southeast of the 2000 City limits met the most criteria for future development. The preferred growth strategy identified northwest, southeast and southwest areas for residential growth. Industrial development was recommended to be located north and south of the city limits in areas adjacent to the QEII Highway. A.2. Airdrie Growth Area Management Plan 2004 With the Annexation of 19 quarter sections (1163 hectares) of land in July, 2003 came a requirement for the City to update its Municipal Development Plan (MDP). IBI Group was selected to complete a Growth Area Management Plan (GAMP). Guiding principles set forth in the 2004 GAMP included the following (City of Airdrie, 2004a). Downtown focus for commercial development Increased development densities Provision of appropriate interfacing and buffering Creating a comprehensive community Encouraging non-residential development Effective infrastructure management Development of a comprehensive parks and open space system The growth plan recommended that residential development be directed to the northwest, east and west and commercial development be located to the north, and in nodes adjacent to the east and west industrial areas. It was recommended that industrial development be located to the north and in areas immediately east of the QEII Highway. A.3. A Principled Approach to Growth In 2005, the IBI group completed A Principled Approach to Growth for the City of Airdrie. This report was less of a land planning document and more a set of principles and goals to ensure a socially, environmentally and financially sustainable future (City of Airdrie, 2005a). The principles and objectives of Airdrie s community development plan as outlined in the document focused into three key areas: Sustainability Smart Growth Healthy communities This study defined sustainability as activities and growth patterns that add to the community without any negative implications environmentally, socially or financially. Smart growth was defined in the report less in terms of patterns of growth but more in terms of the mechanics of growth. Smart growth was based on the principle of maximizing investment for the O2 Planning + Design Inc. 81
90 greatest amount of benefit, and ensuring that decisions are made not as retroactive quick fixes, but as proactive solutions to requirements that are based on a long-term vision. Healthy communities as defined in the report were to provide significant opportunity for recreational activities, interaction with the natural environment, venues to encourage social interaction and foster a heterogeneous population including cultural diversity, a variety of income levels, family types and age groups. In short, healthy communities would serve the social and housing needs of a broad cross section of the population. The Principled Approach to Growth identified the following key elements of successful communities: Social and Recreational Infrastructure Recreational Facilities and Natural Open Space Community / Cultural Facilities Affordability Economic Development Environmental Conservation Quality of Life Reduce traffic by allowing close housing-work proximity Provide public transit and a trail network to foster use of alternative transportation Encourage recycling Identifying and preserving natural features before activities on surrounding lands degrade their value Increase urban densities to reduce the consumption of agricultural land and natural areas. Sense of Community Identity Sense of Connection to Community Community Accessibility Quality of Urban Design Comprehensive Land Use Planning Land Use and Transportation Integration Overall Increase and Mix of Density Variety of Housing Types Connectivity of Communities Land Use Linkage Sense of Place A.4. Airdrie Comprehensive Growth Strategy 2008 While the 2004 GAMP was a precise and timely document at the time of annexation, several factors required that growth strategies be updated. Most significant was a sustained economic boom which peaked from 2006 to 2007 and created development pressures that the 2004 study could not have anticipated. O2 Planning + Design Inc. 82
91 In 2008 the City of Airdrie selected Dillon Consulting to complete a revised growth strategy that addressed the new realities the City was facing at the time. The Airdrie Comprehensive Growth Strategy was envisioned as a way to assist in the development of future IDPs with Rocky View County and also to support future annexation initiatives. In place of the 30 year time frame used most by municipalities for growth planning, the CGS followed the lead of such rapidly growing communities as Red Deer and Chestermere and used a 50 year growth horizon. The CGS included detailed forecasting of employment and population trends for the next 50 years and accounted for how these trends would be influenced by City policy. Under a scenario in which the City s policy to balance growth between residential and non-residential development was enforced, the projected population in 2057 was estimated to reach 85,000. An alternate scenario was proposed in which the policy was relaxed and population was allowed to grow faster than employment. Under this scenario a population of 109,000 was projected by When just historical trends were used as a guide, the CGS predicted the population would grow from 31,352 in 2007 to approximately 85,000 in When extended to 2057, the population projection was almost 109,000 (City of Airdrie, 2008a). The CGS outlined in detail how the projected population increase would be exhibited in land demand. The analysis considered the effects of increases in development density, people per household, and relative residential, commercial and industrial demand to build an accurate relationship between projected population growth and projected land demand. In calculating the supply of vacant land the CGS did consider the existence of natural corridors. However, it did this by defining environmental reserves as a simple 30m setback from existing drainage courses. The CGS recommended accommodating growth by both the development of vacant land within current city limits and through directionally planned growth outside of city limits. Of the approximately 1,133 hectares of land within City limits that was available for future growth at the time of CGC writing, 783, 341 and 9 were to accommodate residential, commercial and industrial growth respectively (City of Airdrie, 2008a). Growth directions within these vacant lands had already been determined by councilapproved Community Area Structure Plans (CASPs). The adopted CASPs had the potential to accommodate a total city population of 85,000, but the CGS adopted the conservative view that development practices and densities within the CASPs would not deviate significantly from the status quo. Under this conservative view the CGS land demand analysis concluded that the City of Airdrie would require the annexation of an additional 45 quarter sections of land to accommodate long term (50 year) population growth. Of the 45 required quarter sections, 23, 15 and 7 would be required for long-term residential, industrial and commercial growth respectively. In keeping with previous growth studies, the CGS identified the most suitable directions for residential growth to be west, north, southwest and southeast of current city limits, with industrial uses targeted in the northeast and south. The conclusions of the CGS were that residential annexation should be targeted primary within quarter sections north and west of the City boundary. Additional quarter sections south and southwest of the City boundary would also be targeted for residential development The CGS concluded that commercial and industrial annexation should be focused along the QEII corridor north and south of the City with additional areas east of the City boundary. O2 Planning + Design Inc. 83
92 APPENDIX B. LULC: GIS / IMAGE-BASED CLASSIFICATION METHODOLOGY B.1. Introduction The LULC methodology used in this study is based on known feature GIS data combined with airphoto interpretation, rather than spectral classification. The use of GIS data to derive land classes is similar to the methodology of the Alberta Ground Cover Classification (AGCC) created by the University of Alberta Earth Observation Systems Laboratory (Sanchez-Azofeifa, et. al, 2004). The AGCC uses known feature GIS data as direct inputs into the LULC model with image based classification algorithms being confined to areas where no GIS data coverage is available. Our approach uses GIS data to create LULC classes and airphoto interpretation to classify areas where known feature GIS data is not available. This method is appropriate given the small size of the study area and the excellent resolution of the available airphoto data. B.2. Land Cover Classes and Origins Detailed land cover classes were derived from two primary methods: conversion of known feature GIS data and airphoto interpretation. An initial detailed LULC was created where classes were defined by the source GIS data set and airphoto interpretation. Unique IDs were assigned within defined land classes in order to identify the data source. Because GIS data came from the City of Airdrie, Rocky View County and several other sources, this approach was beneficial in tracking data origins. Once detailed classes had been identified they were combined to form a generalized LULC map (Figure 4). Table B-1 shows the initial GIS-based and airphoto interpretation-derived classes and how they are combined into generalized LULC classes. Results of the generalized LULC are contained in the main report in Section 2.4. Table B-1 - GIS-Derived and Generalized LULC Classes Class Class Name Generalized Generalized Class Name Data Source Class 10 Undifferentiated Anthropogenic 6 Undifferentiated Urban or Anthropogenic GIS Data and Airphoto Interpretation 11 Undifferentiated Urban 6 Undifferentiated Urban or Anthropogenic GIS Data and Airphoto Interpretation 12 Commercial 5 Developed Land - Commercial Zoning Parcels and Airphoto Interpretation 13 Residential 3 Developed Land - Residential Zoning Parcels and Airphoto Interpretation 14 Industrial 4 Developed Land Industrial Zoning Parcels and Airphoto Interpretation 15 Rural Residential 3 Developed Land - Residential Zoning Parcels and Airphoto Interpretation 55 Deciduous Trees 7 Trees Airphoto Interpretation and Field Confirmation 56 Coniferous Trees 7 Trees Airphoto Interpretation and Field Confirmation 76 Grass / Pasture 1 Grass or Pasture Airphoto Interpretation and NDVI change 77 Grass / Pasture 1 Grass or Pasture Zoning Parcels and Airphoto Interpretation 78 Grass / Pasture 1 Grass or Pasture Airphoto Interpretation and Field Confirmation 79 Hay 2 Cropland Airphoto Interpretation and Field Confirmation O2 Planning + Design Inc. 84
93 Class Class Name Generalized Generalized Class Name Data Source Class 81 Wetlands Marsh 11 Wetlands - Marsh GIS Data (Ducks Unlimited) 82 Wetlands Marsh Worked 11 Wetlands - Marsh GIS Data (Ducks Unlimited) 95 Wetlands Open Water 8 Open Water GIS Data (Ducks Unlimited) 103 Exposed Ground or Soil 13 Cleared Land / Construction Zoning Parcels and Airphoto Interpretation 104 Construction Site 13 Cleared Land / Construction Zoning Parcels and Airphoto Interpretation 121 Recurring Lake 8 Open Water GIS Data (AltaLIS 1:20,000 Base) 124 Ponds 8 Open Water GIS Data (City of Airdrie Ponds Layer) 125 Ponds 8 Open Water Zoning Parcels and Airphoto Interpretation 126 Nose Creek 8 Open Water GIS Data (City of Airdrie Nose Creek Layer) 130 Roads 9 Road Network GIS Data (Combined Airdrie/County. Roads 133 Rail 10 Rail Network Digitized from Airphoto 161 Farmstead 12 Rural Farmstead Zoning Parcels and Airphoto Interpretation 192 Wetlands Dugout 11 Wetlands - Marsh GIS Data (Ducks Unlimited) 210 Cropland 2 Cropland Airphoto Interpretation and NDVI change 211 Cropland 2 Cropland Airphoto Interpretation and Field Confirmation B.3. LULC Classification Methodology The AGCC methodology was used as the basis for mapping land cover in the Airdrie growth region. The first step was to map as many classes as possible using GIS data of known features. These features included roads, rail, hydrology, wetlands and steams. Many of these are difficult to extract using traditional image classification techniques. The majority of features came from GIS layers provided by the City of Airdrie and Rocky View County, but data from AltaLIS base datasets and Ducks Unlimited were also used. With key known features identified, the next step was to interpret remaining land use from available airphoto imagery. This differs from the AGCC methodology which uses multispectral image classification for this stage. Airdrie 2008 imagery was used for land cover interpretation within City limits while Rocky View County 2007 imagery was used for interpretation outside City limits. Rather than digitizing a new file of land use polygons from airphotos, land cover values were assigned to an existing grid of land use zone parcels. Existing polygons were subdivided and reshaped to match the ground conditions visible in airphotos. Land cover codes were then added to the attribute field of each modified land use polygon. Where required, polygons were digitized into or cut out of the existing land use zone layer. The starting point for this process was a merged GIS layer combining legal zoning parcels from the City of Airdrie and Rocky View County. The City parcels are extremely detailed, especially in residential areas where individual legal lot boundaries are denoted by unique polygons. Due to the lower density of development outside the City limits, the Rocky View County parcels are larger and generally conform to field boundaries and the legal boundaries of rural residential properties. This merged parcel polygon layer was essentially used as an interpretation grid. With the parcels displayed as a transparent mesh over airphoto imagery, land use zone parcel polygons were selected O2 Planning + Design Inc. 85
94 and assigned a land cover code based on interpretation of the underlying airphoto. If a land use parcel polygon encompassed an area of imagery with multiple land cover types, the polygon was subdivided and the divisions classified accordingly. Most Rocky View County farmland parcels were subdivided based on crop-grassland-farmstead boundaries clearly visible in the underlying imagery. In developed parts of the City of Airdrie, assigning land cover designation to legal land use parcels was generally achievable without significant airphoto interpretation because the land use zone parcel codes essentially denote the land cover type. Translating parcel zoning codes to land cover type was simply a matter of grouping all zoning codes into broad classes such as residential, commercial, industrial. The exceptions to this rule were parcels in areas zoned for future development. These parcels contained land use zone codes but, when displayed over imagery, it was clearly apparent that land within their boundaries was either undisturbed, cleared or actively under construction. In these cases an appropriate land cover class was defined based not on the zoning designation of the polygon but on the ground condition visible in the airphoto. Typically grassland, exposed ground, or construction site were assigned as classes in these cases. In some cases, developed zoning parcels contained sizeable areas of grassland in the form of planned green space, landscaping or parks. In those cases the parcel was subdivided. The developed portion of the parcel would retain its original land use zone code, while the grassland area would be designated as such. The result was a matrix which, although derived from a mesh of land use zoning polygons contained edits and attributes describing land cover interpreted from high resolution air photos. Statistics generated from this LULC matrix more accurately reflect the ground condition since they account for the mix of land cover types that can occur within a defined zone. They also account for the discrepancy between designated use and ground condition in areas zoned for future development. Separation of cropland, pasture and grassland proved to be difficult even from high resolution air photos. This was especially true for areas outside City limits for which the Rocky View County 2007 imagery was the primary interpretation source. The Rocky View County image was acquired during spring at a time when visual differences between cropland and grassland are minimal. Normalized Difference Vegetation Index (NDVI) analyses of satellite imagery as well as field confirmation were required to supplement the airphoto interpretation. NDVI is a simple numerical indicator use to assess whether remote sensing imagery contains live green vegetation. It is expressed as follows: NDVI = (NIR RED) / (NIR + RED) Because grassland, pasture and cropland are all live green vegetation it is difficult to separate them from a single NDVI image. However when multi date images are used, the relative change in NDVI between the images can be used to separate cropland from grassland. Two multispectral SPOT images of the Airdrie region were obtained from the Government of Canada s Geobase online data archive. One image was acquired on July 26, 2007 and the other was acquired on August 16, NDVI composites were created for both scenes and principal components analysis was applied to find the greatest variance between the NDVI values of each image. Areas of high variance generally corresponded to cropland while areas of low variance corresponded to grass or pasture. This is because the natural vigour of cropland changes considerably over the growing season whereas the vigour of grass and pasture changes little. NDVI variance and airphoto interpretation were used in combination to assign cropland, pasture or grassland classes to the LULC. In order to verify these interpretations, additional field confirmation was performed. A series of transects were driven across the study area using township and range roads. The results of the NDVI / airphoto interpretation were displayed on a mobile GIS unit and vehicle location was tracked on the unit using a GPS unit. Each field sub-polygon was observed visually to determine which of two general cover types (cropland or grassland /pasture) were dominant. The results of the visual interpretation were applied to the polygons using the mobile GIS. A simple drop-down menu allowed selected polygons to have their O2 Planning + Design Inc. 86
95 NDVI/airphoto-interpreted land cover value confirmed by the field observation or overwritten with a new designation. B.4. Detailed LULC Class Distribution The relative distribution of GIS and image interpretation based classes for the whole study area ( hectares) is shown in Table B-2. Table B-2 - Distribution of GIS / Image Interpretation-Based LULC GIS Data / Image Interpretation-Derived Classes % Cover (Area Ha.) within Study Area Grassland 33.99% ( ) Cropland 32.60% ( ) Trees 1.59% (125.79) Streams (Nose Creek) 0.11% (8.70) Wetlands Open Water 0.06% (4.75) Wetlands - Marsh 1.37% (108.39) Wetlands Marsh Worked 0.25% (19.78) Wetlands - Dugout 0.20% (15.82) Ponds (Includes Canals) 0.96% (75.95) CP Rail 0.07% (5.54) Roads 6.89% (545.09) Residential 7.16% (566.46) Commercial 1.07% (84.65) Industrial 2.14% (169.30) Rural Residential 0.41% (32.44) Rural Farmstead 1.26% (99.68) New Development Land Cleared for Construction 7.05% (557.75) New Development Land Under Construction 1.33% (105.22) Undifferentiated Urban 0.35% (27.69) Undifferentiated Anthropogenic 1.14% (90.19) The natural and semi-natural land cover in the study area is a mix of grassland, shrubs, trees and wetlands. The non-natural landscape is a mix of agricultural lands and commercial, industrial and residential development both within City limits and in Rocky View County. B.4.1. Natural / Semi Natural Land Cover Natural or semi-natural land cover includes grassland, forest, shrub land, as well as open water and wetlands. Together, these elements account for 38.05% of the land cover in the study area. Grassland is the dominant cover type in the study area. Covering almost 2,700 hectares it accounts for 89% of natural / semi-natural land cover and 33.9% all land cover. Grassland was identified primarily through image interpretation. Due to the difficulty of separating different types of grassland from airphoto imagery, the grassland class may include fallow cropland and rangeland used for cattle grazing. In addition, this class also includes grassland associated with urban development, such as parks, green space and planned landscaping. Within city limits the area of grassland or pasture is 1,081 hectares. 60% of this value (649 hectares) is grassland associated with existing parks, pathways, green space, recreational areas and highway medians. Wetland classification is sourced directly from Ducks Unlimited GIS data. This data can be broadly separated into natural (open water and marsh) and disturbed (worked marshes and dugouts) wetland classes to give representative land cover statistics. Based on this classification, there are 113 hectares of natural wetlands and 37.8 hectares of disturbed wetlands in the study area. Natural wetlands are concentrated in the eastern part of the study area with additional clusters occurring in the south. The eastern part of the study area also contains the largest individual wetlands. The natural wetland class represents 3.76% of natural / semi-natural land cover and 1.43% of all land cover in the study area. O2 Planning + Design Inc. 87
96 The properties of the wetlands as defined in the GIS data did not always reflect conditions on the ground. Wetlands classified as marsh in GIS would often be better described as open water when observed in the field. The reverse was also true. The disagreement between GIS data and field conditions could be a reflection of seasonal and inter-annual variations in wetland water content. There are a number of ponds in the study area, primarily within Airdrie city limits. These ponds are a mix of natural and man-made features and account for 76.3 hectares or 0.96% of total land cover in the study area. Some of the largest pond features are the artificial canals constructed as part of a new residential development in west Airdrie. A distinctive characteristic of the study area s natural landscape is the pronounced lack of woodland or forest. The total area of woodland in the study area is hectares which represents only 4.18% of natural / semi-natural land cover and 1.59% of total land cover. The only major concentration of woodland is just northeast of the city limits. This is located in the northwest, northeast and southwest quarter sections of Township 27- Range 29. This area alone accounts for 44.2 hectares or 35.1% of all tree cover in the study area, a figure almost equal to the total tree cover within Airdrie city limits (42.43 hectares). B.4.2. Anthropogenic Land Cover Anthropogenic or non-natural land use in the study area is a mix of agricultural and urban elements. Anthropogenic land use includes cropland, built-up areas and transportation infrastructure. Total anthropogenic land cover represents 61.95% of the study area. Cropland accounts for 52.6% of anthropogenic land use and 32.6% of all land use in the study area. These values may include elements of grassland due to the difficulty of distinguishing between fallow cropland, grazed rangeland and other natural or semi-natural grassland from airphotos. There are still significant areas of cropland within the City limits. These are located primarily in the northeast, southeast and southwest corners of the City boundary and total 306 hectares or about 12% of all cropland in the study area. Developed land (commercial, industrial and residential) covers 853 hectares and represents 17.4% of anthropogenic land cover and 10.8% of total land cover. These values include rural residential development, but do not include rural farmsteads which represent 2% and 1.2% of anthropogenic and total land cover respectively. The majority (94.4%) of developed commercial, residential and industrial land is within Airdrie City limits. Numerous new developments within Airdrie City limits have resulted in significant areas of land that have either been cleared and graded for construction or are actively under construction. Because of the pace of construction the relative proportion of land in each state is constantly changing. At the time that the LULC analysis was performed, 558 hectares and 105 hectares were identified as cleared and under construction respectively. These areas represent 11.4% and 2.1% of anthropogenic land cover and 7.05% and 1.3% of total land cover in the study area respectively. All of the cleared land and land under construction is within Airdrie City limits. Together they represent a notable 19.7% of the total land area within the current City boundary. O2 Planning + Design Inc. 88
97 APPENDIX C. CURRENT GROWTH MANAGEMENT POLICY FRAMEWORK C.1. Introduction A set of policies exist at the provincial and municipal scale to facilitate community growth planning. This section provides an overview of current policies with a specific focus on provisions in place to protect, maintain and restore ecologically sensitive areas. The management of growth requires policies at multiple scales that consider the social, economic and environmental consequences of such growth. At its most fundamental, planning for future growth requires the identification and acquisition of suitable land. When the supply of suitable land within a jurisdiction s boundaries cannot sustain projected growth, it may be necessary to identify and acquire land via a transfer of jurisdiction from a neighbouring municipality. C.2. Intermunicipal Development Plan (IDP) The purpose of an IDP is to establish a set of policies and procedures by which planning issues on land bordering multiple municipalities can be addressed in a coordinated fashion and through which information can be shared between those municipalities. As described in Section 631 of the Municipal Government Act (MGA) IDPs may address future land use, development and other matters of intermunicipal concern affecting lands within the Plan boundaries as agreed to by the participating municipalities (City of Airdrie/Rocky View County, 2001). The City of Airdrie and Rocky View County entered into an IDP in August, 2001 for the purpose of fostering the development of policies to guide decision making in planning that would be of mutual benefit to both municipalities. The IDP co-exists with other policies in both jurisdictions such that it does not take precedence over existing plans adopted by the City or Rocky View County, but guides policy in areas not affected by previous plans. The 2004 Airdrie City Plan sets out several policies specifically related to ensuring continued cooperation and communication between it and Rocky View County under the provisions of the 2001 IDP: The City shall maintain an open dialogue with Rocky View County with regard to land use, transportation, infrastructure, recreation and environmental issues affecting both municipalities The City should allow for a reasonable level of development to occur in the Intermunicipal Plan Area provided that no negative impact exists towards the lifestyle and comfort of Airdrie residents, future expansion of the municipal boundaries, continuity of uses or municipal facilities or infrastructure In consultation and co-operation with Rocky View County the City shall seek to incorporate lands within the City boundaries which allow for a reasonable area for growth and development. As a general rule this should represent a 30 year supply. Beyond this point the City shall seek to establish an intermunicipal agreement area in which consultation occurs regarding the intensity and nature of development. A detailed annexation plan is not set out in the Airdrie / Rocky View County IDP. It is, however, recognized by both municipalities that annexation is one of several options that may be pursued by the City of Airdrie to manage growth. The IDP does recognize the primary future urban growth corridors for the City of Airdrie. In these areas both municipalities will consult and cooperate to ensure that no planning decisions are made that jeopardize urban expansion in these zones. An example of a primary urban growth policy area is the QEII Highway corridor. This policy area recognizes that the highway corridor is of significant importance to the economic interests of both the City of Airdrie and Rocky View County. Intermunicipal referrals are required for any proposed development in these planning areas such that each municipality is concurrently circulated any development proposal (City of Airdrie, 2004b). The IDP seeks to coordinate planning and policies in several key areas including: Transportation, Utilities and Servicing O2 Planning + Design Inc. 89
98 Commercial, Industrial and Business Development Residential Development Agriculture Natural Environments, Open Space and Recreation Of these, the last item is of the most relevance to this study. The 2001 IDP states that protection, maintenance and enhancement of a healthy natural environment and the preservation and reuse of historic resources are important objectives in providing a higher quality of life for residents of both municipalities. The IDP identifies the following natural features as significant resources in need of special consideration. Nose Creek Floodway 100 Year Flood Risk Area Slopes Exceeding 15% The IDP states that these features should be used as an initial guide and that they may be updated from time to time as other significant natural areas are identified. The IDP recognizes Nose Creek as the most prominent natural feature in the plan area, noting its importance for recreational opportunities and the potential effects that development on its banks have for downstream water quality (This is reflected in our GIS evaluation of ecological inventory components. The Nose Creek floodway is one of three natural features to receive maximum weighting for its ecological significance). IDP policies specific to Nose Creek are outlined in Section of the City of Airdrie / Rocky View County Intermunicipal Development Plan and include the following: Development within the Plan Area should control surface runoff using best management practices, both during construction as well as in the long term. All sites being developed or redeveloped where the history of use is uncertain or where the possibility of site contamination exists, should undergo, at a minimum, a Phase One Environmental Site Assessment (ESA). Lands that qualify as Environmental Reserve under Section 644(1) of the MGA should be dedicated at the time of subdivision approval as either environmental reserve or environmental reserve easement in favour of the respective municipality. Provisions should be made for the prevention and control of invasive noxious weeds (as listed by Alberta Weed Control) on both private and public lands. Restoration of disturbed sites may include the establishment of natural species of flora appropriate to the area. Generally, existing watercourses as they are currently aligned will be protected and dedicated as environmental reserve. However, realignment could be considered when it can be shown that a proposal to realign an existing watercourse will: Result in an enhancement of existing riparian habitat Not detrimentally affect water quality or stream flow Provide enhanced opportunities for residents to enjoy the recreational/aesthetic qualities of the watercourse Employ best management practices as identified by a licensed professional in the field Recognizing that the City of Airdrie and Rocky View County have different approaches and priorities regarding the acquisition and maintenance of open space, both municipalities agree to O2 Planning + Design Inc. 90
99 co-operate on the long term planning and development of future open space systems within the Plan Area to the extent that is practical. More specifically they will: Encourage options for and provide flexibility in the establishment of open space systems utilizing the Nose Creek floodway, flood fringe and other natural areas Encourage the dedication of environmental and municipal reserve land adjacent to Nose Creek to establish a continuous linear park system that will connect a series of larger open space units whenever possible and practical Respect and protect the riparian habitat immediately adjacent to the watercourse in plans for the development of trails within this park system Discourage development of slopes and the Nose Creek flood fringe in favour of retention of such lands as part of a natural open space system Give due consideration to the impacts that development may have on natural areas. Subject to further study and public input, both municipalities will jointly investigate setting priorities for development of a regional trail network that may link existing open space sites and points of interest and development within the two municipalities. C.3. Annexation Annexation is the transfer of jurisdiction of lands from one municipality to another (City of Airdrie/ Rocky View County, 2001). In the context of this study, it relates to the transfer of land jurisdiction from Rocky View County to the City of Airdrie. This process last occurred in 2003 and continued growth pressures within City limits make it likely it will be pursued as an option in the future. Annexation policies set out in the 2001 IDP include a goal to reach an intermunicipal agreement on the annexation of land before any formal application is submitted to the Municipal Government Board. Upon the transfer of annexation lands into the City s jurisdiction the City will prepare a Growth Area Management Plan. The Growth Area Management Plan and Municipal Development Plan together lay the groundwork for the acceptance of the more detailed community and neighbourhood structure plans. C.4. Municipal Development Plan (Airdrie City Plan) The City of Airdrie Municipal Development Plan, also known as the Airdrie City Plan was adopted in February 2004 as Bylaw B-04/2004 and set out broad policies to guide development within City limits. The theme of the Airdrie City Plan was the Triple Bottom Line of social well being, environmental responsibility and fiscal accountability (City of Airdrie, 2004b). The policies relating to environmental sustainability were the most relevant to this project. The Airdrie City Plan recognized that urban development had environmental consequences and set a direction for the City to be a leader in environmental management. The plan recognized that environmentally sensitive areas should be retained in their natural state or protected from incompatible development. Specifically the plan stressed a pro-active approach to identifying and protecting sensitive areas in early stages of the planning process: Environmental considerations form an integral part of the local planning process. Lands identified as having environmental significance or hazardous properties should be identified and addressed in the preliminary planning stages, protected or permitted to continue to perform their natural functions (Section 1-2 Environmental Responsibility). The Airdrie City Plan set out specific policies to ensure environmental responsibility in the development process. Policies relevant to this study include: Policy Developers shall be required to demonstrate how proposed construction projects and new developments contribute to community health, utilize environmentally sound practices and conserve resources. O2 Planning + Design Inc. 91
100 Policy All development shall respect and maintain the integrity of the Nose Creek Corridor and Environment. Policy All Community Area Structure Plans and Neighbourhood Structure Plans submitted for review shall be accompanied by an Environmental Impact Assessment (Phase 1) and describe what follow up measures are required including determining whether a Phase 2 and/or Phase 3 assessment is required. Policy Major drainage and watercourses shall be protected from development, dedicated as environmental reserve and integrated into urban development in a manner which minimizes disruption of the natural drainage system. Policy No development other than parks shall be permitted to occur within the floodway of Nose Creek. Policy All new developments shall be required to regulate and control surface runoff during and following construction and shall include the incorporation of treatment for storm water runoff designed to improve the quality of the runoff entering the receiving body. Policy The City shall endeavor to retain and improve the natural functions and habitat as well as improve the recreational and scenic qualities of watercourses. C.5. Structure Plans After annexation and the transfer of land from one jurisdiction to another, the next level of municipal planning policy involves the implementation of structure plans. These plans provide more specific detail regarding the development framework than what is provided in the Municipal Development Plan. There are two types of structure plans, Community Area Structure Plans (CASPs) and Neighbourhood Structure Plans. These are also termed Community Plans and Neighbourhood Plans (City of Airdrie, 2008b).The primary difference between the two plan types is in the scale and level of detail provided. Community Plans provide the link between the Airdrie City Plan and the ultimate design of neighbourhoods in the City. Neighbourhood Plans address planning issues on a more detailed level and are required by the City of Airdrie prior to redesignation and subdivision (City of Airdrie, 2008b). The framework for CASPs is established within Section 633 of the Municipal Government Act. Specifically Section 633 of the MGA states that structure plans must describe: The sequence of development proposed for the area The land uses proposed for the area, either generally or with respect to specific parts of the area The density of population proposed for the area, either generally or with respect to specific parts of the area General location of major transportation routes and public utilities Any other matters Council considers necessary The CASP is used to define the broad characteristics of large subdivisions, ensuring that they conform to policies set forth in the Municipal Development Plan. Within the designated CASPs, the City requires that developers submit Neighbourhood Structure Plans (Neighbourhood Plans). Neighbourhood Plans outline development plans at a finer scale, describing such elements as the location of parks and trails, architectural guidelines and road layouts. O2 Planning + Design Inc. 92
101 Of particular relevance to this study are structure plan policies pertaining to open space, which include the following: At the subdivision stage, the City of Airdrie will require each developer to provide up to 10% of the gross developable land as municipal reserve or municipal school reserve. Developers shall be required to demonstrate, at the Neighbourhood Plan stage, how continuity of the linear open space and pathway system will be achieved. C.5.1. Existing Community Area Structure Plans (CASPs). C Northeast CASP The Northeast Airdrie CASP was adopted in September It consisted of three quarter sections in the northeast corner of current City Limits. The QEII Highway separates the western quarter section from the two eastern quarter sections. The CASP called for development of a mixed-use commercial area incorporating modern business park elements in areas west of the QEII highway. Areas east of the highway were proposed for business and light industrial uses with opportunities for highway commercial uses along QEII and Veterans Blvd (City of Airdrie, 2007). C Northwest CASP The Northwest Airdrie CASP was adopted in January, It comprised two quarter sections bounded by Veterans Blvd to the south and 8 th Street NW to the east. The CASP described a mix of general residential and multi-family residential units. The Nose Creek floodplain area was set aside as open space. Pedestrian linkages were proposed within and between residential areas (City of Airdrie, 2006c). C West Airdrie CASP The West Airdrie CASP was adopted by City Council in June, It was bounded by 1 st Avenue to the north, Yankee Valley Boulevard to the south, 24 th Street to the west and 8 th Street to the east, and encompasses an area of hectares. (City of Airdrie, 2005d). Developments began in the northeast, southeast and northwest corners of the plan area and are currently moving towards the centre and southwest. Development within this CASP is predominantly low density single family residential with small clusters of multi-family developments. The West Airdrie CASP outlined a linear park system centered around a series of artificial canals. Consistent with CASP policies, linkage of this park system into a larger open space plan was outlined. C Luxstone Park Estates CASP Adopted in November, 2003, the Luxstone Park Estates CASP covered an area of 103 hectares. It was bounded by undeveloped land to the north, Yankee Valley Boulevard to the south, 8 th Street to the West and the CP Rail lines to the east. Development began in the south and is moving northwards. Most of the plan area is developed at this time, with small areas in the centre and northeast still under construction. In keeping with CASP policy a linear open space area was provided. It runs from north to south through the centre of the plan area (City of Airdrie, 2004d). C Coopers Town CASP The Coopers Town CASP was adopted in August It covered an area of 174 hectares and was bounded on the north, south, west and east sides by Yankee Valley Boulevard, open farmland, 8 th Street and CP Rail respectively. The Coopers Town CASP accommodated a mix of residential housing types and incorporated linear open space features. Completed development exists in the northern part of the plan area and is moving south along land adjacent to the CP Rail line (City of Airdrie, 2006b). C Chinook Winds CASP The Chinook Winds CASP was adopted in January, It consisted of six quarter sections of land in the southwest corner of current City limits. It is bounded on the north by Yankee Valley Blvd; on the east O2 Planning + Design Inc. 93
102 by 8 th St SW and on the west by 24 th St SW. The Plan described a mix of general residential, multi-family residential and mixed use (City of Airdrie, 2005b). C South Airdrie CASP Adopted in June, 2003, the South Airdrie CASP covered 321 hectares of land. It was bounded on the north, south, west and east sides by Yankee Valley Boulevard, 208 th Avenue, 8 th Street and the QEII Highway respectively. It did not include the area already defined by the Coopers Town ASP. Areas between the CP Rail line and the QEII Highway were being developed as a mix of light industrial and commercial usages with a series of green space areas along Nose Creek. Areas west of the CP Rail line were being developed as a mix of low and medium residential with some light industrial in areas adjacent to the CP Rail line (City of Airdrie, 2005c). C South East Airdrie CASP The Southeast Airdrie CASP was adopted in July, It occupied an area of approximately six quarter sections bounded on the north by Yankee Valley Blvd; on the west by the QEII Highway and on the south and east by current City limits. The Plan described a mix of residential, industrial and commercial development. Industrial and commercial development was to be located in areas adjacent to the QEII Highway. General and mixed residential was designated for the remaining areas of the Plan (City of Airdrie, 2004c). O2 Planning + Design Inc. 94

103
104
105
106
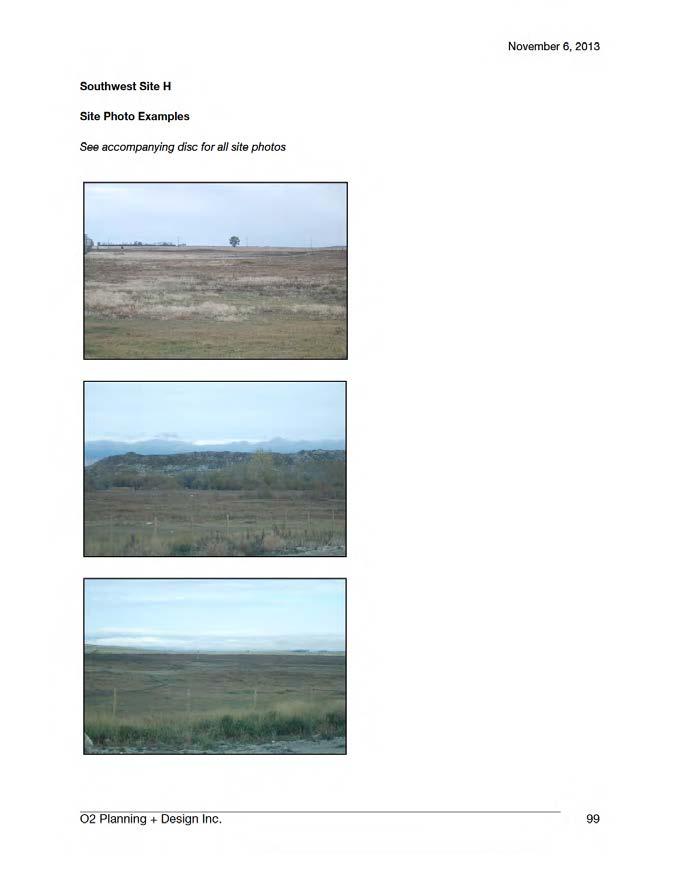
107
108
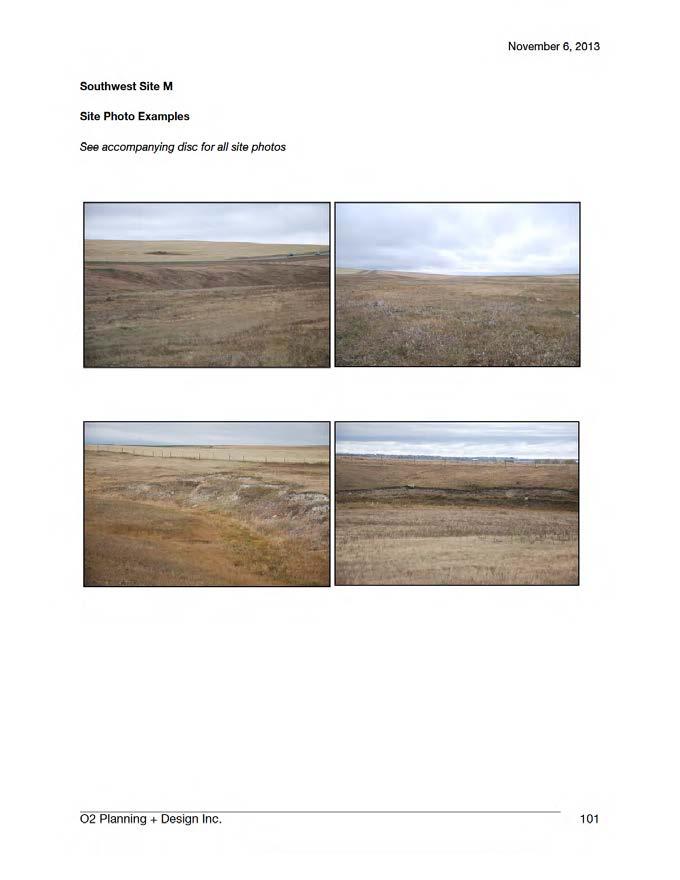
109
110
111
112
113
114 APPENDIX E. ECOLOGICAL INVENTORY SUPPLEMENTARY REPORT O2 Planning + Design Inc. 106
115 EXECUTIVE SUMMARY In 2009, O2 Planning and Design (O2) completed an ecological inventory and environmental best practices study for the City of Airdrie. This report identified key ecologically significant areas within undeveloped parts of the City and in the planned annexation area. These areas were also ranked and prioritized based on a number of ecological variables. Since the submission of the original report, the City of Airdrie has added new land to the annexation area, specifically, 10 quarter sections along the northern edge of the former annexation boundary. This ecological inventory supplement addresses these 10 quarter sections and provides updated maps and analyses within their boundaries and for the study area as a whole. Geographic Information Systems data and related spatial analyses were extended to the northern 10 quarter sections. Using methods identical to those previously applied by O2, the ecological inventories and relative scores of all previously identified areas were also re-calculated to reflect their importance and ranking in relation to the entire city including the expanded area. Recommendations for protection were also updated accordingly. The key finding of this study was that the expansion of the annexation area significantly expanded the size of an ecologically significant area (ESA) identified in the 2009 study. This ESA, which formerly was contained to just the Nose Creek floodplain within the previous annexation boundary, now extends further northward and westward along Nose Creek and Writing Creek respectively. The significant increase in the size of the ESA affected its ranking relative to other ESAs identified in the 2009 report. The ESA in the northern annexation area was ranked first or tied second depending on the scoring methodology used. The ESA was also found to have high connectivity potential to existing open space networks and to be under pressure from development trends In light of these findings the recommendation is to include the identified ESA in the northern annexation area as a priority area for conservation and open space within future planning and development in the City of Airdrie. O2 Planning + Design Inc. i
116 TABLE OF CONTENTS EXECUTIVE SUMMARY... I TABLE OF CONTENTS... II LIST OF FIGURES... III LIST OF TABLES... IV LIST OF ACRONYMNS... V 1. INTRODUCTION PURPOSE AND SCOPE BACKGROUND STRUCTURE OF REPORT STUDY AREA PROFILE STUDY AREA LOCATION STUDY AREA -- LANDSCAPE CONTEXT Regional Context Terrain and Drainage Wetlands STUDY AREA - LAND USE AND LAND COVER (LULC) Introduction Generalized LULC Results Generalized LULC -- Northern Annexation Area (664 Ha.) IDENTIFICATION OF ECOLOGICALLY SIGNIFICANT FEATURES INTRODUCTION ECOLOGICALLY SIGNIFICANT FEATURES Riparian Corridors Natural / Semi-Natural Grassland Steep Slopes Trees and Shrubs Wetlands Wetland Complexes Natural Feature Size Class Analysis Wildlife Stepping Stone Analysis Flood Risk Data IDENTIFICATION AND RANKING OF ECOLOGICALLY SIGNIFICANT SITES PRELIMINARY SITE IDENTIFICATION GIS SITE IDENTIFICATION Calculation of Ecological Significance Values Non-Weighted Ecological Significance Value Analysis Weighted Ecological Significance Value Analysis Spatial Definition of ESA Boundaries ECOLOGICAL INVENTORY AND FIELD OBSERVATIONS WITHIN DEFINED SITES Ecological Significant Area Expansion -- Northwest Site P RANKING OF ESAS Key Ranking Criteria Additional Ranking Criteria Proximity to Existing Open Space Proximity to New Communities, Active Development and Future Development Final ESA Ranking Results Recommendations REFERENCES...35 APPENDIX A: SITE PHOTOS...37 O2 Planning + Design Inc. ii
117 LIST OF FIGURES Figure 1 -- Regional Study Area... 3 Figure 2 -- Northern Annexation Extension Study Area... 4 Figure 3 -- Terrain, Drainage and Flood Prone Areas... 5 Figure 4 -- Wetlands... 6 Figure 5 -- Generalized Land Use and Land Cover... 8 Figure 6 -- Ecological Inventory Elements: Natural and Semi-Natural Features Figure 7 -- Flood Zones, Wetland Complexes and Wildlife Stepping Stones Figure 8 -- Natural Feature Size Distribution Figure 9 -- Preliminary Areas of Interest for Northern Annexation Area Figure GIS-Identified Ecologically Significant Areas -- Non Weighted Analysis Results Figure GIS-Identified Ecologically Significant Areas - Weighted Analysis Results Figure GIS-Defined Ecologically Significant Area Boundaries Figure Ecological Inventory Map -- Northwest 'Site P' Expansion Figure ESA Ranking Map (Non-Weighted ESA Analysis). Updated to reflect northern annexation area addition Figure ESA Ranking Map (Weighted ESA Analysis). Updated to reflect northern annexation area addition Figure Final ESA Ranking (Non-Weighted) Figure Final ESA Ranking (Weighted) O2 Planning + Design Inc. iii
118 LIST OF TABLES Table 1 -- Generalized LULC within the Northern Annexation Area... 8 Table 2 -- Ecological Inventory Significance Input Scoring Values Table 3 -- Non Weighted ESA Ratings: 2009 and 2012 Recalculation Table 4 -- Weighted ESA Ratings: 2009 and 2012 Recalculation Table 5 -- Non-Weighted ESA Ratings - Effects of Open Space Connections and Development Pressures on Rank Table 6 -- Weighted ESA Ratings - Effects of Open Space Connections and Development Pressures on Rank O2 Planning + Design Inc. iv
119 LIST OF ACRONYMNS DEM -- Digital Elevation Model ESA -- Ecologically Significant Area GIS -- Geographic Information Systems LULC -- Land Use and Land Cover O2 Planning + Design Inc. v
120 O2 Planning + Design Inc. vi
121 1. INTRODUCTION The City of Airdrie has continued to experience growth since the original ecological inventory study prepared by O2 on behalf of the City of Airdrie was completed in 2009 (O2, 2009). Areas annexed into the City of Airdrie from Rocky View County on March 22, 2012 included 10 quarter sections of land that were not part of the study area when the original ecological inventory study was undertaken in This northern annexation extension as well as its context within the entire City of Airdrie is the main focus of this supplemental report. 1.1 Purpose and Scope The purpose of this study is to update the ecological inventory within the northern 10 quarter sections, identify any new clusters of ecologically significant features, and adjust the ranking of these areas based on mapping and spatial analyses conducted within the new study area. 1.2 Background The new study area encompasses 10 quarter sections of land representing an area of 6.64 km 2 (664 hectares) between the south edge of Township Road 274 and the northern edge of the former annexation area used in the 2009 ecological inventory study. The specific quarter sections of interest extend from Township 27, Range 01, Section 22 NW in the west, to Township 27, Range 29, Section 24 NW in the east (Figure 1). 1.3 Structure of Report Chapter 2 presents an overview of the current state of the north annexation area based on results from a generalized land use and land cover (LULC) analysis. The LULC analysis describes the distribution of commercial, industrial, and residential land use as well as agricultural land, parks, green space, and natural areas. Chapter 3 provides a review of the methods used to identify and create updated GIS datasets of key ecological features, such as steep slopes, wetland complexes, wildlife stepping-stones, and green corridors within the northern annexation area Chapter 4 presents the results of an updated City-wide ecological inventory ranking, which accounts for the features mapped in the northern annexation area. O2 Planning + Design Inc. 1
122 2. STUDY AREA PROFILE 2.1 Study Area Location The project study area encompasses 10 quarter sections of land representing an area of 6.64 km 2 (664 hectares) between the south edge of Township Road 274 and the northern edge of the former annexation area used in the original study (Figure 1 and Figure 2). The study area represents land added to the annexation area since the original 2009 ecological inventory study was completed. 2.2 Study Area -- Landscape Context Regional Context The greater Calgary region including Airdrie spans both the Parkland Natural Region and the Grassland Natural Region (Natural Regions Committee, 2006). Natural subregions present include thefoothills Parkland, Central Parkland and Foothills Fescue Natural Subregions (Natural Regions Committee, 2006). The study area is almost entirely in the Foothills Fescue Natural Subregion (Natural Regions Committee, 2006). The western edge of the study area occupies the transition zone between the Foothills Fescue and the Central Parkland. Dominant soils are Chernozems, that support grassland vegetation communities including rough fescue, blue bunch fescue, and oat grass (Natural Regions Committee, 2006) Terrain and Drainage The northern annexation extension is within the Nose Creek watershed. Nose Creek flows from north to south and the surrounding topography reflects this. High ground is located along the western and eastern fringes of the study area with low ground in proximity to the Nose Creek channel (Figure 3). Terrain is level to gently undulating and becomes more rolling in western parts of the study area. Steep slopes occur along Writing Creek which flows from west to east from the western edge of the northern annexation extension into Nose Creek at Township 27, Range 1, Section 23 NE. Maximum elevations (> 1140 metres) occur in both the northwestern and northeastern edges of the northern annexation extension. The minimum elevations (1084 metres) are located in the Nose Creek floodplain. Alberta Environment has identified areas of Nose Creek prone to flooding and has established boundaries for the floodway and flood fringe (Figure 3) Wetlands Wetlands occur in poorly drained parts of the northern annexation area. Wetlands are primarily a mix of small cultivatedmarshes 1 and dugout features. The most significant wetland feature is a 1.59 hectare marsh wetland located along the western edge of Township 27, Range 1, Section 24 NE (Figure 4). 1 Marsh Worked class according to the Ducks Unlimited wetlands inventory O2 Planning + Design Inc. 2
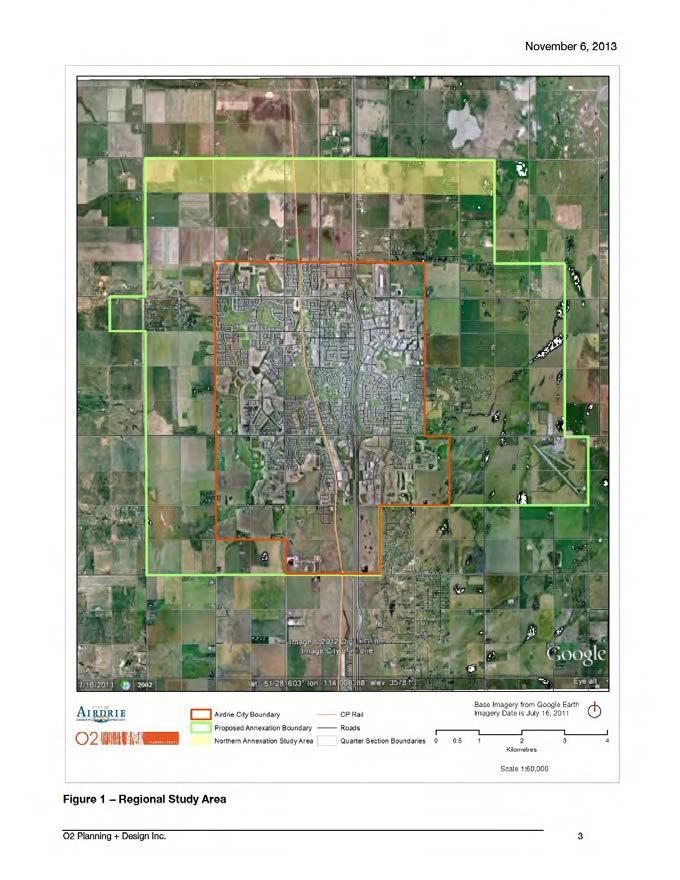
123
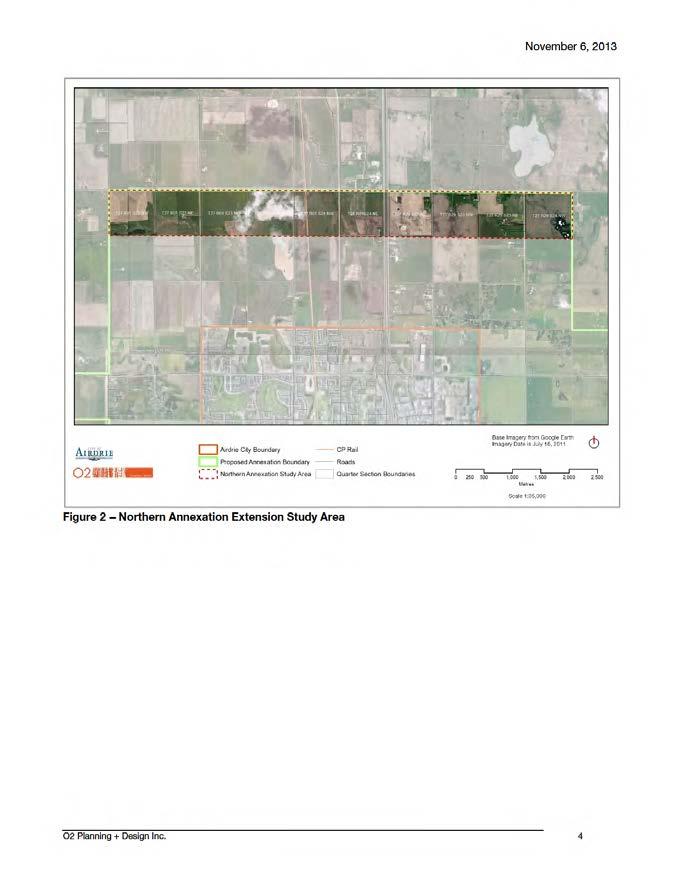
124
125
126
127 2.3 Study Area - Land Use and Land Cover (LULC) Introduction Prior to identifying specific ecologically significant landscape elements, a land use and land cover (LULC) update was performed in and around the northern annexation extension. The LULC layer created in the original 2009 ecological inventory study was re-interpreted over geo-referenced 2011 Google Earth Imagery. Any outdated land classes were reassigned to reflect the updated ground conditions. Within the northern annexation area no LULC changes were required. Some parts of the City of Airdrie classified as new development in 2009 were reassigned to developed land based on an interpretation of the satellite imagery. A detailed technical description of LULC methodology is provided in Appendix B of the original 2009 ecological inventory study Generalized LULC Results. The updated LULC classification uses 13 broad classes. Each of the 13 classes is sourced from a larger number of sub-classes derived from GIS data, image interpretation, field observations, or a combination thereof. The broad LULC classes area as follows: Roads Rail Rural Farmstead Developed Land -- Commercial Developed Land -- Industrial Developed Land -- Residential New Communities -- Cleared Land or Land under Construction Undifferentiated Urban / Anthropogenic Cropland Grassland Trees Water (Includes Open Water Wetland Zones) Wetlands (Marsh) Generalized LULC -- Northern Annexation Area (664 Ha.) Generalized LULC for the northern annexation area is shown in Figure 5. LULC analysis is also mapped outside the study area bounds to provide a better regional context in LULC maps. Table 1 also contains a statistical summary of the relative proportion of each class within the northern annexation area only. O2 Planning + Design Inc. 7
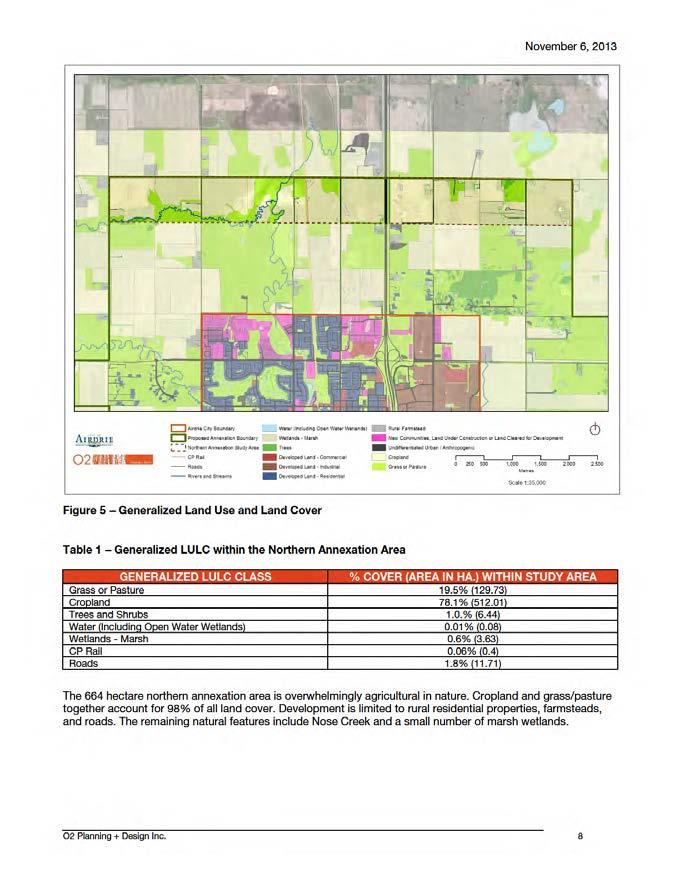
128
129 3. IDENTIFICATION OF ECOLOGICALLY SIGNIFICANT FEATURES 3.1 Introduction This section presents the GIS-based ecological inventory, which addresses natural features such as slopes, riparian corridors, woodland areas, wetlands and data relating to wildlife habitat. Ecological Inventory data for the northern annexation extension was created by first separating the updated Land Use Land Cover (LULC) layer into natural and non-natural landscape features. Specific features of ecological significance were then identified from the natural land cover classes. 3.2 Ecologically Significant Features The following features were identified as priority elements to be identified and compiled as GIS datasets: Riparian Corridors Natural / Semi-Natural Grassland Patches Steep Slopes Trees and Shrubs Wetlands Wetland Complexes Wildlife Connectivity Features ( Stepping Stones ) Areas Prone to Flooding The methodologies used to identify and capture these elements are described in detail in Chapter 3 of the original 2009 ecological inventory report, but are also briefly summarized in the following sections. Updates were applied to the original LULC layer prior to extraction of ecological inventory features. This ensured that changes in the ground condition were properly reflected in the LULC layer Riparian Corridors Riparian corridors (Figure 6) were identified through the interpretation of georeferenced 2011 Google Earth imagery as well as the 2008 City of Airdrie and 2007 Rocky View County aerial imagery used in the original ecological inventory study. Attention was paid to ground condition changes between these datasets that might affect the accuracy of pre-existing ecological inventory data in the northern annexation area. Riparian corridors were digitized from the airphotos at a scale of 1:5000 for the original ecological inventory study. The imagery was used to verify these corridors within the northern annexation area, and any required changes to GIS data were performed in an ArcMap edit session Natural / Semi-Natural Grassland While it was not possible to identify native grasslands from aerial photography, an attempt was made to interpret and digitize patches of natural, semi-natural grassland or rangeland. Although they do not have the true habitat value that large patches of native grassland would offer, they nonetheless represent large areas of open cover that can facilitate wildlife movement as well as offering benefits for soil stability and water management (Figure 6) Steep Slopes Steep slopes were identified using GIS analysis performed on a 10m Digital Elevation Model (DEM). The Surface Analysis -- Slope function in ArcGIS Spatial Analyst was used to create slope layers from the DEM data. These slopes were then reclassified to show only slopes exceeding 15% in grade (Figure 6). Editing was O2 Planning + Design Inc. 9
130 performed on the output steep slope polygons to remove edge artifacts and man-made features such as highway interchanges and rail embankments Trees and Shrubs Initial identification of woodland areas was performed by digitizing polygons around larger stands visible in air photos. These digitized woodland areas form part of the generalized LULC analysis. Extraction of tree stands in high detail using manual air photo interpretation was not practical. Despite the relatively small study area, there are many hundreds of tree and shrub clusters. Instead, an automated moving window analysis was performed on the airphoto data to detect areas of high variance. Large variation in image colour and texture in a small area can be used to detect areas of high landscape heterogeneity. Stands of trees and shrubs located in comparatively featureless grass or agricultural fields are uniquely suited to this kind of detection algorithm. Variance in the Airdrie 2008 and Rocky View County 2007 air photo imagery was extracted using a 3x3 moving window in ArcGIS Spatial Analyst to obtain the standard deviation of image pixel values within the window. The values were then squared and the resulting raster output was classified into 25 classes using an unsupervised classification in Erdas Imagine. Classes corresponding closely to the location of tree stands were isolated and exported as GIS polygons. Some manual editing was required to remove misclassified features. The features were also verified against 2011 Google Earth imagery to ensure that they still accurately reflected the ground condition in the northern annexation area (Figure 6) Wetlands Wetland data was extracted directly from Ducks Unlimited GIS datasets provided for the 2009 ecological inventory study. Inclusion in the wetland ecological inventory was restricted to features identified by Ducks Unlimited as being either open water, marsh or worked (agricultural) marsh. The smaller worked agricultural marshes do not have the higher biodiversity of the other classes, but they still perform important ecological and watershed functions (e.g., flood control, water quality improvement, etc.). However, dugouts and other manmade features were not included in the wetland ecological layer (Figure 6) Wetland Complexes Wetland complexes are defined as areas consisting of two or more wetlands connected within 200m where the total wetland surface is greater than 5 hectares. Wetland complexes were identified by reclassifying the generalized land cover map into a simple binary raster image, in which all wetland and floodplain features were assigned a value of 1, and all other classes were assigned a value of 0. Wetland features were assigned unique identifiers using the ArcGIS Region Group function. A Euclidean distance analysis was then performed on the wetlands to a distance of 100 metres. The output raster features were assigned a value of 1 and assigned unique wetland complex identification numbers. Complexes were retained if they contained two or more wetlands with a combined area equal to or exceeding 0.5 hectares. Selected complexes were exported as shape files and used in the ecological inventory ranking analysis (Figure 7). Wetlands within such complexes were assigned a higher score due to the higher ecological value inherent in connected wetland areas Natural Feature Size Class Analysis One component of ecological inventory analysis was the relative size distribution of natural features (natural patches). Landscapes may contain a few large features, numerous small features or a mix of both (Figure 8). To perform this analysis, the generalized LULC features were divided into natural classes (grasslands, lakes, rivers wetlands and trees) and non-natural classes (built up areas, roads, rail, and crop land). Features were converted to a binary raster with natural features assigned a value of 1 and non-natural features assigned a value of 0. The binary raster was grouped using the Region Group tool in ArcGIS Spatial Analyst using a spatial connectivity setting of four. This ensures that cells from two features that are connected only by the diagonal corners of individual pixels are not considered as one group. The resultant natural clusters were converted to polygons and classified into discrete size classes: O2 Planning + Design Inc. 10
131 <2 ha ha ha ha ha >10000 ha Wildlife Stepping Stone Analysis Natural patches that are isolated from one another can still function as part of a wildlife corridor depending on the characteristics, size and relative distance to neighbouring patches. Separated patches that act as a connected corridor are termed stepping stones. This concept is highly species specific (as are the natural patch requirements). For this analysis, stepping stone analysis was performed for two broad species groups; small mammals and meso-carnivores (Figure 7). Natural patch features between 2 and 100 hectares in size were identified as potential small mammal stepping stones, while natural patches 100 to 1000 hectares in size were identified as potential meso-carnivore stepping stones. The connection criteria required were, for small mammals, a distance of less than 200 metres from another natural patch 2 to 100 hectares in size. For meso-carnivores, a distance of less than 500 metres from another natural patch 100 to 1000 hectares in size was required. Natural patches which met the size requirements to be stepping stones but did not have the requisite connection distance were defined as isolated stepping stones. In the ecological inventory assessment, natural features which qualify as wildlife stepping stones were assigned a higher score Flood Risk Data Alberta Environment Nose Creek flood zone GIS data was used as the final ecological inventory component. The floodway and flood fringe GIS data were used (Figure 7). The floodway is the area of most risk and indicates an area where development, other than open space is not permitted. Inclusion of the flood data as ranking criteria for ecologically sensitive areas reflects the importance of considering flood prone areas in both planning and environmental protection. In the ecological inventory analysis, features which fall within the floodway and flood fringe are scored higher. O2 Planning + Design Inc. 11
132
133
134
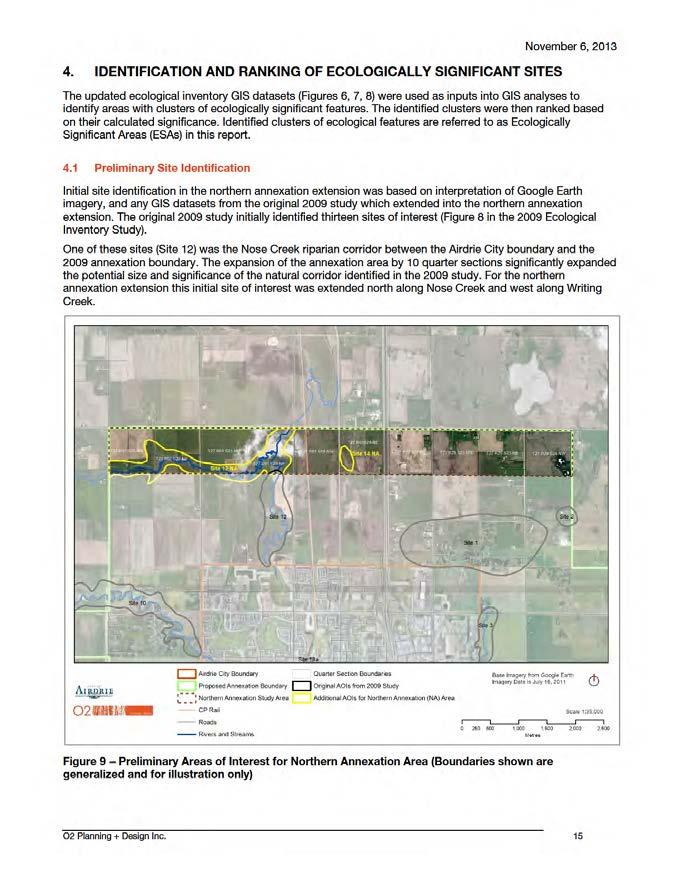
135
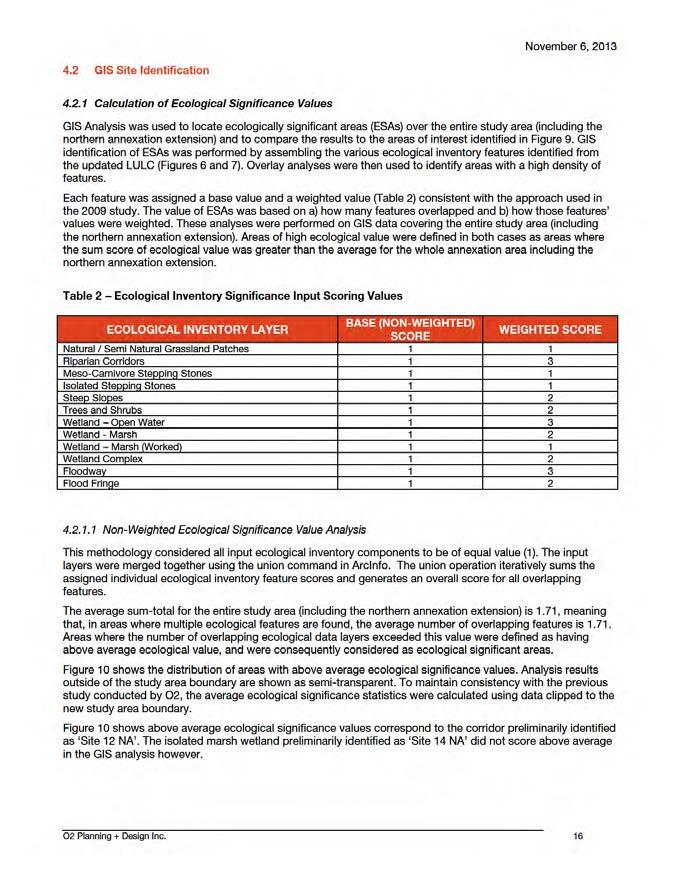
136
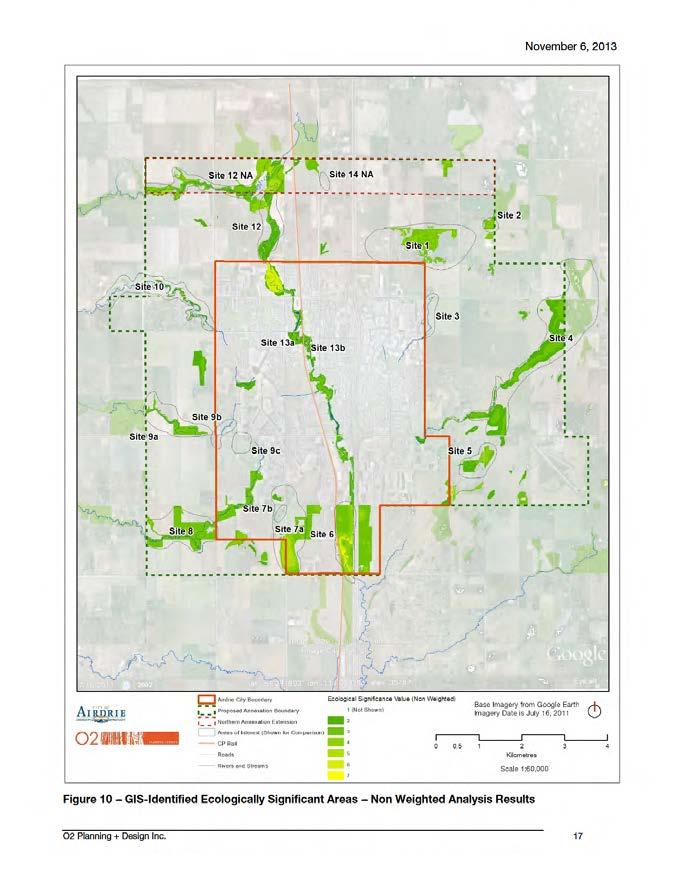
137
138 Within the northern annexation extension, the area identified as Site 12 NA has above average ecological significance values. The highest values (4 to 5) occur along the western portion of the Writing Creek corridor. The inner riparian zones of the Nose Creek corridor also score well above average (4 to 5). The ecological values in the remainder of the study area are the same as those presented in the 2009 study Weighted Ecological Significance Value Analysis The ecological significance values were recalculated and remapped using the weighted scoring scheme (Table 2). The weighted values recognize that certain ecological inventory elements are significantly more important than others. The weighted values were based on the relative value of each feature s potential ability to provide ecological services. Details on the decision processes used to determine these weighting values can be found in Section of the original 2009 ecological inventory report. The weighted analysis produces the same pattern of ESAs as the non-weighted analysis. Within the northern annexation extension, the weighted analysis more clearly identifies specific areas of the Writing Creek and Nose Creek corridors with high ecological values. Figure 11 shows the distribution of areas with above average weighted ecological significance values. Analysis results outside of the study area boundary are shown as semi-transparent. The average weighted ecological significance statistics were calculated using data clipped to the new study area boundary. Within the northern annexation extension, the area identified as Site 12 NA has above average weighted ecological significance values. The highest values (7 to 8) occur along the steep slopes of the western portion of Writing Creek. The inner riparian zones within the floodway of the Nose Creek corridor also score well above average (9 to 10). The ecological values in the remainder of the study area are the same as those presented in the 2009 study. O2 Planning + Design Inc. 18
139
140 4.2.2 Spatial Definition of ESA Boundaries The GIS non-weighted and weighted analyses both identified the primary areas of ecological significance in the northern annexation extension, namely, the Nose Creek and Writing Creek riparian corridors. The weighted analysis provided more detail in the calculated ESAs due to the greater range in potential values and strong bias towards highlighting locations within floodplains, riparian corridors and wetlands. Due to the expansion of the study area into the northern annexation area there is potential for changes in the relative scores and ranks of all ESAs in the entire study area. To assess this, new ESA boundaries were created for the ESA in the expanded study area and scores and rankings were recalculated for all ESAs. New ESA boundaries were calculated for the non-weighted (Figure 10) and weighted (Figure 11) analysis results for the new Writing Creek and Nose Creek ESA in the northern annexation extension. These were added to the ESA polygons outside of the northern annexation extension area (unmodified from the 2009 study). The new Writing Creek and Nose Creek ESA in the northern annexation extension was merged with the site previously identified in the 2009 study as NW Site P (Figure 12), significantly increasing its overall size. O2 Planning + Design Inc. 20
141
142 4.3 Ecological Inventory and Field Observations Within Defined Sites GIS-defined ESA boundaries are unchanged in size except for NW Site P which was significantly expanded to include ESA features in the northern annexation area. An updated ecological inventory summary for NW Site P follows. Ecological Inventory summaries for the unchanged ESA sites can be reviewed in Section 4.3 of the original 2009 report Ecological Significant Area Expansion -- Northwest Site P The expansion of the annexation area northward by 10 quarter sections considerably expands the size of the ecologically significant area identified in the 2009 study as Northwest Site P. Previously confined to the Nose Creek floodplain north of the City of Airdire boundary, this ESA now extends along Nose Creek by one quarter section but also branches west to follow the riparian corridor of Writing Creek. With the exception of a few road crossings this ESA now represents one of the largest natural corridors in the entire study area (Figure 12). This expanded ESA site stretches over ten quarter sections of land, one within Airdrie City limits and nine in Rocky View County (Figure 12). The GIS analyses identified a primary ESA corridor along Nose Creek. This ESA corridor starts at the northwest corner of Veterans Boulevard and 8 th Street NW and extends northwards across the City of Airdrie boundary into Rocky View County (Figure 13). A secondary ESA corridor connects to the Nose Creek corridor from the west via Writing Creek. This meandering corridor occupies six quarter sections of land before merging with the Nose Creek corridor in Township 27, Range 1, Section 23 NE and Township 27, Range 1, Section 23 SE. The GIS-based ecological inventory for the expanded NW Site P ESA is as follows (Figure 13): Small Mammal Stepping Stone Meso Carnivore Stepping Stone Wetland Complex Riparian Corridor Floodway Flood Fringe Trees and Shrubs Steep Slopes Marsh Wetlands Natural / Semi-Natural Grassland GIS models showed that the entire length of the Writing Creek ESA as well as the extensive areas at the north and south ends of the Nose Creek ESA corridor are considered to be small mammal and meso carnivore stepping stones (Figure 13). The inner riparian zone along the Nose Creek channel connects these larger wildlife stepping stone areas. The Nose Creek and Writing Creek ESAs represent a network of riparian corridors extending largely uninterrupted from the developed part of northwestern Airdire to the rural regions of the annexation area. Along most of the Nose Creek ESA the floodway corresponds to the outer edge of the ESA while the flood fringe extends a substantial distance beyond the mapped ESA boundary. The south end of the Nose Creek corridor ESA within the Airdrie City boundary is part of a larger wetland complex extending from the south (Figure 13). Steep slopes (exceeding 15%) are confined to the western reaches of the Writing Creek ESA corridor in Township 27, Range 1, Section 22 (NW/NE) O2 Planning + Design Inc. 22
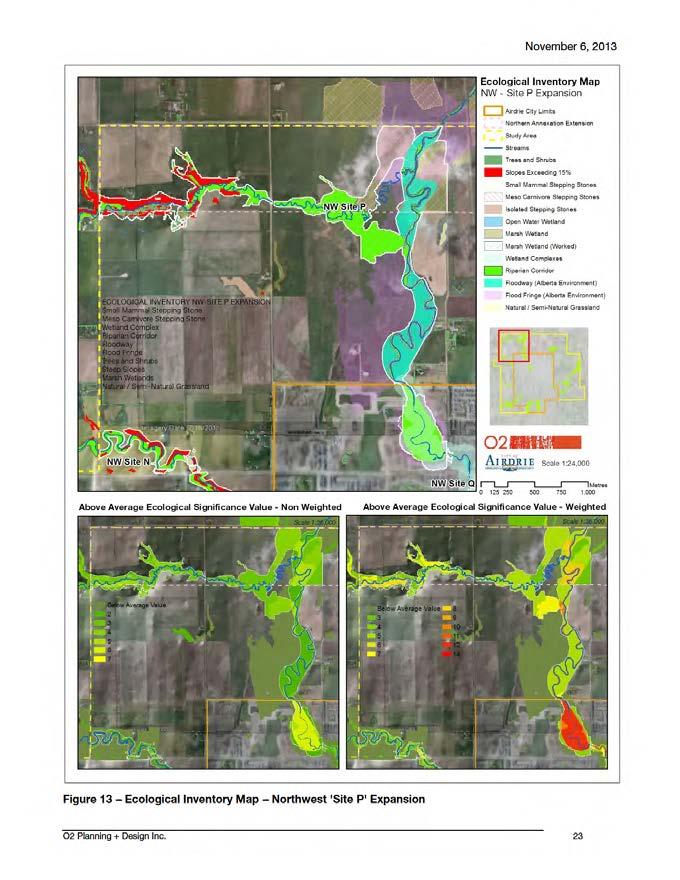
143
144 Due the significant expansion of this ESA into the northern annexation area, the ESA scores were recalculated. The average ESA scores within the expanded NW Site P ESA boundary are 3.5 (non weighted) and 5.7 (weighted). This compares to scores of 3.25 and 6.7 from the 2009 study when this ESA was significantly smaller. The maximum ESA scores are 6 (non-weighted) and 12 (weighted). These are the same as in the 2009 study. The Nose Creek floodplain inside the City of Airdrie boundary (Township 27, Range 1, Section 14 SE) contains the highest scores within the entire ESA boundary. This is unchanged from the 2009 study. However, the northern annexation area contains two additional high scoring areas. The first area is the Nose Creek corridor in Township 27, Range 1, Section 23 NE. The second area is the western portion of the Writing Creek corridor (Township 27, Range 1, Section 22 NW/NE). Both areas score up to 5 (non weighted) and 8 (weighted). A field visit was made to portions of this ESA within the northern annexation extension area in November 2012 (Appendix A) to visually confirm the mapped features. The Nose Creek corridor was observed to occupy a broad undeveloped floodplain. The Writing Creek corridor occupied a narrow sinuous steep-sided valley in its western reaches before entering the broad floodplain of Nose Creek further east. The lack of any development in the surveyed area was notable. Agricultural fields including cropped areas and hay / pasture fields dominated the landscape, with development being confined to rural roads and widely spaced farms. It was apparent that the Nose Creek and Writing Creek corridors have potential to be preserved as open space and present very good opportunities to be connected into the existing City of Airdrie open space network. It should also be mentioned that a former channel and riparian corridor of Writing Creek near the mouth of Nose Creek does not show up as part of the surrounding ESA that envelops it (Figure 13). This area has been heavily impacted by a dugout, diversion, and agricultural land uses. Due primarily to these impacts, this area did not score highly for environmental values. However, this area remains a strategic location for open space due to its surrounding landscape context as well the potential for restoration of the meandering creek Writing Creek channel in this area. If desired, further study of this area can be conducted including more detailed field investigations. 4.4 Ranking of ESAs The 2009 study ESA ranking values were recalculated to account for the expanded ESA in the northern annexation area. As in the 2009 study, the ESA scores were used as the initial basis for ranking the 12 ESA areas. Subsequent ranking exercises also considered connections to existing open space and development pressures Key Ranking Criteria For consistency, the ranking criteria used in the 2009 study were applied to the updated ESAs: Number of ecologically significant features within ESA Average ecological significance value within ESA Maximum ecological significance value within ESA Weighted average ecological significance value within ESA Weighted maximum ecological significance value within ESA Non-Weighted ESA area (ha) Weighted ESA area (ha) Each site was assigned a value from 1 to 12 based on these criteria. Ranking scores for all input criteria were added together and a final rank score from 1 to 12 was assigned to each ESA.The highest average overall ESA was assigned a rank value score of 1 and the lowest was assigned a score of 12. Ranking statistics were calculated on both the non-weighted (Table 3) and weighted (Table 4) data inputs. O2 Planning + Design Inc. 24
145
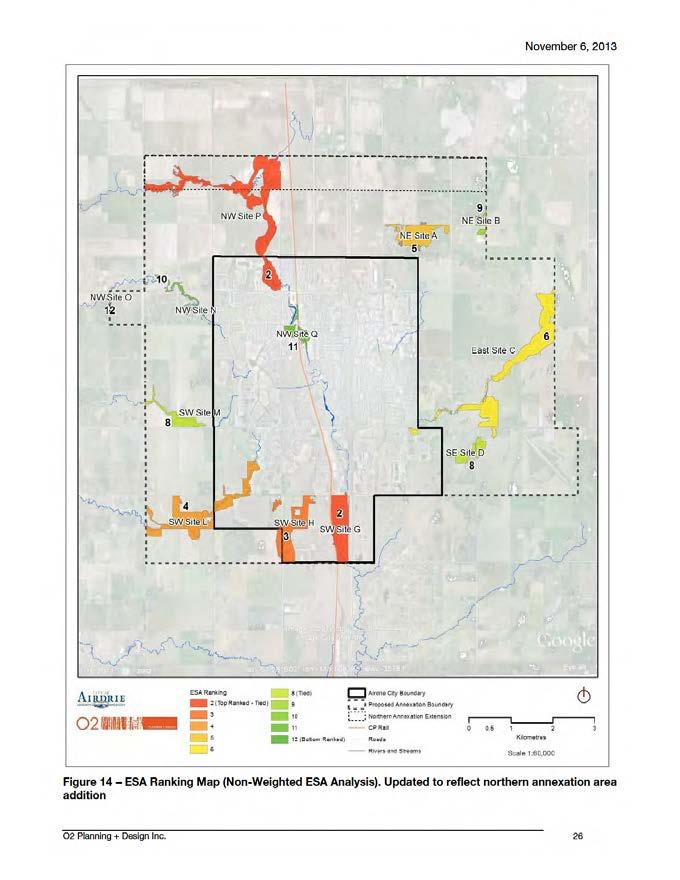
146
147
148
149 4.4.2 Additional Ranking Criteria Consistent with analysis performed in the 2009 ecological inventory study, two additional criteria were factored into the ranking. The first was the proximity of identified ESA boundaries to existing open space and trail networks. The second was the proximity of ESAs to new communities, areas cleared for development or areas under construction as identified in the generalized LULC. The latter was used as an indicator of new and potential development pressures on the identified ESAs Proximity to Existing Open Space ArcGIS was used to identify locations where ESAs adjoined existing open space. GIS data for parks, open space and green space were combined into a single layer. A spatial location selection was performed between this layer and both the weighted and non-weighted ESA boundaries. A buffer of 10m was applied to the spatial selection to account for typical road widths. Green areas bisected by roads can still be considered connected in the context of a larger linear recreational open space networks. The spatial selection identified four ESA boundaries (both weighted and non-weighted) which had edges 10m or less from an existing open space element. These included SW Site G, SW Site L, NW Site P and NW Site Q. In addition the weighted ESA boundaries for East Site C and NW Site N were also within 10m of existing open space. ESAs connected to existing open spaces were assigned an extra point in a new open space ranking category. This point was then considered in the overall average ranking. This does not imply that the entire area within the ESA boundaries should be designated as open space. It merely recognizes and acknowledges the recreational potential of active connections to ecologically significant areas by an existing network of parks, trails, green corridors and recreational areas Proximity to New Communities, Active Development and Future Development ArcGIS was used to identify ESAs in close proximity to areas that matched the following criteria: New Communities (developments completed since the 2009 study) Active Development (areas under construction as interpreted from Google Earth imagery and updated in the LULC GIS layer used for this study) Future Development (areas cleared for development as interpreted from Google Earth imagery and updated in the LULC GIS layer used for this study) These areas are used to indicate development pressures associated with identified ESAs. Cleared areas represent the outer edge of development and indicate the general direction in which similar development will spread in the future. New communities represent priority areas for extension of the existing open space network to serve new recreational needs. A spatial selection was performed between the ESAs and the updated LULC layer class representing either new communities, active construction or cleared land. Five ESAs were identified as having high pressure from development. These included East Site C, SW Site G, SW Site L, NW Site P and NW Site Q. These sites were assigned an extra point in a new development pressure category. This does not indicate that the entire ESA is under development pressure. ESA edges adjacent to new communities, active construction or cleared land construction may be at the most immediate risk. However, opportunities to secure linear recreational corridors could be jeopardized by not recognizing and securing key areas within all of these affected ESAs at the earliest opportunity Final ESA Ranking Results Table 5 lists the non-weighted ESA ranking before and after proximity to open space and development pressures are accounted for. Because open space and development pressure are just two of several scoring criteria, their presence did not necessarily affect the overall rank of a particular site. O2 Planning + Design Inc. 29
150
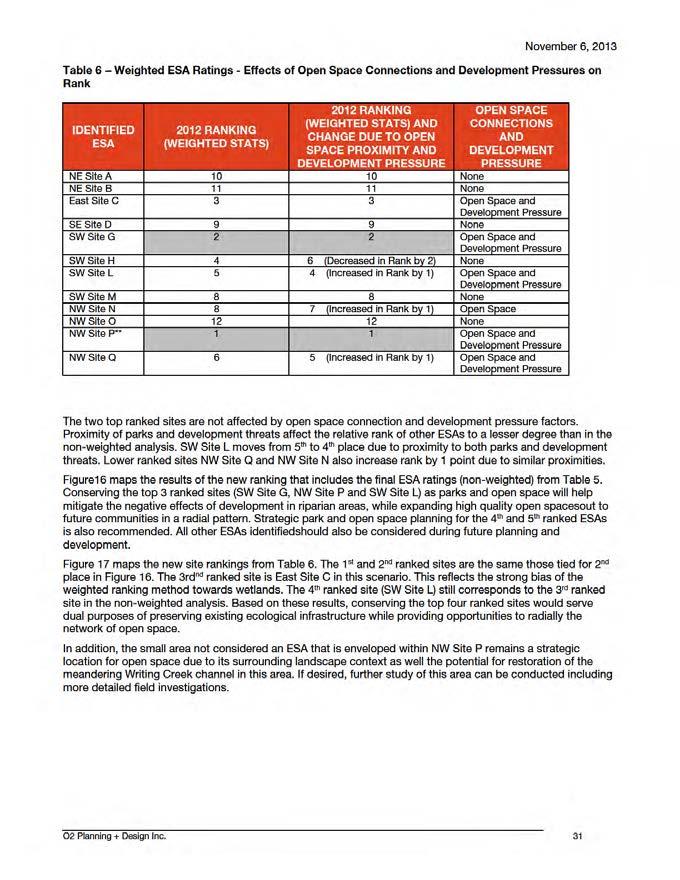
151
152 Recommendations The following recommendation was made in the 2009 ecological inventory report: While efforts should be made to preserve existing ecological inventory in all 12 identified sites, prioritizing efforts in SW Site G, SW Site L, NW Site P and East Site C will have the greatest benefit in the short term due to the high ecological value of these sites and the connections they share with the existing open space network. Furthermore, these four sites are located on the front line of development pressure. Expansion of the study area to include northern annexation extension has significantly changed the rankings of identified ESAs compared to the 2009 ecological inventory study. NW Site P which was previously ranked 3 rd in both non-weighted and weighted 2009 analyses is now the top ranked ESA (2012 weighted analysis) or is tied in 2 nd place with SW Site G (2012 non-weighted analysis). The new recommendations would be to prioritize ecological preservation efforts on NW Site P, SW Site G and SW Site L. These received high ecological rankings, face considerable current or future development pressures and have high potential to be connected into the existing open space network. East Site C which was identified as a priority in the 2009 study should still be a focus however, particularly due to its substantial wetland component. Efforts should be made to preserve the ecological integrity of all 12 identified sites, prioritizing efforts in NW Site P, SW Site G, SW Site L and East Site C. This will have the greatest benefit in the short term due to the high ecological value of these sites and the connections they share with the existing open space network. There is substantial development pressure associated with these four sites, either from recently completed new communities, active construction or planned development. O2 Planning + Design Inc. 32
153
154
155 5. REFERENCES Natural Regions Committee, Natural Regions and Subregions of Alberta. Compiled by D.J. Downing and W.W. Pettapiece. Pub No. T/852. O2, Ecological Inventory Expansion and Environmental Best Practices Report. Final Report Submitted to the City of Airdrie: O2 Planning + Design Inc. O2 Planning + Design Inc. 35
156 O2 Planning + Design Inc. 36

157 APPENDIX A: SITE PHOTOS A field confirmation visit was performed on the afternoon of November 7 th, Photos were taken at key locations in the northern annexation area to record landforms, vegetation, wetlands, and other ecologically significant features identified via desktop GIS analysis. Photographs were taken at key locations accessible by public roads. Due to time constraints and rapidly deteriorating weather and light conditions, photography was limited to areas in close proximity to six locations in the four quarter sections in the western end of the northern annexation area (Figure A1). Figure A1 - Field Confirmation: Key Photo Locations Representative photos from each location are shown in the following sections. O2 Planning + Design Inc. 37
Chapter 5: Natural Resources and Environment
 NATURAL RESOURCES AND ENVIRONMENT 5-1 5 Chapter 5: Natural Resources and Environment BACKGROUND AND INTENT Urban expansion represents the greatest risk for the future degradation of existing natural areas,
THE CORPORATION OF THE CITY OF WINDSOR Office of the City Solicitor Planning Department
 THE CORPORATION OF THE CITY OF WINDSOR Office of the City Solicitor Planning Department REPORT TO THE CITY OF WINDSOR PLANNING ADVISORY COMMITTEE DATE OF REPORT: August 19, 2010 SUBJECT: Official Plan
WASHINGTON COUNTY OREGON
 WASHINGTON COUNTY OREGON LONG RANGE PLANNING DIVISION North Bethany Subarea Stream Corridors: Existing Regulations In Oregon, there is a distinct difference between the land use rules that apply in rural
Phase I Ecological Network Report Terms of Reference
 Phase I Ecological Network Report Terms of Reference INTRODUCTION In 2007, the City of Edmonton created a new Natural Area Systems Policy (C-531) and a strategic plan, Natural Connections. Together, these
Riparian Buffer on the Bushkill Creek. Policies
 Riparian Buffer on the Bushkill Creek Riparian buffers provide numerous benefits to landowners and the community by protecting groundwater recharge areas, providing flood control, providing stormwater
AREASTRUCTURE PLAN AMENDMENT COCHRANE NORTH
 AREASTRUCTURE PLAN AMENDMENT COCHRANE NORTH In order to implement the vision outlined in the Conceptual Scheme, the following three amendments to the Cochrane North ASP are proposed: 1. Allow commercial
ADDENDUM TO BIOLOGICAL SCOPING SURVEY REPORT, BOTANICAL SURVEY AND WETLAND DELINEATION
 ADDENDUM TO BIOLOGICAL SCOPING SURVEY REPORT, BOTANICAL SURVEY AND WETLAND DELINEATION FOR AVALON INN (APN 069-241-27 & -04) 1201 & 1211 NORTH MAIN STREET FORT BRAGG, CA MENDOCINO COUNTY prepared for:
BLACK/HARMONY/FAREWELL CREEK WATERSHED EXISTING CONDITIONS REPORT CHAPTER 5 IMPERVIOUS SURFACES
 BLACK/HARMONY/FAREWELL CREEK WATERSHED EXISTING CONDITIONS REPORT CHAPTER 5 IMPERVIOUS SURFACES Draft November 2009 TABLE OF CONTENTS 1.0 INTRODUCTION... 3 2.0 STUDY AREA AND SCOPE... 4 3.0 METHODOLOGY...
INTRODUCTION PLANNING HISTORY
 INTRODUCTION The Upper Rock Creek Master Plan Area lies in the east central part of Montgomery County. The Master Plan Area is adjacent to the City of Rockville to the south, the Olney Planning Area to
HAZARD MITIGATION GOALS AND OBJECTIVES
 SEWRPC Community Assistance Planning Report No. 282, 2nd Edition CITY OF MILWAUKEE ALL HAZARDS MITIGATION PLAN UPDATE Chapter IV HAZARD MITIGATION GOALS AND OBJECTIVES [NOTE: Throughout this plan update
STREAM BUFFERS
 88-415 STREAM BUFFERS 88-415-01 PURPOSE In the Kansas City region and throughout the nation, vegetated stream buffers have been clearly shown to protect stream stability and related infrastructure, improve
Zoning Ordinance Article 3
 Article 3 Natural Resources Protection Section 301 Natural Resources Protection 301.1. Purpose - The following natural resources protection standards are established to protect the public health, safety
TIDAPA Structure Plan
 TIDAPA Structure Plan Prepared by Tract Consultants 28 MARCH 2017 0217-0074 Table of Contents 01 STRATEGIC CONTEXT Executive Summary Regional Context Page 3 Page 4 02 LOCAL CONTEXT Aerial Photograph Local
3.10 LAND USE SETTING PROJECT SITE EXISTING LAND USE DESIGNATIONS AND ZONING. General Plan Land Use Designations.
 This section of the Draft EIR addresses the existing land uses on and adjacent to the project site and discusses the potential impacts of the proposed project on existing land uses. Key issues addressed
TOWN OF BRUDERHEIM Report to the capital region board
 TOWN OF BRUDERHEIM Report to the capital region board Introduction to the Town of Bruderheim Municipal Development Plan amendment and Relation to the CRB Evaluation Criteria 02 march 2017 1 Introduction
Chapter 4 - Preparation of Stormwater Site Plans
 Chapter 4 - Preparation of Stormwater Site Plans The Stormwater Site Plan is the comprehensive report containing all of the technical information and analysis necessary for the City to evaluate a proposed
Draft Rhode Island Stormwater Design and Installation Standards Manual
 Draft Rhode Island Stormwater Design and Installation Standards Manual Summary The May 2009 Public Review Draft version of the RI Stormwater Design and Installation Standards Manual consists of approximately
OP Council Resolution June 16, Planning and Development Services
 OP-08-01 Council Resolution June 16, 2008 Planning and Development Services Kingsgate Landing Outline Plan Table of Contents 1.0 Introduction 1 1.1 Purpose of Plan 1 1.2 Plan Area Location 1 1.3 Ownership
Minnesota Department of Natural Resource - Natural Resource Guidance Checklist Conserving Natural Resources through Density Bonuses
 Minnesota Department of Natural Resource - Natural Resource Guidance Checklist Conserving Natural Resources through Density Bonuses NRDB Why Use Density Bonuses & This Checklist Local units of government
Stormwater Standards. Clackamas County Service District No. 1. Planting Guide for Buffers
 Stormwater Standards Clackamas County Service District No. 1 APPENDIX B Planting Guide for Buffers Table of Contents Appendix B - Planting Guide for Buffers... Page B.1 General... 1 B.1.1 Introduction...
MEMORANDUM. September 10, 2018
 September 10, 2018 MEMORANDUM TO: Chad Bird, City of Decorah FROM: Larry Weber and Dan Gilles, Iowa Flood Center, IIHR Hydroscience & Engineering COPY TO: Dana Werner, St. Paul District Corps of Engineers,
Gather information from online resources covering the following topics:
 Assignment #1: Regional Analysis Project Site Location: Greater Boston Area What comprises a region? The many elements within a region comprise the region as a whole. Natural as well as manmade environmental
COUNTY COUNCIL OF PRINCE GEORGE'S COUNTY, MARYLAND SITTING AS THE DISTRICT COUNCIL 2010 Legislative Session. Council Members Dernoga and Olson
 DR- COUNTY COUNCIL OF PRINCE GEORGE'S COUNTY, MARYLAND SITTING AS THE DISTRICT COUNCIL 00 Legislative Session Bill No. CB--00 Chapter No. Proposed and Presented by Introduced by Co-Sponsors The Chairman
Great Lakes Conservation Blueprint for Terrestrial Biodiversity on the Canadian Shield
 Great Lakes Conservation Blueprint for Terrestrial Biodiversity on the Canadian Shield Bonnie L. Henson 1, Kara E. Brodribb 2 and John L. Riley 3 1 Ontario Ministry of Natural Resources 2,3 The Nature
Chapter 3 Site Planning and Low Impact Development
 CHAPTER 3 Site Planning and Low Impact Development Chapter 3 Site Planning and Low Impact Development 3.0 Introduction The City of Charleston requires that major residential, large commercial (>1 acre),
Ten Mile Creek Planning Area
 PLANNING AREA POLICIES TEN MILE CREEK Ten Mile Creek Planning Area Location and Context The Ten Mile Creek Planning Area ( Ten Mile Creek area ) is located south of the current Boise AOCI, generally south
Northern Branch Corridor DEIS December 2011
 16 Floodplains 161 Chapter Overview 1611 Introduction The flowing chapter identifies floodplains found within the Northern Branch Corridor in accordance with Executive Order 11988, Floodplain Management
Rule D Wetland and Creek Buffers
 Rule D Wetland and Creek Buffers 1 Policy It is the policy of the Board of Managers to ensure the preservation of the natural resources, recreational, habitat, water treatment and water storage functions
NORTHEAST RIVER CROSSING FUNCTIONAL PLANNING STUDY
 WELCOME Northeast River Crossing Functional Planning Study Phase 2 Public Meeting 4 to 8 PM Informal drop-in format and discussion tables Meeting Purpose Introduce the Northeast River Crossing Functional
CITY OF KELOWNA MEMORANDUM. Date: June 20, 2001 File No.: Z City Manager Planning and Development Services Department
 CITY OF KELOWNA MEMORANDUM Date: June 20, 2001 File No.: Z00-1033 To: From: City Manager Planning and Development Services Department Subject: APPLICATION NO. Z00-1033 OWNER: ELDORADO RANCH LTD. AT: JIM
THREE-STEP DESIGN PROCESS FOR OPEN SPACE SUBDIVISIONS
 00216106.DOC NMA/RRK 1/30/14 THREE-STEP DESIGN PROCESS FOR OPEN SPACE SUBDIVISIONS Open space subdivisions, sometimes called cluster developments, maintain a significant portion of a development site in
TERRESTRIAL NATURAL HERITAGE SYSTEM STRATEGY APPENDIX F: MODEL POLICIES FOR THE IMPLEMENTATION OF THE TARGET TERRESTRIAL NATURAL HERITAGE SYSTEM
 TERRESTRIAL NATURAL HERITAGE SYSTEM STRATEGY APPENDIX F: MODEL POLICIES FOR THE IMPLEMENTATION OF THE TARGET TERRESTRIAL NATURAL HERITAGE SYSTEM C H A P T E R 1 M O D E L P O L I C I E S F O R I M P L
A New Plan For The Calgary Region June calgary.ca call 3-1-1
 A New Plan For The Calgary Region June 2009 calgary.ca call 3-1-1 Introduction Since January 2006, The City of Calgary has been actively participating with the member municipalities of the Calgary Regional
Rural Land Use Designations Kittitas County December 6, 2007 Draft
 KITTITAS COUNTY COMMUNITY DEVELOPMENT SERVICES 411 N. Ruby St., Suite 2, Ellensburg, WA 98926 CDS@CO.KITTITAS.WA.US Office (509) 962-7506 Fax (509) 962-7682 Rural Land Use Designations Kittitas County
Conservation Corridor Planning and Green Infrastructure Themes
 Conservation Corridor Planning and Green Infrastructure Themes Prepared by the Green Infrastructure Center Inc. and the Northern Virginia Regional Commission February 22, 2011 Brief Overview Project Background
Richton Park Western Development Corridor Green Infrastructure Development Plan August 18, 2017
 Richton Park Western Development Corridor Green Infrastructure Development Plan August 18, 2017 Conservation Design Forum Geosyntec Consultants 403 W. St. Charles Road 1420 Kensington Road, Suite 103 Lombard,
APPENDIX 1: SCOPED ENVIRONMENTAL IMPACT STATEMENT (EIS) FORM
 FORM") APPENDIX 1: SCOPED ENVIRONMENTAL IMPACT STATEMENT (EIS) FORM This form is intended for use by applicants (primarily private landowners) who need to conduct a Scoped EIS in support of minor development
APPENDIX 1: SCOPED ENVIRONMENTAL IMPACT STATEMENT (EIS) FORM This form is intended for use by applicants (primarily private landowners) who need to conduct a Scoped EIS in support of minor development
7.0 SOCIAL, ECONOMIC, AND ENVIRONMENTAL ISSUES
 7.0 SOCIAL, ECONOMIC, AND ENVIRONMENTAL ISSUES The following list of social, economic, and environmental issues have been identified based on a preliminary inventory of resources in the project area, an
Northeast Anthony Henday Drive Manning Freeway to Whitemud Drive Welcome to this Construction Information Session
 Manning Freeway to Whitemud Drive Welcome to this Construction Information Session Purpose To inform interested residents and businesses about the plans accommodation. Background: The Government of Alberta
Town of Cobourg Heritage Master Plan. Statutory Public Meeting
 Town of Cobourg Heritage Master Plan Statutory Public Meeting April 25 th 2016 Presentation Overview 1. Introduction 2. Project background and schedule overview 3. Review of strategic direction content
GREEN NETWORK APPLICATIONS IN ESTONIA
 GREEN NETWORK APPLICATIONS IN ESTONIA Kalev Sepp, Tuuli Veersalu, Martk Külvik Estonian University of Life Sciences 1 WHY? BACKGROUND - POLITICAL By adopting the Pan-European Biological and Landscape Diversity
Appendix A. Planning Processes. Introduction
 1 Planning Processes Introduction This appendix outlines a number of planning processes which are used in the Auckland Region to support the effective management of development in the region s rural and
Staff will be providing an overview of the project need, purpose and intent for consideration as part of the Amendment cycle.
 Agenda Item D-2 City of Tacoma Planning and Development Services To: Planning Commission From: Stephen Atkinson, Planning Services Division Subject: Open Space Corridors Project Meeting Date: March 1,
PSRC REVIEW REPORT & CERTIFICATION RECOMMENDATION
 PSRC REVIEW REPORT & CERTIFICATION RECOMMENDATION KITSAP COUNTY COUNTYWIDE PLANNING POLICIES July 2, 2012 BACKGROUND A major emphasis of the Washington State Growth Management Act (GMA) is the need to
3. Highway Landscaping Assessment
 Guidelines for Highway Landscaping 3-1 3. Highway Landscaping Assessment 3.1 Introduction This section outlines the steps necessary to assess the highway landscaping component of a state highway construction
GIS to Estimate Archaeological Site Loss and Develop Conservation Strategies
 GIS to Estimate Archaeological Site Loss and Develop Conservation Strategies Terry Jackson Office of Decision Support Systems Planning and Environmental Management Division Georgia Department of Community
The South Macleod Trail Community and Employment Centre
 The South Macleod Trail Community and Employment Centre Community and Neighbourhood Planning Module Context During the 1950s, the movement of people away from urban centres led to the evolution of the
APPENDIX A SIMPLIFIED APPROACH TO STORMWATER MANAGEMENT FOR SMALL PROJECTS. In West Sadsbury Township, Chester County, Pennsylvania
 APPENDIX A SIMPLIFIED APPROACH TO STORMWATER MANAGEMENT FOR SMALL PROJECTS In West Sadsbury Township, Chester County, Pennsylvania TABLE OF CONTENTS I. Introduction 3 II. Importance of Stormwater Management
Town of Vershire Road Erosion Inventory Report
 Town of Vershire Road Erosion Inventory Report Taylor Valley Road. Photo taken by TRORC staff. Prepared by: 128 King Farm Road Woodstock, VT 05091 Inventory and report funded by the Vermont Agency of Transportation
Preface. Erie. Scranton. Allentown. Pittsburgh. Harrisburg. Philadelphia
 The Southern Alleghenies Region The Southern Alleghenies Region spans the Laurel Highlands and Allegheny Front in the west across the Appalachians to the east. It is comprised of Blair, Bedford, Cambria,
GENERAL LAND USE PLAN ELEMENT
 CITY OF Prepared by City of Medford Planning Department 200 South Ivy Street Medford, Oregon 97501 plnmed@ci.medford.or.us James E. Huber, AICP, Planning Director COMPREHENSIVE PLANNING SECTION John Adam,
Town of Peru Comprehensive Plan Executive Summary
 Town of Peru Comprehensive Plan Executive Communities that plan grow by choice, not by chance. A plan makes growth thoughtful, understandable, and predictable. A plan shows that a community is managing
TRCA Field Staking Protocol December 2016
 Page 1 of 6 TRCA Field Staking Protocol December 2016 This Protocol describes TRCA staff s current practice for field staking the physical top of bank, the physical toe of slope, and the limit of existing
Section 3 Non-Structural BMPs
 3.1 Stream Buffers A stream buffer or stream setback is a designated area around a stream, lake, or wetland left in a natural, densely vegetated state so as to protect the receiving water quality and provide
DRAFT Amsterdam/Churchill Community Plan (4/17/08) Adopted By the Gallatin County Commission
 Adopted By the Gallatin County Commission") DRAFT Amsterdam/Churchill Community Plan (4/17/08) Adopted By the Gallatin County Commission Table of Contents Acknowledgements Chapter 1: Introduction A Brief History What s Next Authority Organization
DRAFT Amsterdam/Churchill Community Plan (4/17/08) Adopted By the Gallatin County Commission Table of Contents Acknowledgements Chapter 1: Introduction A Brief History What s Next Authority Organization
Northern Branch Corridor SDEIS March 2017
 Northern Branch Corridor SDEIS March 2017 15. 15.1. Chapter Overview 15.1.1. Introduction This chapter discusses changes to the Preferred Alternative resulting in the potential for project improvements
LANDSCAPE GUIDELINES. Countryside & Coastal Countryside Environments. Landscape, Natural Character & Amenity Values Guide
 Landscape, Natural Character & Amenity Values Guide Copyright WDC 2009 Version A2 18May09 Environmental Services Group Publication Countryside & Coastal Countryside Environments START HERE Quality Land
CITY COUNCIL AGENDA REPORT
 CITY COUNCIL AGENDA REPORT Subject: DESIGNATED FLOOD LINE CARROT CREEK Recommendation(s) That Administration bring forward a Land Use Bylaw amendment in October 2014 establishing the Designated Flood Line
Chapter 10 IMPLEMENTATION RECOMMENDATIONS
 Chapter 10 IMPLEMENTATION RECOMMENDATIONS The recommended land use plan presented in the previous chapter provides a design for the attainment of the urban and rural development and open space preservation
CITY CLERK. Parkland Acquisition Strategic Directions Report (All Wards)
") CITY CLERK Clause embodied in Report No. 10 of the, as adopted by the Council of the City of Toronto at its meeting held on November 6, 7 and 8, 2001. 10 Parkland Acquisition Strategic Directions Report
CITY CLERK Clause embodied in Report No. 10 of the, as adopted by the Council of the City of Toronto at its meeting held on November 6, 7 and 8, 2001. 10 Parkland Acquisition Strategic Directions Report
I539. Smales 2 Precinct
 I539. Smales 2 Precinct I539.1. Precinct Description The Smales 2 Precinct applies to a 4.8 hectare block of land located on the southern side of Northcote Road and fronting Lake Pupuke, Takapuna. The
The West Vaughan Employment Area Secondary Plan Policies
 Part 2: The West Vaughan Employment Area Secondary Plan Policies 2.1 General Policies It is the policy of Council: 2.1.1. That the West Vaughan Employment Area (the WVEA), identified on Schedule 1, will
3-2 Environmental Systems
 3-2 Environmental Systems 3.0 ENVIRONMENTAL SYSTEMS CONTENTS 3.1 GREENWAY SYSTEM 3.1.1 General Policies 3.1.2 Natural Heritage Network 3.1.3 Natural Heritage Network Enhancement Lands 3.1.4 Rouge Watershed
DRAFT SCOPE FOR THE DRAFT ENVIRONMENTAL IMPACT STATEMENT FOR HUDSON HIGHLANDS RESERVE TOWN OF PHILIPSTOWN, NEW YORK June 5, 2018
 DRAFT SCOPE FOR THE DRAFT ENVIRONMENTAL IMPACT STATEMENT FOR HUDSON HIGHLANDS RESERVE TOWN OF PHILIPSTOWN, NEW YORK June 5, 2018 Project Name: Project Location SEQRA Classification of Project: Lead Agency:
Leduc Industrial Outline Plan SE W4
 Leduc Industrial Outline Plan SE 1-50-25-W4 Within the North Leduc Industrial ASP Prepared for: Leduc Energy Park Ltd. Prepared by: Stantec Consulting Ltd. File No. 1161 104655 V5 Table of Contents 1.0
Article 6 Tree Protection
 Article 6 Tree Protection 8.1 Purpose 8.2 Applicability 8.2.1 General Provisions 8.2.2 Exemptions 8.3 Permitting Procedure 8.4 Planting Procedure 8.5 Performance Guarantee Required for Belated Planting
Describing the Integrated Land Management Approach
 Describing the Integrated Land Management Approach ISBN No. 978-0-7785-8902-0 (Online Edition) Pub No. I/422 What is Integrated Land Management? Integrated land management (ILM) is the strategic, planned
PDS June 1, 2016 Page 1. Planning and Development Committee. MEETING DATE: Wednesday, June 01, 2016
 Page 1 REPORT TO: Planning and Development Committee MEETING DATE: Wednesday, June 01, 2016 SUBJECT: ROPA 12: Project Initiation Report Regional Official Plan Amendment (ROPA # 12) Watercourse Policies
9 CITY OF VAUGHAN OFFICIAL PLAN AMENDMENT NO BOCA EAST INVESTMENTS LIMITED
 9 CITY OF VAUGHAN OFFICIAL PLAN AMENDMENT NO. 631 - BOCA EAST INVESTMENTS LIMITED The Planning and Economic Development Committee recommends the adoption of the recommendations contained in the following
Exhibit A Comprehensive Plan Amendments
 Exhibit A Comprehensive Plan Amendments May 2010 Draft Chapter One - Introduction Chapter One INTRODUCTION NOTE: For brevity and ease in viewing the proposed changes, portions of chapter one that are not
STORMWATER GREEN INFRASTRUCTURE AND PLANNING/ZONING BOARDS
 STORMWATER GREEN INFRASTRUCTURE AND PLANNING/ZONING BOARDS Source: Center for Watershed Protection, 2007 Southern Tier Central Regional Planning & Development Board Chemung County Stormwater Team OUTLINE
The Salt Marsh Advancement Zone Assessment of Connecticut
 The Salt Marsh Advancement Zone Assessment of Connecticut Front cover image: Salt marsh advancement zones in Stratford, CT from the Comprehensive Map Book of Stratford, CT. Table of Contents Introduction...
I611. Swanson North Precinct
 I611. Swanson North Precinct I611.1. Precinct Description Swanson North is located in the north eastern foothills of the Waitakere Ranges. It is outside the Waitakere Ranges Heritage Area Act and the Waitakere
NEW REGIONAL OFFICIAL PLAN HIGH LEVEL PROCESS & FRAMEWORK
 NEW REGIONAL OFFICIAL PLAN HIGH LEVEL PROCESS & FRAMEWORK Why A New Official Plan Originally the role of Regionally Planning and content of Regional Official Plan (1970s) primarily focused on protecting
Blue/Green Infrastructure Study Accomack County, VA
 Blue/Green Infrastructure Study Accomack County, VA Draft Asset Maps March 8-9, 2010 Green Infrastructure Center, Inc. 2 Overview What is Green and Blue Infrastructure Project Timeline & Tasks Literature
When planning stormwater management facilities, the following principles shall be applied where possible.
 2.0 Principles When planning stormwater management facilities, the following principles shall be applied where possible. 2.0.1 Drainage is a regional phenomenon that does not respect the boundaries between
Green Infrastructure Policies and Ordinances
 Green Infrastructure Policies and Ordinances October 23, 2013 By Karen Firehock, Green Infrastructure Center 2013 Georgia Urban Forest Council s 23 rd Annual Conference The mission of the nonprofit Green
14.5 HOPEFIELD: (REFER PLAN 39 AND PLAN 40)
") URBAN DYNAMICS WESTERN CAPE INC. 248 14.5 HOPEFIELD: (REFER PLAN 39 AND PLAN 40) FIGURE 83: LOCALITY - HOPEFIELD Within the context of the Saldanha Bay Municipal area, Hopefield, an historical agricultural
URBAN DYNAMICS WESTERN CAPE INC. 248 14.5 HOPEFIELD: (REFER PLAN 39 AND PLAN 40) FIGURE 83: LOCALITY - HOPEFIELD Within the context of the Saldanha Bay Municipal area, Hopefield, an historical agricultural
Chesapeake Bay Critical Area Conservation Plan
 The Maryland-National Capital Park and Planning Commission Prince George s County Planning Department Development Review Division 301-952-3530 Note: Staff reports can be accessed at www.mncppc.org/pgco/planning/plan.htm.
COLVER ROAD INDUSTRIAL CONCEPT PLAN
 COLVER ROAD INDUSTRIAL CONCEPT PLAN A CONCEPTUAL LAND USE AND TRANSPORTATION PLAN FOR TA-4 AN URBAN RESERVE AREA OF THE CITY TALENT City of Talent Adopted by City Council Resolution No., June, 2015 PART
TOWN OF SPRINGFIELD, NEW HAMPSHIRE
 TOWN OF SPRINGFIELD, NEW HAMPSHIRE NATURAL RESOURCES INVENTORY EXECUTIVE SUMMARY March 2008 Prepared by: Watershed to Wildlife, Inc. Natural Resource Consultants 42 Mill Street, Suite 3 Littleton, NH 03561
Genex Kidston Connection Project: Draf t Environmental Assessment Report Powerlink Queensland
 : Draf t Environmental Assessment Report Powerlink Queensland Chapter 14 \\autsv1fp001\projects\605x\60577456\6. Draft Docs\6.1 Reports\4. Compiled draft 17 September\Covers\Chapters\Ch 14.docx Rev ision
Chapter 1: General Program Information
 Chapter 1: General Program Information 1.1 Introduction The Montgomery County Stormwater Management Resolution (#03-1-5) was adopted by the County Board of Commissioners on January 22, 2003. The purpose
Environmental Protection Ordinances (Performance Zoning) Bedminster Township, Bucks County
 Bedminster Township, Bucks County") Environmental Protection Ordinances (Performance Zoning) Bedminster Township, Bucks County ARTICLE VI. PERFORMANCE STANDARDS Section 600 Compliance All uses, activities, subdivisions and/or land developments
Environmental Protection Ordinances (Performance Zoning) Bedminster Township, Bucks County ARTICLE VI. PERFORMANCE STANDARDS Section 600 Compliance All uses, activities, subdivisions and/or land developments
Arlington, Virginia is a worldclass
 EXECUTIVE S U M M A RY Arlington maintains a rich variety of stable neighborhoods, quality schools and enlightened land use policies, and received the Environmental Protection Agency s highest award for
City of Lafayette Study Session Staff Report Design Review Commission
 ++ City of Lafayette Study Session Staff Report Design Review Commission Meeting Date: January 08, 2018 Staff: Subject: Chris Juram, Planning Technician SS12-17 Miramar Homebuilders, R-20 Zoning: Request
Complete Neighbourhood Guidelines Review Tool
 Complete Neighbourhood Guidelines Review Tool Prepared By: City of Regina Planning Department October 2014 Page 1 of 14 Community Development Review Checklist for Secondary Plans and Concept Plans The
ROCHFORD LOCAL DEVELOPMENT FRAMEWORK: Sustainability Appraisal/ Strategic Environmental Assessment. Rochford Core Strategy Preferred Options Document
 ROCHFORD LOCAL DEVELOPMENT FRAMEWORK: Sustainability Appraisal/ Strategic Environmental Assessment Non Technical Summary Rochford Core Strategy Preferred Options Document October 2008 SUSTAINABILITY APPRAISAL
Oakland County s Green Infrastructure Vision. L. Brooks Patterson Oakland County Executive
 Oakland County s Green Infrastructure Vision L. Brooks Patterson Oakland County Executive Southeast Michigan 20 miles northwest of Detroit Consists of 910 square miles Population of 1.2 million More than
DRAFT DESIGN CRITERIA STORMWATER TREATMENT STANDARDS CITY OF OVERLAND PARK
 DRAFT DESIGN CRITERIA STORMWATER TREATMENT STANDARDS CITY OF OVERLAND PARK A. Authority As set forth in the Overland Park Municipal Code (OPMC), Chapter 16.210, the Director of Planning and Development
Working Group Meeting
 April 4,, 2017 Parks Operations Bldg Working Group Meeting Arts Districts Overview Stormwater/RPA/Stream Considerations First Principles Agenda 7:00pm 7:05pm 7:10pm 7:40pm 8:30pm 9:40pm 9:45pm Welcome
Feasibility Analysis for Expansion of the Provincial Greenbelt Plan Area into Mississauga
 Feasibility Analysis for Expansion of the Provincial Greenbelt Plan Area into Mississauga November 8, 2013 Natural Heritage and Urban Forest Strategy: Draft Discussion Paper #3: Table of Contents 1.0 Introduction...
The analysis of key visual characteristics and attributes that contribute to variations in the
 15.0 CHIGWELL/CHIGWELL ROW 15.1 Overview 15.1.1 Chigwell and Chigwell Row settlements are situated in the south of Epping Forest District, to the south of Abridge and southwest of Stapleford Abbotts. Both
Services Department B September 10, 2007
 Report To: Development Services Committee Item: Date of Report: DS-07-246 September 5, 2007 From: Commissioner, Development File: Date of Meeting: Services Department B7200-0001 September 10, 2007 Subject:
AMENDMENT NO. 30 TO THE OFFICIAL PLAN OF THE TOWN OF MILTON
 AMENDMENT NO. 30 TO THE OFFICIAL PLAN OF THE TOWN OF MILTON Subject: Boyne Survey Secondary Plan and Related Official Plan Amendments The following text and schedules constitute Amendment No. 30 to the
Policy & Procedure Effective Date: Parks Department Page of
 City of Arvada Policy & Procedure Effective Date: Parks Department Page of TITLE: City of Arvada Prairie Dog Habitat Plan APPROVAL: PURPOSE: To establish a plan for the preservation of black-tailed prairie
Vaughan Metropolitan Centre (VMC) Black Creek Renewal CLASS ENVIRONMENTAL ASSESSMENT
 Black Creek Renewal CLASS ENVIRONMENTAL ASSESSMENT") PUBLIC INFORMATION CENTRE Vaughan Metropolitan Centre (VMC) Black Creek Renewal Wednesday, May 10, 2017 6:00 p.m. to 8:00 p.m. Add photo Project Management, Environmental Assessment, Stormwater Management
PUBLIC INFORMATION CENTRE Vaughan Metropolitan Centre (VMC) Black Creek Renewal Wednesday, May 10, 2017 6:00 p.m. to 8:00 p.m. Add photo Project Management, Environmental Assessment, Stormwater Management
New Development Stormwater Guidelines
 New Development Stormwater Guidelines CITY OF MOUNTLAKE TERRACE Table of Contents Introduction... 2 Ecology s Minimum Requirements for stormwater management... 2 Description of the 9 Minimum Requirements...
C ity of Grande Prairie Development Services Department
 C ity of Grande Prairie Development Services Department FAIRWAY DEVELOPMENT OUTLINE PLAN OP 08 09 Approved April 6, 2009 Prepared by: Focus Corporation Table of Contents 1.0. Introduction 2 3 1.1. Plan
3. VISION AND GOALS. Vision Statement. Goals, Objectives and Policies
 Vision Statement Queen Creek s interconnected network of parks, trails, open spaces and recreation opportunities provide safe and diverse activities and programs that sustain its unique, small town, equestrian