Design of a ventilation system for a renovated wooden house type in Greenland
|
|
|
- Lesley Marshall
- 6 years ago
- Views:
Transcription
 Stephan Müller")
1 11427 Arctic Technology 2012 Design of a ventilation system for a renovated wooden house type in Greenland Supervisors: Søren Peter Bjarløv Martin Kotol Group 12: Tania Berna (s111070) Stephan Müller (s111994)
2 Page II Preface The following project about the design and analysis of an energy-efficient ventilation system in Sisimiut is realised together. The workload during the field trip in Greenland and during the data analysis afterwards was shared commonly. Both students are equally responsible for this project. Abstract Within the scope of a renovation project an energy efficient ventilation system for the Greenlandic wooden house type 18D is designed and analysed. The renovation includes extra thermal insulation and a vapour barrier to reduce heat losses and infiltration losses. In this way the energy consumption of the house shall be lowered. Besides the mechanical ventilation needs to be implemented to ensure a satisfying indoor climate. The influence of the renovation process on the energy demand is simulated by means of the ISEve software. The simulations showed that realising just the thermal insulation without considering a ventilation system decreases the energy consumption up to 40 %. However, coincidently the indoor air quality deteriorates strongly and high CO 2 concentrations occur. Applying afterwards a ventilation system to the simulation model, leads to rising energy consumption in turn. Hence, realising a renovation project, including also a ventilation system based on the Greenlandic Building Regulation, results in energy saving of up to 15 %. These saving can be enhanced easily by more than 10 % if ventilation rates from other Nordic building regulations (for example Sweden and Norway) are used. In this way it should be possible to achieve the Greenlandic energy target of 200 kwh/m²a (Zone 2).
3 Page III Table of content Preface... II Abstract... II Table of content... III Figures... V Tables... VII 1 Introduction Greenland Population and family structure Housing STEP 1 The 18D house in Sisimiut before renovation Structure and layout Reference simulation Measured data Occupant s behaviour Basic simulation parameter Simulation results after STEP Interim conclusion STEP 2 The 18D house in Sisimiut after renovation Structure and layout Adjustments of simulation model Simulation results after STEP Interim conclusion STEP 3 The 18D house in Sisimiut after renovation including an HVAC system Analysis of standards and norms Design of ventilation system General layout and ventilation loads Possibility of increasing the ventilation rate Placement of the air handling unit Placement, size and design of supply air outlets Placement, size and design of exhaust vents Ducting Intake and outtake Pressure losses... 30
4 Page IV Dampers Type and size of air handling unit Control system Drawing of the ventilation system Kitchen hood Implementation of the ventilation system in IESve Simulation results after STEP Living room Bedroom Kitchen Energy consumption Cost Interim conclusion STEP 4 Sensitivity analysis Ventilation standards Ventilation standard with different occupancy Discussion Conclusion References... VIII Appendix... XII
5 Page V Figures Figure 1: Schematic way of proceeding... 1 Figure 2: Standard houses types in Greenland from 1957 to 1963 [Jensen and Marencokova, 2010].. 3 Figure 3: Aerial view of the project 18D house [Google Maps, 2012]... 4 Figure 4: Front view of 18D house... 5 Figure 5: Right view of 18D house... 5 Figure 6: Left view of 18D house... 5 Figure 7: External wall and exposed floor before renovation... 5 Figure 8: Roof before renovation... 5 Figure 9: Ground floor of 18D house... 6 Figure 10: First floor of 18D house... 6 Figure 11: Indoor air temperature, relative humidity, CO 2 concentration in living room... 7 Figure 12: Indoor air temperature, relative humidity, CO 2 concentration in bedroom... 8 Figure 13: Indoor air temperature and relative humidity in kitchen... 9 Figure 14: CO 2 concentration in living room and kitchen during a week in August Figure 15: Generalized daily routine of occupants Figure 16: Living room T and RH after STEP Figure 17: Bedroom T and RH after STEP Figure 18: Kitchen T and RH after STEP Figure 19: Living room CO 2 after STEP Figure 20: Bedroom CO 2 after STEP Figure 21: Living room CO 2 (flattened) after STEP Figure 22: Bedroom CO 2 (flattened) after STEP Figure 23: Comparison of heating energy demand after STEP Figure 24: External wall and exposed floor after renovation Figure 25: Roof after renovation Figure 26: Renovation proposal by Jensen and Marencokova and Jenses [2010] Figure 27: Living room T and RH after STEP Figure 28: Living room CO 2 after STEP Figure 29: Bedroom T and RH after STEP Figure 30: Bedroom CO 2 after STEP Figure 31: Kitchen T and RH after STEP Figure 32: Kitchen CO 2 after STEP Figure 33: Specific heating demand before and after STEP Figure 34: Regular air flow through the house (constant) Figure 35: Air flow through the house if air boost button is pressed Figure 36: Lindab VVTK [Lindab, 2012b] Figure 37: Lindab VVTK characteristics [Lindab, 2012b] Figure 38: Supply air outlet and AHU on the ground floor Figure 39: Supply air outlets on the first floor Figure 40: Lindab KVG ø100 characteristics [Lindab, 2012c] Figure 41: Lindab KVG ø125 characteristics [Lindab, 2012c] Figure 42: Exhaust vents and AHU on the ground floor Figure 43: SRFC duct [Lindab, 2012d] Figure 44: SRFC characteristics [Lindab, 2012e] Figure 45: Intake and exhaust placement... 29
6 Page VI Figure 46: Exhaust Valve KU [Lindab, 2012g] Figure 47: Characteristics of KU [Lindab, 2012g] Figure 48: Pressure loss calculation of bench between intake and living room Figure 49: Damper DTHU [Lindab, 2012h] Figure 50: DTHU damper dimensions [Lindab, 2012h] Figure 51: Efficiencies of supply and exhaust fan [Swegon, 2010] Figure 52: Control system of the initial ventilation system Figure 53: Control system of the ventilation system with variable air volume Figure 54: Design of the supply ventilation system Figure 55: Design of the exhaust ventilation system Figure 56: Ventilation system implemented in IESve Macroflo Figure 57: Living room temperature profile after STEP Figure 58: Living room relative humidity after STEP Figure 59: Living room CO 2 concentration after STEP Figure 60: Bedroom temperature profile after STEP Figure 61: Bedroom relative humidity after STEP Figure 62: Bedroom CO 2 concentration after STEP Figure 63: Kitchen temperature profile after STEP Figure 64: Kitchen relative humidity after STEP Figure 65: Kitchen CO 2 concentration after STEP Figure 66: Specific heating demand after STEP 3 simulation Figure 67: Standard s comparison - Bedroom Figure 68: Standard s comparison energy consumption Figure 69: Standard s comparison Bedroom Occupancy variation Figure 70: Standard s comparison energy consumption occupancy variation... 48
7 Page VII Tables Table 1: Construction details and U-values of the 18D house... 6 Table 2: Boiler characteristics and heating set points Table 3: Internal loads and time profiles Table 4: Renewed wall, floor and roof from inside to outside Table 5: Comparison between national and international ventilation standards Table 6: Comparison of possibilities to place the AHU Table 7: Design parameters of VVTK as a function of ventilation rate Table 8: Design parameters of KVG in dependence of ventilation rate Table 9: ζ-values Table 10: Comparison of pressure losses in different branches Table 11: Fan operations in dependence of boost option Table 12: Unit costs of ventilation system [Lindab Online Shop, 2012 and Lindab, 2012i] Table 13: Ventilation rates according to different standards Table 14: Ventilation rates according to the different standards variation in occupancy... 47

8 Page 1 1 Introduction The heating of buildings is a serious issue in arctic climates. According to Bjarløv and Vladykova [2011] the average heating consumption in Norway, for a mean floor area of 119 m², amounts to 181 kwh/m²a and in Canada, the average heating energy for a mean floor area of 134 m², accounts for 231 kwh/m²a. In Greenland, instead, the average heating energy soars to 416 kwh/m²a for 65.5 m² mean floor area, which is way higher than the limits required by the national regulation. In fact, the Greenlandic Building Regulation claims for maximum domestic energy consumption dependent on a zone subdivision [Jensen and Marencokova, 2010] the following equations: where, From here, the energy consumption of a regular house in Sisimiut, which is located in Zone 2, should not exceed 200 kwh/m²a. Consequently, several studies were carried out to find a way to reduce the energy consumption in already existing buildings. Bjarløv and Vladykova, proposed to considerably reduce the energy consumption by renewing the existing buildings with a tightening layer and extra insulation on the outside. On the other hand, these changes will drastically reduce the infiltration rate resulting in a poor indoor climate. Hence, a mechanical ventilation system with heat recovery would be necessary to ensure a proper indoor air quality. The aim of this project is to design the mechanical ventilation system mentioned above, applied on a semi-detached standard house, type 18D, located in Sisimiut. The house in question has been previously investigated in other projects; hence drawings and indoor climate measurements were available. After an investigation on the spot, an initial model of the present house is simulated within the IESve software. The purpose of this simulation is to validate the model according to indoor air quality measurements and typical energy consumptions. In the second step, the model is adjusted to the renovation proposal, by adding a vapour barrier and extra insulation. Afterwards, in the third step, a mechanical ventilation system with heat recovery is designed and applied to the model. Finally, sensitivity analyses are carried out to show further potential for improvement. The schematic way of proceeding is shown in figure 1. Figure 1: Schematic way of proceeding
9 Page 2 2 Greenland Greenland is the largest non-continental island in the world. The surface area adds up to about 2,166,086 m², according to Statistics Greenland [2012]. In January 2012 the government counted 56,749 Greenlanders, whereby around 85 % of them are living in towns. Nuuk is the capital and also the largest town in Greenland (16,181 inhabitants), followed by Sisimiut (5,571 inhabitants) and Illulissat (4,621 inhabitants). During the last decade, the total population of Greenland remained almost stable, however, due to the resettlement policy, a population increase in towns and a population decrease in small settlements can be measured. The project house is situated in Sisimiut, 50 km north of the Arctic Circle, where the first settlements are dated back to about 2500 years before Christ. Sisimiut is characterised by an ice-free harbour during the whole winter period and it is well-known for its fishing industry. Furthermore the town is rated as one of the educational centres of Greenland [World of Greenland, 2012]. 2.1 Population and family structure The above described urbanization process influenced also the Greenlandic family structure. Tròndheim [2010] analysed the change in the family structure by means of interviews to Greenlandic families in Nuuk and Upernavik. Tròndheim describes Upernavik as a small, homogenous city where people traditionally live together in extended families (parents, children, grandparents, siblings). The relations are carefully cultivated, the daily interaction within the kinship is of high importance and family members pay a visit to their kin as often as possible. Nuuk, instead, is characterized by Tròndheim as a heterogeneous and multiethnic society. In Nuuk the traditional family structure has changed due to the urbanization process, the better employments and also due to alcohol abuse. People often live in the nuclear family, made up of parents and children. Nevertheless, as Tròndheim analysed, kinship is still of high relevance, especially during weekends when the nuclear family cultivates the primary contacts with the extended family. Additionally they also meet with close friends and colleagues. Those secondary contacts are also seen as part of the kinship. In conclusion family and kinship relations are still a key factor in the Greenlandic society and this key factor is unlikely to disappear in the near future. These strong kinship relations should be considered in the renovation proposal, especially for the design of a ventilation system. Hence, in addition to the average household size of three persons [Poppel and Poppel, n.d.], it has to be taken into account that families often visit their relatives and that the actual number of people staying at a certain house can often be higher than the family size. 2.2 Housing According to Jensen and Marencokova [2010] the first three types of standard houses in Greenland were introduced in the late 40s by a special committee, to redress the health related problems caused by the existing houses. During the 50s more than 40 different housing projects were produced, ranging from 20 m² to 70 m² floor area. Later on, in 1955, the Ministry of Greenland restricted these projects to only 10 different standard house types and in 1969, the semi-detached 18D standard house type was added to the product spectrum. Regarding the distribution of standard house types in Greenland between 1957 and 1963, standard house types 18 and 25 were preferred, as it is shown in figure 2. Consequently, it is meaningful to focus especially on those standard house types, when an energy efficient renovation procedure is developed and carried out.
10 Page 3 Figure 2: Standard houses types in Greenland from 1957 to 1963 [Jensen and Marencokova, 2010] In addition to the analysis of the standard house distribution, it is also necessary to investigate the housing habits, since some housing habits strongly influence the building energy consumption. Of course, those influences should be considered when developing a renovation process. A survey carried out in Sisimiut by Kotol [2012] shows that 34% of the respondents smoke indoors and also in households with children the percentage of smokers adds up to 29%. Furthermore, the drying of laundry indoors and the traditionally long and slow cooking process, influence the indoor air quality in a negative way. It is also interesting to examine the judicial litigation in the housing sector; among others, complaints are about violated maintenance duty regarding mould and leaking roofs [Maalaarut, 2007] and about pets in the dwellings [Maalaarut, 2009]. All these housing habits influence the indoor climate negatively and the effect is intensified by poor ventilation in the houses. Nors et al. [2007] reported that openings and ventilation sluts for natural ventilation are sometimes closed with clothes and tape. Additionally, Kotol [2012] detected blocked bathroom fans and this can explain appearance of mould, especially in bathrooms as described by Nors et al. This is also validated by Ebbehøj [2012], who states a small, but increasing, number of health problems caused by mould. On top of this, Greenlandic families like to spend time with relatives and friends, as described in the previous section and due to the rigid climate, they probably meet mostly indoors. It is estimated that Greenlandic children, for example, spend more than 90% of their time inside dwellings [Nors et al., 2007]. Coincidently, the survey of Kotol reveals that having fresh air is a substantial wish of Greenlandic households. Hence, when developing an energy efficient renovation procedure, which includes HVAC systems for good indoor air quality, traditional housing habits and indoor comfort wishes have to be considered.

11 Page 4 3 STEP 1 The 18D house in Sisimiut before renovation Standard house 18 D is an acronym for a semi-detached two storey family house, built after the year Among other common standard types, this house type is considered to be the second most common in Sisimiut [Jensen and Marencokova, 2010]. As documented by measurements, this house type is not well insulated and inhabitants complain about local discomfort, like draught. Moreover, poor insulation, thermal bridges and high infiltration level result in energy inefficiency [Jensen and Marencokova, 2010]. The following sections present a brief summary of the measurement s results and the general structure and layout of this type of house, which is used as starting point for this project. In detail, the measurement data will be used to validate the simulation model. The project is conducted for an 18D house located in Kaalikassap Aqq, Sisimiut, in front of the city hostel, as is shown in figure 3. The area south-west of the project house is also filled up with houses of the same type. Figure 3: Aerial view of the project 18D house [Google Maps, 2012] 3.1 Structure and layout The house consists of two dwellings: the one facing northwest is built a little uphill and occupied by the elderly couple Rasmussen; the one facing southeast is administrated by the housing association A/S Boligselskabet INI and it is vacant. Due to this vacancy, it is chosen for theoretical and practical research on energy efficient mechanical ventilation systems and it is the one considered from now on. Drawings of the house elevations are reported in the figures below.

12 Page 5 Figure 4: Front view of 18D house Figure 5: Right view of 18D house Figure 6: Left view of 18D house The house presents a high pitched roof, with a slope of 40 and the bearing structure consisting of wooden frames, elevated on an accessible concrete foundation that acts as a basement. This is ventilated through small openings in the foundation walls and it prevents the house to collapse by melting of the permafrost for contact with warm floor. At the same time it is working as an insulation layer, which prevents a major heat loss between warm floor and very cold soil. An external wooden staircase leads to the main door, which is made of wood, as well as the window frames. In general the house insulation is quite poor, as is documented by the calculated U-value of exposed walls, roof and floor. Details of the construction and U-values are reported in table 1. Figure 7: External wall and exposed floor before renovation Figure 8: Roof before renovation
13 Page 6 Table 1: Construction details and U-values of the 18D house External wall (inside to outside) Exposed floor (inside to outside) Roof (inside to outside) Gypsum plate 13 mm Wooden boards 25 mm Gypsum plate 13 mm Aluminium foil - Air gap 38 mm Wooden planks 19x100 mm Wooden planks 20 mm Timber beam 3.5x6 Timber beams (x2) 1x5 Air gap 28 mm Insulation 100 mm Insulation 200 mm Insulation 100 mm Wooden planks 12.5 mm - - Timber battens 2x4 and - - Timber truss 2x5 50 mm Extra insulation Timber battens 2x2 - - Timber planks 30 mm Gypsum plate 13 mm - - Roofing felt - Plywood 19 mm Wooden cladding 18 mm U-value [W/m 2 K] 0.33 U-value [W/m 2 K] 0.29 U-value [W/m 2 K] 0.29 The U-values of windows and door are respectively 2.90 W/m 2 K and 2.59 W/m 2 K. The dwelling considered in this project measures 57.1 m 2, where the ground floor measures 33.5 m 2 and the first floor, which is smaller, measures only 23.6 m 2. As it is shown in figure 9, the ground floor is formed by an entrance, a bathroom, a storage room, a kitchen directly connected to a living room and a staircase which leads to the first floor. At the first floor there are only two bedrooms and the staircase. The cold attic can be reached from the landing by a trapdoor. Figure 9: Ground floor of 18D house Figure 10: First floor of 18D house The house is provided with a heating system operated with an old HS TARM oil boiler [Jensen and Marecokova, 2010]. The boiler is placed in the kitchen and provides also domestic hot water (DHW). The house is naturally ventilated by minimum one exhaust vent in each room. The vents are normally placed next or above the windows and in the bathroom an extra exhaust is placed to ventilate the toilet bag, since the house is not connected to the sewage system.

14 Page Reference simulation In order to trust the simulation model that will be used to simulate the designed ventilation system in the IESve software, it needs to be validated. Therefore a model before renovation is realized and it is validated by comparison with the measured data Measured data In previous sections of this report it is mentioned that investigations on energy efficient ventilation systems are pursued in the vacant southeast facing dwelling of the analysed semi-detached 18D house. However, due to the vacancy, measured data about infiltration rates, indoor air temperature, relative humidity and CO 2 concentration are not available under occupied conditions. Hence, data from the almost identically constructed northwest facing dwelling are utilized in the validation process. Jensen and Marencokova [2010] conducted two Blower Door Tests in the northwest facing dwelling. Afterwards they determined the infiltration rates by using three different calculation methods: Princeton Method, Sherman Method and Sbi anvisning 213. The results vary between 0.5 ACH (Princeton Method, first test) and 0.81 ACH (Sherman Method, second test). Within this project the average result, based on Sbi anvisning 213, is used, hence an infiltration rate of ACH is considered in the simulation parameters. In 2011 Kotol used HOBO loggers to measure indoor air temperature, relative humidity and sometimes CO 2 concentration in living room, bedroom and kitchen. The measurements are conducted from 16 August 2011 to 14 January 2012 in time steps of 15 minutes. The results for living room, bedroom and kitchen are presented in the following figures. Furthermore, during some days in August, Kotol measured the venting behaviour of the occupants. However, these data are insufficient to determine a venting profile. Figure 11: Indoor air temperature, relative humidity, CO 2 concentration in living room

15 Page 8 Within the analysed period a fairly constant indoor air temperature of 25 C was measured in the living room. Probably the temperature changes slightly due to outdoor weather conditions and the occupancy of the room. The measurements also show that the relative humidity decreases roughly from about 35% in August to about 10% in December and January and it may depend from seasonal weather changes. Regarding the CO 2 concentration, a high fluctuation can be noted: if most of the time the CO 2 concentration varies between about 400 ppm (outdoor CO 2 concentration) and 1000 ppm, sometimes it reaches 1500 ppm and even higher values. These spikes are probably caused by variation in the occupancy. Figure 12: Indoor air temperature, relative humidity, CO 2 concentration in bedroom Regarding the bedroom, indoor air temperature and the relative humidity are fairly similar to the ones measured in the living room. Within the whole period, the air temperature levels at about 24 C. The relative humidity drops likewise from about 40% in August to 15% in December and January. In contrast the measured CO 2 concentration is far higher compared to the living room. Often the concentration exceeds the recommend threshold of 1000 ppm [Engineering Toolbox, 2012] and reaches sometimes even more than 3000 ppm. It is assumed that these high values occur especially in nighttime, when two people are sleeping in a small bedroom with closed door and windows.


16 Page 9 Figure 13: Indoor air temperature and relative humidity in kitchen Similar to the other rooms, the indoor air temperature in the kitchen is fairly constant at 24 C and the relative humidity decreases from 40% in August to about 15% in December and January. The CO 2 concentration was not measured in the kitchen Occupant s behaviour Based on the obtained measured data it is possible to determine a roughly daily routine of the occupants, using increases and decreases in the CO 2 concentrations to estimate in which room the occupants reside. The following figure shows the CO 2 concentration in the living room (blue) and in the bedroom (red) during a week in August Figure 14: CO 2 concentration in living room and kitchen during a week in August 2011

17 Page 10 According to the measured CO 2 concentrations it can be stated that the bedroom is occupied between about 9 pm and 6 am. During the day, instead, they spend time in the living room as well as in the bedroom, as it is marked with the violet circles. The green circles show when CO 2 concentration reaches the outdoor level. In these cases venting is assumed. Unfortunately CO 2 measurements from kitchen and bathroom are not available; hence it is assumed that every day the occupants spend some time in the morning, at noon and in the evening in the kitchen to prepare food. Besides, it is also assumed that the bathroom is mainly used in the morning. Based on the findings a generalised daily routine is developed, where irregular occurrences like vacation, visits from friends and family or outdoor activities could not be taken into account. This routine is reported in figure 15. Figure 15: Generalized daily routine of occupants Basic simulation parameter This section summarizes the parameters used for the simulations in IESve. The program is equipped with weather data files of different world locations, but it does not have a weather file for Sisimiut. It is also not possible to utilize external weather files, since the software allows only the use of file of its own format. To perform the simulations, a different location with similar weather profile was chosen. The choice fell between Barrow in Alaska and Helsinki in Finland. If on one hand Barrow presents a too rigid climate regarding temperatures and humidity level, on the other hand the climate of Helsinki is slightly warmer of the one in Sisimiut. Considering that the simulations are used only to evaluate the effectiveness of the renovation and not to evaluate the existing situation, which is already known by the performed measurement, it is considered acceptable to perform the simulations for indoor climate using the Helsinki weather data. Regarding the energy consumption evaluation, the simulations were run with both weather data and the results compared with the detected energy consumption. This procedure is described with more details in A realistic 3D model of the house, provided with all the rooms, windows and doors is realised and the construction, as described in table 1 is attached to each element. Furthermore, the measured infiltration rate of ACH is applied to the model and, by means of the subroutine MacroFlo, the internal doors are kept open, allowing the air to circulate between the rooms. The outside door and the windows are kept closed all time. In order to provide the desired temperature inside the rooms, a central heating system with water radiators is implemented, served by an oil boiler. The boiler characteristics and the set points of the heating system, used for all the simulation are summarized in table 2.
18 Page 11 Table 2: Boiler characteristics and heating set points Boiler characteristics Heating set point Fuel Oil Living room 25 C Seasonal efficiency 65 % Other rooms 24 C The system is designed so that it keeps the temperature constant around the set point. Moreover, internal loads due to people and lighting, coupled with their own occupational and usage profile, are assigned to the model. Internal loads and corresponding time profiles are summarized in table 3. Table 3: Internal loads and time profiles Internal load Amount Sensible heat Latent heat Location Time profile Load [%] People 2 90 W 60 W Lighting 1 25 W - Bedroom 21:00-06: :00-07:00 08:00 12:00 13:00-17:00 50 Bathroom 06:00-07:00 50 Kitchen Living room Bedroom 07:00-08:00 12:00-13: :00-18:00 18:00-21: :00-12:00 13:00-17: :00-08:00 21:00-22: Bathroom 06:00-07: Kitchen Living room 07:00-08:00 17:00-19:00 08:00-10:00 18:00-21:

 also runs a similar course compared to the measurements (green). Especially in the kitchen the congruence is quite clear (Figure 18).")
19 Page Simulation results after STEP 1 With regard to indoor air temperature and relative humidity the comparison between the simulation results and the measurements, shown in the figures below, validates the simulation model. Due to the used heating profile, the temperature (red) can be kept constant in accordance with the measurements (blue) in all three analysed rooms. The simulated relative humidity (violet) also runs a similar course compared to the measurements (green). Especially in the kitchen the congruence is quite clear (Figure 18). However, it has to be mentioned, that the fluctuation of the simulated relative humidity is higher than the fluctuation of the measurements. This difference is probably caused by the used weather data, the chosen occupant s behaviour pattern and other irregular occurrences. Figure 16: Living room T and RH after STEP 1 Figure 17: Bedroom T and RH after STEP 1 Figure 18: Kitchen T and RH after STEP 1 Regarding the CO 2 concentration in figure 19 and figure 20, strong congruence cannot be noticed, because the chosen occupant s behaviour pattern cannot mirror the real occupant s daily routine. Many uncertainties influence the CO 2 concentration in reality, i.e. the number of occupants in the room, the activity level, cooking processes and other irregular occurrences. To reduce the impact of those externalities the measured CO 2 concentration curves are flattened by calculating the average of nine consecutive measurements, as recommended in the experiments of DTU course Indoor Climate. The comparison between the flattened measurements and the simulation results shows a better similarity, as reported in figure 21 and figure 22. The measurements are expressed by black curves and the simulation results are presented in orange curves.

![Jensen and Marencokova [2010] obtained a single monthly heating bill of the studied 18D house.](/docs-images/75/72184258/images/20-1.jpg "According to the calculations based on this heating bill the elderly couple Rasmussen purchased 2700 litres of oil in this specific year.")
![Investigation of three other 18D houses in Sisimiut, carried out by Bjarløv and Vladykova [2010] by collecting and analyzing heating bills for more than three years, revealed significantly different](/docs-images/75/72184258/images/20-2.jpg "oil consumptions. The average oil consumption of the three studied houses ranged between 1600 litres and 2200 litres.")
20 Page 13 Figure 19: Living room CO 2 after STEP 1 Figure 20: Bedroom CO 2 after STEP 1 Figure 21: Living room CO 2 (flattened) after STEP 1 Figure 22: Bedroom CO 2 (flattened) after STEP 1 Regarding the energy consumption, a simulation is run over a whole year to compare the results with the annual oil purchase, declared in heating bills. Jensen and Marencokova [2010] obtained a single monthly heating bill of the studied 18D house. According to the calculations based on this heating bill the elderly couple Rasmussen purchased 2700 litres of oil in this specific year. Investigation of three other 18D houses in Sisimiut, carried out by Bjarløv and Vladykova [2010] by collecting and analyzing heating bills for more than three years, revealed significantly different oil consumptions. The average oil consumption of the three studied houses ranged between 1600 litres and 2200 litres. All these detected oil consumptions are compared to the simulation results by converting them into energy with the help of the heating value for oil (10 kwh/l). Further on, the heating energy consumption, deducted from the simulation, is calculated by the hourly heating load of the oil burner, as recommended in DTU course Building energy and technical services - Integrated design. Due to the strong dependency of the annual heating energy consumption on the actual weather condition, the simulation is run with two weather data: Helsinki, Finland and Barrow, Alaska, United States. Additionally, the simulations do not consider heating energy to provide domestic hot water, whereas DHW consumption is included in the heating bill. Hence, to ensure the comparability, a typical Greenlandic DHW consumption value of 3000 kwh/year is added on top of the simulated heating energy consumption in according with Kragh and Svendsen [2005]. This value is validated with measurement conducted by Nielsen [2005]. Finally, the heating demand is converted into primary energy through the efficiency of the oil burner. According to Jensen and Marencokova [2010], an old HS TARM oil-fired burner is installed in the studied house, for which an efficiency of just 65% is assumed. The primary energy consumption is certainly strongly influenced by the oil burner efficiency and the results are shown in figure 23.

21 Page 14 Energy target GBR Figure 23: Comparison of heating energy demand after STEP 1 The diagram shows strong differences between simulations with weather data from Helsinki and Barrow, as well as with the heating bill. Certainly, regarding the two weather data files, the heating energy consumption is largely influenced by the location, since winter temperatures in Barrow are more extreme than in Helsinki. On the other hand, it is difficult to compare the simulated heating demand and the primary energy demand studied by Jansen and Marencokova as well as by Bjarløv and Vladykova. The primary energy demand (oil purchase) does not automatically reflect the actual heating demand. First of all the oil consumption strongly depends on the boiler efficiency and consequently more oil needs to be purchased if old and inefficient burners are used. In addition, households typically buy oil when prices are convenient and store it in their tanks. Further on, extreme weather conditions influence the annual oil purchase. Unfortunately the boiler efficiency for the houses of Ester, Eva and Oswald are not known and even the boiler efficiency of the studied and simulated house Rasmussen can just be assumed. Moreover, it needs to be considered that Jansen and Marencokova determined the annual oil consumption just on basis of a monthly energy bill, where Bjarløv and Vladykova analysed the annual heating bills of three consecutive years. However, even these data are not enough to exclude influences of extreme weather conditions and the oil purchase when prices are low. Due to these uncertainties the results of both weather data files (Helsinki and Barrow) are compared through the whole report. Hence, a range of possible energy consumptions in Greenland can be derived. Calculation with Barrow weather data is regarded as upper boundary for extreme cold winters and locations in northern Greenland. Results based on Helsinki weather data represent the lower boundary for warm winters and locations in southern Greenland. Finally it needs to be stated that in the following stages of the project the focus is on the specific heating demand and not on the specific primary energy demand.
22 Page Interim conclusion The validation of the simulation model is the start point of the project. Hence, a critical discussion about the obtained results is necessary to emphasize uncertainties and weaknesses of the model. Based on this discussion an interim conclusion can be drawn, which shows possibilities of further improvements to the model with regard to future projects. Certainly, the missing weather data of Sisimiut in the simulation program IESve is a major weakness of the model, which causes slight differences in the indoor climate evaluation, especially for the relative humidity. However, this small variation can be considered negligible due to quite similar relative humidity courses in both locations Helsinki and Sisimiut. In contrast, the outside air temperature raises a far bigger problem regarding the heat consumption as shown in the energy calculation: if using i.e. the location Barrow, instead of Helsinki, the simulated heat consumption is more than double. Hence, if more accuracy is needed, it is suggested the use of another simulation program, which allows implementing the real weather data. The second important uncertainty regards the chosen daily routine. As explained in previous sections the daily routine is approached on basis of CO 2 measurements. This approach cannot mirror totally the actual occupant s behaviour. Above all, changing in activity levels, increase in the numbers of occupants, open windows, outdoor activities and other irregular occurrences could not be read out from the CO 2 measurements. This results in the divergence between measured and simulated CO 2 levels. Finally, the available data basis should be discussed critically. Within the scope of this project indoor air quality measurements from August 2011 to January 2012, as well as a single monthly heating bill, were provided. To improve the comparability of these data with the simulation results the data basis should be enlarged, so that the uncertainty of unusual and extreme weather conditions can be minimised. Furthermore the boiler efficiency should be verified. In conclusion, future investigations can improve the simulation model by reducing the above mentioned uncertainties. The focus should especially be on a more sufficient data basis and local weather data. Nevertheless, the simulation model is considered as validated.


23 Page 16 4 STEP 2 The 18D house in Sisimiut after renovation In the second step of this approach the building envelope of the model is tightened and extra insulation is added. Hence, the first stage of the renovation process can be simulated. At first the necessary structural adjustments are explained. Afterwards these adjustments are applied to the model. Finally the results regarding indoor air quality and energy consumption are analysed. 4.1 Structure and layout With the renovation process the existing cladding will be removed from walls and roof and the whole house will be tightly wrapped into a new vapour barrier. The shafts for natural ventilation will be taken out and the holes in the walls will be filled with insulation. Moreover, an extra layer of Rockwool insulation having the thickness of 300mm will be added on the external side of the walls and beneath the floor of the ground floor. The roof s insulation will have a thickness of 360mm. The extra load due to the new insulation will be supported by clinker blocks Leca, placed against the existing basement walls. Windows and doors will be replaced by more energy efficient products available on the market. The bathroom will be renewed by the application of an extra internal vapour barrier and tiled walls and floor. The toilet will also be connected to the sewage system. Figure 24: External wall and exposed floor after renovation Figure 25: Roof after renovation The structure of renewed walls, floor and roof is described in layers from inside to outside in table 4. The U-values for the new windows and for the door are respectively 0.89 W/m 2 K and 0.90 W/m 2 K.
 Gypsum plate 13 mm Wooden boards 25 mm Gypsum plate 13 mm Aluminium foil - Air gap 38 mm Wooden planks 19x100mm Wooden planks 20 mm Timber beam 3.")
24 Page 17 Table 4: Renewed wall, floor and roof from inside to outside External wall after renovation (inside to outside) Exposed floor after renovation (inside to outside) Roof after renovation (inside to outside) Gypsum plate 13 mm Wooden boards 25 mm Gypsum plate 13 mm Aluminium foil - Air gap 38 mm Wooden planks 19x100mm Wooden planks 20 mm Timber beam 3.5x6 Timber beams (x2) 1x5 Air gap 28 mm Rockwool Flexibatts 120 mm Insulation 200 mm Insulation 100 mm Vapour barrier Timber battens 2x4 Impregnated 25x100 board mm Timber truss 2x5 Wooden boards 18 mm Rockwool Flexibatts 240 mm Timber planks 30 mm Vapour barrier - Wind barrier - Roofing felt - Rockwool Impregnated 18x100 Rockwool 300 mm Flexibatts board mm Flexibatts 350 mm Wind barrier Wind barrier - Wooden boards 28x100 mm - - Wooden boards 2x4 Wooden boards 20x100 mm - - Roof boards 25 mm Facade cladding 18 mm - - Roofing felt - U-value [W/m 2 K] 0.09 U-value [W/m 2 K] 0.09 U-value [W/m 2 K] 0.08 The renovation proposal described by Jensen and Marencokova [2010] is visualized in figure 26. Jensen and Marencokova mean to drop the energy consumption from 426 kwh/m²a to 65 kwh/m²a. Insulation layer Vapour barrier Figure 26: Renovation proposal by Jensen and Marencokova and Jenses [2010] 4.2 Adjustments of simulation model For the simulations of step 2, the building envelope is modified according to the renovation proposal described previously. The windows and outside doors are substituted with new ones, which have the determined U-values. After the renovation, the infiltration rate is assumed to decrease from ACH to 0.1 ACH. At this step it is assumed that the heating system is still connected to the old oil burner, with the characteristics described in table 2, even if in the renovation proposal by Jensen and Marencokova [2010] it is assumed that the house will be connected to the district heating. This was decided because the connection to the district heating is an additional work, with an additional cost

 has a strong influence on the indoor air quality.")
 are higher than the blue ones (before renovation).")
25 Page 18 and therefore it is not certain if it will happen at the time of the renovation. Moreover, the effect of the renovation can be more easily assed if the heating system remains unchanged. Regarding the internal loads and occupancy schedule, the model refers still to table 3. As for step 1, MacroFlo is used to allow free circulation of the air between the rooms by keeping the internal doors always open, while windows and external door are considered closed at all times. 4.3 Simulation results after STEP 2 The results of all three rooms show that adding extra thermal insulation (which also implies decreased infiltration) has a strong influence on the indoor air quality. The effect of thermal renovation is a decrease of the overall heat losses of the building, which leads to a higher heat build up. The figures below show the month of August, which is affected the most and it can be clearly seen that the red curves (after renovation) are higher than the blue ones (before renovation). In order to avoid this heat accumulation during the summer period, a higher air exchange is needed. Furthermore, the renovation process also results in higher relative humidity levels (before: green curves; after: violet curves). During the winter period, this increase is seen as an advantage, as it helps to keep the relative humidity within a comfortable range, in accordance with EN [European Committee for Standardization, 2007]. Similarly, ventilation rates have to be increased during the summer period to avoid to high relative humidity levels. However, the strongest impact of the thermal renovation process concerns the CO 2 concentration as presented in figure 28, figure 30 and figure 32. Due to the decreased infiltration, the CO 2 concentration rises in the living room from about 1000 ppm (black curve) to more than 2600 ppm (orange curve). In the bedroom, the CO 2 concentration even soars from about 1600 ppm (black) to more than 5500 ppm (orange) in some periods. The simulated CO2 levels after the renovation are unacceptably high, as they can lead to adverse health effects [Engineering Toolbox, 2012]. Figure 27: Living room T and RH after STEP 2 Figure 28: Living room CO 2 after STEP 2 Figure 29: Bedroom T and RH after STEP 2 Figure 30: Bedroom CO 2 after STEP 2


26 Page 19 Figure 31: Kitchen T and RH after STEP 2 Figure 32: Kitchen CO 2 after STEP 2 The additional insulation has a strong influence on both the heating demand and the primary energy consumption. Using weather data from Helsinki, the specific heating demand drops by 38%, from 191 kwh/m²a to 118 kwh/m²a. Similarly, if using weather data from Barrow, the specific heating demand decreases by 40%, from 281 kwh/m²a to 226 kwh/m²a. It has to be considered that these enormous savings are just possible at the cost of indoor climate. The ventilation rates are close to zero. This leads to the need of using a HVAC system in order to improve the indoor climate which will consequently result in increasing energy consumption. Furthermore, it has to be stated that the energy target of 200 kwh/m²a cannot be achieved if using the weather data from Barrow Energy target GBR Figure 33: Specific heating demand before and after STEP 2
27 Page Interim conclusion The simulation shows that adding extra insulation and tightening the building envelope results in a decrease of the energy consumption by 16% to 20%, depending on the chosen weather data. Further on, the relative humidity can be improved to comfortable levels in winter. However, the simulation also reveals that the renovation has a negative influence on the indoor air quality. During summer, there is a risk of too high temperatures and humidity levels. This can be prevented by venting regularly during the summer period. Furthermore the CO 2 concentrations in all of the studied rooms rise to uncomfortable levels. In conclusion, a ventilation system with heat recovery has to be implemented in the next step of the renovation process in order to ensure a proper living environment.
28 Page 21 5 STEP 3 The 18D house in Sisimiut after renovation including an HVAC system The design of the ventilation system is based on ventilation rates demanded in the Greenlandic Building Regulation (GBR). Hence, the first part of this chapter deals with target values set in the GBR and also compares these values with standards from other Nordic countries. Afterwards the ventilation system is designed, considering the following: supply terminals, exhaust terminals, ducts, intake, outtake, air handling unit and dampers. Further on, the designed ventilation system is implemented into the simulation model and the results of the simulation are analysed in the end. 5.1 Analysis of standards and norms Regarding ventilation systems, energy savings and indoor air quality are acting against each other. On the one hand, the ventilation rates should be kept as low as possible to save energy, while on the other hand, the ventilation rates cannot be decreased beyond a minimum value which is defined by international and national standards in order to guarantee a sufficient air change for a healthy indoor environment. However, these minimum values determined in the standards differ greatly from country to country. The following paragraphs give an overview about the demand on ventilation in Greenland, Denmark, Sweden, Norway and Finland compared to the general requirements of the European Norm EN In Greenland the Bygningsreglement 2006 (Greenlandic Building Regulation) is mandatory. Within the Building Code, a minimum air exchange rate of 0.5 ACH is determined [Direktoratet for Boliger og Infrastruktur, 2006]. Furthermore, if mechanical ventilation is used, bathrooms need to be ventilated with at least 15 l/s and utility rooms, basements and toilets with at least 10 l/s. The kitchen has to be equipped with a kitchen hood that is able to exhaust at least 20 l/s. Differentiations between occupied and unoccupied periods are not stated precisely. The Building Code just conveys that the fresh air supply should be reduced if the building is not in use. The electricity required for the ventilation system is not allowed to exceed 2.5 kw/(m³/s) if constant air flow systems are used or 3.2 kw/(m³/s) for variable air flow systems, respectively. The Greenlandic Building Regulation is based on the former building regulation of Denmark. As such, the Danish Building Regulation from 2010 does not differ very much from the Greenlandic Building Code. According to the Danish regulation, the ventilation systems in domestic buildings have to guarantee a ventilation of at least 0.3 l/(s,m²) [Danish Ministry of Economic and Business Affairs, 2010]. Bathrooms, utility rooms, basements, toilets and kitchens have to be ventilated the same way as stated in the Greenlandic Building Code. Similarly, it is also stated that the fresh air supply has to be reduced if the building is not in use. The maximal allowed electricity consumption is limited to 1.8 kw/(m³,s) for a constant air flow system and 2.1 kw/(m³/s) for a variable air flow system. Furthermore, it is necessary to incorporate a heat recovery unit with a dry temperature efficiency of no less than 70 % (single dwellings 80 %). In Sweden, the Boverkets byggregler (BBR) from 2011 is also mandatory. According to the Swedish Building Regulation, the ventilation rate should at least amount to 0.35 l/(s,m²) in occupied periods whereas in unoccupied periods it is allowed to reduce the ventilation rate to 0.1 l/(s,m²) [Boverket, 2011]. Furthermore it is stated that sleep, rest and sanitary rooms need to have the opportunity to boost the ventilation. It is also necessary to guarantee a proper accessibility to the ventilation systems for the purpose of cleaning and maintenance. The Specific Fan Power (SFP) of a balanced
29 Page 22 ventilation systems is not allowed to exceed 2.0 kw/(m³/s) if heat recovery is used, respectively 1.5 kw/(m³/s) if no heat recovery is used. The Norwegian Building Regulation from 2010 states a minimum ventilation rate of 1.2 m³/(h,m²) in occupied periods and 0.7 m³/(s,m²) in unoccupied periods [Norwegian Ministry of Local Government and Regional Development, 2010]. Furthermore, bedrooms need to be ventilated with at least 26 m³/(h,bed space) and rooms with polluting activities should have a hood extraction. A heat recovery with an efficiency of no less than 70 % is also required. The SFP is not allowed to exceed 2.5 kw/(m³/s). The National Building Code of Finland from 2002 states that in general it is necessary to have a minimum air exchange rate of 0.5 ACH [Finish Ministry of the Environment Housing and Building Department, 2003]. Furthermore, in occupied periods 6 litres of fresh air per person have to be supplied. Several other values can be included depending on the usage and equipment of the room. The ventilation system should be easy accessible for cleaning and maintenance. The temperature efficiency of the heat recovery unit is not allowed to be lower than 50 % and the SFP should not exceed 2.5 kw/(m³/s). According to EN it is necessary to supply residential buildings with 0.42 l/(s,m²) to achieve the IAQ category II [European Committee for Standardization 2007]. That corresponds to about 0.6 ACH. Furthermore, additional ventilation has to be added for bathrooms (15 l/s), kitchens (20 l/s) and toilets (10 l/s). During unoccupied periods the ventilation rate can be lowered to a minimum of 0.05 l/(s,m²). The energy efficiency of the ventilation system is not part of this norm. Table 5: Comparison between national and international ventilation standards. Unit GL DK SW NO FI EU IAQ general: Occupied l/(s,m²) 0.32* * ** 0.42*** Unoccupied l/(s,m²) Reduced Reduced IAQ additional: Bathroom l/s Boost - Several 15 Kitchen l/s Boost Hood Several 20 Toilet l/s Boost - Several 10 Utility room l/s Hood Several - Basement l/s Several - Bedroom l/s - - Boost 7 Several - Energy: HR Efficiency % SFP with HR kw/(m³/s) SFP without HR kw/(m³/s) SFP constant flow kw/(m³/s) SFP variable flow kw/(m³/s) * at a height of 2.3 m ** plus 6 litres per person *** at a height of 2.5 m

30 Page Design of ventilation system Based on the standard ventilation rates and energy values specified in the analysed standards and norms, an initial ventilation system can be designed. This initial ventilation system is developed by means of technical solutions and products available on the market. There is no special focus on costs and energy savings. Those aspects are investigated in the following sensitivity analysis General layout and ventilation loads According to EN 15251, it is necessary to follow three design criteria to achieve a satisfying indoor air quality [European Committee for Standardization 2007]: Bed rooms and living rooms should be ventilated with fresh air. Exhaust of pollutants should be taken from wet rooms like toilet, bathroom and kitchen. All rooms of the dwelling need to be ventilated in general. It is possible to use air from rooms with higher air quality (e.g. bedroom, living room) to ventilate rooms with lower air quality (e.g. wet rooms). These general design criteria have to be specified by defined ventilation rates. Hence, the standard values of the Greenlandic Building Code are chosen to determine the initial ventilation system. According to this building code, the exhaust from the bathroom has to amount to 15 l/s and the exhaust from the kitchen has to account for 20 l/s. Exhaust and supply have to be balanced, hence 10 l/s of fresh air are supplied to each of the two bedrooms and 15 l/s are supplied to the living room. Fresh air flows from the bedrooms and the living room through staircases, entrance and utility room to the bathroom and kitchen as presented in figure 34. Figure 34: Regular air flow through the house (constant) Furthermore, the building code recommends reducing the ventilation rates if dwellings are unoccupied. However, a certain value or percentage is not stated. Consequently, it is assumed that the air handling unit keeps the ventilation rates constant, independently of occupation Possibility of increasing the ventilation rate The analysis of the family structure and housing habits in the second chapter showed the difficulties in achieving an acceptable indoor air quality. Greenlandic families often meet friends and relatives at home. They dry their laundry inside the house, the traditional food needs to be cooked for long periods and many Greenlanders smoke at home. Some of them also dry fish and bring animals inside. These habits have to be taken into account when designing a ventilation system, because in all of these cases increased ventilation rates are necessary. Hence, the use of a button to boost the

31 Page 24 ventilation system for a short period of time (e.g. 20 minutes) is considered. This button can also be used to clean the ventilation system in an easy way. The increased ventilation rate is determined by experiences concerning smoking in offices. According to EN an additional specific ventilation rate of 0.5 l/s,m² is required when smoking occurs. It is assumed that Greenlanders mainly smoke only in one room, probably in the living room. Hence, the area of the living room is used to calculate the total additional ventilation load. Since the living room is the largest room of the house, this additional ventilation load is also sufficient, if the occupants decide to smoke in another room. The calculation is presented below. This additional ventilation load is added proportionally to the two exhaust openings in the kitchen and in the bathroom. Hence, if the air boost button is pressed, the kitchen exhaust increases the flow rate from 20 l/s to about 23.7 l/s and the bathroom exhaust increases it from 15 l/s to about 17.8 l/s. For reasons of simplification and cost reduction the exhaust surplus is not balanced with the supply by the AHU. Hence, in this time period a slightly negative pressure occurs, which may be balanced by increased infiltration. The schematic air flow through the house in case that the air boost button is pressed is presented in figure 35. Figure 35: Air flow through the house if air boost button is pressed Placement of the air handling unit The air handling unit (AHU) is the centrepiece of the ventilation system. The AHU is employed to supply fresh air and extract the polluted one from the house, while its heat recovery unit extracts heat from the exhaust air and transfer it to the supply air. Hence, energy for preheating fresh air can be saved. To ensure a good heat transfer, it is suggested to place the air handling unit in a heated space. This is underlined by experiences gained in the Apisseq dormitory and the Low Energy House in Sisimiut, Greenland. In Apisseq the AHU is placed in the cold basement. Although the ducts are insulated, the cold basement decreases the efficiency of the AHU. In the Low Energy House the AHU is placed in the uninsulated attic. Consequently, both ducts and AHU have to be insulated to ensure proper heat recovery efficiency. In addition, the AHU should be placed centrally to avoid long and expensive duct work. Easy access should be guaranteed for the purpose of maintenance and cleaning and the space requirement of the AHU has to also be taken into account in the design phase.
32 Page 25 The future 18D house offers three possible spaces for placing the AHU: the insulated attic, the kitchen or the utility room. All three possibilities are analysed in respect of heating conditions, necessary duct work, accessibility for maintenance and cleaning and space requirements. The results are presented in table 6. Table 6: Comparison of possibilities to place the AHU Insulated attic Kitchen Utility room Heating Duct work Accessibility Space Difficult to access Peripheral space and maintain due long duct work to tight space Heated indirectly by lower rooms Heated directly Heated directly Central space short duct work Central space short duct work Easy to access and maintain Easy to access and maintain Not used no waste of space Requires space of kitchen devices Requires space of utility devices (sometimes room used as toilet) The analysis shows that the peripheral location of the insulated attic is disadvantageous because of the longer and more expensive duct work. Furthermore, easy accessibility cannot be guaranteed due to the small and tight space. In contrast, the kitchen is located centrally and hence requires just short ducting and the AHU can be easily accessed. However, the kitchen is probably already used for several kitchen devices like fridge, stove, oven and boiler. So, it is doubtful if there is enough space to also place an AHU. Similar to the kitchen, the utility room is located centrally in the house, easy accessibility is also expected. However, the space might be used for other home appliances like dryer and washing machine and, in some houses this room is used as an additional toilet. This is not the case of the studied 18D, hence the utility room is chosen for placing the AHU where it is expected to be enough space Placement, size and design of supply air outlets The location, size and design of the supply air outlets are important due to indoor comfort as well as to economic and technical reasons. According to the U.S. Department of Energy [2011] supply air outlets have to ensure enough mixing with the room air. Besides, draft on the occupants should be avoided, furniture must not block the fresh air and a low noise level has to be achieved. In EN recommended noise levels in single offices amount to maximal 30 to 40 db(a) [European Committee for Standardization, 2007]. The U.S. Department of Energy [2011] recommends further to mount the supply air outlets on the ceiling or high sidewalls blowing against the exterior walls. Additionally, the University of California and California State University [2005] underline the economic design criteria for placing supply air outlets. Regarding the duct work, supply air outlets should be placed as close and as straight as possible to the AHU. Hence, pressure losses and expensive duct work can be minimised. Based on these design criteria, the Lindab VVTK ø100 supply air outlet is chosen. For both ventilation rates (15 l/s in the living room and 10 l/s in the two bedrooms) VVTK shows reasonable noise levels and pressure losses with a setting (a) of 12 mm. Furthermore it can be mounted and maintained easily according to Lindab [2012a]. The device and the associated characteristic curves are shown in the figures below. The derived pressure losses are marked with red lines.
![Page 26 Figure 36: Lindab VVTK [Lindab, 2012b] Figure 37: Lindab VVTK characteristics [Lindab, 2012b] The relevant design parameters are shown in table 7.](/docs-images/75/72184258/images/33-0.jpg "Table 7: Design parameters of VVTK as a function of ventilation rate Ventilation rate [l/s] Pressure loss [Pa] Noise level [db(a)] 10 13 < 15 15 30 ~ 28 Finally, taking short and straight distances")

33 Page 26 Figure 36: Lindab VVTK [Lindab, 2012b] Figure 37: Lindab VVTK characteristics [Lindab, 2012b] The relevant design parameters are shown in table 7. Table 7: Design parameters of VVTK as a function of ventilation rate Ventilation rate [l/s] Pressure loss [Pa] Noise level [db(a)] < ~ 28 Finally, taking short and straight distances into account, the VVTK supply air outlets can be placed in the 18D house as shown in the figures below. Figure 38: Supply air outlet and AHU on the ground floor Figure 39: Supply air outlets on the first floor Placement, size and design of exhaust vents The exhaust vents are placed next to the sources of humidity and pollutants, hence in the kitchen and in the bathroom. Similar to the supply units, the exhaust devices are placed high in the sidewalls and connected straight to the air handling unit in order to minimize pressure losses. Moreover, exhaust devices have to be placed as far away as possible from the supply elements to avoid shortcircuits. If supply and exhaust are too close to each other, the outside air will not be able to mix with the air in the room before being exhausted. If that happens, the ventilation system is inefficient. According to these principles, air is exhausted only at the ground floor from the kitchen and the bathroom. For all the other rooms, where the air is not supplied nor exhaust, it is assumed that these will be ventilated by air coming from less polluted areas of the house, i.e. from the rooms with air supply.
34 Page 27 The Lindab KVG ø125 exhaust device is chosen for the kitchen, which has an exhaust rate of 20 l/s as required by the GBR06. The same element with the size ø100 is chosen for the bathroom, which has an exhaust rate of 15 l/s. Reasonable pressure losses and noise levels can be achieved for the element of size ø100 with a setting (a) of 12 mm and for the element of size ø125 with a setting (a) of 5 mm. The device should be mounted and maintained according to the Lindab installation manual. The characteristic curves of the device are shown in the pictures below and the derived pressure losses are marked with red lines. Figure 40: Lindab KVG ø100 characteristics [Lindab, 2012c] Figure 41: Lindab KVG ø125 characteristics [Lindab, 2012c] The relevant design parameters are shown in table 8. Table 8: Design parameters of KVG in dependence of ventilation rate Ventilation rate [l/s] Pressure loss [Pa] Noise level [db(a)] << <<30 Figure 42 shows the placement of the exhaust vents in kitchen and bathroom. No exhaust vents are placed at the first floor. Figure 42: Exhaust vents and AHU on the ground floor


35 Page Ducting After placing the supply and exhaust terminals it is necessary to design the ducting system. On the one hand the ducting system should be as short and straight as possible to avoid pressure losses. On the other hand, the ease of installation and cost also has to be taken into account. Regarding the product line of Lindab, three different types of duct can be identified: flexible ducts, semi-flexible ducts and rigid ducts. The semi-flexible duct type SRFC is chosen. This type promises easy installation due to the possibility of bending the duct with a minimum radius equal to the duct diameter. Furthermore, it can be installed quite straight in order to reduce pressure losses. However, it is expected that the roughness is slightly higher compared to rigid ducts which would slightly increase the pressure loss. The important characteristics are presented below. Figure 43: SRFC duct [Lindab, 2012d] Figure 44: SRFC characteristics [Lindab, 2012e] Furthermore, diameters of 100 mm and 125 mm are chosen, in accordance with the calculated ventilation rates and air velocities in the respective branches. The duct lengths are presented in the pressure loss calculation in the following chapter and in the appendix 6, 7, 8 and 9. In total about 13 m of SRFCø125 and about 6 m of SRFCø100 are required Intake and outtake According to DS 447:2005 [Dansk Standard, 2005] the placement of intake and outtake is subjected to certain requirements. Within the scope of this project these requirements are adapted to Greenland. The standard states that intakes and exhausts should be placed in such a way that a certain air purity and air temperature can be guaranteed. The ventilation should also not harm the surroundings. Consequently, wind directions and pollution sources in the proximity have to be taken into account. Furthermore, short circuits between exhaust and intake need to be avoided as well as crosswinds which can result in additional pressure losses. Finally the intake and exhaust have to be protected from precipitation like rain, snow or ice. To achieve these requirements, it is necessary to consider the air intake and exhaust carefully. The U.S. Environmental Protection Agency (EPA) [U.S. Environmental Protection Agency, 2012] gives recommendations for the proper placement of intakes and exhausts. The EPA explicitly points out to protect the intake and outtake from animals by using for example grills. An easy accessibility should be also ensured. Finally, the experiences gained from the Low Energy House (LEH) and Appiseq Dormitory have to be also taken into account.
 is chosen in agreement with the supervisor Martin Kotol.")
36 Page 29 Considering the recommendations of the Danish Standard and EPA, the experiences from LEH and Appiseq dormitory and the local weather conditions the following placement of intake (blue spot) and outtake (red spot) is chosen in agreement with the supervisor Martin Kotol. Considering the rigid climate of Greenland, both outtake and intake are placed at a height where it is assumed they will not be covered by banked up snow. However, it is suggested to build some kind of protection for these elements, to avoid introduction of snow which may freeze and block the air passage. Figure 45: Intake and exhaust placement The Lindab KU intake and exhaust device are chosen for the scope of this project. Considering the sum of all required supply ventilation rates (35 l/s) for the intake and the sum of all required ventilation rates for the exhaust (35 l/s), both intake and outtake display a pressure drop of around 32 Pa. If the boost option is used the outtake pressure loss rises to 47 Pa. The particular characteristics are presented below. Figure 46: Exhaust Valve KU [Lindab, 2012g] Figure 47: Characteristics of KU [Lindab, 2012g]
37 Page Pressure losses After choosing all parts of the ventilation system, the pressures losses for all branches can be calculated based on flow rates, velocities and diameters. For the ducts, the specific pressure loss (Δp) is multiplied with the length (L). The pressure losses for intake, outtake, supply terminals and exhaust terminals are obtained from the data sheets, whereas junctions, reductions, widenings and bendings have to be calculated by means of ζ-values. The ζ-values depend on flow direction, duct diameters and volume distribution. They can be calculated and found in graphs and tables according to Schweizer FN [2012a, 2012b, 2012c]. Sometimes ζ-values are not available for special cases. Then, values are obtained from similar but slightly worse cases to avoid underestimation of the pressure losses. For example, ζ-values for a T-branch 30 are not available. Hence values from T-branch 45 are chosen. The results are presented in the table below. All used graphs are shown in the appendix. Table 9: ζ-values Description Calculation / Graph / Table ζ Bending 90, rough r=d Table in appendix Bending 60, rough r=d, conversion factor of 0.74 ζ 60 = ζ (Table in appendix 1) Y-branch 2 30, V out1 =V out2 =0.5 V in, ø in =ø out1 =ø out2 Graph in appendix T-branch 30, V out1 /V in =0.57, ø in =ø out1 =ø out2, branch 1 Graph in appendix T-branch 30, V out1 /V in =0.57, ø in =ø out1 =ø out2, branch 2 Graph in appendix Y-junction 2 30, V out1 /V in =0.57, ø in =ø out1 =ø out2 Graph in appendix Y-junction 2 30, V out2 /V in =0.43, ø in =ø out1 =ø out2 Graph in appendix Reduction Calculation in appendix Widening Graph in appendix Further on, the ζ-values are used to calculate the pressure drop by multiplying the ζ-values (ζ) with the air velocity (v) and the air density (ρ) divided by 2 as shown in the following equation. Afterwards, the pressure loss for each branch can be determined as exemplified in figure 48 for the supply branch connecting the intake and the living room supply terminal. The pressure loss calculation for the other four branches can be found in the appendix 6, 7, 8 and 9.
38 Page 31 Description Name Seller V v ø1 ø2 L Δp ζ p [l/s] [m/s] [mm] [mm] [m] [Pa/m] [-] [Pa] Supply Terminal VVTK Lindab Pipe SRFC Lindab Junction TVTR 30 Lindab Reduction RCLTR Lindab Pipe SRFC Lindab Bending 90 SRFC Lindab Pipe SRFC Lindab AHU CASA Swegon 0.00 Pipe SRFW Lindab Bending 90 SRFW Lindab Intake Terminal KU Lindab Figure 48: Pressure loss calculation of bench between intake and living room The results of the pressure loss calculations for each branch are presented in the table below. Table 10: Comparison of pressure losses in different branches SUM Branch Pressure loss [Pa] Supply 1 Intake and living room Supply 2 Intake and bedroom Supply 3 Intake and bedroom Exhaust 1 Outtake and kitchen Exhaust 2 Outtake and bathroom The results show that the highest pressure loss for the supply occurs in the branch between the intake and the living room. Due to the balancing of the system, this value of about 82 Pa has to be used as design parameter for the supply fan of the air handling unit. On the other hand the highest pressure loss for the exhaust occurs between the outtake and the bathroom. Consequently this value has to be used to determine the power consumption of the exhaust fan. If the boost button is pressed due to smoking or cleaning, for example, then the exhaust ventilation rates are increased. In this short boosting period the system is not balanced. The increased exhaust ventilation rates result in increased pressure losses. In the branch between the outtake and the bathroom, the pressure loss increases to about 92 Pa. Consequently, if the boost button is pressed, this pressure loss needs to be used as the decisive design parameter for the air handling unit Dampers Dampers are used to balance the pressure losses of each supply branch and respectively of each exhaust branch. For an advanced ventilation system, ventilation rates can be decreased during unoccupied hours. Hence, the damper operation needs to be controlled electronically. The Lindab DTHU damper is chosen. These dampers are equipped with electric motors and they can consequently be used in VAV systems. Manual settings of the dampers are not needed. The DTHU and its dimensions are presented in the figures below.
![Page 32 Figure 49: Damper DTHU [Lindab, 2012h] Figure 50: DTHU damper dimensions [Lindab, 2012h] 5.2.10 Type and size of air handling unit Regarding the choice of a well-functioning air handling unit, it is necessary to pay particular attention to the type and size of the AHU.](/docs-images/75/72184258/images/39-1.jpg "The experiences from Appiseq dormitory in Sisimiut reveal that some heat exchanger types cannot resist the cold weather conditions and consequently frost occurs.")
39 Page 32 Figure 49: Damper DTHU [Lindab, 2012h] Figure 50: DTHU damper dimensions [Lindab, 2012h] Type and size of air handling unit Regarding the choice of a well-functioning air handling unit, it is necessary to pay particular attention to the type and size of the AHU. The experiences from Appiseq dormitory in Sisimiut reveal that some heat exchanger types cannot resist the cold weather conditions and consequently frost occurs. Furthermore, the dormitory unit is oversized and operates often just at 10 % of the maximal power. Hence, a proper type and size of the AHU is important to guarantee high energy efficiency. Within the scope of a literature review, Müller [2012] analysed the practicability of different types of heat exchangers in cold climates. Müller discovered that air-to-air heat exchangers coupled with an earth-to-air preheater can resist in extreme cold regions. The frost protection is ensured by the ground loop. However, these heat exchangers are expensive and economically reasonable in new buildings. Regarding renovation projects, newly developed parallel connected flat plate counter flow air-to-air heat exchangers and rotary air-to-air heat exchangers are promising as experienced for example in the Low Energy House in Sisimiut. Particularly the rotary heat-exchanger has the opportunity to improve both the energy efficiency and the indoor climate. The literature review can be found in the appendix 14. The size of the AHU is based on the pressure loss calculation and ventilation rates presented in the previous sections. These two parameters should result in an operating mode of at least 50 % of the maximal power. Hence, it is still possible to increase the ventilation rate if for example the boost button is pressed. Ventilation rates can also be decreased if unoccupied periods occur. However, most of the AHU on the market are designed for large buildings. Only a few manufacturers offer AHUs with reasonable sizes for the residential sector. Based on these decision parameters, the CASA R85 unit produced by the Swedish company Swegon is chosen. This AHU uses a rotary heat exchanger and operates in a reasonable power range with regard to the designed pressure loss and ventilation rates as shown in the following two figures. Additionally the AHU is characterized by low sound emissions. The characteristics are presented in figure 51.
![Page 33 Figure 51: Efficiencies of supply and exhaust fan [Swegon, 2010] The graph shows that the supply fan always runs at 63 % of the nominal power.](/docs-images/75/72184258/images/40-0.jpg "The exhaust fan runs at 60 % of the nominal power if the boost button is not pressed. The power consumption of the exhaust fan rises to 67 % of the nominal power if the button is pressed.")
40 Page 33 Figure 51: Efficiencies of supply and exhaust fan [Swegon, 2010] The graph shows that the supply fan always runs at 63 % of the nominal power. The exhaust fan runs at 60 % of the nominal power if the boost button is not pressed. The power consumption of the exhaust fan rises to 67 % of the nominal power if the button is pressed. The results are shown in the following table. Table 11: Fan operations in dependence of boost option Supply Exhaust No boost Boost No boost Boost Pressure loss [Pa] Fan efficiency [%]

41 Page Control system The design of a control system for the ventilation system is not part of this project, however it is presented an overview of the necessary controllers. The initial ventilation system is based on the Greenlandic Building Regulation, with a constant ventilation rate. Hence the design of the controller system is quite easy. It needs to be mentioned that that the AHU is already equipped with some automatic functions like overheating protection, frost protection and maintenance alarm. The basic controllers necessary for this step are summarized in figure supply exhaust Figure 52: Control system of the initial ventilation system 2 The purple circles in the figure represent different sensors and the rectangles represent the actual controller. The dotted lines connect the sensors to their own controllers and to the controlled element of the ventilation system. Controller (1) receives the temperature measured by a thermostat, downstream of the preheating coil. If this temperature is lower than a defined set point, normally 5 C, it will open the three-way valve and control the output of the preheating coil. Controller (2) receives a signal from the exhaust fan and as soon as the fan is turned off, the controller will send a signal to the external dampers and to the dampers in the supply vents. Controller (3) measures the temperature difference between the outside temperature and the air temperature after the heat recovery, to adjust the fraction of heat transmitted by the heat exchanger. Controller (4) activates the heating coil as soon as the supply temperature is lower than the set point. Controller (5) calculates the pressure difference through the filter and signals when it is time to change the system. Normally the response of the controllers is implemented in software, which allows modification to the system. The chosen AHU unit comes with a control panel and it is supposed that these features are already implemented. Furthermore, in later chapters, the ventilation system is simulated according to standards from other Nordic countries where the ventilation rates can vary with the occupancy level. In this case, a more

42 Page 35 advanced control system is required. The precise development of such control systems is not covered in this project, however a scheme of a basic control system for VAV is presented in figure exhaust 3 4 supply Figure 53: Control system of the ventilation system with variable air volume 6 The only difference with the control system of the initial ventilation system is controller (6), which is connected to a CO 2 sensor inside the room. This will sense period of unoccupancy and set the system on the lowest ventilation rate.
43 Page Drawing of the ventilation system After choosing all parts of the ventilation system, it is necessary to show the complete system design. The following two figures presents the supply and the exhaust branches including all product names, their function and their size. Figure 54: Design of the supply ventilation system

44 Page 37 KVG KVG Figure 55: Design of the exhaust ventilation system Kitchen hood A kitchen hood should be also considered within the scope of the renovation process. However, this hood is not integrated in the ventilation system due to the pollution from cooking, which can harm the air handling unit. Consequently, the exhausted air cannot be utilized to recover heat. It is expected that these heat losses are very small and do not justify assuming the risk of harming the air handling unit. The design and dimensioning of the kitchen hood is not analysed in particular in this project.
45 Page Implementation of the ventilation system in IESve At this step the designed ventilation system is implemented in the IESve model. The implemented system is shown in figure 56. e c d 4 5 f g a b h i inlet outlet Figure 56: Ventilation system implemented in IESve Macroflo The system represented in the picture is a simplified version of the one described in figure 34, in order to ease the simulation. Four thermal zones are defined in the system, highlighted with the red rectangle. These zones are, from the left to the right, the living room, the kitchen, the occupied bedroom and the unoccupied bedroom. This means that all the room that have a supply of fresh air and the kitchen were defined as thermal zones. For ease of calculation and model set-up, the exhausts were also placed in the thermal zones, even if this differs from the real conditions. To keep the system as close as possible to the designed one, outdoor air is supplied only to the living room and the two bedrooms, while no air is supplied to the kitchen. As for the exhaust, the same amount of air supplied is also extracted from the bedrooms, while no air is exhausted from the living room. Hence, the air supplied to the living room is exhausted from the kitchen. Furthermore the ventilation system is composed of two fans, a supply fan (4) and an extract fan (3), a heat exchanger (2) and two heating coils, one to preheat the air before it enters the system (1), the other one to ensure the desired supply temperature (5). The properties of each element are assigned according to the data sheet provided by the manufacturer [Swegon, 2012]. The heating system is not shown in the picture, but it is implemented in the four thermal zones with the set points defined in table 2. The whole system, which includes heating and ventilation, is connected to two heat sources, not represented in the picture, the old oil boiler and electricity grid. The boiler provides hot water for the heating system and for the preheating coil. A constant flow is supplied through the preheating coil in order to avoid freezing, while a three-way valve is used to control the output. The two fans, the rotary heat exchanger and the heating coil are connected to the electricity grid. The heating coil uses electrical power because this is how it is produced by the manufacturer. A control system is used in order to ensure that the system works as intended. The different controllers are shown in figure 56 with green rectangles. The controllers from point d to i" are flow
46 Page 39 controllers, which are not implemented in the real system, but they are required in the program in order to deliver the right amount of air to the different thermal zones and to check that the system is balanced, the program not being able to calculate a non-balanced system. On top of these flow controllers, three other controllers are necessary for running the system. A thermostat (c) is placed downstream of the heating coil and it controls the heating coil so that the supply temperature is kept constant at 18 C. Another thermostat (b) is placed downstream of the heat exchanger. This one has the task to stop the heat exchanger in case of too low temperature difference between the outside temperature and the measured one. The third thermostat (a) is placed downstream of the preheating coil. It will start the coil as soon as the measured temperature is lower than 5 C and it will regulate the output of the coil in order to keep the air temperature above 5 C. 5.4 Simulation results after STEP 3 After applying the ventilation system to the simulation model, the results need to be analysed. Living room, bedroom and kitchen are examined separately in the following sections. Afterwards the energy consumption is described Living room Figure 57 shows the temperature profile after implementing the HVAC system (STEP 3) compared to the results from STEP 1 and STEP2. The peaks during the summer period, which occurred in STEP 2 due to the improved thermal insulation, could be reduced by means of the ventilation system. Hence, the indoor air temperature can be kept within a comfortable range of 24 C and 28 C. Nevertheless, it is recommended to vent in the summer period in order to avoid overheating. However, the implemented ventilation system also reduces the relative humidity as presented in figure 58. In the winter period, the values drop to a minimum of 5%, such low values being not acceptable for comfort. On the other hand, it is expected that the humidity will slightly increase due to housing habits like drying clothes indoor and cooking slowly for long periods of time. Figure 59 shows the best improvement. The use of the ventilation system shows a drop of CO 2 concentration to values below 900 ppm, thus solving the problems with the IAQ resulting after the thermal renovation. The downside of using such a system is an increase in the energy consumption of the dwelling, which will be discussed in later sections.


47 Page 40 Figure 57: Living room temperature profile after STEP 3 Figure 58: Living room relative humidity after STEP 3 Figure 59: Living room CO 2 concentration after STEP Bedroom Figure 60 shows the temperature profile after implementing the HVAC in STEP 3. Similar to the living room, the temperature peaks in summer, which occurred after improving the insulation of the house in STEP 2, are lower. Hence, the maximum of the calculated indoor air temperatures is 28 C, which is a significant improvement, but venting would still be required in order to prevent overheating. The ventilation system also influences the relative humidity in the bedroom as presented in figure 61. The very high simulated relative humidity levels, which occurred after implementing the thermal insulation, decline to satisfying values during the analysed period. However, in the winter time the humidity sometimes drops to levels lower than 10%. Again, a strong influence on the CO 2 concentrations can be seen. Figure 62 shows that the high levels of CO 2 resulting after the renovation are avoided, the new CO 2 levels being kept below 1000 ppm, thus ensuring an acceptable indoor air quality.

48 Page 41 Figure 60: Bedroom temperature profile after STEP 3 Figure 61: Bedroom relative humidity after STEP 3 Figure 62: Bedroom CO 2 concentration after STEP Kitchen The results from the kitchen simulation show similar trends. The temperature peaks in summer could be reduced to maximal 28 C by means of the ventilation system as shown in figure 62. Hence, the thermal indoor climate is within a comfortable range. If overheating occurs, venting is recommended. Similarly, the implementation of the HVAC system is associated with decreasing relative humidity levels as presented in figure 64. The low humidity levels calculated for the other rooms can also be seen in this case, however, the same reasoning concerning the influence of the living habits on the humidity can be applied. The CO 2 concentration is also influenced in this case, the maximum concentration being halved to 900 ppm, compared to the ones calculated for STEP 2. The CO 2 concentration for the kitchen is shown in figure 65.
49 Page 42 Figure 63: Kitchen temperature profile after STEP 3 Figure 64: Kitchen relative humidity after STEP 3 Figure 65: Kitchen CO 2 concentration after STEP Energy consumption In chapter 4.3 it is already expected that the implementation of the ventilation system in STEP 3 will increase the simulated energy consumption. Fresh and cold air has to be preheated and it is blown into the dwelling by means of the fans of air handling unit. Even if heat recovery is used, losses are unavoidable. This assumption is validated by the results obtained from STEP 3 simulation. Figure 66 shows the development of the energy consumption from STEP 1 via STEP 2 to STEP 3 for both weather locations. The energy consumption rises after the simulation of STEP 3. Nevertheless, compared to the initial energy consumption of STEP 1, improvements of about 15 % (Helsinki weather data) and 7 % (Barrow weather data) can be achieved. However, these values savings are not completely satisfying because the energy target of 200 kwh/m²a is not met if weather data from Barrow is used. It is meant to further improve the ventilation system. For example ventilation rates can be lowered during unoccupied hours. Hence energy savings can increase. Consequently, sensitivity analyses needs to be run to detect this potential of improvement.

50 Page 43 Energy target GBR Figure 66: Specific heating demand after STEP 3 simulation 5.5 Cost It is interesting to investigate the investment costs for the designed system. Hence, price lists are studied in order to find the prices per meter for the ducts and the unit prices for all other used parts. Regarding the ducts, they are sold at lengths of 5m, but about 6 m of SRFCØ100 and 13 m of SRFCØ125 are required. Hence, 10 m and 15 m respectively have to be ordered. Prices could not be obtained for the KVG valves, but it is expected that the price of the valves would not have a great influence on the final cost. The price of the AHU has certainly an enormous impact on the price calculation. According to the Swegon Sales Department the price of the AHU amounts to about SKR ( 2890 ). The costs are presented in the table below. Prices for transportation and onsite installation are not included. Table 12: Unit costs of ventilation system [Lindab Online Shop, 2012 and Lindab, 2012i] Name Specification Quantity Unit price Price per 5 m Total price [ /quantity] [ /5m] [ ] SRFC Ø SRFC Ø KU Ø VTTK incl. cover Ø DTHU excl. motors Ø DTHU excl. motors Ø RCLTR Ø TVTR30 Ø YVTR30 Ø YVTR30 Ø KVG Ø100 1 n/a - n/a KVG Ø125 1 n/a n/a CASA R SUM
51 Page Interim conclusion The simulation of STEP 3 shows that implementing a ventilation system into the renovation process strongly influences the indoor climate and the energy consumption: the better the desired indoor air quality, the higher is also the energy consumption. It is therefore necessary to find the right balance between both opponents. Besides, the energy savings can be increased if the ventilation system operates smarter and for example reduces ventilation rates during unoccupied periods. Hence, a sensitivity analysis is run in the following chapter. Regarding the expenses, the price calculation reveals that implementing the ventilation system entails an investment of about On top of this, the additional costs for transportation and installation have to be taken into consideration. On the other hand, these expenses need to be compared individually with the savings obtained by reduced energy consumption. This comparison would help the investment decision.
52 Page 45 6 STEP 4 Sensitivity analysis A sensitivity analysis is carried out to compare the different standards described in chapter 5. The ventilation rates applied to the model of STEP 3 are adjusted according to the standards. Further on, since some of the standards distinguish between occupied and unoccupied hours, the occupancy profile is changed in order to have some hours without occupancy and the different simulations are carried out again. From this step it is expected a drop of a certain size in the energy consumption, because the ventilation system will have some period in which it will run with lower speed. 6.1 Ventilation standards In this step the Greenlandic Building Regulation (GL) is compared with the Danish Building Regulation (DK), the Swedish Building Regulation (SW), the Norwegian Building Regulation (NO), the Finnish Building Regulation (FI) and the European standard EN15251 (EU). For each case the system is balanced and the supply ventilation rates calculated with each of them are summarized in table 13. Table 13: Ventilation rates according to different standards GL [l/s] DK [l/s] SW [l/s] NO [l/s] FI [l/s] EU [l/s] Whole house Living room Bedroom Bedroom From the table it can be seen that in general the regulations from Greenland, Denmark and the EU require the highest global ventilation rate, whereas regulations from Sweden, Norway and Finland demand about 10 l/s less on the whole floor area. Since a variation in the ventilation rate can influence the indoor quality, the CO 2 concentration level simulated with the different standards is plotted for every room. At the same time the energy consumption is considered, which is expected to decrease with a lover ventilation rate. The following figure reportes the CO 2 level for the bedroom, which is considered the worst case condition where two people are sleeping in a small room for 8 hours a day. The graphs of the living room and the kitchen are presented in the appendix 10 and 11.

53 Page 46 Figure 67: Standard s comparison - Bedroom From the picture it can be seen that the best indoor environment is provided by the standards GL, DK, EU, which prescribe the higher ventilation rate. In this case the CO 2 concentration does not exceed 1000 ppm. Finnish and Norwegian cases prescribe a higher ventilation rate in the bedroom, compared to the rest of the area and in this way they allow to keep the level of CO 2 lower than 1300 ppm, that is not considered to be a good indoor environment, but it can anyway be acceptable, since it is not really higher than the actual condition. The worst condition corresponds to Sweden, where 1500 ppm are reached. Also the energy consumption is influenced by the usage of different standards. Decreased ventilation rates, as stated in the Finnish, Swedish and Norwegian building regulations, result in energy saving of about 12 %. This drop is detected in both weather conditions. Especially the electricity consumption of the HVAC system is strongly influenced. However, if weather data from Barrow is used, the energy target of 200 kwh/m²a cannot be achieved. The comparison is presented in the following figure.

54 Page 47 Energy target GBR Figure 68: Standard s comparison energy consumption 6.2 Ventilation standard with different occupancy In this step the occupancy time schedule was changed and it was assumed that all the occupants leave the house between 13:00 and 17:00. Hence the ventilation rates were calculated again for each standard and they were divided in occupied and unoccupied periods for the standards that allow it. The ventilation rates used in this step are summarized in table 14. Table 14: Ventilation rates according to the different standards variation in occupancy GL [l/s] SW [l/s] NO [l/s] EU [l/s] Occ. Unocc. Occ. Unocc. Occ. Unocc. Occ. Unocc. Whole house Living room Bedroom Bedroom As for the previous step, the CO 2 concentration simulated with each standard was plotted for each room. In the following only the analysis for the bedroom is reported, while the analysis of living room and kitchen are presented in the appendix 12 and 13. In comparison with the constant ventilation rates, the graph below shows that obviously the total CO 2 concentration increases slightly in the Sweden and Norway case due to lower ventilation rates in unoccupied hours. Also the EU standard includes reduced ventilation, so that the CO 2 levels are now a little bit higher than the CO 2 levels simulated with the Greenlandic Building Regulation. However, in general the indoor climate is just slightly influenced by the implementation of variable ventilation rates.


55 Page 48 Figure 69: Standard s comparison Bedroom Occupancy variation The energy consumption, calculated with the two different locations Helsinki and Barrow, is reported in figure 70. In comparison with the energy consumption at full occupancy, just slight changes can be detected. Only the electricity consumption of the HVAC system is influenced. However, within the scope of this analysis, the unoccupied period lasts just 4 hours per day. If longer periods occur during work or vacation the energy consumption is expected to decrease stronger. Energy target GBR Figure 70: Standard s comparison energy consumption occupancy variation
56 Page 49 7 Discussion The project reveals the expected results. Extra thermal insulation and a tightened building envelope will definitely reduce the energy consumption as projected by Bjarløv and Vladykova [2011] and Jensen and Marencokova [2010]. On the other hand it is also clear that a mechanical ventilation system is required to ensure a satisfying indoor climate. However, the mechanical ventilation system increases the energy consumption. To solve this conflict several ideas should be discussed with focus on energy saving potential, indoor air quality influences, practicability and cost. In Canada and the United States for example it is allowed partial recirculation of the exhaust air. Due to that option, energy can be saved since less cold outside air is required to ventilate the houses. Regarding the indoor climate, the reuse of air has to be discussed more in detail. Opponents criticize that pollutants are sent back to the rooms generating risk to harm the health of the occupants. This could be a serious problem in Greenland due to the already poor and polluted indoor climate. On the other hand promoters hold against that also humidity can be reused, since low indoor humidity level is another important problem in arctic climates. Consequently, the conflict between energy savings and indoor climate occurs again. Another possibility regards the variability of the HVAC system. Within the sensitivity analysis different flow rates in dependence of the house occupancy were investigated. However, this variability could be enhanced even more. Smarter system could just provide the necessary ventilation rates to occupied floors or even to single occupied rooms with regard to the number of people. The lowest the ventilation rate in unoccupied rooms, the higher energy savings are possible. Smarter systems are certainly more complex and error-prone and complexity increases the cost. Furthermore, it requires qualified personnel to install and repair the system, where Greenland is lacking those professional staff. Another problem occurs from the economic point of view. Already now the electricity prices are higher than the oil prices. Hence, even if the absolute energy consumption decreases by means of the analysed renovation proposal, the electricity bill can increase. This increase is seen as a boundary that can stop the realization of such a project. It also needs to be considered, that in the future the price difference between electricity and oil can rise due to the increasing oil exploration. According to Statistics Greenland [2012] the exploration permission more than trebled from 2007 to Besides, in the same period the prospecting permissions more than doubled. Within the scope of this project a Swegon CASA R85 air handling unit is used, which is equipped with electric heating coil. Hence, electricity could be saved if the AHU would be equipped with a water loop instead. This idea should be forwarded to the manufacturer. The economic effect of such a renovation should not be ignored when discussing with Greenlandic households.
57 Page 50 8 Conclusion In conclusion the project is considered to be successful. The validated simulations proved that extra thermal insulation and a tightened building envelope associated with a mechanical ventilation system ensures a satisfying indoor climate and reduces the energy consumption up to 15 % in the studied 18D house, if the Greenlandic Building Regulation is considered. The energy consumption can be improved even more if ventilation rates from other Nordic countries are applied to the ventilation system. So, additional savings of more than 10 % are reasonable. Further on, variable air volume systems, which decrease the ventilation rates in unoccupied hours, are another possibility to reduce the energy consumption. Hence, it should be possible to achieve the energy target of about 200 kwh/m²a stated in the Greenlandic Building Regulation. However, oil consumptions should not be used to determine the energy efficiency of a house, because the boiler efficiency can distort the actual heating demand strongly. Consequently the installation of a high-efficient boiler should be included in the renovation proposal. If lower energy targets have to be achieved more expensive ideas like ground-loop preheating and individual ventilation have to be considered. It needs to be analysed in future projects if such ideas are practicable and how they will influence the indoor climate.
58 Page VIII References Aigner, D. n.d.. Gleichung zur Berechung der hydraulischen Verluste der Rohrvereinigung kalibriert mit Ergebnissen numerischer und physikalischer Modelle. [pdf] Available at: < [Accessed 28 November 2012]. Bjarløv, S.P. and Vladykova P., The potential and need for energy saving in standard family detached and semi-detached wooden houses in Greenland. Building and Environment 46, pp Boverket, Boverkets Byggregler BBR (BBR 18, BFS 2011:6), s.l.: Boverket. Available through: Boverket < [Accessed 6 August 2012]. Danish Ministry of Economic and Business Affairs, Building Regulations, Copenhagen: Danish Ministry of Economic and Business Affairs. Available through: Danish Business Authority < [Accessed 6 August 2012]. Danish Metrological Institute (DMI), Technical Report The Observed Climate of Greenland, with Climatological Standard Normals, , Copenhagen: DMI. Available through: < [Accessed 10 August 2012]. Dansk Standard, DS 447:2005 Norm for mekaniske ventilationsanlæg. Copenhagen: Dansk Standard. Direktoratet for Boliger og Infrastruktur, Bygningsreglement 2006, s.l.: Namminersornerullutik Oqartussat. Available through: Government of Greenland < media/e84c6dedd16d4603b07459f903d6e2eb.ashx> [Accessed 6 August 2012]. Ebbehøj, N., Moulds in Arctic Buildings a Health Hazard?. In: Ingrid Vernimmen, Challenges for the Arctic Building Industry. Sisimiut, Greenland March Lyngby: Arctic Technology Center, DTU. Engineering Toolbox, Carbon Dioxide Comfort Levels. [online] Available at: < [Accessed 28 November 2012]. European Committee for Standardization, EN 15251:2007 Indoor environment input parameters for design and assessment of energy performance of buildings addressing indoor air quality, thermal environment, lighting and acoustics. Brussels: CEN. Finish Ministry of the Environment Housing and Building Department, D2: Indoor Climate and Ventilation of Buildings Regulations and Guidelines 2003, Helsinki: Finish Ministry of the Environment Housing and Building Department. Available through: Ymparisto < [Accessed 6 August 2012].
59 Page IX Jensen, L.N. and Marencokova, M., Energy Efficient Renovation of Standard Houses in Greenland. Master Thesis. Technical University of Denmark (DTU). Kotol, M., Survey of occupant behaviour, energy use and IAQ in Greenlandic dwellings. In: Ingrid Vernimmen, Challenges for the Arctic Building Industry. Sisimiut, Greenland March Lyngby: Arctic Technology Center, DTU. Kragh, J. and Svendsen, S., Energy performance of the low-energy house in Greenland. In: Proceedings from the Symposium on energy-efficient building. Sisimiut, Greenland April S.l.: Technical University of Denmark (DTU). Lang C. and Detert, M., Hydraulik von Rohrsystemen. [pdf] Available at: < karlsruhe.de/lehre/rohrhydraulik/skripten/vorlesung/neu/skript- Rohrhydraulik_Stand_April2010.pdf> [Accessed 28 November 2012]. Lindab, 2012a. Diffuser VTTK. [pdf] Available at: < lindabwebproductsdoc/pdf/documentation/ads/lindab/mounting/vvtk_mis.pdf> [Accessed 28 November 2012]. Lindab, 2012b. Diffuser Supply Air VVTK. [pdf] Available at: < lindabwebproductsdoc/pdf/documentation/ads/lindab/technical/vvtk.pdf> [Accessed 28 November 2012]. Lindab, 2012c. Exhaust Valve KVG. [pdf] Available at: < lindabwebproductsdoc/pdf/documentation/ads/lindab/technical/kvg.pdf> [Accessed 28 November 2012]. Lindab, 2012d. Semifelxible double duct SRFC. [pdf] Available at: < lindabwebproductsdoc/pdf/documentation/ads/lindab/technical/srfc.pdf> [Accessed 28 November 2012]. Lindab, 2012e. Flexible ductig. [pdf] Available at: < LindabWebProductsDoc/PDF/Documentation/ADS/Lindab/Technical/12-Flexible-andsemiflexible-products-ads.pdf> [Accessed 28 November 2012]. Lindab, 2012f. Valve KVG. [pdf] Available at: < lindabwebproductsdoc/pdf/documentation/ads/lindab/mounting/kvg_mis.pdf> [Accessed 28 November 2012]. Lindab, 2012g. Exhaust Valve KU. [pdf] Available at: < lindabwebproductsdoc/pdf/documentation/ads/lindab/technical/ku.pdf> [Accessed 28 November 2012]. Lindab, 2012h. Shut-off damper with motor shelf. [pdf] Available at: < chnical/dthu.pdf> [Accessed 28 November 2012]. Lindab, 2012i. Lindab Ventilation: Preisliste L2012 Ausgabe März. [pdf] Available at: < [Accessed 28 November 2012].
60 Page X Lindab Online Shop, Lindab Online Shop. [online] Available at: < [Accessed 28 November 2012]. Maalaarut, Sag om vedligeholdelse. [online] Available at: < [Accessed 28 November 2012]. Maalaarut, Overtrædelse af husordensreglerne (hundehold). [online] Available at: < [Accessed 28 November 2012]. Müller, S., Energy efficient ventilation in cold climate with focus on heat recovery. Appendix. Nielsen, H.N., Individual heat metering attitudes to consumption of resources. In: Proceedings from the Symposium on energy-efficient building. Sisimiut, Greenland April S.l.: Technical University of Denmark (DTU). Nors, F.E. et al., Indoor environment and building characteristics in homes of children with and without asthma and allergy in Sisimiut, Greenland. In: Olli Seppaenen, REHVA World Congress: Proceedings of Clima 2007 WellBeing Indoors. Helsinki, Finland June Helsinki: FINVAC. Norwegian Ministry of Local Government and Regional Development, Regulations on technical requirements for building works (Technical Regulations), s.l.: Norwegian Ministry of Local Government and Regional Development. Available through: Direktoratet for Byggkvalitet < [Accessed 6 August 2012]. Poppel, M.K. and Poppel, U., n.d.. The political development in Greenland: Greenland from Colony to Home Rule Government to Self Government. [pdf] Available at: < [Accessed 28 November 2012]. Schweizer FN, 2012a. Zetawerte Rohrbogen Segmentbogen. [online] Available at: < [Accessed 28 November 2012]. Schweizer FN, 2012b. Zetawert Hasenrohr Stromabzweigung. [online] Available at: < [Accessed 28 November 2012]. Schweizer FN, 2012c. Zetawert Abzweig. [online] Available at: < [Accessed 28 November 2012]. Statistics Greenland, Greenland in Figures S.l.: Statistics Greenland. Swegon, Swegon CASA R85. [pdf] Available at: < Ventilation/Ventilation-Units/Supply-and-extract-air-handling-units/Rotary-heatexchanger-R-series/Swegon-CASA-R85-Premium/> [Accessed 28 November 2012]. Tròndheim, G., Kinship in Greenland Emotions of Relatedness. Acta Borealia: A Nordic Journal of Circumpolar Societies, [e-journal], 27 (2), Available through: DTU Library [Accessed 19 September 2012].
61 Page XI University of California (UC) and California State University (CSU), Advanced Variable Air Volume System Design Guide. S.l.: UC and CSU. Available through: UCCSUIOUEE < [Accessed 27 October 2012]. U.S. Department of Energy, Advanced Strategy Guideline: Air Distribution Basics and Duct Design. Oak Ridge, TN: U.S. Department of Energy. Available through: NREL < [Accessed 27 October 2012]. U.S. Environmental Protection Agency, Heating, Ventilation and Air-Conditioning (HVAC) Systems: Location of Outdoor Air Intakes and Exhaust. [online] Available at: < 20Intakes%20and%20Exhaust> [Accessed 28 November 2012]. World of Greenland, World of Greenland Arctic Circle is your best guide to Sisimiut tourist information. [online] Available at: < [Accessed 28 November 2012].
62 Page XII Appendix Appendix 1: 90 and 60 bending [Schweizer FN, 2012a]... XIII Appendix 2: Y-branch 2*30,, V out1 =V out2 =0.5 V in, ø in =ø out1 =ø out2 [Schweizer FN, 2012b]... XIII Appendix 3: T-branch, V out1 /V in =0.57, ø in =ø out1 =ø out2, branch 1 and 2 [Schweizer FN, 2012c]... XIV Appendix 4: Y-junction 2 30, V out1 /V in =0.57, V out2 /V in =0.43, ø in =ø out1 =ø out2, br. 1 & 2 [Aigner, n.d.]... XIV Appendix 5: Reduction and widening [Land, C. and Detert, M., 2004]... XV Appendix 6: Pressure loss calculation of branch between intake and bedroom 1... XV Appendix 7: Pressure loss calculation of branch between intake and bedroom 2... XVI Appendix 8: Pressure loss calculation of branch between outtake and kitchen... XVI Appendix 9: Pressure loss calculation of branch between outtake and bathroom... XVI Appendix 10: Standard s comparison Living room... XVII Appendix 11 : Standard s comparison Kitchen... XVII Appendix 12: Standard s comparison Living room Occupancy variation... XVIII Appendix 13: Standard s comparison Kitchen Occupancy variation... XVIII Appendix 14: Literature review about heat recovery in cold climates [Müller, 2012]... XIX


63 Page XIII Appendix 1: 90 and 60 bending [Schweizer FN, 2012a] Appendix 2: Y-branch 2*30,, V out1 =V out2 =0.5 V in, ø in =ø out1 =ø out2 [Schweizer FN, 2012b]

![2012c] Appendix 4: Y-junction 2 30, V out1 /V in =0.](/docs-images/75/72184258/images/64-1.jpg "57, V out2 /V in =0.43, ø in =ø out1 =ø out2, br.")
64 Page XIV Appendix 3: T-branch, V out1 /V in =0.57, ø in =ø out1 =ø out2, branch 1 and 2 [Schweizer FN, 2012c] Appendix 4: Y-junction 2 30, V out1 /V in =0.57, V out2 /V in =0.43, ø in =ø out1 =ø out2, br. 1 & 2 [Aigner, n.d.]
65 Page XV Appendix 5: Reduction and widening [Land, C. and Detert, M., 2004] Appendix 6: Pressure loss calculation of branch between intake and bedroom 1 Description Name Seller V v ø1 ø2 L Δp ζ p [l/s] [m/s] [mm] [mm] [m] [Pa/m] [-] [Pa] Supply Terminal VVTK Lindab Pipe SRFC Lindab Bending 60 SRFC Lindab Y-Piece (30 ) YVTR 30 Lindab Pipe SRFC Lindab Bending 60 SRFC Lindab Junction TVTR 30 Lindab Reduction RCLTR Lindab Pipe SRFC Lindab Bending 90 SRFC Lindab Pipe SRFC Lindab AHU CASA Swegon Pipe SRFW Lindab Bending 90 SRFW Lindab Intake Terminal KU Lindab SUM 68.34
66 Page XVI Appendix 7: Pressure loss calculation of branch between intake and bedroom 2 Description Name Seller V v ø1 ø2 L Δp ζ p [l/s] [m/s] [mm] [mm] [m] [Pa/m] [-] [Pa] Supply Terminal VVTK Lindab Pipe SRFC Lindab Bending 60 SRFC Lindab Y-Piece (30 ) YVTR 30 Lindab Pipe SRFC Lindab Bending 60 SRFC Lindab Junction TVTR 30 Lindab Reduction RCLTR Lindab Pipe SRFC Lindab Bending 90 SRFC Lindab Pipe SRFC Lindab AHU CASA Swegon Pipe SRFW Lindab Bending 90 SRFW Lindab Intake Terminal KU Lindab SUM Appendix 8: Pressure loss calculation of branch between outtake and kitchen Description Name Seller V v ø1 ø2 L Δp ζ p [l/s] [m/s] [mm] [mm] [m] [Pa/m] [-] [Pa] Exhaust Terminal KVG Lindab Pipe SRFC Lindab Bending 60 SRFC Lindab Y-Piece (30 ) YVTR 30 Lindab Pipe SRFC Lindab Bending 90 SRFC Lindab Pipe SRFC Lindab AHU CASA Swegon Pipe SRFC Lindab Bending 90 SRFC Lindab Pipe SRFC Lindab Bending 90 SRFC Lindab Outtake KU Lindab SUM Appendix 9: Pressure loss calculation of branch between outtake and bathroom Description Name Seller V v ø1 ø2 L Δp ζ p [l/s] [m/s] [mm] [mm] [m] [Pa/m] [-] [Pa] Exhaust Terminal KVG Lindab Pipe SRFC Lindab Widening RCLTR Lindab Bending 60 SRFC Lindab Y-Piece (30 ) YVTR 30 Lindab Pipe SRFC Lindab Bending 90 SRFC Lindab Pipe SRFC Lindab AHU CASA Swegon Pipe SRFC Lindab Bending 90 SRFC Lindab Pipe SRFC Lindab Bending 90 SRFC Lindab Outtake KU Lindab SUM 72.59

67 Page XVII Appendix 10: Standard s comparison Living room Appendix 11 : Standard s comparison Kitchen
68 Page XVIII Appendix 12: Standard s comparison Living room Occupancy variation Appendix 13: Standard s comparison Kitchen Occupancy variation

69 Appendix 14: Literature review about heat recovery in cold climates [Müller, 2012] Page XIX
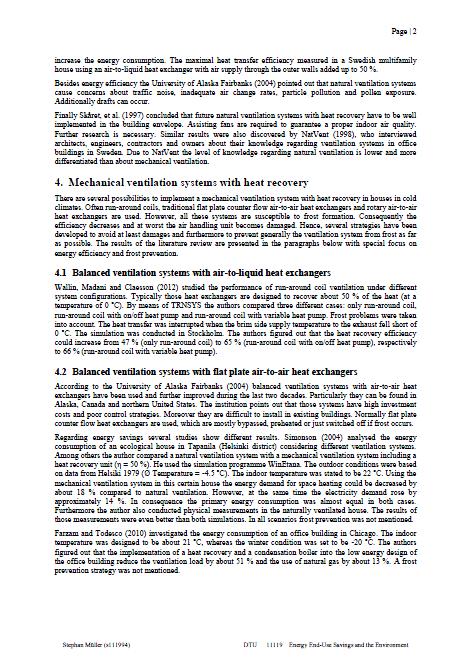
70 Page XX
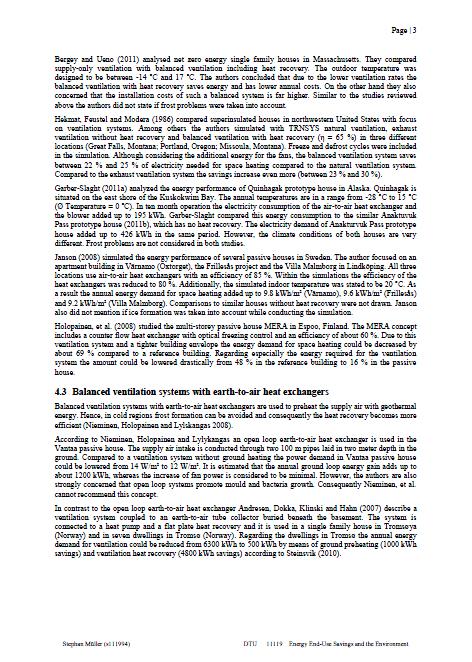
71 Page XXI
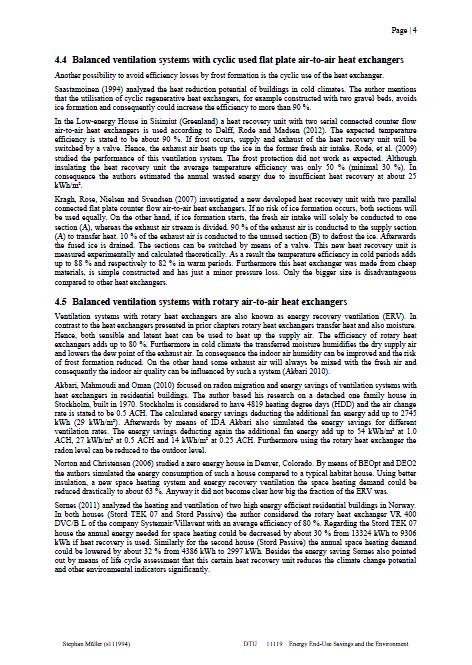
72 Page XXII

73 Page XXIII
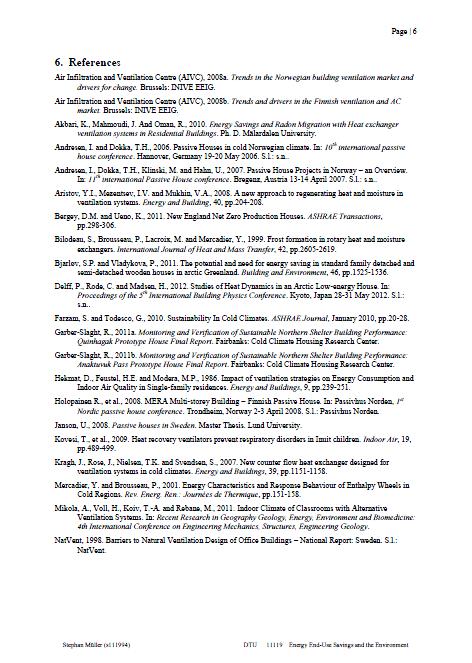
74 Page XXIV
Appendix C House models for Dymola to be used in connection with the OPSYS test rig and annual simulations of the performance of heat pumps
 Appendix C House models for Dymola to be used in connection with the OPSYS test rig and annual simulations of the performance of heat pumps Søren Østergaard Jensen February 2017 1 Preface The present document
Performance of the Low-energy House in Sisimiut
 Performance of the Low-energy House in Sisimiut Carsten Rode 1,*, Jesper Kragh 2, Egil Borchersen 1, Petra Vladykova 1, Simon Furbo 1 and Janne Dragsted 1 1 Technical University of Denmark 2 Danish Building
Figure 1: Low energy dwellings testsite
 Seventh International IBPSA Conference Rio de Janeiro, Brazil August 13-15, 2001 SIMULATION OF DEMAND CONTROLLED VENTILATION IN A LOW-ENERGY HOUSE Netherlands Energy Research Foundation J.C. Römer P.O.
VENTILATIVE COOLING CONTROL STRATEGIES APPLIED TO PASSIVE HOUSE IN ORDER TO AVOID INDOOR OVERHEATING
 VENTILATIVE COOLING CONTROL STRATEGIES APPLIED TO PASSIVE HOUSE IN ORDER TO AVOID INDOOR OVERHEATING Rebeca Barbosa 1, Martin Barták 1, Jan L. M. Hensen 1, 2, Marcel G. L. C. Loomans 2 1 Czech Technical
Villa Bagatelle Technical Report
 Downloaded from orbit.dtu.dk on: Dec 27, 2018 Villa Bagatelle Technical Report Cox, Rimante Andrasiunaite Publication date: 2015 Document Version Publisher's PDF, also known as Version of record Link back
INTRODUCTION OF HYBRID VENTILATION SYSTEMS OF DWELLING BUILDINGS IN LATVIA
 INTRODUCTION OF HYBRID VENTILATION SYSTEMS OF DWELLING BUILDINGS IN LATVIA Anatolijs Borodiņecs, Andris Krēsliņš, Egīls Dzelzītis, and Andris Krūmiņš Riga Technical University, Institute of Heat, Gas and
Analysis of freeze protection methods for recuperators used in energy recovery from exhaust air
 Analysis of freeze protection methods for recuperators used in energy recovery from exhaust air Anna Pacak 1,*, Andrzej Jedlikowski 1, Demis Pandelidis 1, and Sergey Anisimov 1 1 Wrocław University of
Residential Heat Recovery Ventilation. REHVA European Guidebook No 25
 Residential Heat Recovery Ventilation REHVA European Guidebook No 25 REHVA European Guidebook No 25 2 Limited to mechanical supply and exhaust ventilation Targeted to engineers, HVAC consultants and contractors
Reducing the Carbon Footprint of Existing Domestic Heating: A Non-Disruptive Approach
 EEDAL 2009 16-18 June 2009 Reducing the Footprint of Existing Domestic Heating: A Non-Disruptive Approach Martin O Hara Danfoss Randall Limited Abstract There is insufficient time between today and 2020
for family composition, time allocation of people, ownership and specification of home appliances. This paper first presents the simulation procedure
 Validation of an Energy Demand Model of Residential Buildings Yohei Yamaguchi 1*, Yoshiyuki Shimoda 1 1 Graduate School of Engineering Osaka University, S4 Building, 2-1 Yamadaoka, Suita, Osaka, 565-871,
RESEARCH HIGHLIGHT. Arviat E/2 Northern Sustainable House Energy Consumption Performance Assessment
 RESEARCH HIGHLIGHT Arviat E/2 Northern Sustainable House Energy Consumption Performance Assessment April 216 Technical Series INTRODUCTION The Arviat E/2 Northern Sustainable House () was designed and
HEAT RECOVERY VENTILATION For healthy, energy efficient ventilation
 HEAT RECOVERY VENTILATION For healthy, energy efficient ventilation Heat Recovery Ventilation (HRV) is an integral part of the Passive House approach to achieving ultra-low energy houses. In the UK, HRV
Energy Savings Potential of Passive Chilled Beam System as a Retrofit Option for Commercial Buildings in Different Climates
 Purdue University Purdue e-pubs International High Performance Buildings Conference School of Mechanical Engineering 2014 Energy Savings Potential of Passive Chilled Beam System as a Retrofit Option for
SURVEY ON THE OCCUPANT BEHAVIOR RELATING TO WINDOW AND AIR CONDITIONER OPERATION IN THE RESIDENTIAL BUILDINGS
 Proceedings of BS13: SURVEY ON THE OCCUPANT BEHAVIOR RELATING TO WINDOW AND AIR CONDITIONER OPERATION IN THE RESIDENTIAL BUILDINGS Hiromi Habara 1, Rakuto Yasue 1 and Yoshiyuki Shimoda 1 1 Graduate School
RESULTS FROM HOUSE APPLIANCE SAFETY AND DEPRESSURIZATION TESTS CONDUCTED ON SINGLE FAMILY HOUSES UNDERGOING SOUND INSULATION
 RESULTS FROM HOUSE APPLIANCE SAFETY AND DEPRESSURIZATION TESTS CONDUCTED ON SINGLE FAMILY HOUSES UNDERGOING SOUND INSULATION DL Bohac * Center for Energy and Environment, Minneapolis, MN USA ABSTRACT Extensive
Energy consumption in properties
 Energy consumption in properties Glenn Malmberg, Availability of energy Energy and the environment are areas that are in focus both globally and nationally, not least since Al Gore travelled around the
Mechanical Ventilation with Heat Recovery: Designing and implementing a robust and effective ventilation system
 Viewpoint August 2012 Mechanical Ventilation with Heat Recovery: Designing and implementing a robust and effective ventilation system Dr Sarah Price and Helen Brown Summary Mechanical Ventilation and Heat
Residential ventilation concepts based on the idea of displacement airflow distribution
 A strategy for reducing energy demand Student: Aris Gkitzias (I.D:4180380) Mentors: Dr. Regina Bokel, Ir. John van der Vliet MSc graduation project Department of Building Technology, faculty of architecture
Energy Efficiency Rating
 Energy Performance Certificate Northern Ireland 37, Church Street MAGHERA BT46 5EA Date of assessment: 20 July 2011 Date of certificate: 20 July 2011 Reference number: 9639-0923-6880-4640-9926 Type of
Saying Mahalo to Solar Savings: A Billing Analysis of Solar Water Heaters in Hawaii
 Saying Mahalo to Solar Savings: A Billing Analysis of Solar Water Heaters in Hawaii Jenny Yaillen, Evergreen Economics Chris Ann Dickerson, CAD Consulting Wendy Takanish and John Cole, Hawaii Public Utilities
Performance of Heat Recovery Ventilation System with Ground Source Brine Heat Exchanger Pre- Heating System in the Context of nzeb
 Performance of Heat Recovery Ventilation System with Ground Source Brine Heat Exchanger Pre- Heating System in the Context of nzeb Kalle Kuusk 1, Jaanus Hallik 2, Targo Kalamees 3, Tõnu Mauring 4, 1,3
New Construction Builders Challenge: Sealed Attic and High Efficiency HVAC in Central Florida: A Year in Review
 New Construction Builders Challenge: Sealed Attic and High Efficiency HVAC in Central Florida: A Year in Review FSEC-PF-454-11 May 2011 Author Carlos Colon Copyright 2011 Florida Solar Energy Center/University
THE EVALUATION OF MULTI-ZONE AIR FLOW PATTERN AND VENTILATION RATES WITH TRACER GAS METHODS IN APARTMENT HOUSE
 THE EVALUATION OF MULTI-ZONE AIR FLOW PATTERN AND VENTILATION RATES WITH TRACER GAS METHODS IN APARTMENT HOUSE DW Yoon 1, JY Sohn 2, SD Kim 3 and HS Kim 4 1 Dept. of Building Equipment and System Engineering,
Civil Engineering Building
 Continuous Commissioning Report For the Civil Engineering Building Building 492 Submitted to: Utilities Energy Office Physical Plant Department Texas A&M University Prepared by: Energy Systems Laboratory
Code of Practice - Ventilation- Mechanical Extract Ventilation (MEV) + Mechanical Ventilation with Heat Recovery (MHVR)
 + Mechanical Ventilation with Heat Recovery (MHVR)") Code of Practice - Ventilation- Mechanical Extract Ventilation (MEV) + Mechanical Ventilation with Heat Recovery (MHVR) Contractors Requirements & Competency This section outlines the general Standards
Code of Practice - Ventilation- Mechanical Extract Ventilation (MEV) + Mechanical Ventilation with Heat Recovery (MHVR) Contractors Requirements & Competency This section outlines the general Standards
ANALYSIS OF RESIDENTIAL ROOM TEMPERATURE AND OCCUPANT S THERMAL COMPLAINT IN WINTER FIELD SURVEY
 ANALYSIS OF RESIDENTIAL ROOM TEMPERATURE AND OCCUPANT S THERMAL COMPLAINT IN WINTER FIELD SURVEY M Kojima, T Saito Graduate School of Environmental Studies, NAGOYA University, Chikusa, Nagoya, 464-8603
A 92 plus B C D E F 21-38
 Energy Performance Certificate Northern Ireland 5 Harmin Park NEWTOWNABBEY County Antrim BT36 7UR Date of assessment: 12 August 2010 Date of certificate: 17 August 2010 Reference number: 9929-1003-0238-6360-5964
Human response to thermal environment in rooms with chilled beams
 Human response to thermal environment in rooms with chilled beams Arsen Melikov 1, Boryana Yordanova 1, Lyuben Bozkhov 1, Viktor Zboril 1,2, Risto Kosonen 3 1 International Center for Indoor Environment
AERECO DEMAND CONTROLLED VENTILATION COMBINING INDOOR AIR QUALITY AND ENERGY SAVINGS
 AERECO DEMAND CONTROLLED VENTILATION COMBINING INDOOR AIR QUALITY AND ENERGY SAVINGS INNOVATION THAT EXCELS IN AIR QUALITY AND ENERGY SAVINGS Aereco demand controlled ventilation Combining indoor air quality
Simplified Space-Heating Distribution using Radiators in Super-Insulated Apartment Buildings
 Simplified Space-Heating Distribution using Radiators in Super-Insulated Apartment Buildings L. Georges*, K. Wen*,c, M.J. Alonso b, M. Berge*, J. Thomsen b and R. Wang c *Energy and Process Engineering
SIMULATION ANALYSIS OF BUILDING HUMIDITY CONTROL AND ENERGY CONSUMPTION FOR DIFFERENT SYSTEM CONFIGURATIONS USA
 Ninth International IBPSA Conference Montréal, Canada August 15-18, 25 SIMULATION ANALYSIS OF BUILDING HUMIDITY CONTROL AND ENERGY CONSUMPTION FOR DIFFERENT SYSTEM CONFIGURATIONS Chaoqin Zhai 1, Xiaohong
House Efficiency Survey Report
 House Efficiency Survey Report Andy Gabler, Val Horstman, and Fred Thielke Renewable Energy Organization Calvin College April 23, 2008 Abstract: The Renewable Energy Organization s House Efficiency team
Conventional Electric Space Heating Systems
 Running Costs of Conventional Electric Space Heating Systems Dr John Counsell Advanced Control Partnerships Limited Content s Page number Introduction 4 Running Cost 5 Estimation using SAP Different Types
Energy Performance Certificate
 Energy Performance Certificate Northern Ireland 54, Tobarcooran Avenue, NEWTOWNABBEY, BT36 6EP Date of assessment: Date of certificate: Reference number: Type of assessment: Accreditation scheme: Assessor
Temperature Distribution of Rotary Heat Recovery Units
 Temperature Distribution of Rotary Heat Recovery Units Bjørn R. Sørensen, dr.ing. Narvik University College, P.O.Box 385, N-8505 Narvik, Norway Corresponding email: brs@hin.no SUMMARY This paper deals
INDOOR CLIMATE IN HEATING CONDITION OF A LARGE GYMNASIUM WITH UNDER-FLOOR SUPPLY/RETURN SYSTEM
 INDOOR CLIMATE IN HEATING CONDITION OF A LARGE GYMNASIUM WITH UNDER-FLOOR SUPPLY/RETURN SYSTEM Mingjie Zheng Research Laboratory, SANKO AIR CONDITIONING CO., LTD. Nagoya, 450-0003, JAPAN ABSTRACT In large
ENERGY CONSUMPTION OF HOUSES AND LIFESTYLE IN COLD CLIMATIC AREA OF JAPAN
 -9 The 5 World Sustainable Building Conference, Tokyo, 7-9 September 5 (SB5Tokyo) ENERGY CONSUMPTION OF HOUSES AND LIFESTYLE IN COLD CLIMATIC AREA OF JAPAN Kahori GENJO Dr.Eng. Shin-ichi MATSUMOTO Dr.Eng
Aalborg Universitet. CLIMA proceedings of the 12th REHVA World Congress volume 3 Heiselberg, Per Kvols. Publication date: 2016
 Downloaded from vbn.aau.dk on: april 09, 2019 Aalborg Universitet CLIMA 2016 - proceedings of the 12th REHVA World Congress volume 3 Heiselberg, Per Kvols Publication date: 2016 Document Version Publisher's
Clemens Felsmann 1, Jean Lebrun 2, Vincent Lemort 2 and Aad Wijsman 3 ABSTRACT INTRODUCTION METHODOLOGY
 Eleventh International IBPSA Conference Glasgow, Scotland July 27-30, 2009 TESTING AND VALIDATION OF SIMULATION TOOLS OF HVAC MECHANICAL EQUIPMENT INCLUDING THEIR CONTROL STRATEGIES. PART II: VALIDATION
Residential Building Walls and Environment in Amman, Jordan
 Int. J. of Thermal & Environmental Engineering Volume 3, No. 2 (211) 1-7 Residential Building Walls and Environment in Amman, Jordan S. J. Sulaiman*, N. Beithou Department of Mechanical Engineering, Applied
Case Virkakatu, Oulu, Finland
 NSB 2014 10th Nordic Symposium on Building Physics Retrofitting of Buildings I 16 June 2014 Holistic retrofit and follow-up through monitoring: Case Virkakatu, Oulu, Finland Simon le Roux, Yrsa Cronhjort
Distribution systems in apartment buildings
 Article Distribution systems in apartment buildings Halldor Kristjansson, Danfoss A/S www.danfoss.com Halldor Kristjansson, Danfoss A/S Published at the 11th International Symposium on District Heating
EXHAUST AIR HEAT PUMPS EVALUATED FOR NORDIC CIRCUMSTANCES
 Poster P.6.13-1 - EXHAUST AIR HEAT PUMPS EVALUATED FOR NORDIC CIRCUMSTANCES Markus Lindahl, MSc, SP Technical Research Institute of Technology, Energy Technology, Box 857, 501 15 Borås, Sweden; Caroline,
Energy Performance Certificate
 Energy Performance Certificate Northern Ireland 167, Killowen Grange, LISBURN, BT28 3JF Date of assessment: Date of certificate: Reference number: Type of assessment: Accreditation scheme: Assessor s name:
Air and operative temperature measurements in a plus-energy house under different heating strategies
 Downloaded from orbit.dtu.dk on: Oct 03, 2018 Air and operative temperature measurements in a plus-energy house under different heating strategies Kazanci, Ongun Berk; Olesen, Bjarne W. Published in: Proceedings
Modelling Appliance Loads in Multi-Unit Residential Buildings
 Modelling Appliance Loads in Multi-Unit Residential Buildings April 2018 Prepared by: Report For: Contents 1. Introduction... 3 2. Resource Review... 5 3. Recommendations... 7 3.1 What is the reference...
Evaluation on Residential Energy Efficiency Programs Using the City-Scale End-Use Simulation Model
 Evaluation on Residential Energy Efficiency Programs Using the City-Scale End-Use Simulation Model Yoshiyuki Shimoda, Osaka University Takuro Fujii, Osaka University Takao Morikawa, Osaka University Minoru
INDOOR AIR QUALITY IN ENGLISH HOMES - NITROGEN DIOXIDE
 INDOOR AIR QUALITY IN ENGLISH HOMES - NITROGEN DIOXIDE SKD Coward, GJ Raw, JW Llewellyn and DI Ross BRE, Watford WD25 9XX, UK ABSTRACT BRE has conducted a national survey of air pollutants in 876 homes
How to Use Fire Risk Assessment Tools to Evaluate Performance Based Designs
 How to Use Fire Risk Assessment Tools to Evaluate Performance Based Designs 1 ABSTRACT Noureddine Benichou and Ahmed H. Kashef * Institute for Research in Construction National Research Council of Canada
Evaluation of a dynamic model for a cold climate counter flow air to air heat exchanger
 Evaluation of a dynamic model for a cold climate counter flow air to air heat exchanger Toke Rammer Nielsen, Associate Professor, Department of Civil Engineering, Technical University of Denmark; trn@byg.dtu.dk
Maintenance Matters. Maintaining Your Heat Recovery Ventilation System
 NUMBER 16 Maintenance Matters BUILDING MAINTENANCE BULLETIN Maintaining Your Heat Recovery Ventilation System New homes are built to be airtight to reduce heat loss and potential moisture damage to the
SOLAR COMBISYSTEMS IN DENMARK - THE MOST COMMON SYSTEM DESIGNS
 SOLAR COMBISYSTEMS IN DENMARK - THE MOST COMMON SYSTEM DESIGNS Klaus Ellehauge SolEnergi Center Danmark, Danish Technological Institute, Energy, Teknologiparken, DK-8 Aarhus C, Tel.: +45 722 137, Fax:
The importance of hot water system design in the Passivhaus
 The importance of hot water system design in the Passivhaus Alan Clarke, Nick Grant, Elemental Solutions, Withy Cottage, Little Hill, Orcop, Hereford, HR2 8SE, UK Tel: +44(0)1981 540728, e: nick@elementalsolutions.co.uk
Daikin Blueprint: Delivering Hot Water with a Chiller
 Daikin Blueprint: Delivering Hot Water with a Chiller Analyzing the design of heat recovery on air-cooled chillers and the effect it has on building energy consumption By Paul Crisman Daikin Chiller Applications
GROUND COOLING OF VENTILATION AIR FOR ENERGY EFFICIENT HOUSE IN MALAYSIA: A CASE STUDY OF THE COOLTEK HOUSE
 Conference on Sustainable Building South East Asia, -7 November 27, Malaysia GROUND COOLING OF VENTILATION AIR FOR ENERGY EFFICIENT HOUSE IN MALAYSIA: A CASE STUDY OF THE COOLTEK HOUSE G. REIMANN IEN Consultants,
Building Regulations Approved Document F1 Means of Ventilation April 2006
 Building Regulations Approved Document F1 Means of Ventilation April 2006 BPD Structure BUILDING PRODUCT DESIGN LTD 4 trading divisions.. Natural ventilation products and systems Roofing products, flat
A STUDY OF THE IAQ OF RESIDENTIAL BUILDINGS IN SINGAPORE
 A STUDY OF THE IAQ OF RESIDENTIAL BUILDINGS IN SINGAPORE NH Wong, BRJ Huang, KW Tham, C Sekhar and DKW Cheong Dept. Of Building, School of Design and Environment, National University of Singapore, Singapore
Condensation. Some causes, some advice. GGF Condensation Brochure_web.indd 1
 Always use a current GGF Member. To see the latest list of GGF Members visit www.ggf.org.uk/directory ADVICE TO CONSUMER REFERENCE 50.1 MAY 2013 Condensation Some causes, some advice. GGF Condensation
Building Science Basics
 Building Science Basics Introduction to Building Science Basics Since a home is the most significant purchase most people make, and good health is priceless, knowing how to protect both is important. On
Energy Efficiency. Intercept HDDperDay <2e 16 kwhperday
 Energy Efficiency Energy Use of the Eco House Ben Francis Introduction: Three years ago one of the small houses owned by the college was altered with the goal of being more energy efficient. Among the
Feasibility study of the passive solar room dehumidifying system using the sorption property of a wooden attic space through field measurement
 International Conference Passive and Low Energy Cooling 651 Feasibility study of the passive solar room dehumidifying system using the sorption property of a wooden attic space through field measurement
ASHRAE JOURNAL ON REHEAT
 Page: 1 of 7 ASHRAE JOURNAL ON REHEAT Dan Int-Hout Chief Engineer Page: 2 of 7 Overhead Heating: A lost art. March 2007 ASHRAE Journal Article Dan Int-Hout Chief Engineer, Krueger VAV terminals provide
Thermal Comfort with Convective and Radiant Cooling Systems
 Proceedings of 9 th Windsor Conference: Making Comfort Relevant Cumberland Lodge, Windsor, UK, 7-10 April 2016. Network for Comfort and Energy Use in Buildings, http://nceub.org.uk Thermal Comfort with
September 11, 2012 Ministry of Economy, Trade and Industry
 Data 2 Final Report by Heat Pump Water Heater Evaluation Standards Subcommittee, Energy Efficiency Standards Subcommittee of the Advisory Committee for Natural Resources and Energy September 11, 2012 Ministry
DVS HOME VENTILATION SYSTEMS. Product. Scope. Building Regulations. Technical Specification. Appraisal No. 375 [2014]
![DVS HOME VENTILATION SYSTEMS. Product. Scope. Building Regulations. Technical Specification. Appraisal No. 375 [2014]](/thumbs/81/84440869.jpg "DVS HOME VENTILATION SYSTEMS. Product. Scope. Building Regulations. Technical Specification. Appraisal No. 375 [2014]") DVS HOME VENTILATION This Appraisal replaces Appraisal No. 375 (2007) issued 26 November 2007. BRANZ Appraisals Technical Assessments of products for building and construction. Product 1.1 DVS Home Ventilation
DVS HOME VENTILATION This Appraisal replaces Appraisal No. 375 (2007) issued 26 November 2007. BRANZ Appraisals Technical Assessments of products for building and construction. Product 1.1 DVS Home Ventilation
Home Fires Involving Heating Equipment
 Home Fires Involving Heating Equipment December 2017 Richard Campbell December 2017 National Fire Protection Association Abstract In 2011-2015, U.S. fire departments responded to an estimated average of
A 92 plus B C D E 39-54
 Energy Performance Certificate Northern Ireland 21 Veryan Gardens NEWTOWNABBEY County Antrim BT36 7HG Date of assessment: 23 March 2010 Date of certificate: 24 March 2010 Reference number: 9780-0327-6420-8617-9926
IAQ: Re-tuning Commercial Buildings
 IAQ: Re-tuning Commercial Buildings A low-cost path to improved air quality and energy efficiency. B y S c o t t G o r d o n, C M All images courtesy of Johnson Controls Service. 10 RSES Journal FEBRUARY
Energy Efficiency Rating
 Energy Performance Certificate Northern Ireland 49, Donard Avenue BANGOR BT20 3QD Date of assessment: 08 December 2017 Date of certificate: 08 December 2017 Reference number: 9663-0022-7739-7078-8902 Type
WORKSHOP VENTILATION- PSYCHROMETRICS-AHU
 Alkis Triantafyllopoulos Mechanical Engineer Member TEE, MASHRAE a.trianta@gmail.com WORKSHOP VENTILATION- PSYCHROMETRICS-AHU Based on ASHRAE 62 Purpose Set minimum Outdoor Air ventilation Rates Air Quality
PART 5: HVAC & DHW SYSTEMS
 PART 5: HVAC & DHW SYSTEMS Building Science Review Building Science Review: HVAC & DHW Systems This document will help you: Correctly answer all parts of the HVAC Systems section in the Home Energy Score
New requirements for IEC best practice compliance
 New requirements for IEC 61511 best practice compliance Proof testing and a SIL study may no longer be enough by Sven Grone Schneider Electric Safety Services Practice Leader Executive summary Since its
Modular prefab integrated HVAC units: description and development of demonstration units (D2.3)
") Modular prefab integrated HVAC units: description and development of demonstration units (D2.3) Development and advanced prefabrication of innovative, multifunctional building envelope elements for MOdular
Modular prefab integrated HVAC units: description and development of demonstration units (D2.3) Development and advanced prefabrication of innovative, multifunctional building envelope elements for MOdular
Building services installation. Sustainable retrofitting of buildings- Sub module 3
 Building services installation Sustainable retrofitting of buildings- Sub module 3 District heating Towards lower temperature on primary side New demands to secondary side Prerequisits Low flow temperature
Computer Modelling and Simulation of a Smart Water Heater
 Computer Modelling and Simulation of a Smart Water Heater Maria Kathleen Ellul University of Malta ellul_maria@yahoo.com Adrian Muscat University of Malta adrian.muscat@um.edu.mt Abstract A computational
Role of Nano-technology for improving of thermal performances of vapour compression refrigeration system (VCRS): An Overview
: An Overview") International Journal of Research in Engineering and Innovation Vol-2, Issue-1 (2018), 21-28 International Journal of Research in Engineering and Innovation (IJREI) journal home page: http://www.ijrei.com
International Journal of Research in Engineering and Innovation Vol-2, Issue-1 (2018), 21-28 International Journal of Research in Engineering and Innovation (IJREI) journal home page: http://www.ijrei.com
Solar thermal solutions within the Energy Labelling Context
 Solar thermal solutions within the Energy Labelling Context General features Place, Date General context linked to solar thermal solutions The Energy Labelling regulations refer to many solar items : Solar
CARRIER edesign SUITE NEWS. Modeling 100% OA Constant Volume Air Systems. Volume 6, Issue 1. Page 1 Modeling 100% OA Constant Volume Air Systems
 Volume 6, Issue 1 CARRIER edesign SUITE NEWS Modeling 100% OA Constant Volume Air Systems This article provides an overview of how to model a stand-alone constant air volume (CAV) 100% OA system in HAP.
INVESTIGATION FINDINGS III IMPACT OF INADEQUATE VENTILATION AND DISCHARGE SYSTEMS
 INVESTIGATION FINDINGS III IMPACT OF INADEQUATE VENTILATION AND DISCHARGE SYSTEMS SUMMARY Ammonia odours were reported in the community close to the time of the incident (Appendix D) and firefighters reported
Building Regulations 2010: What it means to you.
 Building Regulations 2010: What it means to you. Where are we going? Ongoing changes to the ADF (Approved Document F) will bring about several differences to the way in which we use Ventilation in both
NATIONAL SURVEY OF DOMESTIC MANAGEMENT OF ORGANIC WASTE
 NATIONAL SURVEY OF DOMESTIC MANAGEMENT OF ORGANIC WASTE Abstract September 2008 Study realised for ADEME by INDDIGO and LH2 National survey of domestic management of organic waste Stéphane OLIVIER et Agnès
Guidelines for energy efficient heating, ventilation and air conditioning (HVAC) systems
 systems") Guidelines for energy efficient heating, ventilation and air conditioning (HVAC) systems If you're a designer or a BCA, this guidance on the energy efficiency of HVAC systems in commercial buildings may
Guidelines for energy efficient heating, ventilation and air conditioning (HVAC) systems If you're a designer or a BCA, this guidance on the energy efficiency of HVAC systems in commercial buildings may
Date of assessment: 08 February 2014 Date of certificate: 10 February 2014 Reference number:
 Energy Performance Certificate Northern Ireland 385, Oldpark Road BELFAST BT14 6QS Date of assessment: 08 February 2014 Date of certificate: 10 February 2014 Reference number: 0965-2998-0821-9104-3245
BNWAT28: Water consumption in new and existing homes
 BNWAT28: Water in new and existing homes Version 1.0 This Briefing Note and referenced information is a public consultation document and will be used to inform Government decisions. The information and
Aalborg Universitet. Diffuse Ceiling Inlet Systems and the Room Air Distribution Nielsen, Peter Vilhelm; Jensen, Rasmus Lund; Rong, Li
 Aalborg Universitet Diffuse Ceiling Inlet Systems and the Room Air Distribution Nielsen, Peter Vilhelm; Jensen, Rasmus Lund; Rong, Li Published in: Clima 2010 : 10th Rehva World Congress Publication date:
Healthy Buildings 2017 Europe July 2-5, 2017, Lublin, Poland
 Healthy Buildings 217 Europe July 2-5, 217, Lublin, Poland Paper ID 95 ISBN: 978-83-7947-232-1 Verification of gymnasium designed by high thermal insulation considering elderly people in disaster Koki
STUDY ON THE REACTION TO FIRE OF MEDIUM VOLTAGE CABLES SYSTEMS
 STUDY ON THE REACTION TO FIRE OF MEDIUM VOLTAGE CABLES SYSTEMS Neus GENERÓ, Juan de Dios MARTÍNEZ, Jacint ROVIRA, Grupo General Cable Sistemas, (Spain), ngenero@generalcable.es, jdmartinez@generalcable.es,
Using Infrared for Residential Energy Surveys
 Using Infrared for Residential Energy Surveys Dave McCullen Sumter Electric Cooperative Inc. ABSTRACT In the electric industry today, advising consumers on energy conservation has replaced selling energy
Q1. The diagram shows an experiment to find out what happens to infrared waves when they strike different surfaces.
 Q1. The diagram shows an experiment to find out what happens to infrared waves when they strike different surfaces. (a) The water in the black tube gets hotter than the water in the shiny tube. Choose
PERFORMANCES OF DAHT CONNECTED TO BUILDING AIRTIGHTNESS AND INDOOR HYGRO- THERMAL CLIMATE
 PERFORMANCES OF DAHT CONNECTED TO BUILDING AIRTIGHTNESS AND INDOOR HYGRO- THERMAL CLIMATE Masy Gabrielle 1, Lebrun Jean 2, Gendebien Samuel 3, Nicolas Hansen 1, Marc Lengele 4, and Luc Prieels 5 1 CECOTEPE
THE AMOUNT OF ACCUMULATED DUST IN DUCTS OF NEW HVAC INSTALLATIONS
 THE AMOUNT OF ACCUMULATED DUST IN DUCTS OF NEW HVAC INSTALLATIONS R Holopainen 1*, M Tuomainen 1, V Asikainen 2, P Pasanen 2, J Säteri 3, O Seppänen 1 1 Helsinki University of Technology, Laboratory of
Mechanical System Redesign. Dedicated Outdoor Air System. Design Criteria
 Mechanical System Redesign Dedicated Outdoor Air System Design Criteria The outdoor air conditions used were for Philadelphia, Pennsylvania IAP at a 0.4% occurrence. The supply air conditions were developed
CITY OF DANA POINT. COMMUNITY DEVELOPMENT, BUILDING AND SAFETY Golden Lantern, Suite 209 Dana Point, CA
 CITY OF DANA POINT COMMUNITY DEVELOPMENT, BUILDING AND SAFETY 33282 Golden Lantern, Suite 209 Dana Point, CA 92629 949 248 3594 www.danapoint.org INDOOR AIR QUALITY B011 AIR 2013 CALIFORNIA CODES CODE
Computing Services Center
 Continuous Commissioning Report for the Computing Services Center Building #516 Submitted to: Utilities Energy Office Physical Plant Department Texas A&M University Prepared by: Energy Systems Laboratory
The Performance of Diffuse Ceiling Inlet and other Room Air Distribution Systems Nielsen, Peter Vilhelm; Jakubowska, Ewa
 Aalborg Universitet The Performance of Diffuse Ceiling Inlet and other Room Air Distribution Systems Nielsen, Peter Vilhelm; Jakubowska, Ewa Published in: COLD CLIMATE HVAC 2009 Publication date: 2009
Press Release. How can the efficiency of the dryer section be increased? Dryer Section All Paper Grades. Heimbach wherever paper is made.
 Dryer Section All Paper Grades Press Release How can the efficiency of the T. Bock (Dipl.-Ing.), Manager Application & Technical Service, Heimbach GmbH & Co. KG, thomas.bock@heimbach.com I. Durniok (Dipl.-Ing.),
OCCUPANT INTERACTION WITH VENTILATION SYSTEMS 7th AIC Conference, Stratford-upon-Avon, UK
 OCCUPANT INTERACTION WITH VENTILATION SYSTEMS 7th AIC Conference, Stratford-upon-Avon, UK 29 September - 2 October 1986 PAPER 9 USER CONTROLLED EXHAUST FAN VENTILATION IN ONE-FAMILY HOUSES Ake Blomsterberg
ENERGY EFFICIENCY BRIEF REPORT
 ENERGY EFFICIENCY BRIEF REPORT 1 Odooproject s energy efficient building design was mainly formed by the tight interaction of students from the Faculty of Architecture and the Faculty of Mechanical Engineering
EVALUATION OF THE THERMAL PERFORMANCE OF METAL ROOFING UNDER TROPICAL CLIMATIC CONDITIONS
 EVALUATION OF THE THERMAL PERFORMANCE OF METAL ROOFING UNDER TROPICAL CLIMATIC CONDITIONS Mohamed HARIMI Djamila HARIMI V. John KURIAN Bolong NURMIN 1 Center of Mineral and Materials, Universiti Malaysia
Guide To Troubleshooting INEFFICIENT COOLING FANS
 Guide To Troubleshooting INEFFICIENT COOLING FANS TABLE OF CONTENTS Introduction Enclosure Cooling Basics Key Attributes of Enclosure Cooling Symptoms of Poor Enclosure Cooling Typical Cooling Fan Problems