Carving up the Northshore
|
|
|
- Oswald Gallagher
- 5 years ago
- Views:
Transcription
1 April 9, 2010 The Southeastern Louisiana University Business Research Center (BRC) is jointly operated by the Southeast Louisiana Business Center and the Southeastern College of Business. The BRC provides applied economic analyses and research studies that aid business and economic development efforts for the five parish Northshore region of southeast Louisiana. The Center represents one aspect of the University s commitment to economic development in the region. The Center is located in the Southeast Louisiana Business Center on Martens Drive, two blocks west of the main campus of Southeastern Louisiana University. The Business Research Center is a proud member of the Association for University Business and Economic Research (AUBER) and the Council for Community and Economic Research (C2ER). The following study was conducted using generally accepted research methods, models and techniques. The research, results and report are copyrighted, but may be reproduced and distributed through any means, provided the report is reproduced in its entirety with the Southeastern Louisiana University name and logo attached. The information gathered and/or study results are for informational purposes only and are not intended to be used for investment or lending decisions. Research and results of this study do not represent any form of endorsement by Southeastern Louisiana University. Sincerely, William Joubert Director Business Research Center Southeastern Louisiana University Business Research Center A Collaborative Effort of the Southeast Louisiana Business Center and the Southeastern Louisiana University College of Business

2 Carving up the Northshore Estimated Retail Trade Areas of Twelve Northshore Communities April 2010 Southeastern Louisiana University Business Research Center & College of Business Herb Holloway Dr. Abul Jamal William Joubert
3 ii Table of Contents Table of Contents... ii Index of Tables... iii Index of Figures... iii Introduction... 1 Trade Area Analysis Techniques... 1 Overview of the Northshore Retail Market... 2 Twelve Northshore Retail Communities... 8 Competing Communities outside the Northshore Equal Competition Trade Areas Market Penetration Models Reilly Gravitation Model The Huff Model Conclusions Bibliography Appendices... 30
4 iii Index of Tables Table Title Page Table 1 RMP Opportunity Gap summary for the 5 parish Northshore Region: 2009 estimates 4 Table 2 RMP Opportunity Gap/Surplus by parish for the 5 parish Northshore Region: 2009 estimates 7 Table 3 Twelve selected Northshore retail communities with estimated 2009 retail sales volume from Claritas RMP Opportunity Gap Report 8 Table 4 Twelve selected non Northshore retail communities with estimated 2009 retail sales volume from Claritas RMP Opportunity Gap Report 10 Index of Figures Figure Title Page Figure 1 Twelve Selected Northshore Retail Communities.. 9 Figure 2 Twelve Selected Northshore Retail Communities and Twelve Selected Surrounding Retail Communities 11 Figure 3 Equal Competition Trade Areas 12 Figure 4 Selected Retail Communities with Symbols Scaled to Volume of Retail Sales 13 Figure 5 Estimated Northshore Trade Areas for Total Retail Sales: Reilly Model. 14 Figure 6 Western Northshore Estimated Trade Areas for TOTAL RETAIL SALES: Huff Equal Probability Model. 18 Figure 7 Western Northshore Estimated Trade Areas for BIG TICKET ITEMS: Huff Equal Probability Model. 19 Figure 8 Western Northshore Estimated Trade Areas for CONVENIENCE ITEMS: Huff Equal Probability Model. 20 Figure 9 Western Northshore Estimated Trade Areas for MID RANGE ITEMS: Huff Equal Probability Model. 21 Figure 10 Western Northshore Estimated Trade Areas for FOODSERVICE SALES: Huff Equal Probability Model Figure 11 Eastern Northshore Estimated Trade Areas for TOTAL RETAIL SALES: Huff Equal Probability Model. 23 Figure 12 Eastern Northshore Estimated Trade Areas for BIG TICKET ITEMS: Huff Equal Probability Model. 24 Figure 13 Eastern Northshore Estimated Trade Areas for CONVENIENCE ITEMS: Huff Equal Probability Model. 25 Figure 14 Western Northshore Estimated Trade Areas for MID RANGE ITEMS: Huff Equal Probability Model. 26 Figure 15 Eastern Northshore Estimated Trade Areas for FOODSERVICE SALES: Huff Equal Probability Model Figure 15a Eastern Northshore Estimated Trade Areas for FOODSERVICE SALES: Huff Model WITHOUT GNO... 28
5 1 Introduction Trade area analysis encompasses a variety of techniques designed to determine the geographic area from which a store or community draws its customers. The goal is to identify market islands in a sea of competing stores/communities using criteria such as travel distance and attractiveness to shoppers. Attractiveness can be measured using factors such as community population, retail square footage, retail sales volume, number of retail stores of a particular type, age of a store, number of parking spaces, ease of access, etc. Once the trade area has been defined, demographic data can be used to describe and analyze the target market, leading to more effective development, site selection, merchandising, and marketing decisions. Trade Area Analysis Techniques The simplest methods of defining trade areas assume that the store or community has a spatial monopoly on customers in its region, i.e. that customers within a certain distance or drive time from the store or community have no other shopping options and will always choose to shop at the site being studied. Techniques in this category include concentric rings, drive time polygons, and Thiessen polygons. These methods assume that distance is king, overruling every other factor so that the customer always decides to shop at the nearest location. Although never totally true in real world situations, this is closest to reality for necessity or convenience items such as gasoline and groceries. More complex and generally more realistic methods are market penetration models. The market penetration nomenclature owes to the fact that these models acknowledge there are competing stores or communities vying for every customer, and so the shape of trade areas is influenced by the degree of competition in any given direction. One of the oldest and most widely used market penetration models is based on Reilly s Law of Retail Gravitation, developed by William J. Reilly in Reilly s Law states that larger stores or communities (as measured by such factors as population, retail sales, or retail square footage) have larger and stronger spheres of influence than smaller stores or communities, meaning that consumers are willing to travel longer distances to shop in larger stores and communities. The model assumes that people will choose the larger store or community, due to greater variety and choice of products, until the distance from the larger store or community outweighs the appeal of shopping there.
6 2 The mathematical formula developed by Reilly is used to calculate the break point, the distance at which customers living between competing stores or communities are expected to switch their shopping choice from one city to the other. Refinements to the Reilly model were made by Dr. David Huff in 1963 to create what is now known as the Huff Model. Almost 50 years later, it remains the most widely used and popular method for predicting retail customer behavior. As Ela Dramowicz (2005) said of the Huff Model, Its popularity and longevity can be attributed to its conceptual appeal, relative ease of use, and applicability to a wide range of problems, of which predicting consumer spatial behavior is the most commonly known. The output from the Huff Model is a probability surface or grid describing the probability that a customer at any given location will shop in a certain community or store. The probability surface is based on a spatial interaction model that takes into account distance, attractiveness factor(s), and competition. Overview of the Northshore Retail Market The five parishes which make up the Northshore region (Livingston, St. Helena, St. Tammany, Tangipahoa, and Washington) have a population of approximately 530,000, representing 12 percent of all Louisiana residents. Using the known population (or number of households) of an area and the per capita (per household) expenditures (collected by the U.S. Census Bureau for the Bureau of Labor Statistics), it is possible to estimate the cumulative demand for various products and services by residents of the area based on their spending patterns. These demand estimates can then be compared to sales data for businesses in the area derived from the Census of Retail Trade reported by the U.S. Census Bureau, which represent the supply of goods and services in that area. If the demand (consumer expenditures) for goods and services exceeds the supply (sales totals) in the area under study, the difference represents how much the residents of the area are spending outside the area for goods and services. These dollars, known as retail leakages, represent the loss of potential economic activity, jobs, and sales tax revenue for the community, indicating an opportunity gap for retail growth.
7 3 On the other hand, if total sales (supply) by business establishments in the area exceed consumer expenditures (demand) by residents, this indicates that the businesses are drawing customers (and their spending) from outside the area, creating a retail sales surplus. Of course, a surplus caused by inflows from transient visitors (such as tourists or interstate travelers), can mask the fact that there may still be leakages of spending by local residents to businesses outside the area. Surveys of area residents at their homes will be required to discover and measure leakages in this situation. A Claritas, Incorporated Retail Market Power (RMP ) Opportunity Gap Report for the Northshore region estimated 2009 total consumer expenditures of 7.6 billion. Retail sales by Northshore businesses were almost equal at approximately 7.7 billion, meaning that inflows and outflows (leakages) of retail dollars into and out of the Northshore were almost equal. The Northshore RMP Opportunity Gap Report is included with this study as Appendix A. The RMP report analyzes retail supply and demand at multiple levels based on 3 digit to 6 digit NAICS (North American Industry Classification System) codes. The 3 digit codes are the broadest categories in the Report Food and Beverage Stores (Code 445), Motor Vehicle and Parts Dealers (Code 441), etc. As more digits are added to the code the scope of that classification becomes increasingly narrow. For example, one 4 digit code under Food and Beverage Stores (Code 445) is Grocery Stores (Code 4451), which is further sub divided into two 5 digit codes Supermarkets & Grocery (exc. Convenience) Stores (Code 44511) and Convenience Stores (Code 44512). The RMP Opportunity Gap report includes 13 primary 3 digit sectors. The titles and 3 digit NAICS codes of these sectors are as follows: Motor Vehicle and Parts Dealers 441 Furniture and Home Furnishings Stores 442 Electronics and Appliance Stores 443 Building Material, Garden Equipment Stores 444 Food and Beverage Stores 445 Health and Personal Care Stores 446 Gasoline Stations 447 Clothing and Clothing Accessories Stores 448 Sporting Goods, Hobby, Book, Music Stores 451 General Merchandise Stores 452 Miscellaneous Store Retailers 453 Non Store Retailers 454 Foodservice and Drinking Places 722
8 4 Miscellaneous Store Retailers includes florists, office supply and stationery stores, gift, novelty, and souvenir shops, used merchandise stores, etc. Non Store Retailers includes catalog, mail order, and Internet based retailers. Sector 452 General Merchandise Stores includes two sub sectors, Department Stores 4521 and Other General Merchandise Stores Most warehouse stores, club stores, and super stores report their sales under Sub Sector An estimated 37 percent of Target s sales are food and household products, while the percentage is 60 percent for Wal Mart (Associated Press, 2009). Upon reviewing the RMP report, it appears that some consumers may be reporting their spending at these super stores under Sector 445 Food and Beverage Stores. However, with the sales by these same stores reported under Sector 452 (Sub Sector 4529), the gap/surplus estimates for these two sectors are rendered meaningless. In order to mitigate this problem, Sub Sector 4529 will be merged with Sector 445 for all analyses in this report. Sub Sector 4521 Department Stores will remain as the only sub sector represented in Sector 452. Using this modification, total Northshore demand and supply for the 13 three digit sectors is tabulated in Table 1. Table 1. RMP Opportunity Gap summary for the 5 parish Northshore Region: 2009 estimates Source: Claritas, Inc. Retail Stores 2009 Demand (Consumer Expend.) 2009 Supply (Retail Sales) Opportunity Gap/Surplus Total Retail Sales 7,615,563,069 7,675,258,846 (59,695,777) Motor Vehicle and Parts Dealers 441 1,120,036,417 1,056,789,004 63,247,413 Furniture and Home Furnishings Stores ,040, ,552,990 14,487,332 Electronics and Appliance Stores ,654, ,952,950 (15,298,297) Building Material, Garden Equip. Stores ,343,889 1,150,402,025 (277,058,136) Food and Beverage Stores ,551,081,966 1,645,028,940 (93,946,974) Other General Merchandise Stores 4529 Health and Personal Care Stores ,289, ,597,001 46,692,032 Gasoline Stations ,096,015 1,337,186,977 (452,090,962) Clothing and Clothing Access. Stores ,853, ,328, ,524,719 Sport. Goods, Hobby, Book, Music Stores ,556, ,296,992 26,259,971 Department Stores Excl. Leased Depts ,053, ,176,994 72,876,370 Miscellaneous Store Retailers ,191, ,550,048 (98,358,448) Non Store Retailers ,769, ,434, ,334,362 Foodservice and Drinking Places ,595, ,961, ,634,841
9 5 So while the Northshore had almost equal total retail demand and supply in 2009, Table 1 illustrates that there were widely divergent results when comparing demand and supply in the various individual sectors. The Northshore had five sectors that showed a surplus in 2009, pulling in net consumer expenditures from outside the region, and eight sectors which exhibited an opportunity gap, where consumer spending leaked out of the region. Listed from greatest surplus to greatest leakage/gap, the 13 sectors fall in the following order: Sector Opportunity Gap/Surplus Gasoline Stations (452,090,962) Building Material, Garden Equip. Stores (277,058,136) Miscellaneous Store Retailers (98,358,448) Food and Beverage Stores + Other General Merchandise Stores (93,946,974) Electronics and Appliance Stores (15,298,297) Furniture and Home Furnishings Stores 14,487,332 Sporting Goods, Hobby, Book, Music Stores 26,259,971 Health and Personal Care Stores 46,692,032 Motor Vehicle and Parts Dealers 63,247,413 Department Stores Excl. Leased Depts. 72,876,370 Clothing and Clothing Access. Stores 144,524,719 Foodservice and Drinking Places 149,634,841 Non Store Retailers 359,334,362 Given the numerous, heavily traveled interstates which bisect the Northshore, it is no surprise that the region pulls in almost half a billion dollars in net inflows in the Gasoline Stations sector. The numerous home improvement stores and lumber yards along the I 12 corridor also show their attractiveness to consumers outside the region through 277 million of net retail pull. On the leakage end of the spectrum, the region is losing a lot of retail spending (and related sales tax dollars) in the Non Store Retailers sector, few of which are located on the Northshore. The other sectors with large leakages illustrate both the close proximity of the large retail markets in Baton Rouge and New Orleans, as well as the effect on spending brought about by the large numbers of Northshore
10 6 residents that commute outside the area for work. The BRC s Northshore Commerce Study (Holloway, et al., 2008) reported that only half of Northshore employees work on the Northshore. In Livingston Parish, the percentage is only 29 percent. (More than twice as many Livingston Parish residents work in East Baton Rouge Parish as work in Livingston Parish.) Employees who commute will naturally spend some of their retail expenditures in the community where they work and in the communities between their place of residence and place of employment. The Northshore is a large and diverse region, and the economies of the various communities differ greatly in scale, focus, and flavor. In order to highlight possible differences at the parish level, Table 2 indicates the retail opportunity gap or surplus for the 13 three digit sectors (as modified, see above) for each of the five Northshore parishes. (The complete Claritas RMP reports for each parish are included as Appendices B F.) As shown in Table 2, St. Tammany and Tangipahoa parishes had overall retail surpluses of approximately 886 million and 264 million, respectively, while Livingston, Washington, and St. Helena parishes had retail leakages of approximately 880 million, 114 million, and 97 million, respectively. (It should be noted that sales of the Bass Pro Shop in Denham Springs, which opened in February 2008, have not yet been captured by the Census of Retail Trade and so are not reflected in the Claritas reports for Livingston Parish.) Every Northshore parish except St. Helena showed a surplus in the Gasoline Stations sector. However, St. Helena was the only Northshore parish to show a surplus in the Clothing and Clothing Accessories Stores sector (which was the only sector for which St. Helena had a surplus). St. Tammany Parish was the sole parish recording surpluses in the Furniture and Home Furnishing Stores, Electronics and Appliance Stores, and the modified Food and Beverage Stores + Other General Merchandise Stores sectors, while Tangipahoa Parish was the only parish among the five to show a surplus in the Foodservice and Drinking Places sector. Tangipahoa s surplus in the Motor Vehicle and Parts Dealers sector seems especially large relative to the scale of its economy, as does Washington Parish s surplus in the Health and Personal Care Stores sector. There are likely particular economic, demographic, or historical factors which would explain how these sectors came to be inordinately strong in these parishes. Tangipahoa Parish also shows a very large surplus in the Gasoline Stations sector, but this would be expected, given the fact that the parish is transected by two heavily traveled interstates with numerous interchanges.
11 7 Table 2. RMP Opportunity Gap/Surplus by parish for the 5 parish Northshore Region: 2009 estimates Source: Claritas, Inc. Retail Stores Livingston Parish St. Helena Parish St. Tammany Parish Tangipahoa Parish Washington Parish Total Retail Sales 878,990,810 97,422,635 (886,308,917) (263,552,054) 113,751,749 Motor Vehicle and Parts Dealers ,962,418 7,933,790 (48,966,622) (140,021,212) 9,339,039 Furniture and Home Furnishings Stores ,449,456 2,853,899 (20,429,925) 13,564,082 6,049,820 Electronics and Appliance Stores ,328,760 3,035,131 (61,409,253) 775,788 8,971,277 Building Material, Garden Equip. Stores ,006,062 10,957,388 (426,595,774) (15,795,296) 25,369,484 Food and Beverage Stores Other General Merchandise Stores ,672,421 24,869,410 (326,658,662) 72,950,664 19,219,193 Health and Personal Care Stores ,653,793 8,328,786 59,714,897 (23,389,157) (18,616,287) Gasoline Stations 447 (10,507,148) 11,027,822 (174,115,092) (252,417,411) (26,079,133) Clothing and Clothing Access. Stores ,952,137 (649,759) 11,158,490 42,625,484 16,438,367 Sport. Goods, Hobby, Book, Music Stores ,579,675 2,501,310 (11,161,493) (4,732,412) 7,072,891 Department Stores Excl. Leased Depts ,740,004 8,981,503 7,074, , ,514 Miscellaneous Store Retailers 453 (5,476,541) 2,622,761 (87,044,288) (16,799,957) 8,339,577 Non Store Retailers ,313,368 9,040, ,357,476 85,505,280 27,117,937 Foodservice and Drinking Places ,316,405 5,920,293 65,766,947 (26,733,874) 30,365,070
12 8 Twelve Northshore Retail Communities While the parish level data in Table 2 provides interesting insight into differences across the Northshore region, it is still at too broad of a scale to be useful for meaningful trade area determination and analysis. After all, consumers don t decide to go to a certain parish to shop for a new refrigerator, prom dress, or other item; they typically go to a certain town (or mall or shopping center within a town). For the purposes of estimating the trade areas on the Northshore using various techniques and methods, 12 retail communities were selected for analysis. Because many retail stores are located outside of city limits, polygons were drawn around target communities to an extent that the authors felt would capture most retail activity, and Claritas Site Reports Web site was utilized to generate RMP reports for these customized polygons. Where retail districts cross over the legal boundaries of adjoining towns, the retail communities may contain portions of two or more towns, since shoppers may freely move from town to town while shopping without concern for which legal jurisdiction they are in. The 12 selected retail communities, the parish in which they are located, and their estimated 2009 retail sales volume are listed below in Table 3. Figure 1 illustrates the location of each selected community, as well as the size and shape of the community polygons drawn for this analysis. Table 3. Twelve selected Northshore retail communities with estimated 2009 retail sales volume from Claritas RMP Opportunity Gap Report. Community Parish 2009 Estimated Retail Sales Albany Livingston 30,184,278 Amite Tangipahoa 164,071,452 Bogalusa Washington 223,777,297 Covington/Mandeville (incl. Madisonville) St. Tammany 1,960,740,714 Denham Springs Livingston 389,694,599 Franklinton Washington 127,395,546 Greensburg St. Helena 9,967,585 Hammond/Ponchatoula Tangipahoa 1,204,302,629 Kentwood Tangipahoa 43,074,373 Livingston Livingston 23,164,398 Slidell St. Tammany 1,974,478,517 Walker Livingston 109,957,600

13 9 There are certainly other communities on the Northshore with significant retail sectors that could have been included, but the authors felt that these 12 communities captured most of the largest retail centers on the Northshore and provided fairly uniform representation across the entire region. The estimated retail sales of the 12 communities in Table 3 totaled approximately 6.3 billion in 2009, or approximately 82 percent of the 7.7 billion of total retail sales on the Northshore (from Table 1). On a per parish basis, the combined sales of the communities in Table 3 represent a range of from 85.4 percent of total sales in St. Tammany Parish down to 25.6 percent in St. Helena, a predominantly rural parish without any large population centers and related concentrations of retail activity.
14 10 Competing Communities outside the Northshore Northshore consumers are, of course, not restricted to Northshore retailers when making their shopping destination decisions. In fact, the heaviest competition many Northshore businesses face comes from outside the region. In order to model this outside competition, 12 leading retail communities that surround the Northshore were selected, as shown in Table 4. Polygons were also drawn around these communities in an attempt to capture the bulk of their retail activity, with the sales volumes in Table 4 based on these polygons. Figure 2 illustrates the 12 selected Northshore retail communities and the 12 surrounding competing communities. Table 4. Twelve selected non Northshore retail communities with estimated 2009 retail sales volume from Claritas RMP Opportunity Gap Report. Community 2009 Estimated Retail Sales Baton Rouge 7,650,755,810 Clinton 28,882,524 Columbia, MS 255,578,046 GNO (New Orleans/Metairie/Kenner) 11,313,644,570 Gonzales/Prairieville 1,050,510,848 Gulfport, MS 2,096,216,120 Hattiesburg, MS 2,078,527,701 Liberty, MS 12,112,063 McComb, MS 477,677,307 Picayune, MS 396,666,574 Poplarville, MS 108,382,805 Tylertown, MS 61,518,218 Equal Competition Trade Areas The simplest method of analyzing trade areas assumes that there is no difference in the attributes of competing stores or retail communities (i.e., equal competition), so the only factor influencing consumers shopping destination decisions is distance. With the assumptions that all stores/communities are equal and that consumers would prefer to travel shorter distances, the resulting conclusion is that consumers always shop at the nearest store or community where the desired product is available. This results in assumed spatial monopolies where all of the customers within a certain geographic area always shop at the particular store or community that is closest to them.

15 11 Thiessen polygons are used to illustrate these geographic areas. Thiessen polygons are polygons whose boundaries define the area that is closest to each point relative to all other points. Figure 3 illustrates the equal competition/thiessen polygon trade areas for the Northshore and its surrounding communities. As mentioned earlier in this study, equal competition trade areas would rarely represent reality, except to some degree for gasoline and convenience grocery items, where distance often outweighs price or selection considerations. This is easily seen in the real world where gasoline stations, convenience stores, and country stores survive and thrive in locations where businesses catering to more elective or planned purchases would have little chance of success.
16 12 Market Penetration Models Other than in the previously mentioned cases of strict necessities such as gasoline and convenience grocery items, factors other than distance will usually influence consumers shopping destination decisions. These factors may include size of store(s), selection available in the store(s), ease of access, availability of parking, number of nearby shopping options, store or community amenities, price competitiveness, etc. Market penetration trade area models typically use community population, number of parking spaces, retail square footage, or volume of retail sales (which this study will use) as a proxy for these attractiveness factors. Reilly Gravitation Model The Reilly Gravitation Model is based on an analogy to Newton s theory of gravitational attraction the degree of attraction between two objects is based on the mass of the objects and the distance between
 of the communities under study, Figure 4 illustrates the 2009 estimated retail sales of each community using circles of varying sizes.")
17 13 them. Thus larger stores or communities have a stronger attraction or pull on consumers and can draw them from longer distances than smaller stores or communities. In order to help visualize the relative retail sales ( mass ) of the communities under study, Figure 4 illustrates the 2009 estimated retail sales of each community using circles of varying sizes. The 24 communities were grouped into 12 categories for ease of comparison. It is clear from Figure 4 that Baton Rouge and the Greater New Orleans area are the dominant retail markets affecting southeast Louisiana. Their influence is felt throughout the Northshore region, especially in the western and southeastern portions of the region. In the central and eastern areas of the region, the retail gravity battle is more between the Northshore s own retail markets, while in the northern parts of the region the Mississippi markets come more into play. To gain a better understanding of the retail battle lines between communities, the Reilly model was used to calculate trade area breakpoints based on travel distance between communities and volume of
18 14 total retail sales. Travel distances were based on the shortest/most logical route between communities from Google Maps. The equation used to calculate the breakpoints is: Reilly Breakpoint = Travel Distance between towns A and B 1 + Square root (Retail sales in Town A/Retail sales in Town B) Figure 5 illustrates the trade areas derived using the Reilly model. The beige colored areas outside of the polygons represent areas dominated by markets outside of the Northshore (Baton Rouge, GNO, McComb, Picayune, etc.), or toss up areas not clearly controlled by any single market.
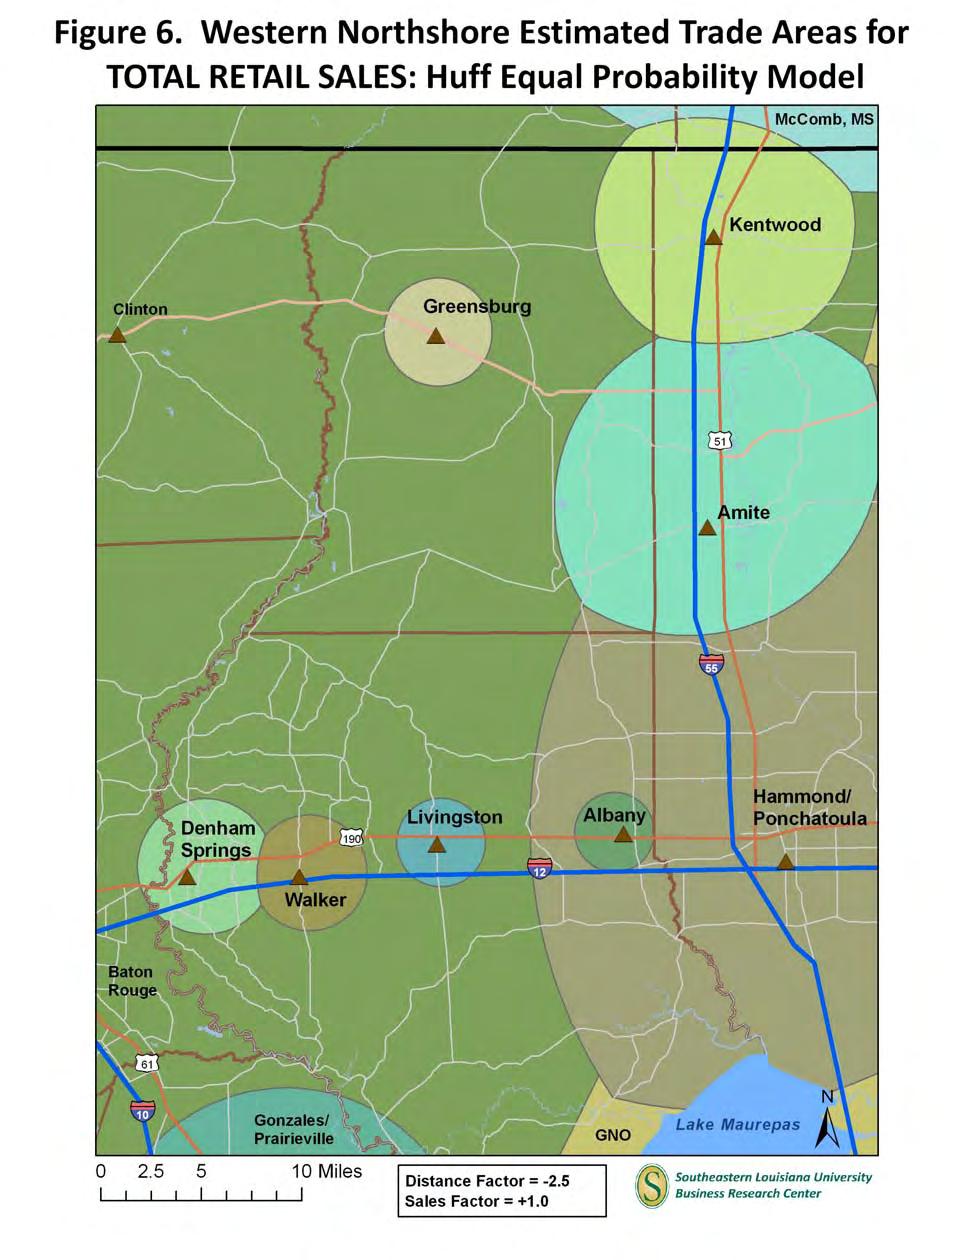
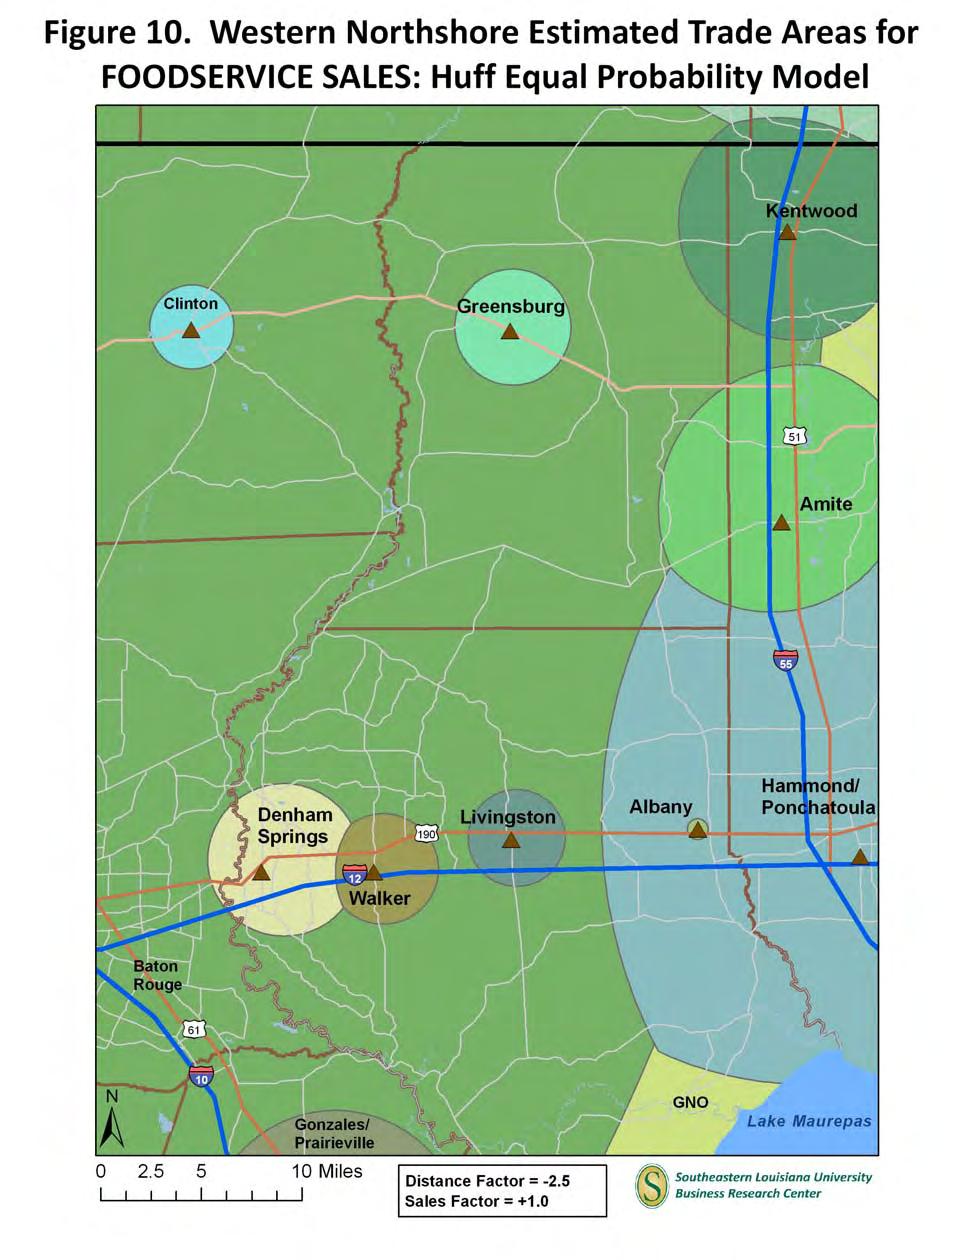
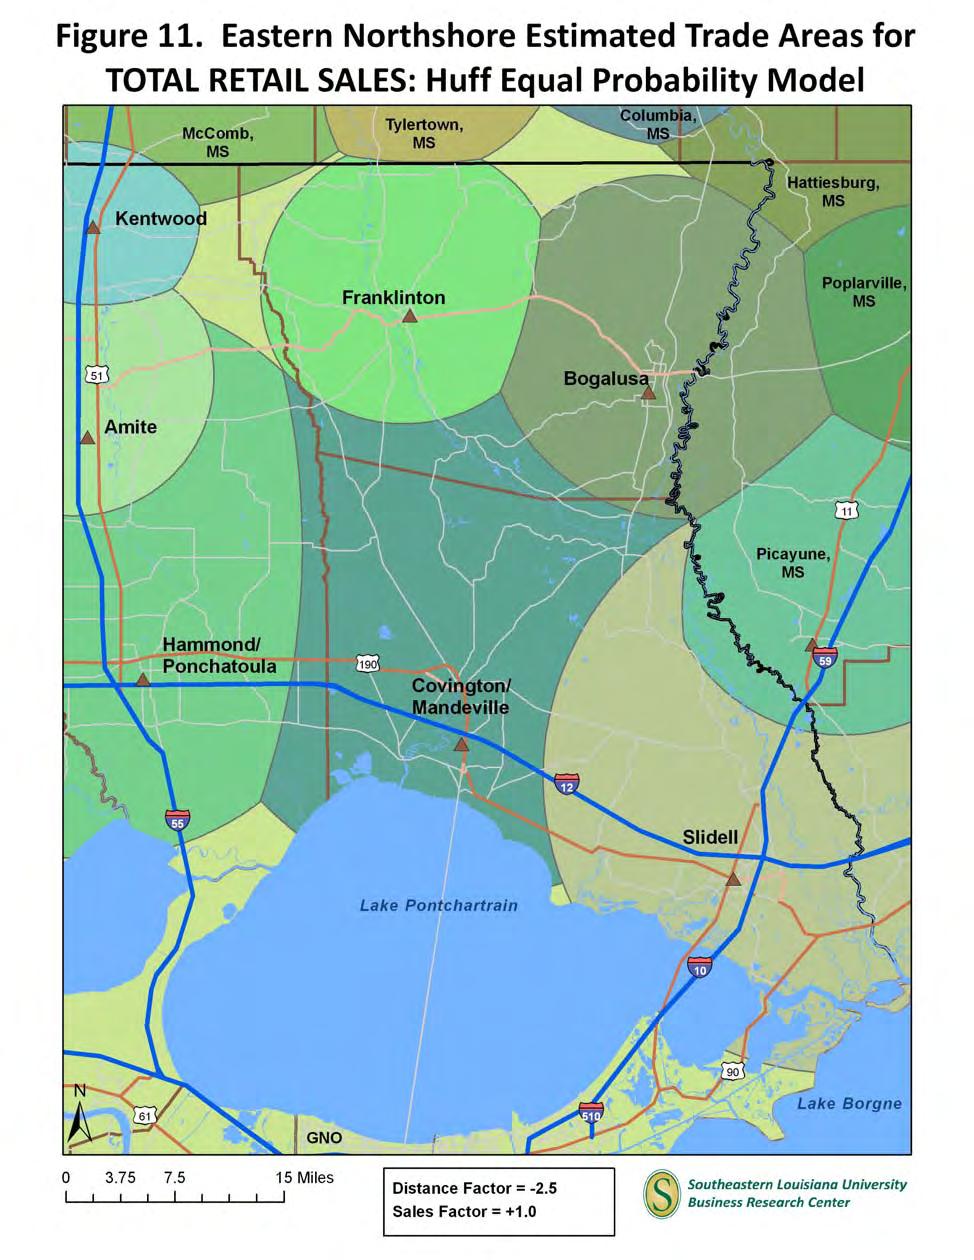
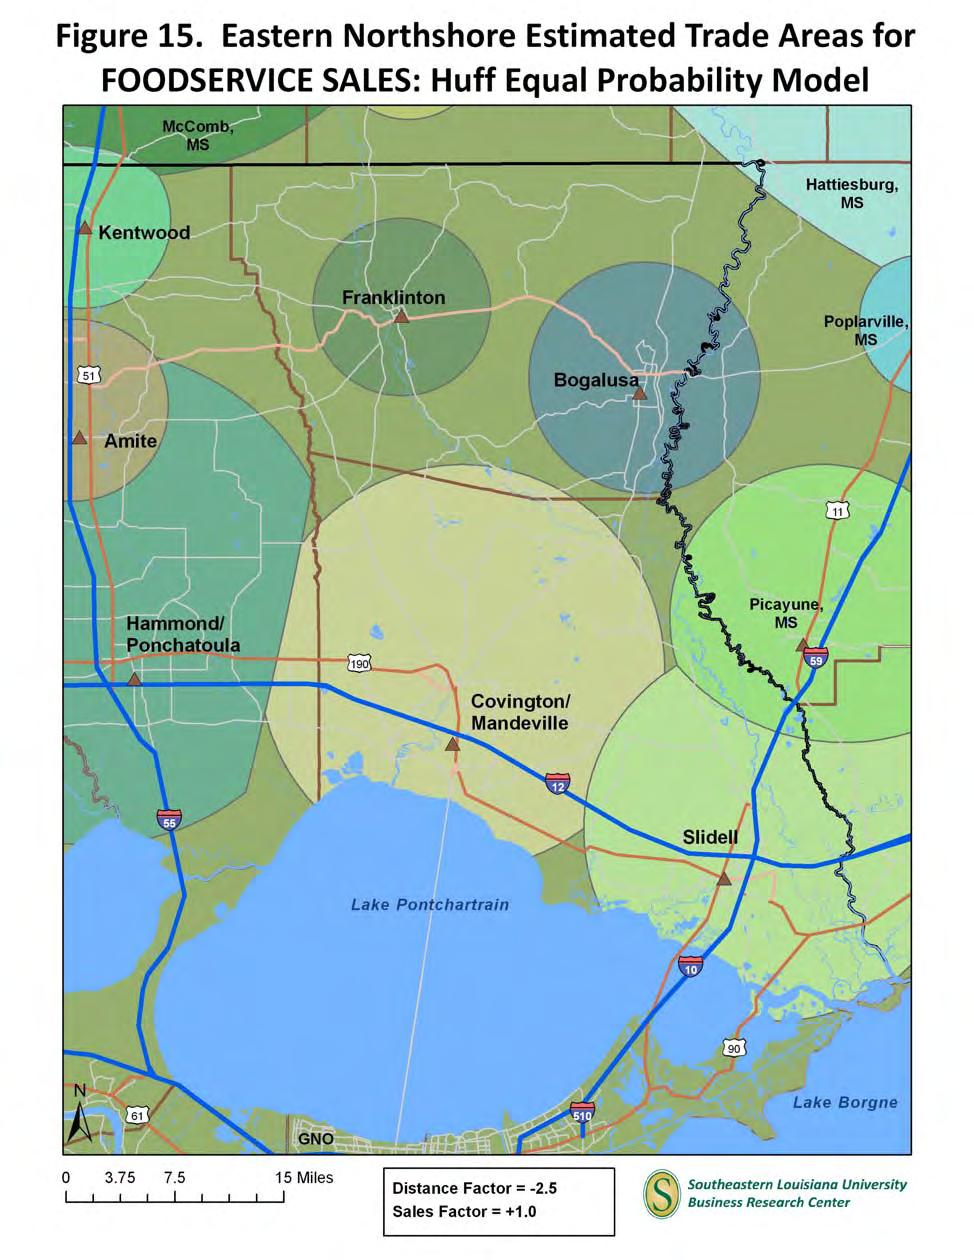
19 15 The Huff Model As described earlier in this document, David Huff refined and improved the Reilly Model to develop the model now named after him. The Huff Model generates probability surfaces illustrating the likelihood that a consumer at a given geographic point will shop at various competing stores/ communities. ESRI s Business Analyst software includes the capability of generating equal probability Huff models which illustrate the shape extending around a store or community with a border drawn where residents exhibit a 50 percent probability of shopping in that store or community and a 50 percent probability of shopping in a competing location. Thus, residents living within the border are more than 50 percent likely to shop in the town or store of interest. In that sense, the equal probability Huff Model is similar to the Reilly Model. However, the Huff Model allows for extra factors to be considered in addition to distance and the single attractiveness factor (sales, square footage, etc.). The Huff Model also allows the distance and attractiveness factors to be weighted in varying amounts, depending on the sector being analyzed. The equal probability Huff Model in ESRI Business Analyst was used to delineate trade areas for the retail communities selected for this study using retail sales estimates for five combinations of sectors from the Claritas RMP Opportunity Gap Reports for each community: Total Retail Sales (all sectors and sub sectors) Big Ticket Items o Automotive Dealers Sub sector 4411 o Other Motor Vehicle Dealers Sub sector 4412 o Furniture and Home Furnishings Stores Sector 442 o Electronics and Appliance Stores Sector 443 Mid Range Items o Building Material, Garden Equipment Stores Sector 444 o Clothing and Clothing Accessories Stores Sector 448 o Sporting Goods, Hobby, Book, Music Stores Sector 451 o Department Stores Excl. Leased Depts. Sub sector 4521 o Miscellaneous Store Retailers Sector 453 Convenience Items o Food and Beverage Stores Sector 445 o Other General Merchandise Stores Sub sector 4529 o Health and Personal Care Stores Sector 446 o Gasoline Stations Sector 447 Foodservice and Drinking Places Sector 722
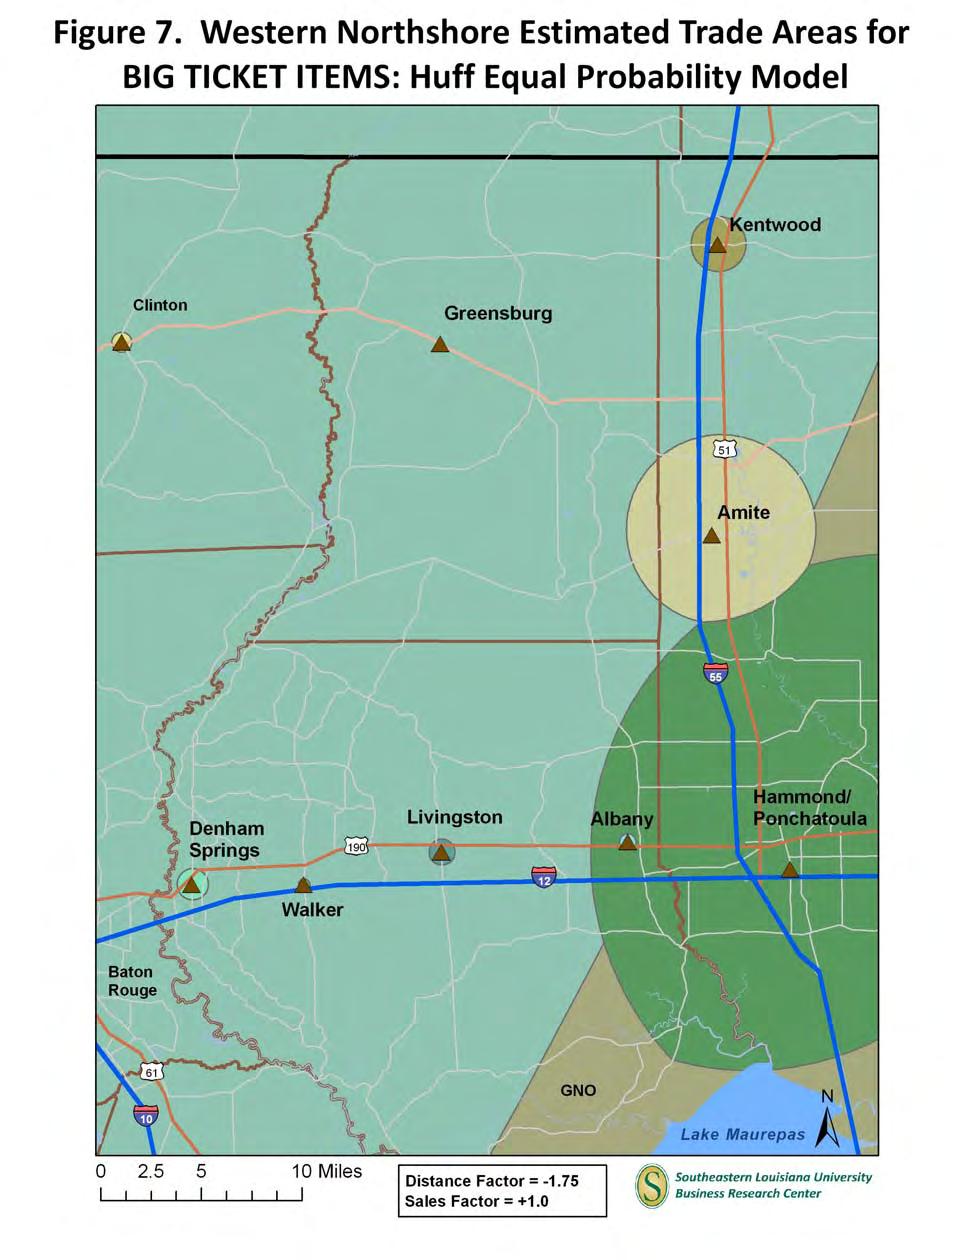
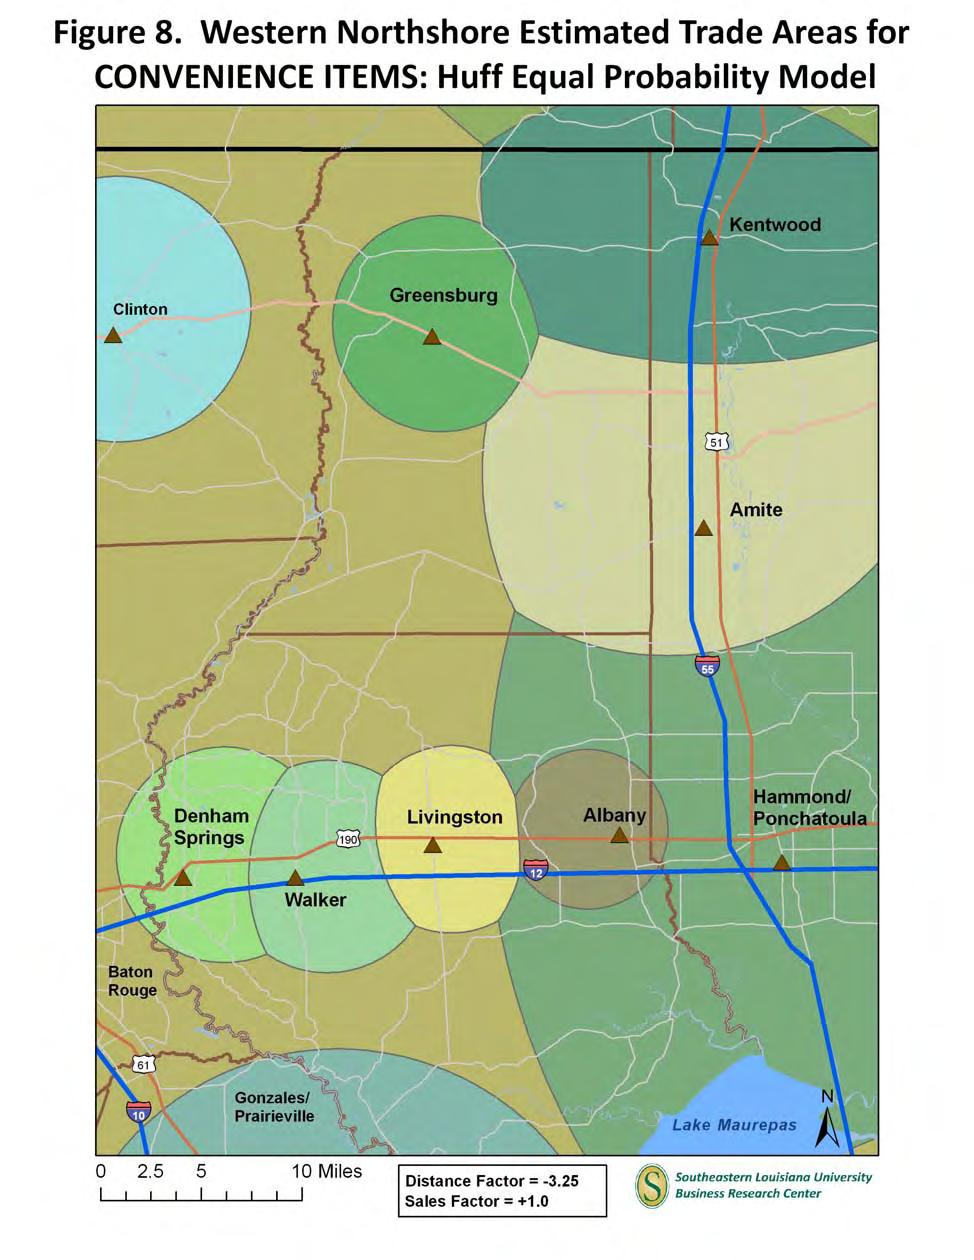
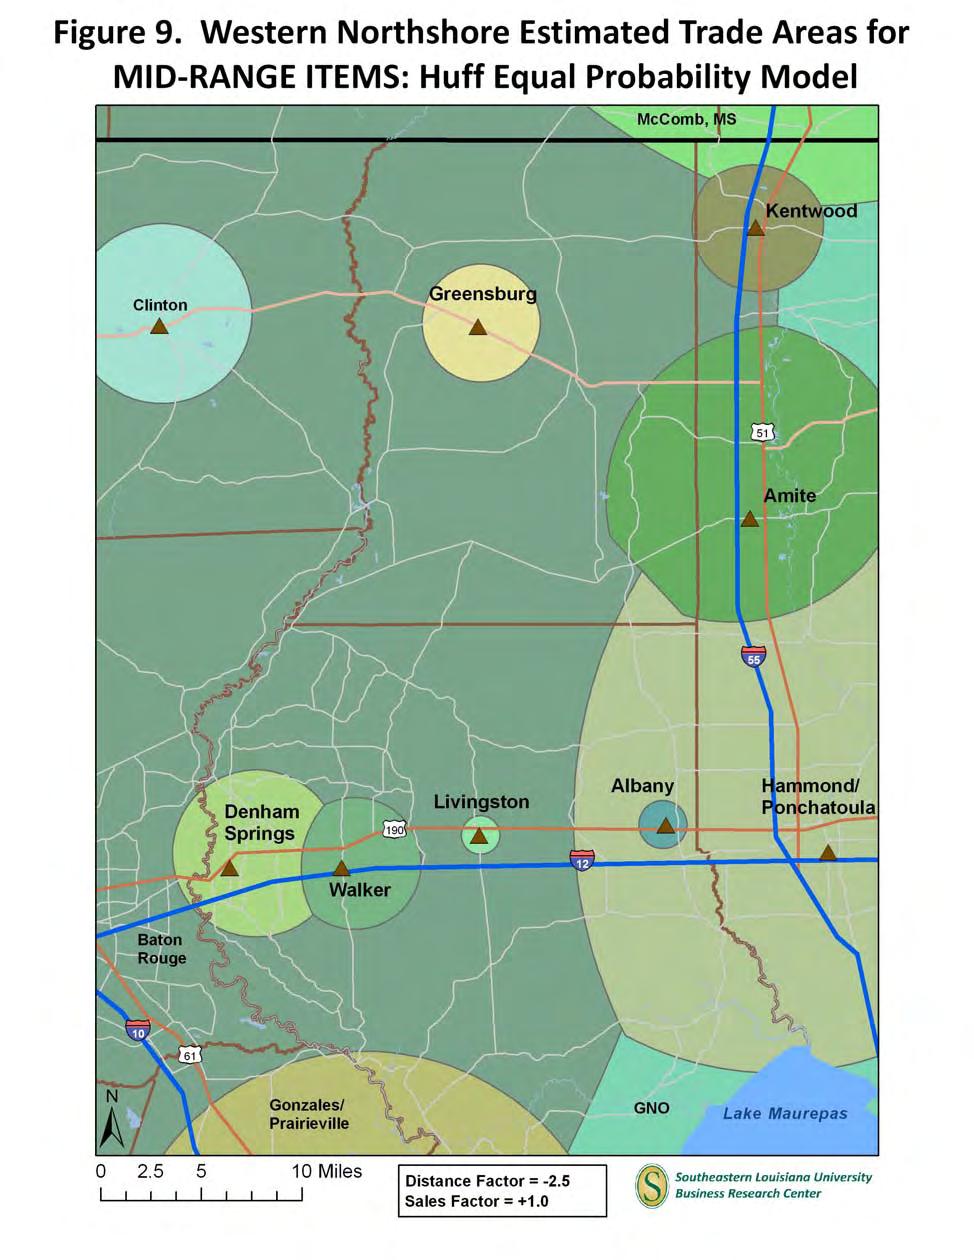
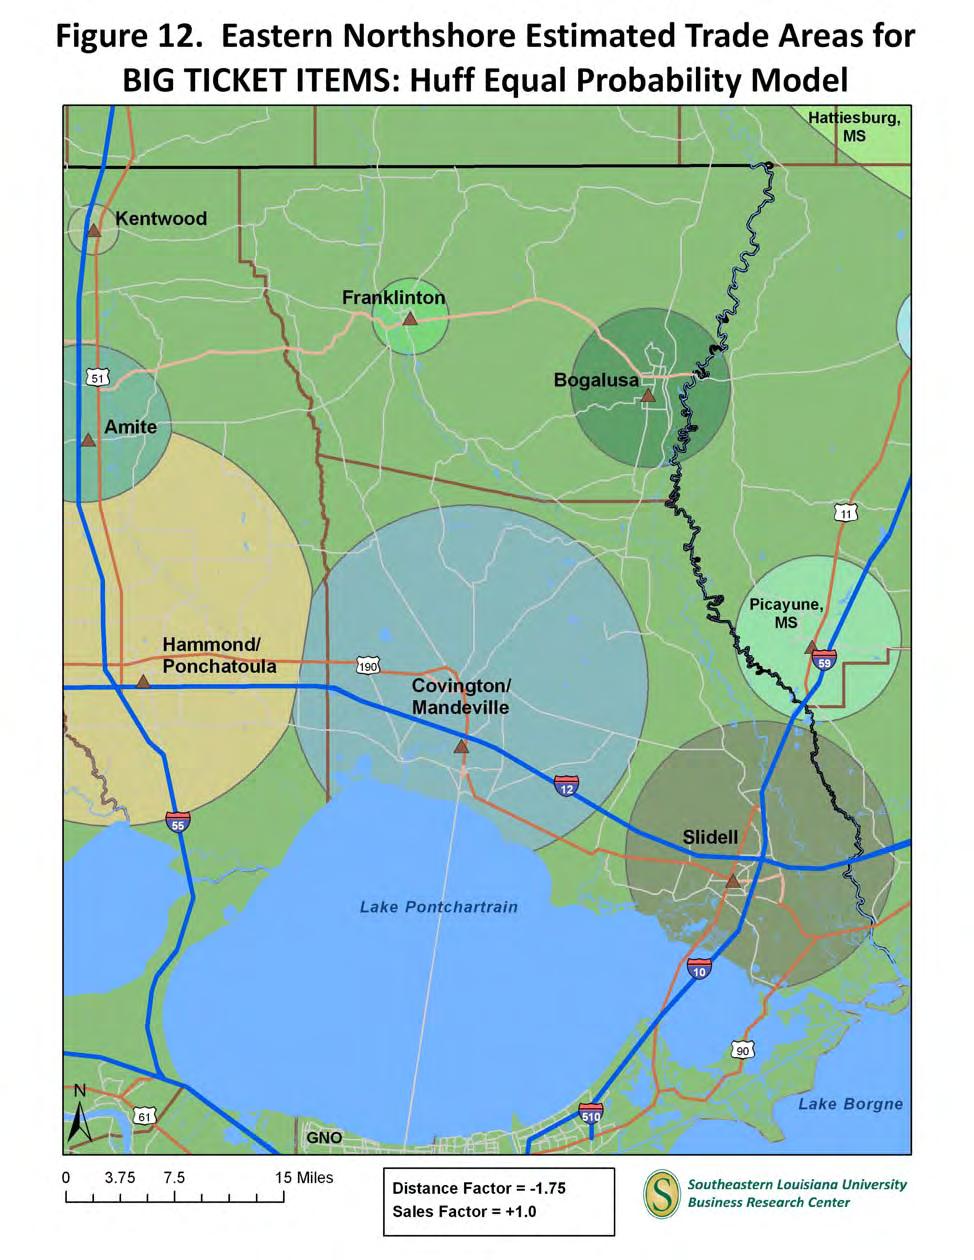
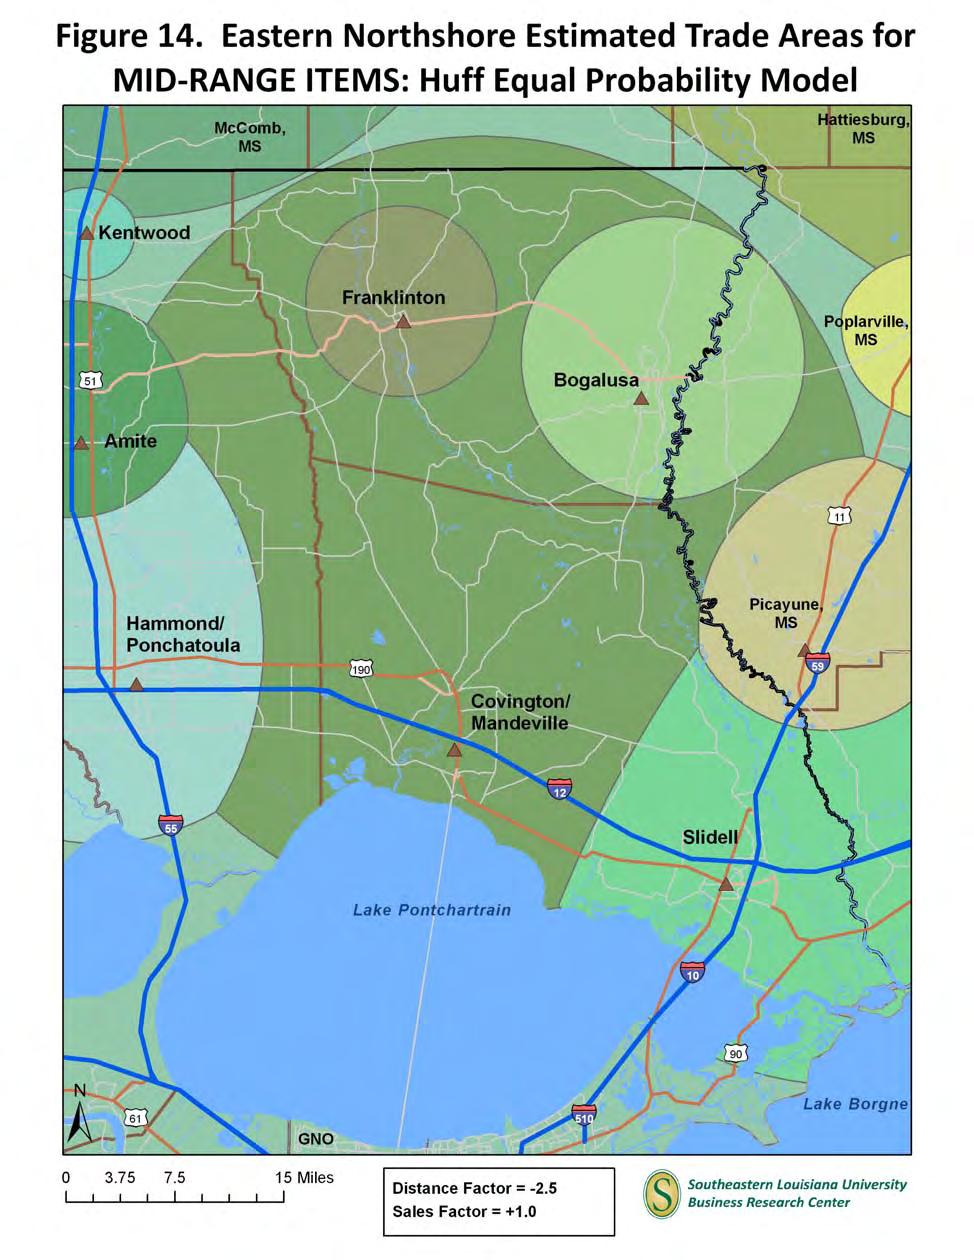
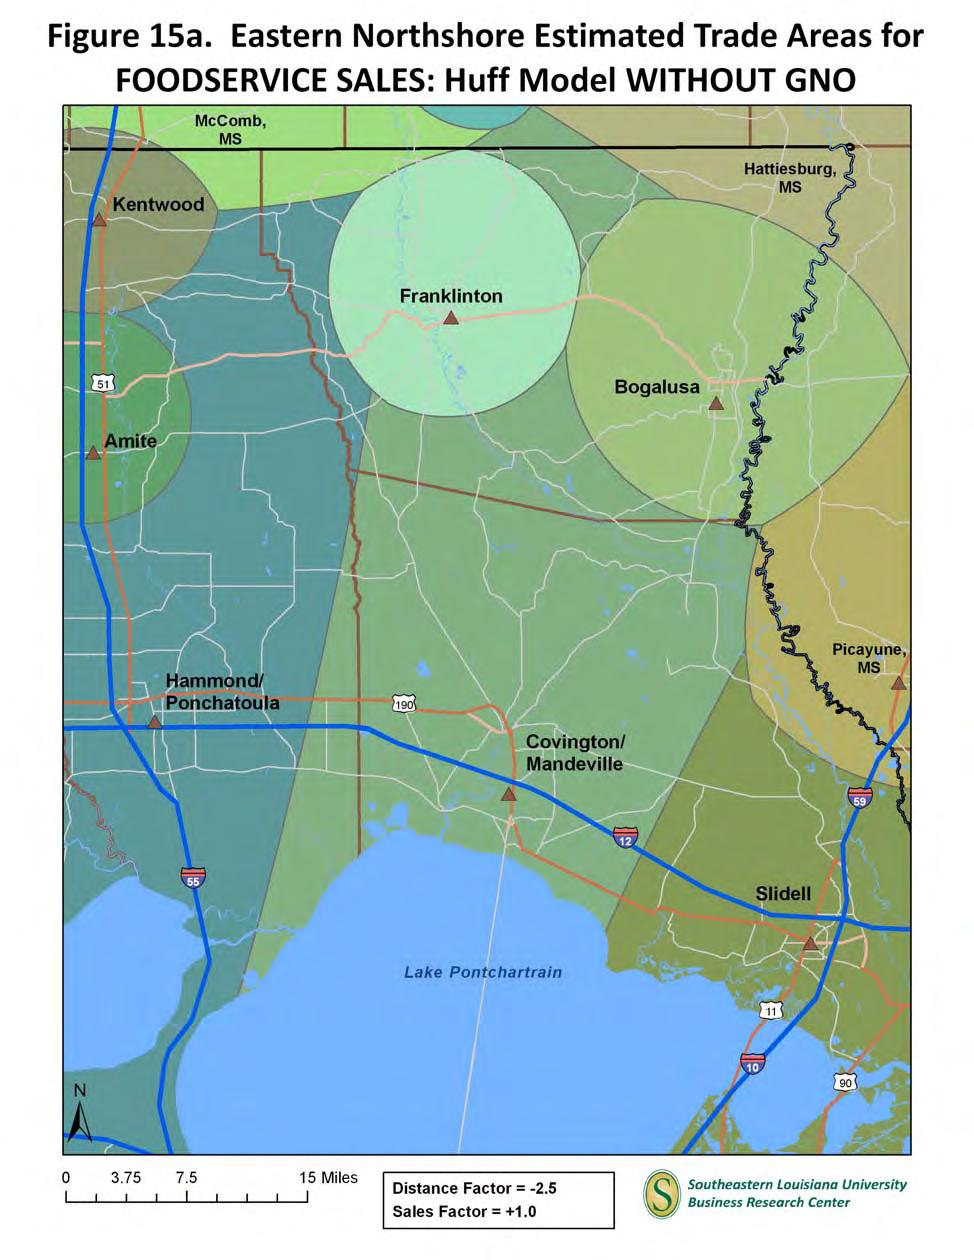
20 16 Claritas RMP Opportunity Gap Reports for the 12 Northshore subject communities are included as Appendices G R. Retail sales for each sector grouping were used as the attractiveness factor, and were always weighted at The distance factor weighting varied from 1.75 for big ticket items, to 2.5 for total retail sales, mid range items, and foodservice and drinking places, to 3.25 for convenience items. The varied weighting for the distance factor is based on the assumption that consumers are more willing to travel longer distances for big ticket items but very averse to traveling long distances for convenience items. Because the Huff Model involves some fairly intense computations that can overload computer processing power as the number of communities and distances involved increase, the Northshore was divided into western and eastern portions along Interstate 55, and the model was run separately for the five sector groupings for each of the two portions. Figures 6 10 illustrate the various sector based trade areas derived using the Huff Model for the western portion of the Northshore, and Figures do the same for the eastern portion. Comparing the trade area maps illustrates both the relative competitiveness of the communities in the various sector groupings as well as the impact of the varied distance factor weightings. For instance, comparing Figure 7 and Figure 9 reveals that Livingston is equivalent to Denham Springs (and outperforms Walker) when it comes to big ticket items, but is much less competitive for mid range items. Likewise, a comparison of Figures 12 and 14 shows that Hammond/Ponchatoula is much more competitive with Covington/Mandeville for big ticket items than mid range goods, where Covington/Mandeville tends to dominate the eastern part of the Northshore region. Comparison of either of the convenience item trade area maps (Figures 8 and 13) with the other sector maps illustrates how much more competitive the smaller communities can be for convenience items, especially compared to their very limited trade areas for big ticket items. Figure 15a illustrates the Foodservice and Drinking Places trade areas for the eastern Northshore with the impacts of the GNO market removed. For many Northshore residents, restaurants in GNO are not one of the normal options they consider in making their regular dining out decisions, so this map illustrates the competiveness of the various other communities without the influence of GNO.
21 17 NOTE: These trade area maps are based on the arbitrary weights chosen by the authors for the distance and sales factors. Changing these weights would drastically change the resulting estimated trade area maps. In order to develop accurate and realistic maps for a particular situation, the Huff Model factors must be calibrated for the actual opinions and biases of shoppers in the area. This involves surveying shoppers at their point of origin (their homes) rather than the destination of interest. This is the only way to determine how they actually weight distance and the attractiveness factors in arriving at their shopping destination decisions. Therefore, calibrating the Huff Model should be considered a necessary step in any real world application, and the trade areas developed for this report should only be viewed as approximations. Conclusions Trade area analysis is a useful tool both for existing businesses and in the site selection process for locating new ventures. It is the first step in determining where potential customers are located, so that demographic data can be gathered and analyzed, a vital step in choosing a site for new retail businesses and for making marketing and merchandising decisions for both new and existing businesses. Basic trade area analyses can be done fairly quickly and cheaply, but more advanced techniques, such as the calibrated Huff Model, will require point of origin surveys of consumers to delineate more accurate and realistic trade areas that are ultimately more useful to business owners and decision makers. Business owners should also always be cognizant of the fact that, while the distance factor and some attractiveness factors such as community population, transportation access, etc. are out of their control, other factors such as customer service, product selection, price competitiveness, and having a clean and welcoming store are very much in their control, and also get factored in every time prospective customers make their shopping destination decisions.
22 18
23 19
24 20
25 21
26 22
27 23
28 24

29 25
30 26
31 27
32 28
33 29 Bibliography Dramowicz, Ela. (2005). Retail Trade Area Analysis Using the Huff Model. Directions Magazine, July 2. Holloway, H., Jamal, A. & Joubert, W. (2008). Northshore Commerce Study: An Overview of Demographics, Employment, and Business Activity of the Northshore Region of Louisiana. Southeastern Louisiana University Business Research Center and College of Business. Associated Press. (2009). Target to get into food fight with Wal Mart. May 26.
34 30 Appendices
35 31 Appendix A RMP Opportunity Gap - Retail Stores (Sectors 445 and 452 modified) Northshore Region 2009 Demand 2009 Supply Opportunity Retail Stores (Consumer Expenditures) (Retail Sales) Gap/Surplus Total Retail Sales Incl Eating and Drinking Places 7,615,563,069 7,675,258,846 (59,695,777) Motor Vehicle and Parts Dealers-441 1,120,036,417 1,056,789,004 63,247,413 Automotive Dealers ,228, ,304,996 59,923,083 Other Motor Vehicle Dealers ,495,079 63,560,992 22,934,087 Automotive Parts/Accsrs, Tire Stores ,313, ,923,016 (19,609,757) Furniture and Home Furnishings Stores ,040, ,552,990 14,487,332 Furniture Stores ,755,554 70,981,984 15,773,570 Home Furnishing Stores ,284,768 76,571,006 (1,286,238) Electronics and Appliance Stores ,654, ,952,950 (15,298,297) Appliances, TVs, Electronics Stores ,495, ,642,968 (39,147,503) Household Appliances Stores ,141,218 52,265,997 (19,124,779) Radio, Television, Electronics Stores ,354, ,376,971 (20,022,724) Computer and Software Stores ,453,746 21,031,983 16,421,763 Camera and Photographic Equipment Stores ,705, ,999 7,427,443 Building Material, Garden Equip Stores ,343,889 1,150,402,025 (277,058,136) Building Material and Supply Dealers ,493,008 1,075,591,023 (269,098,015) Home Centers ,465, ,063,993 (235,598,377) Paint and Wallpaper Stores ,008,350 4,209,992 13,798,358 Hardware Stores ,378,139 38,479,002 30,899,137 Other Building Materials Dealers ,640, ,838,036 (78,197,133) Building Materials, Lumberyards ,033, ,633,969 (30,600,311) Lawn, Garden Equipment, Supplies Stores ,850,881 74,811,002 (7,960,121) Outdoor Power Equipment Stores ,025, ,999 9,222,036 Nursery and Garden Centers ,825,846 74,008,003 (17,182,157) Food and Beverage Stores Other Genl. Mrch. Stores ,551,081,966 1,645,028,940 (93,946,974) Grocery Stores ,362, ,731, ,630,815 Supermarkets, Grocery (Ex Conv) Stores ,417, ,363, ,054,043 Convenience Stores ,944,743 43,367,971 3,576,772 Specialty Food Stores ,163,688 15,204,977 11,958,711 Beer, Wine and Liquor Stores ,566,916 10,196,018 50,370,898 Other General Merchandise Stores ,988,638 1,012,896,036 (478,907,398) Health and Personal Care Stores ,289, ,597,001 46,692,032 Pharmancies and Drug Stores ,762, ,002,017 12,760,017 Cosmetics, Beauty Supplies, Perfume Stores ,235,807 6,300,000 9,935,807 Optical Goods Stores ,593,165 6,760,993 7,832,172 Other Health and Personal Care Stores ,698,027 12,533,991 16,164,036 Gasoline Stations ,096,015 1,337,186,977 Gasoline Stations With Conv Stores ,393,597 1,038,970,980 Other Gasoline Stations ,702, ,215,997 (452,090,962) (372,577,383) (79,513,579) Clothing and Clothing Accessories Stores ,853, ,328, ,524,719 Clothing Stores ,536, ,264, ,271,281 Men's Clothing Stores ,350,086 5,407,996 9,942,090 Women's Clothing Stores ,170,279 31,815,988 31,354,291 Childrens, Infants Clothing Stores ,229,515 4,614,001 10,615,514 Family Clothing Stores ,896,054 89,420,991 46,475,063 Clothing Accessories Stores ,984,532 1,441,980 4,542,552 Other Clothing Stores ,905,761 17,563,990 (658,229) Shoe Stores ,492,575 30,611,981 20,880,594 Jewelry, Luggage, Leather Goods Stores ,824,852 25,452,008 21,372,844 Jewelry Stores ,889,830 24,415,007 18,474,823 Luggage and Leather Goods Stores ,935,022 1,037,001 2,898,021
36 32 Appendix A continued RMP Opportunity Gap - Retail Stores (Sectors 445 and 452 modified) Northshore Region - p Demand 2009 Supply Opportunity Retail Stores (Consumer Expenditures) (Retail Sales) Gap/Surplus Sporting Goods, Hobby, Book, Music Stores ,556, ,296,992 26,259,971 Sportng Goods, Hobby, Musical Inst Stores ,268,811 80,718,982 25,549,829 Sporting Goods Stores ,623,611 22,538,013 33,085,598 Hobby, Toys and Games Stores ,471,086 44,825,993 (11,354,907) Sew/Needlework/Piece Goods Stores ,714,579 7,640,970 73,609 Musical Instrument and Supplies Stores ,459,535 5,714,006 3,745,529 Book, Periodical and Music Stores ,288,152 41,578, ,142 Book Stores and News Dealers ,508,285 29,291,007 (782,722) Book Stores ,867,515 29,291,007 (2,423,492) News Dealers and Newsstands ,640,770-1,640,770 Prerecorded Tapes, CDs, Record Stores ,779,867 12,287,003 1,492,864 Department Stores Excl Leased Depts ,053, ,176,994 72,876,370 Department Stores Excl Leased Depts ,053, ,176,994 72,876,370 Miscellaneous Store Retailers ,191, ,550,048 (98,358,448) Florists ,362,089 26,509,004 (12,146,915) Office Supplies, Stationery, Gift Stores ,778,200 91,150,984 (14,372,784) Office Supplies and Stationery Stores ,414,052 53,768,998 (10,354,946) Gift, Novelty and Souvenir Stores ,364,148 37,381,986 (4,017,838) Used Merchandise Stores ,614,922 12,584,021 4,030,901 Other Miscellaneous Store Retailers ,436, ,306,039 (75,869,650) Non-Store Retailers ,769, ,434, ,334,362 Foodservice and Drinking Places ,595, ,961, ,634,841 Full-Service Restaurants ,671, ,658,996 82,012,749 Limited-Service Eating Places ,256, ,802,001 18,454,960 Special Foodservices ,181,346 29,202,000 31,979,346 Drinking Places -Alcoholic Beverages ,485,790 14,298,004 17,187,786 GAFO * 1,959,925,794 2,210,355,881 (250,430,087) General Merchandise Stores-452 1,040,042,002 1,446,073,030 (406,031,028) Clothing and Clothing Accessories Stores ,853, ,328, ,524,719 Furniture and Home Furnishings Stores ,040, ,552,990 14,487,332 Electronics and Appliance Stores ,654, ,952,950 (15,298,297) Sporting Goods, Hobby, Book, Music Stores ,556, ,296,992 26,259,971 Office Supplies, Stationery, Gift Stores ,778,200 91,150,984 (14,372,784) * GAFO (General merchandise, Apparel, Furniture and Other) represents sales at stores that sell merchandise normally sold in department stores. This category is not included in Total Retail Sales Including Eating and Drinking Places. Claritas' RMP data is derived from two major sources of information. The demand data is derived from the Consumer Expenditure Survey (CE Survey), which is fielded by the U.S. Bureau of Labor Statistics (BLS). The supply data is derived from the Census of Retail Trade (CRT), which is made available by the U.S. Census. Additional data sources are incorporated to create both supply and demand estimates. The difference between demand and supply represents the opportunity gap or surplus available for each retail outlet in the specified reporting geography.when the demand is greater than (less than)the supply, there is an opportunity gap (surplus) for that retail outlet. For example, a positive value signifies an opportunity gap, while a negative value signifies a surplus CLARITAS INC. All rights reserved.
37 33 Appendix B RMP Opportunity Gap - Retail Stores (Sectors 445 and 452 modified) Livingston Parish 2009 Demand 2009 Supply Opportunity Retail Stores (Consumer Expenditures) (Retail Sales) Gap/Surplus Total Retail Sales Incl Eating and Drinking Places 1,726,214, ,223, ,990,810 Motor Vehicle and Parts Dealers ,891,437 22,929, ,962,418 Automotive Dealers ,080,892 10,897, ,183,892 Other Motor Vehicle Dealers ,611,767 1,025,007 18,586,760 Automotive Parts/Accsrs, Tire Stores ,198,778 11,007,012 13,191,766 Furniture and Home Furnishings Stores ,144,463 23,695,007 12,449,456 Furniture Stores ,282,550 13,028,000 6,254,550 Home Furnishing Stores ,861,913 10,667,007 6,194,906 Electronics and Appliance Stores ,316,758 7,987,998 33,328,760 Appliances, TVs, Electronics Stores ,971,136 6,156,999 24,814,137 Household Appliances Stores ,589,113 1,299,999 6,289,114 Radio, Television, Electronics Stores ,382,023 4,857,000 18,525,023 Computer and Software Stores ,551,240 1,830,999 6,720,241 Camera and Photographic Equipment Stores ,794,382-1,794,382 Building Material, Garden Equip Stores ,985,081 68,979, ,006,062 Building Material and Supply Dealers ,855,668 56,432, ,423,652 Home Centers ,017,436 5,245,001 69,772,435 Paint and Wallpaper Stores ,058,103 90,999 3,967,104 Hardware Stores ,907,721 1,004,008 14,903,713 Other Building Materials Dealers ,872,408 50,092,008 37,780,400 Building Materials, Lumberyards ,223,587 19,596,742 14,626,845 Lawn, Garden Equipment, Supplies Stores ,129,413 12,547,003 2,582,410 Outdoor Power Equipment Stores ,264,519-2,264,519 Nursery and Garden Centers ,864,894 12,547, ,891 Food and Beverage Stores Other Genl. Mrch. Stores ,889, ,216, ,672,421 Grocery Stores ,320,416 86,967, ,352,439 Supermarkets, Grocery (Ex Conv) Stores ,485,895 66,434, ,050,918 Convenience Stores ,834,521 20,533,000 (9,698,479) Specialty Food Stores ,117,364 3,225,998 2,891,366 Beer, Wine and Liquor Stores ,236, ,000 11,902,119 Other General Merchandise Stores ,215, ,689,010 (21,473,503) Health and Personal Care Stores ,253,786 77,599,993 20,653,793 Pharmancies and Drug Stores ,117,255 76,421,000 8,696,255 Cosmetics, Beauty Supplies, Perfume Stores ,553, ,996 3,216,531 Optical Goods Stores ,296,878 78,997 3,217,881 Other Health and Personal Care Stores ,286, ,000 5,523,126 Gasoline Stations ,538, ,046,002 Gasoline Stations With Conv Stores ,300, ,403,998 Other Gasoline Stations ,238,781 53,642,004 (10,507,148) (7,103,925) (3,403,223) Clothing and Clothing Accessories Stores ,762,124 4,809,987 74,952,137 Clothing Stores ,807,876 2,685,988 55,121,888 Men's Clothing Stores ,498,545-3,498,545 Women's Clothing Stores ,451,910 2,571,994 11,879,916 Childrens, Infants Clothing Stores ,529,034-3,529,034 Family Clothing Stores ,110,113-31,110,113 Clothing Accessories Stores ,359,813 28,999 1,330,814 Other Clothing Stores ,858,461 84,995 3,773,466 Shoe Stores ,882, ,998 10,925,952 Jewelry, Luggage, Leather Goods Stores ,071,298 1,167,001 8,904,297 Jewelry Stores ,164,763 1,167,001 7,997,762 Luggage and Leather Goods Stores , ,535
38 34 Appendix B continued RMP Opportunity Gap - Retail Stores (Sectors 445 and 452 modified) Livingston Parish - p Demand 2009 Supply Opportunity Retail Stores (Consumer Expenditures) (Retail Sales) Gap/Surplus Sporting Goods, Hobby, Book, Music Stores ,739,656 1,159,981 32,579,675 Sportng Goods, Hobby, Musical Inst Stores ,630, ,983 23,752,222 Sporting Goods Stores ,854, ,003 12,305,184 Hobby, Toys and Games Stores ,832, ,999 7,683,995 Sew/Needlework/Piece Goods Stores ,894,382 76,980 1,817,402 Musical Instrument and Supplies Stores ,048, ,001 1,945,641 Book, Periodical and Music Stores ,109, ,998 8,827,453 Book Stores and News Dealers ,076,603 87,000 5,989,603 Book Stores ,697,268 87,000 5,610,268 News Dealers and Newsstands , ,335 Prerecorded Tapes, CDs, Record Stores ,032, ,998 2,837,850 Department Stores Excl Leased Depts ,899,005 59,159,001 55,740,004 Department Stores Excl Leased Depts ,899,005 59,159,001 55,740,004 Miscellaneous Store Retailers ,746,440 47,222,981 (5,476,541) Florists ,249,822 2,993, ,819 Office Supplies, Stationery, Gift Stores ,632,612 3,675,995 13,956,617 Office Supplies and Stationery Stores ,974,911 2,281,999 7,692,912 Gift, Novelty and Souvenir Stores ,657,701 1,393,996 6,263,705 Used Merchandise Stores ,762,138 2,560,997 1,201,141 Other Miscellaneous Store Retailers ,101,868 37,992,986 (20,891,118) Non-Store Retailers ,706, , ,313,368 Foodservice and Drinking Places ,341,407 85,025,002 74,316,405 Full-Service Restaurants ,174,100 21,451,993 48,722,107 Limited-Service Eating Places ,445,854 60,010,002 9,435,852 Special Foodservices ,877,356 3,008,001 10,869,355 Drinking Places -Alcoholic Beverages ,844, ,006 5,289,091 GAFO * 444,710, ,176, ,533,146 General Merchandise Stores ,114, ,848,011 34,266,501 Clothing and Clothing Accessories Stores ,762,124 4,809,987 74,952,137 Furniture and Home Furnishings Stores ,144,463 23,695,007 12,449,456 Electronics and Appliance Stores ,316,758 7,987,998 33,328,760 Sporting Goods, Hobby, Book, Music Stores ,739,656 1,159,981 32,579,675 Office Supplies, Stationery, Gift Stores ,632,612 3,675,995 13,956,617 * GAFO (General merchandise, Apparel, Furniture and Other) represents sales at stores that sell merchandise normally sold in department stores. This category is not included in Total Retail Sales Including Eating and Drinking Places. Claritas' RMP data is derived from two major sources of information. The demand data is derived from the Consumer Expenditure Survey (CE Survey), which is fielded by the U.S. Bureau of Labor Statistics (BLS). The supply data is derived from the Census of Retail Trade (CRT), which is made available by the U.S. Census. Additional data sources are incorporated to create both supply and demand estimates. The difference between demand and supply represents the opportunity gap or surplus available for each retail outlet in the specified reporting geography. When the demand is greater than (less than) the supply, there is an opportunity gap (surplus) for that retail outlet. For example, a positive value signifies an opportunity gap, while a negative value signifies a surplus CLARITAS INC. All rights reserved.
39 35 Appendix C RMP Opportunity Gap - Retail Stores (Sectors 445 and 452 modified) St. Helena Parish 2009 Demand 2009 Supply Opportunity Retail Stores (Consumer Expenditures) (Retail Sales) Gap/Surplus Total Retail Sales Incl Eating and Drinking Places 136,421,600 38,998,965 97,422,635 Motor Vehicle and Parts Dealers ,285,785 10,351,995 7,933,790 Automotive Dealers ,922, ,996 14,263,836 Other Motor Vehicle Dealers ,426,865-1,426,865 Automotive Parts/Accsrs, Tire Stores ,936,088 9,692,999 (7,756,911) Furniture and Home Furnishings Stores-442 2,853,899-2,853,899 Furniture Stores ,506,820-1,506,820 Home Furnishing Stores ,347,079-1,347,079 Electronics and Appliance Stores-443 3,159, ,997 3,035,131 Appliances, TVs, Electronics Stores ,395,468 66,000 2,329,468 Household Appliances Stores ,574 66, ,574 Radio, Television, Electronics Stores ,781,894-1,781,894 Computer and Software Stores ,545 57, ,548 Camera and Photographic Equipment Stores , ,115 Building Material, Garden Equip Stores ,770,383 5,812,995 10,957,388 Building Material and Supply Dealers ,519,282 5,589,996 9,929,286 Home Centers ,292,076-6,292,076 Paint and Wallpaper Stores , , ,536 Hardware Stores ,309, , ,081 Other Building Materials Dealers ,585,592 4,563,999 3,021,593 Building Materials, Lumberyards ,989,395 1,785,502 1,203,893 Lawn, Garden Equipment, Supplies Stores ,251, ,999 1,028,102 Outdoor Power Equipment Stores , ,400 Nursery and Garden Centers ,065, , ,702 Food and Beverage Stores Other Genl Merch Stores ,157,413 3,288,003 24,869,410 Grocery Stores ,022,199 3,288,003 13,734,196 Supermarkets, Grocery (Ex Conv) Stores ,195,608 2,934,004 13,261,604 Convenience Stores , , ,592 Specialty Food Stores , ,385 Beer, Wine and Liquor Stores , ,270 Other General Merchandise Stores ,780,559-9,780,559 Health and Personal Care Stores-446 8,808, ,000 8,328,786 Pharmancies and Drug Stores ,646, ,000 7,166,338 Cosmetics, Beauty Supplies, Perfume Stores , ,521 Optical Goods Stores , ,191 Other Health and Personal Care Stores , ,736 Gasoline Stations ,991,824 5,964,002 11,027,822 Gasoline Stations With Conv Stores ,728,292 4,350,998 8,377,294 Other Gasoline Stations ,263,532 1,613,004 2,650,528 Clothing and Clothing Accessories Stores-448 6,198,230 6,847,989 (649,759) Clothing Stores ,474,623 4,442,990 31,633 Men's Clothing Stores , ,994 (482,696) Women's Clothing Stores ,122, , ,793 Childrens, Infants Clothing Stores , ,003 (302,200) Family Clothing Stores ,406, ,997 1,498,045 Clothing Accessories Stores , ,994 (694,116) Other Clothing Stores , ,001 (280,193) Shoe Stores , , ,045 Jewelry, Luggage, Leather Goods Stores ,564 1,580,001 (808,437) Jewelry Stores , ,001 (189,326) Luggage and Leather Goods Stores , ,000 (619,111)
40 36 Appendix C continued RMP Opportunity Gap - Retail Stores (Sectors 445 and 452 modified) St. Helena Parish - p Demand 2009 Supply Opportunity Retail Stores (Consumer Expenditures) (Retail Sales) Gap/Surplus Sporting Goods, Hobby, Book, Music Stores-451 2,501,310-2,501,310 Sportng Goods, Hobby, Musical Inst Stores ,845,429-1,845,429 Sporting Goods Stores , ,515 Hobby, Toys and Games Stores , ,725 Sew/Needlework/Piece Goods Stores , ,143 Musical Instrument and Supplies Stores , ,046 Book, Periodical and Music Stores , ,881 Book Stores and News Dealers , ,427 Book Stores , ,789 News Dealers and Newsstands ,638-27,638 Prerecorded Tapes, CDs, Record Stores , ,454 Department Stores Excl Leased Depts ,222, ,995 8,981,503 Department Stores Excl Leased Depts ,222, ,995 8,981,503 Miscellaneous Store Retailers-453 3,224, ,996 2,622,761 Florists , ,995 92,384 Office Supplies, Stationery, Gift Stores ,289,979-1,289,979 Office Supplies and Stationery Stores , ,155 Gift, Novelty and Souvenir Stores , ,824 Used Merchandise Stores , ,287 Other Miscellaneous Store Retailers ,388, , ,111 Non-Store Retailers-454 9,044,290 3,989 9,040,301 Foodservice and Drinking Places ,203,297 5,283,004 5,920,293 Full-Service Restaurants ,945,428 1,105,001 3,840,427 Limited-Service Eating Places ,847,622 2,478,003 2,369,619 Special Foodservices , ,661 Drinking Places -Alcoholic Beverages ,586 1,700,000 (1,263,414) GAFO * 35,005,603 7,212,981 27,792,622 General Merchandise Stores ,003, ,995 18,762,062 Clothing and Clothing Accessories Stores-448 6,198,230 6,847,989 (649,759) Furniture and Home Furnishings Stores-442 2,853,899-2,853,899 Electronics and Appliance Stores-443 3,159, ,997 3,035,131 Sporting Goods, Hobby, Book, Music Stores-451 2,501,310-2,501,310 Office Supplies, Stationery, Gift Stores ,289,979-1,289,979 * GAFO (General merchandise, Apparel, Furniture and Other) represents sales at stores that sell merchandise normally sold in department stores. This category is not included in Total Retail Sales Including Eating and Drinking Places. Claritas' RMP data is derived from two major sources of information. The demand data is derived from the Consumer Expenditure Survey (CE Survey), which is fielded by the U.S. Bureau of Labor Statistics (BLS). The supply data is derived from the Census of Retail Trade (CRT), which is made available by the U.S. Census. Additional data sources are incorporated to create both supply and demand estimates. The difference between demand and supply represents the opportunity gap or surplus available for each retail outlet in the specified reporting geography. When the demand is greater than (less than) the supply, there is an opportunity gap (surplus) for that retail outlet. For example, a positive value signifies an opportunity gap, while a negative value signifies a surplus CLARITAS INC. All rights reserved.
41 37 Appendix D RMP Opportunity Gap - Retail Stores (Sectors 445 and 452 modified) St. Tammany Parish 2009 Demand 2009 Supply Opportunity Retail Stores (Consumer Expenditures) (Retail Sales) Gap/Surplus Total Retail Sales Incl Eating and Drinking Places 3,722,745,028 4,609,053,945 (886,308,917) Motor Vehicle and Parts Dealers ,692, ,659,012 (48,966,622) Automotive Dealers ,969, ,998,004 (65,028,262) Other Motor Vehicle Dealers ,584,270 16,667,002 27,917,268 Automotive Parts/Accsrs, Tire Stores ,138,378 61,994,006 (11,855,628) Furniture and Home Furnishings Stores ,635, ,064,974 Furniture Stores ,028,147 45,993,986 Home Furnishing Stores ,606,902 58,070,988 (20,429,925) (965,839) (19,464,086) Electronics and Appliance Stores ,033, ,442,971 (61,409,253) Appliances, TVs, Electronics Stores ,142, ,399,970 (68,257,276) Household Appliances Stores ,324,373 43,318,997 (26,994,624) Radio, Television, Electronics Stores ,818,321 93,080,973 (41,262,652) Computer and Software Stores ,842,072 15,765,002 3,077,070 Camera and Photographic Equipment Stores ,048, ,999 3,770,953 Building Material, Garden Equip Stores ,624, ,220,019 (426,595,774) Building Material and Supply Dealers ,901, ,889,014 (429,987,342) Home Centers ,409, ,254,994 (299,845,593) Paint and Wallpaper Stores ,225,286 2,120,997 7,104,289 Hardware Stores ,386,856 17,899,000 16,487,856 Other Building Materials Dealers ,880, ,614,023 (153,733,894) Building Materials, Lumberyards ,071, ,209,328 (60,137,419) Lawn, Garden Equipment, Supplies Stores ,722,573 30,331,005 3,391,568 Outdoor Power Equipment Stores ,087,274-5,087,274 Nursery and Garden Centers ,635,299 30,331,005 (1,695,706) Food and Beverage Stores Other Genl Merch Stores ,385,317 1,070,043,979 (326,658,662) Grocery Stores ,603, ,377,971 42,225,074 Supermarkets, Grocery (Ex Conv) Stores ,580, ,482,982 37,097,908 Convenience Stores ,022,155 16,894,989 5,127,166 Specialty Food Stores ,866,790 8,032,973 4,833,817 Beer, Wine and Liquor Stores ,324,604 8,142,018 24,182,586 Other General Merchandise Stores ,590, ,491,017 (397,900,139) Health and Personal Care Stores ,921, ,207,008 59,714,897 Pharmancies and Drug Stores ,038, ,620,017 48,418,817 Cosmetics, Beauty Supplies, Perfume Stores ,751,778 4,478,002 3,273,776 Optical Goods Stores ,425,918 5,445,998 1,979,920 Other Health and Personal Care Stores ,705,375 7,662,991 6,042,384 Gasoline Stations ,966, ,081,975 (174,115,092) Gasoline Stations With Conv Stores ,408, ,829,977 (182,421,007) Other Gasoline Stations ,557,913 93,251,998 8,305,915 Clothing and Clothing Accessories Stores ,550, ,391,978 11,158,490 Clothing Stores ,030, ,474,988 2,555,108 Men's Clothing Stores ,722,706 4,323,001 3,399,705 Women's Clothing Stores ,404,828 24,981,998 6,422,830 Childrens, Infants Clothing Stores ,176,829 4,040,001 3,136,828 Family Clothing Stores ,335,864 71,673,994 (4,338,130) Clothing Accessories Stores ,010, ,996 2,397,142 Other Clothing Stores ,379,731 16,842,998 (8,463,267) Shoe Stores ,436,979 24,488,988 (52,009) Jewelry, Luggage, Leather Goods Stores ,083,393 16,428,002 8,655,391 Jewelry Stores ,126,753 16,428,002 6,698,751 Luggage and Leather Goods Stores ,956,640-1,956,640
42 38 Appendix D continued RMP Opportunity Gap - Retail Stores (Sectors 445 and 452 modified) St. Tammany Parish - p Demand 2009 Supply Opportunity Retail Stores (Consumer Expenditures) (Retail Sales) Gap/Surplus Sporting Goods, Hobby, Book, Music Stores ,986,501 86,147,994 (11,161,493) Sportng Goods, Hobby, Musical Inst Stores ,342,318 59,815,984 (6,473,666) Sporting Goods Stores ,449,600 14,491,002 13,958,598 Hobby, Toys and Games Stores ,332,278 37,897,993 (21,565,715) Sew/Needlework/Piece Goods Stores ,612,261 5,743,991 (2,131,730) Musical Instrument and Supplies Stores ,948,179 1,682,998 3,265,181 Book, Periodical and Music Stores ,644,183 26,332,010 (4,687,827) Book Stores and News Dealers ,571,807 18,361,007 (3,789,200) Book Stores ,772,287 18,361,007 (4,588,720) News Dealers and Newsstands , ,520 Prerecorded Tapes, CDs, Record Stores ,072,376 7,971,003 (898,627) Department Stores Excl Leased Depts ,710, ,635,995 7,074,382 Department Stores Excl Leased Depts ,710, ,635,995 7,074,382 Miscellaneous Store Retailers ,868, ,913,046 (87,044,288) Florists ,289,125 20,310,005 (13,020,880) Office Supplies, Stationery, Gift Stores ,310,755 70,359,997 (32,049,242) Office Supplies and Stationery Stores ,720,790 37,768,998 (16,048,208) Gift, Novelty and Souvenir Stores ,589,965 32,590,999 (16,001,034) Used Merchandise Stores ,358,345 7,455, ,324 Other Miscellaneous Store Retailers ,910,533 76,788,023 (42,877,490) Non-Store Retailers ,291, ,933, ,357,476 Foodservice and Drinking Places ,077, ,310,995 65,766,947 Full-Service Restaurants ,669, ,667,991 15,001,516 Limited-Service Eating Places ,325, ,888,004 18,437,077 Special Foodservices ,356,237 7,383,995 22,972,242 Drinking Places -Alcoholic Beverages ,727,117 8,371,005 9,356,112 GAFO * 968,817,746 1,473,534,926 (504,717,180) General Merchandise Stores ,301, ,127,012 (390,825,757) Clothing and Clothing Accessories Stores ,550, ,391,978 11,158,490 Furniture and Home Furnishings Stores ,635, ,064,974 (20,429,925) Electronics and Appliance Stores ,033, ,442,971 (61,409,253) Sporting Goods, Hobby, Book, Music Stores ,986,501 86,147,994 (11,161,493) Office Supplies, Stationery, Gift Stores ,310,755 70,359,997 (32,049,242) * GAFO (General merchandise, Apparel, Furniture and Other) represents sales at stores that sell merchandise normally sold in department stores. This category is not included in Total Retail Sales Including Eating and Drinking Places. Claritas' RMP data is derived from two major sources of information. The demand data is derived from the Consumer Expenditure Survey (CE Survey), which is fielded by the U.S. Bureau of Labor Statistics (BLS). The supply data is derived from the Census of Retail Trade (CRT), which is made available by the U.S. Census. Additional data sources are incorporated to create both supply and demand estimates. The difference between demand and supply represents the opportunity gap or surplus available for each retail outlet in the specified reporting geography. When the demand is greater than (less than) the supply, there is an opportunity gap (surplus) for that retail outlet. For example, a positive value signifies an opportunity gap, while a negative value signifies a surplus CLARITAS INC. All rights reserved.
43 39 Appendix E RMP Opportunity Gap - Retail Stores (Sectors 445 and 452 modified) Tangipahoa Parish 2009 Demand 2009 Supply Opportunity Retail Stores (Consumer Expenditures) (Retail Sales) Gap/Surplus Total Retail Sales Incl Eating and Drinking Places 1,470,356,915 1,733,908,969 (263,552,054) Motor Vehicle and Parts Dealers ,684, ,705,979 Automotive Dealers ,192, ,908,990 Other Motor Vehicle Dealers ,392,657 44,939,989 Automotive Parts/Accsrs, Tire Stores ,099,869 29,857,000 (140,021,212) (101,716,749) (29,547,332) (8,757,131) Furniture and Home Furnishings Stores ,570,091 15,006,009 13,564,082 Furniture Stores ,225,415 7,973,005 7,252,410 Home Furnishing Stores ,344,676 7,033,004 6,311,672 Electronics and Appliance Stores ,974,780 33,198, ,788 Appliances, TVs, Electronics Stores ,666,536 30,246,993 (4,580,457) Household Appliances Stores ,239,683 5,643, ,685 Radio, Television, Electronics Stores ,426,853 24,602,995 (5,176,142) Computer and Software Stores ,000,652 2,951,999 4,048,653 Camera and Photographic Equipment Stores ,307,592-1,307,592 Building Material, Garden Equip Stores ,373, ,168,986 (15,795,296) Building Material and Supply Dealers ,294, ,664,987 (12,369,998) Home Centers ,887,396 81,079,996 (20,192,600) Paint and Wallpaper Stores ,162,584 1,773,000 1,389,584 Hardware Stores ,813,885 14,628,993 (1,815,108) Other Building Materials Dealers ,431,124 64,182,998 8,248,126 Building Materials, Lumberyards ,367,362 25,109,337 3,258,025 Lawn, Garden Equipment, Supplies Stores ,078,701 15,503,999 (3,425,298) Outdoor Power Equipment Stores ,795,869-1,795,869 Nursery and Garden Centers ,282,832 15,503,999 (5,221,167) Food and Beverage Stores Other Genl Merch Stores ,555, ,604,972 72,950,664 Grocery Stores ,967,157 51,089, ,877,193 Supermarkets, Grocery (Ex Conv) Stores ,542,449 47,952, ,589,475 Convenience Stores ,424,708 3,136,990 6,287,718 Specialty Food Stores ,482,436 2,104,003 3,378,433 Beer, Wine and Liquor Stores ,218, ,999 9,717,498 Other General Merchandise Stores ,887, ,910,006 (76,022,460) Health and Personal Care Stores ,882, ,272,005 (23,389,157) Pharmancies and Drug Stores ,236, ,200,005 (28,963,480) Cosmetics, Beauty Supplies, Perfume Stores ,255,919 1,085,000 2,170,919 Optical Goods Stores ,636,121 1,131,999 1,504,122 Other Health and Personal Care Stores ,754,283 3,855,001 1,899,282 Gasoline Stations ,181, ,599,005 Gasoline Stations With Conv Stores ,974, ,922,013 Other Gasoline Stations ,206, ,676,992 (252,417,411) (166,947,366) (85,470,045) Clothing and Clothing Accessories Stores ,887,462 24,261,978 42,625,484 Clothing Stores ,386,031 16,920,975 31,465,056 Men's Clothing Stores ,866,405 5,999 2,860,406 Women's Clothing Stores ,072,616 71,992 12,000,624 Childrens, Infants Clothing Stores ,104,446 1,997 3,102,449 Family Clothing Stores ,981,278 16,839,000 9,142,278 Clothing Accessories Stores ,123, ,122,738 Other Clothing Stores ,237, ,236,561 Shoe Stores ,505,613 3,788,999 6,716,614 Jewelry, Luggage, Leather Goods Stores ,995,818 3,552,004 4,443,814 Jewelry Stores ,262,726 3,200,003 4,062,723 Luggage and Leather Goods Stores , , ,091
44 40 Appendix E continued RMP Opportunity Gap - Retail Stores (Sectors 445 and 452 modified) Tangipahoa Parish - p Demand 2009 Supply Opportunity Retail Stores (Consumer Expenditures) (Retail Sales) Gap/Surplus Sporting Goods, Hobby, Book, Music Stores ,937,603 32,670,015 (4,732,412) Sportng Goods, Hobby, Musical Inst Stores ,747,344 18,343,013 1,404,331 Sporting Goods Stores ,044,929 6,419,004 3,625,925 Hobby, Toys and Games Stores ,447,773 6,623,002 (175,229) Sew/Needlework/Piece Goods Stores ,562,672 1,508,000 54,672 Musical Instrument and Supplies Stores ,691,970 3,793,007 (2,101,037) Book, Periodical and Music Stores ,190,259 14,327,002 (6,136,743) Book Stores and News Dealers ,654,896 10,606,000 (4,951,104) Book Stores ,339,198 10,606,000 (5,266,802) News Dealers and Newsstands , ,698 Prerecorded Tapes, CDs, Record Stores ,535,363 3,721,002 (1,185,639) Department Stores Excl Leased Depts ,225,965 96,309, ,967 Department Stores Excl Leased Depts ,225,965 96,309, ,967 Miscellaneous Store Retailers ,250,067 51,050,024 (16,799,957) Florists ,569,687 2,199, ,685 Office Supplies, Stationery, Gift Stores ,238,482 15,573,997 (1,335,515) Office Supplies and Stationery Stores ,014,465 12,802,001 (4,787,536) Gift, Novelty and Souvenir Stores ,224,017 2,771,996 3,452,021 Used Merchandise Stores ,096,854 2,384, ,855 Other Miscellaneous Store Retailers ,345,044 30,892,026 (16,546,982) Non-Store Retailers ,779,285 9,274,005 85,505,280 Foodservice and Drinking Places ,053, ,787,001 (26,733,874) Full-Service Restaurants ,719,891 58,038, ,881 Limited-Service Eating Places ,680,790 79,763,992 (22,083,202) Special Foodservices ,550,941 18,810,004 (7,259,063) Drinking Places -Alcoholic Beverages ,101,505 3,174,995 1,926,510 GAFO * 373,721, ,930,995 (24,209,066) General Merchandise Stores ,113, ,220,004 (75,106,493) Clothing and Clothing Accessories Stores ,887,462 24,261,978 42,625,484 Furniture and Home Furnishings Stores ,570,091 15,006,009 13,564,082 Electronics and Appliance Stores ,974,780 33,198, ,788 Sporting Goods, Hobby, Book, Music Stores ,937,603 32,670,015 (4,732,412) Office Supplies, Stationery, Gift Stores ,238,482 15,573,997 (1,335,515) * GAFO (General merchandise, Apparel, Furniture and Other) represents sales at stores that sell merchandise normally sold in department stores. This category is not included in Total Retail Sales Including Eating and Drinking Places. Claritas' RMP data is derived from two major sources of information. The demand data is derived from the Consumer Expenditure Survey (CE Survey), which is fielded by the U.S. Bureau of Labor Statistics (BLS). The supply data is derived from the Census of Retail Trade (CRT), which is made available by the U.S. Census. Additional data sources are incorporated to create both supply and demand estimates. The difference between demand and supply represents the opportunity gap or surplus available for each retail outlet in the specified reporting geography. When the demand is greater than (less than) the supply, there is an opportunity gap (surplus) for that retail outlet. For example, a positive value signifies an opportunity gap, while a negative value 2010 CLARITAS INC. All rights reserved.
45 41 Appendix F RMP Opportunity Gap - Retail Stores (Sectors 445 and 452 modified) Washington Parish 2009 Demand 2009 Supply Opportunity Retail Stores (Consumer Expenditures) (Retail Sales) Gap/Surplus Total Retail Sales Incl Eating and Drinking Places 559,824, ,072, ,751,749 Motor Vehicle and Parts Dealers ,482,038 63,142,999 9,339,039 Automotive Dealers ,062,372 49,842,006 9,220,366 Other Motor Vehicle Dealers ,479, ,994 4,550,526 Automotive Parts/Accsrs, Tire Stores ,940,146 12,371,999 (4,431,853) Furniture and Home Furnishings Stores ,836,820 4,787,000 6,049,820 Furniture Stores ,712,622 3,986,993 1,725,629 Home Furnishing Stores ,124, ,007 4,324,191 Electronics and Appliance Stores ,170,269 3,198,992 8,971,277 Appliances, TVs, Electronics Stores ,319,631 2,773,006 6,546,625 Household Appliances Stores ,374,475 1,937, ,472 Radio, Television, Electronics Stores ,945, ,003 6,109,153 Computer and Software Stores ,416, ,986 1,990,251 Camera and Photographic Equipment Stores , ,401 Building Material, Garden Equip Stores ,590,490 38,221,006 25,369,484 Building Material and Supply Dealers ,921,397 22,015,010 36,906,387 Home Centers ,859,307 15,484,002 8,375,305 Paint and Wallpaper Stores ,229,845-1,229,845 Hardware Stores ,960,595 4,146, ,595 Other Building Materials Dealers ,871,650 2,385,008 26,486,642 Building Materials, Lumberyards ,381, ,060 10,448,345 Lawn, Garden Equipment, Supplies Stores ,669,093 16,205,996 (11,536,903) Outdoor Power Equipment Stores , ,999 (111,026) Nursery and Garden Centers ,977,120 15,402,997 (11,425,877) Food and Beverage Stores Other Genl Merch Stores ,094, ,875,001 19,219,193 Grocery Stores ,449,907 67,007,994 8,441,913 Supermarkets, Grocery (Ex Conv) Stores ,613,139 64,559,001 7,054,138 Convenience Stores ,836,768 2,448,993 1,387,775 Specialty Food Stores ,203,713 1,842, ,710 Beer, Wine and Liquor Stores ,926,426 1,219,001 3,707,425 Other General Merchandise Stores ,514,148 33,806,003 6,708,145 Health and Personal Care Stores ,421,708 55,037,995 (18,616,287) Pharmancies and Drug Stores ,723,082 54,280,995 (22,557,913) Cosmetics, Beauty Supplies, Perfume Stores ,348, , ,060 Optical Goods Stores , , ,058 Other Health and Personal Care Stores ,379, ,999 2,126,508 Gasoline Stations ,416,860 97,495,993 Gasoline Stations With Conv Stores ,981,615 78,463,994 Other Gasoline Stations ,435,245 19,031,999 (26,079,133) (24,482,379) (1,596,754) Clothing and Clothing Accessories Stores ,455,370 7,017,003 16,438,367 Clothing Stores ,837,601 3,740,005 13,097,596 Men's Clothing Stores , , ,130 Women's Clothing Stores ,118,131 3,360, ,128 Childrens, Infants Clothing Stores ,149,403-1,149,403 Family Clothing Stores ,062,757-9,062,757 Clothing Accessories Stores , ,974 Other Clothing Stores ,127,204 52,000 1,075,204 Shoe Stores ,714, ,998 3,162,992 Jewelry, Luggage, Leather Goods Stores ,902,779 2,725, ,779 Jewelry Stores ,629,913 2,725,000 (95,087) Luggage and Leather Goods Stores , ,866
46 42 Appendix F continued RMP Opportunity Gap - Retail Stores (Sectors 445 and 452 modified) Washington Parish - p Demand 2009 Supply Opportunity Retail Stores (Consumer Expenditures) (Retail Sales) Gap/Surplus Sporting Goods, Hobby, Book, Music Stores-451 9,391,893 2,319,002 7,072,891 Sportng Goods, Hobby, Musical Inst Stores ,703,515 1,682,002 5,021,513 Sporting Goods Stores ,329,380 1,079,004 2,250,376 Hobby, Toys and Games Stores ,263, ,999 2,107,317 Sew/Needlework/Piece Goods Stores , , ,122 Musical Instrument and Supplies Stores , , ,698 Book, Periodical and Music Stores ,688, ,000 2,051,378 Book Stores and News Dealers ,778, ,000 1,541,552 Book Stores ,659, ,000 1,422,973 News Dealers and Newsstands , ,579 Prerecorded Tapes, CDs, Record Stores , , ,826 Department Stores Excl Leased Depts ,995,519 35,831, ,514 Department Stores Excl Leased Depts ,995,519 35,831, ,514 Miscellaneous Store Retailers ,101,578 4,762,001 8,339,577 Florists , , ,077 Office Supplies, Stationery, Gift Stores ,306,372 1,540,995 3,765,377 Office Supplies and Stationery Stores ,978, ,000 2,062,731 Gift, Novelty and Souvenir Stores ,327, ,995 1,702,646 Used Merchandise Stores ,115, , ,294 Other Miscellaneous Store Retailers ,690,832 2,203,003 3,487,829 Non-Store Retailers ,947,934 8,829,997 27,117,937 Foodservice and Drinking Places ,920,069 21,554,999 30,365,070 Full-Service Restaurants ,162,819 9,396,001 13,766,818 Limited-Service Eating Places ,957,614 11,662,000 10,295,614 Special Foodservices ,423,151-4,423,151 Drinking Places -Alcoholic Beverages ,376, ,998 1,879,487 GAFO * 137,670,391 88,500,000 49,170,391 General Merchandise Stores ,509,667 69,637,008 6,872,659 Clothing and Clothing Accessories Stores ,455,370 7,017,003 16,438,367 Furniture and Home Furnishings Stores ,836,820 4,787,000 6,049,820 Electronics and Appliance Stores ,170,269 3,198,992 8,971,277 Sporting Goods, Hobby, Book, Music Stores-451 9,391,893 2,319,002 7,072,891 Office Supplies, Stationery, Gift Stores ,306,372 1,540,995 3,765,377 * GAFO (General merchandise, Apparel, Furniture and Other) represents sales at stores that sell merchandise normally sold in department stores. This category is not included in Total Retail Sales Including Eating and Drinking Places. Claritas' RMP data is derived fromtwo major sources of information. The demand data is derived fromthe Consumer Expenditure Survey (CE Survey), which is fielded by the U.S. Bureau of Labor Statistics (BLS). The supply data is derived fromthe Census of Retail Trade (CRT), which is made available by the U.S. Census. Additional data sources are incorporated to create both supply and demand estimates. The difference between demand and supply represents the opportunity gap or surplus available for each retail outlet in the specified reporting geography. When the demand is greater than (less than) the supply, there is an opportunity gap (surplus) for that retail outlet. For example, a positive value signifies an opportunity gap, while a negative value signifies a surplus CLARITAS INC. All rights reserved.
47 43 Appendix G RMP Opportunity Gap - Retail Stores (Sectors 445 and 452 modified) Village of Albany Polygon 2009 Demand 2009 Supply Opportunity Retail Stores (Consumer Expenditures) (Retail Sales) Gap/Surplus Total Retail Sales Incl Eating and Drinking Places 46,312,712 30,184,278 16,128,434 Motor Vehicle and Parts Dealers-441 6,635, ,322 6,130,411 Automotive Dealers ,467, ,942 5,225,941 Other Motor Vehicle Dealers , ,771 Automotive Parts/Accsrs, Tire Stores , , ,699 Furniture and Home Furnishings Stores ,272 1,084,475 (108,203) Furniture Stores , , ,817 Home Furnishing Stores , ,042 (323,019) Electronics and Appliance Stores-443 1,110, , ,735 Appliances, TVs, Electronics Stores , , ,118 Household Appliances Stores , ,115 Radio, Television, Electronics Stores , , ,003 Computer and Software Stores , ,740 78,933 Camera and Photographic Equipment Stores ,686-46,686 Building Material, Garden Equip Stores ,242,859 74,839 5,168,020 Building Material and Supply Dealers ,842,633 74,839 4,767,794 Home Centers ,990,161-1,990,161 Paint and Wallpaper Stores , ,879 Hardware Stores ,619 74, ,780 Other Building Materials Dealers ,321,973-2,321,973 Building Materials, Lumberyards , ,734 Lawn, Garden Equipment, Supplies Stores , ,225 Outdoor Power Equipment Stores ,771-59,771 Nursery and Garden Centers , ,454 Food and Beverage Stores Other Genl Merch Stores ,517,273 7,512,766 2,004,507 Grocery Stores ,728,885 1,777,149 3,951,736 Supermarkets, Grocery (Ex Conv) Stores ,435, ,880 4,785,364 Convenience Stores ,641 1,127,269 (833,628) Specialty Food Stores ,735 45, ,983 Beer, Wine and Liquor Stores , ,987 Other General Merchandise Stores ,292,666 5,689,865 (2,397,199) Health and Personal Care Stores-446 2,680,806 2,491, ,247 Pharmancies and Drug Stores ,323,825 2,491,559 (167,734) Cosmetics, Beauty Supplies, Perfume Stores ,234-97,234 Optical Goods Stores ,564-87,564 Other Health and Personal Care Stores , ,183 Gasoline Stations-447 5,540,830 16,211,668 Gasoline Stations With Conv Stores ,180,915 14,362,925 Other Gasoline Stations ,359,915 1,848,743 (10,670,838) (10,182,010) (488,828) Clothing and Clothing Accessories Stores-448 2,168,253 38,165 2,130,088 Clothing Stores ,567,503 38,165 1,529,338 Men's Clothing Stores ,729-95,729 Women's Clothing Stores ,047 38, ,882 Childrens, Infants Clothing Stores ,675-95,675 Family Clothing Stores , ,671 Clothing Accessories Stores ,844-36,844 Other Clothing Stores , ,538 Shoe Stores , ,764 Jewelry, Luggage, Leather Goods Stores , ,986 Jewelry Stores , ,735 Luggage and Leather Goods Stores ,251-24,251
48 44 Appendix G continued RMP Opportunity Gap - Retail Stores (Sectors 445 and 452 modified) Village of Albany Polygon - p Demand 2009 Supply Opportunity Retail Stores (Consumer Expenditures) (Retail Sales) Gap/Surplus Sporting Goods, Hobby, Book, Music Stores ,948 6, ,256 Sportng Goods, Hobby, Musical Inst Stores ,874 6, ,182 Sporting Goods Stores , ,505 Hobby, Toys and Games Stores ,099 4, ,417 Sew/Needlework/Piece Goods Stores ,541 1,328 49,213 Musical Instrument and Supplies Stores ,047-56,047 Book, Periodical and Music Stores , ,075 Book Stores and News Dealers , ,312 Book Stores , ,139 News Dealers and Newsstands ,173-10,173 Prerecorded Tapes, CDs, Record Stores ,763-82,763 Department Stores Excl Leased Depts ,111,618 18,053 3,093,565 Department Stores Excl Leased Depts ,111,618 18,053 3,093,565 Miscellaneous Store Retailers-453 1,125,120 1,865,533 (740,413) Florists , ,266 (24,565) Office Supplies, Stationery, Gift Stores ,251 43, ,447 Office Supplies and Stationery Stores , ,334 Gift, Novelty and Souvenir Stores ,917 43, ,113 Used Merchandise Stores ,438 19,333 82,105 Other Miscellaneous Store Retailers ,730 1,692,130 (1,225,400) Non-Store Retailers-454 3,010,986-3,010,986 Foodservice and Drinking Places-722 4,283, ,478 4,159,070 Full-Service Restaurants ,886, ,478 1,762,030 Limited-Service Eating Places ,866,691-1,866,691 Special Foodservices , ,043 Drinking Places -Alcoholic Beverages , ,307 GAFO * 12,039,474 7,131,783 4,907,691 General Merchandise Stores-452 6,404,284 5,707, ,367 Clothing and Clothing Accessories Stores-448 2,168,253 38,165 2,130,088 Furniture and Home Furnishings Stores ,272 1,084,475 (108,203) Electronics and Appliance Stores-443 1,110, , ,735 Sporting Goods, Hobby, Book, Music Stores ,948 6, ,256 Office Supplies, Stationery, Gift Stores ,251 43, ,447 * GAFO (General merchandise, Apparel, Furniture and Other) represents sales at stores that sell merchandise normally sold in department stores. This category is not included in Total Retail Sales Including Eating and Drinking Places. Claritas' RMP data is derived from two major sources of information. The demand data is derived from the Consumer Expenditure Survey (CE Survey), which is fielded by the U.S. Bureau of Labor Statistics (BLS). The supply data is derived fromthe Census of Retail Trade (CRT), which is made available by the U.S. Census. Additional data sources are incorporated to create both supply and demand estimates. The difference between demand and supply represents the opportunity gap or surplus available for each retail outlet in the specified reporting geography. When the demand is greater than (less than) the supply, there is an opportunity gap (surplus) for that retail outlet. For example, a positive value signifies an opportunity gap, while a negative value 2010 CLARITAS INC. All rights reserved.
49 45 Appendix H RMP Opportunity Gap - Retail Stores (Sectors 445 and 452 modified) City of Amite Polygon 2009 Demand 2009 Supply Opportunity Retail Stores (Consumer Expenditures) (Retail Sales) Gap/Surplus Total Retail Sales Incl Eating and Drinking Places 102,321, ,071,452 (61,749,628) Motor Vehicle and Parts Dealers ,067,998 44,074,132 Automotive Dealers ,539,314 29,329,422 Other Motor Vehicle Dealers ,086,818 10,081,043 Automotive Parts/Accsrs, Tire Stores ,441,865 4,663,667 (30,006,134) (17,790,108) (8,994,225) (3,221,802) Furniture and Home Furnishings Stores-442 2,004, ,649 1,112,872 Furniture Stores ,066, , ,639 Home Furnishing Stores , , ,234 Electronics and Appliance Stores-443 2,312,823 3,337,646 (1,024,823) Appliances, TVs, Electronics Stores ,758,301 2,813,963 (1,055,662) Household Appliances Stores ,270 2,183,117 (1,743,847) Radio, Television, Electronics Stores ,319, , ,186 Computer and Software Stores , ,683 (52,588) Camera and Photographic Equipment Stores ,427-83,427 Building Material, Garden Equip Stores ,568,650 10,591, ,539 Building Material and Supply Dealers ,713,673 10,361, ,268 Home Centers ,345,172-4,345,172 Paint and Wallpaper Stores , ,181 (333,448) Hardware Stores ,079 5,526,620 (4,624,541) Other Building Materials Dealers ,243,690 4,278, ,086 Building Materials, Lumberyards ,068,139 1,673, ,288 Lawn, Garden Equipment, Supplies Stores , , ,272 Outdoor Power Equipment Stores , ,416 Nursery and Garden Centers , , ,856 Food and Beverage Stores Other Genl Merch Stores ,971,955 26,198,469 (4,226,514) Grocery Stores ,463,196 7,843,109 5,620,087 Supermarkets, Grocery (Ex Conv) Stores ,814,238 7,495,254 5,318,984 Convenience Stores , , ,103 Specialty Food Stores , , ,579 Beer, Wine and Liquor Stores , ,071 Other General Merchandise Stores ,474,453 18,218,704 (10,744,251) Health and Personal Care Stores-446 6,679,608 13,898,509 (7,218,901) Pharmancies and Drug Stores ,806,999 13,275,004 (7,468,005) Cosmetics, Beauty Supplies, Perfume Stores , ,924 80,793 Optical Goods Stores , ,124 82,408 Other Health and Personal Care Stores , ,457 85,902 Gasoline Stations ,713,328 36,449,679 Gasoline Stations With Conv Stores ,562,100 25,733,351 Other Gasoline Stations ,151,228 10,716,329 (23,736,351) (16,171,251) (7,565,101) Clothing and Clothing Accessories Stores-448 4,732, ,816 4,033,297 Clothing Stores ,414, ,094 3,136,207 Men's Clothing Stores ,734 35, ,213 Women's Clothing Stores ,288 39, ,031 Childrens, Infants Clothing Stores ,729 27, ,675 Family Clothing Stores ,835,537 42,946 1,792,591 Clothing Accessories Stores ,178 37,926 39,252 Other Clothing Stores ,835 95, ,446 Shoe Stores ,122 39, ,101 Jewelry, Luggage, Leather Goods Stores , , ,988 Jewelry Stores , , ,892 Luggage and Leather Goods Stores ,021 54,924 (6,903)
50 46 Appendix H continued RMP Opportunity Gap - Retail Stores (Sectors 445 and 452 modified) City of Amite Polygon - p Demand 2009 Supply Opportunity Retail Stores (Consumer Expenditures) (Retail Sales) Gap/Surplus Sporting Goods, Hobby, Book, Music Stores-451 1,877,913 1,229, ,408 Sportng Goods, Hobby, Musical Inst Stores ,376, , ,023 Sporting Goods Stores , ,767 Hobby, Toys and Games Stores , , ,705 Sew/Needlework/Piece Goods Stores , ,999 (267,338) Musical Instrument and Supplies Stores , ,889 Book, Periodical and Music Stores , ,150 (56,615) Book Stores and News Dealers , ,868 Book Stores , ,195 News Dealers and Newsstands ,673-20,673 Prerecorded Tapes, CDs, Record Stores , ,150 (386,483) Department Stores Excl Leased Depts ,936,101 11,089,311 Department Stores Excl Leased Depts ,936,101 11,089,311 (4,153,210) (4,153,210) Miscellaneous Store Retailers-453 2,285,357 6,578,997 (4,293,640) Florists , ,974 (134,020) Office Supplies, Stationery, Gift Stores ,297 1,785,997 (848,700) Office Supplies and Stationery Stores ,480 1,730,000 (1,206,520) Gift, Novelty and Souvenir Stores ,816 55, ,819 Used Merchandise Stores , ,316 (310,158) Other Miscellaneous Store Retailers ,948 3,958,710 (3,000,762) Non-Store Retailers-454 6,678, ,216 6,556,738 Foodservice and Drinking Places-722 8,492,503 8,911,412 (418,909) Full-Service Restaurants ,743,341 5,444,242 (1,700,901) Limited-Service Eating Places ,685,028 1,631,709 2,053,319 Special Foodservices ,777 1,404,283 (664,506) Drinking Places -Alcoholic Beverages , ,177 (106,820) GAFO * 26,275,220 37,251,627 (10,976,407) General Merchandise Stores ,410,553 29,308,015 (14,897,462) Clothing and Clothing Accessories Stores-448 4,732, ,816 4,033,297 Furniture and Home Furnishings Stores-442 2,004, ,649 1,112,872 Electronics and Appliance Stores-443 2,312,823 3,337,646 (1,024,823) Sporting Goods, Hobby, Book, Music Stores-451 1,877,913 1,229, ,408 Office Supplies, Stationery, Gift Stores ,297 1,785,997 (848,700) * GAFO (General merchandise, Apparel, Furniture and Other) represents sales at stores that sell merchandise normally sold in department stores. This category is not included in Total Retail Sales Including Eating and Drinking Places. Claritas' RMP data is derived from two major sources of information. The demand data is derived from the Consumer Expenditure Survey (CE Survey), which is fielded by the U.S. Bureau of Labor Statistics (BLS). The supply data is derived from the Census of Retail Trade (CRT), which is made available by the U.S. Census. Additional data sources are incorporated to create both supply and demand estimates. The difference between demand and supply represents the opportunity gap or surplus available for each retail outlet in the specified reporting geography. When the demand is greater than (less than) the supply, there is an opportunity gap (surplus) for that retail outlet. For example, a positive value signifies an opportunity gap, while a negative value signifies a surplus CLARITAS INC. All rights reserved.
51 47 Appendix I RMP Opportunity Gap - Retail Stores (Sectors 445 and 452 modified) City of Bogalusa Polygon 2009 Demand 2009 Supply Opportunity Retail Stores (Consumer Expenditures) (Retail Sales) Gap/Surplus Total Retail Sales Incl Eating and Drinking Places 202,273, ,777,297 (21,503,801) Motor Vehicle and Parts Dealers ,472,676 41,301,555 (15,828,879) Automotive Dealers ,820,088 32,962,925 (12,142,837) Other Motor Vehicle Dealers ,818, ,243 1,598,821 Automotive Parts/Accsrs, Tire Stores ,834,524 8,119,387 (5,284,863) Furniture and Home Furnishings Stores-442 3,833,758 2,375,421 1,458,337 Furniture Stores ,020,659 2,146,843 (126,184) Home Furnishing Stores ,813, ,578 1,584,521 Electronics and Appliance Stores-443 4,364, ,461 3,464,749 Appliances, TVs, Electronics Stores ,351, ,360 2,657,801 Household Appliances Stores , , ,754 Radio, Television, Electronics Stores ,497, ,360 1,953,047 Computer and Software Stores , , ,300 Camera and Photographic Equipment Stores , ,648 Building Material, Garden Equip Stores ,518,689 17,889,702 4,628,987 Building Material and Supply Dealers ,889,186 17,137,904 3,751,282 Home Centers ,446,584 15,484,002 (7,037,418) Paint and Wallpaper Stores , ,314 Hardware Stores ,747, ,429 1,072,232 Other Building Materials Dealers ,262, ,473 9,284,154 Building Materials, Lumberyards ,053, ,795 3,671,031 Lawn, Garden Equipment, Supplies Stores ,629, , ,704 Outdoor Power Equipment Stores , ,692 40,068 Nursery and Garden Centers ,387, , ,636 Food and Beverage Stores Other Genl Merch Stores ,307,322 46,271,077 (963,755) Grocery Stores ,907,351 31,256,517 (3,349,166) Supermarkets, Grocery (Ex Conv) Stores ,499,196 29,366,967 (2,867,771) Convenience Stores ,408,155 1,889,550 (481,395) Specialty Food Stores , ,077 (120,842) Beer, Wine and Liquor Stores ,811, , ,723 Other General Merchandise Stores ,772,901 13,130,371 1,642,530 Health and Personal Care Stores ,816,227 24,773,451 (10,957,224) Pharmancies and Drug Stores ,054,552 24,146,613 (12,092,061) Cosmetics, Beauty Supplies, Perfume Stores , , ,574 Optical Goods Stores , , ,755 Other Health and Personal Care Stores , , ,507 Gasoline Stations ,821,757 37,745,649 (11,923,892) Gasoline Stations With Conv Stores ,544,782 32,292,469 (12,747,687) Other Gasoline Stations ,276,975 5,453, ,795 Clothing and Clothing Accessories Stores-448 8,305,545 3,264,298 5,041,247 Clothing Stores ,921,694 2,018,450 3,903,244 Men's Clothing Stores , , ,244 Women's Clothing Stores ,428,871 1,778,826 (349,955) Childrens, Infants Clothing Stores , ,754 Family Clothing Stores ,187,260-3,187,260 Clothing Accessories Stores , ,302 Other Clothing Stores ,462 42, ,639 Shoe Stores ,336, , ,914 Jewelry, Luggage, Leather Goods Stores ,047, , ,088 Jewelry Stores , ,563 98,567 Luggage and Leather Goods Stores ,522-97,522
52 48 Appendix I continued RMP Opportunity Gap - Retail Stores (Sectors 445 and 452 modified) City of Bogalusa Polygon - p Demand 2009 Supply Opportunity Retail Stores (Consumer Expenditures) (Retail Sales) Gap/Surplus Sporting Goods, Hobby, Book, Music Stores-451 3,331,716 1,258,715 2,073,001 Sportng Goods, Hobby, Musical Inst Stores ,363, ,019 1,550,145 Sporting Goods Stores ,161, , ,080 Hobby, Toys and Games Stores ,157 60, ,996 Sew/Needlework/Piece Goods Stores , ,526 Musical Instrument and Supplies Stores , ,000 85,542 Book, Periodical and Music Stores , , ,856 Book Stores and News Dealers , , ,161 Book Stores , , ,373 News Dealers and Newsstands ,788-42,788 Prerecorded Tapes, CDs, Record Stores , , ,695 Department Stores Excl Leased Depts ,965,442 27,540,319 (14,574,877) Department Stores Excl Leased Depts ,965,442 27,540,319 (14,574,877) Miscellaneous Store Retailers-453 4,598,088 1,654,656 2,943,432 Florists , ,916 (1,276) Office Supplies, Stationery, Gift Stores ,899, ,351 1,344,480 Office Supplies and Stationery Stores ,065, , ,626 Gift, Novelty and Souvenir Stores , , ,854 Used Merchandise Stores ,254 76, ,252 Other Miscellaneous Store Retailers ,954, ,387 1,278,977 Non-Store Retailers ,035,257 8,217,665 4,817,592 Foodservice and Drinking Places ,902,810 10,585,327 8,317,483 Full-Service Restaurants ,445,964 5,145,552 3,300,412 Limited-Service Eating Places ,965,583 4,998,000 2,967,583 Special Foodservices ,605,939-1,605,939 Drinking Places -Alcoholic Beverages , , ,549 GAFO * 49,473,403 49,023, ,467 General Merchandise Stores ,738,343 40,670,690 (12,932,347) Clothing and Clothing Accessories Stores-448 8,305,545 3,264,298 5,041,247 Furniture and Home Furnishings Stores-442 3,833,758 2,375,421 1,458,337 Electronics and Appliance Stores-443 4,364, ,461 3,464,749 Sporting Goods, Hobby, Book, Music Stores-451 3,331,716 1,258,715 2,073,001 Office Supplies, Stationery, Gift Stores ,899, ,351 1,344,480 * GAFO (General merchandise, Apparel, Furniture and Other) represents sales at stores that sell merchandise normally sold in department stores. This category is not included in Total Retail Sales Including Eating and Drinking Places. Claritas' RMP data is derived from two major sources of information. The demand data is derived from the Consumer Expenditure Survey (CE Survey), which is fielded by the U.S. Bureau of Labor Statistics (BLS). The supply data is derived fromthe Census of Retail Trade (CRT), which is made available by the U.S. Census. Additional data sources are incorporated to create both supply and demand estimates. The difference between demand and supply represents the opportunity gap or surplus available for each retail outlet in the specified reporting geography. When the demand is greater than (less than)the supply, there is an opportunity gap (surplus) for that retail outlet. For example, a positive value signifies an opportunity gap, while a negative value signifies a surplus CLARITAS INC. All rights reserved.
53 49 Appendix J RMP Opportunity Gap - Retail Stores (Sectors 445 and 452 modified) Covington/Mandeville Polygon 2009 Demand 2009 Supply Opportunity Retail Stores (Consumer Expenditures) (Retail Sales) Gap/Surplus Total Retail Sales Incl Eating and Drinking Places 1,559,620,958 1,960,740,714 (401,119,756) Motor Vehicle and Parts Dealers ,549, ,893,659 (7,343,739) Automotive Dealers ,570, ,545,724 (12,975,718) Other Motor Vehicle Dealers ,760,289 6,990,878 12,769,411 Automotive Parts/Accsrs, Tire Stores ,219,625 27,357,057 (7,137,432) Furniture and Home Furnishings Stores ,143,032 66,263,969 Furniture Stores ,174,750 35,992,284 Home Furnishing Stores ,968,281 30,271,684 (29,120,937) (15,817,534) (13,303,403) Electronics and Appliance Stores ,607,574 75,674,902 (36,067,328) Appliances, TVs, Electronics Stores ,531,832 65,639,287 (36,107,455) Household Appliances Stores ,945,139 30,555,660 (23,610,521) Radio, Television, Electronics Stores ,586,692 35,083,627 (12,496,935) Computer and Software Stores ,246,485 9,757,616 (1,511,131) Camera and Photographic Equipment Stores ,829, ,999 1,551,259 Building Material, Garden Equip Stores ,156, ,950,929 (250,794,786) Building Material and Supply Dealers ,683, ,967,689 (250,284,086) Home Centers ,712, ,537,251 (168,824,338) Paint and Wallpaper Stores ,995,751 1,383,259 2,612,492 Hardware Stores ,575,979 5,610,861 8,965,118 Other Building Materials Dealers ,398, ,436,318 (93,037,358) Building Materials, Lumberyards ,381,702 67,850,864 (36,469,162) Lawn, Garden Equipment, Supplies Stores ,472,540 14,983,241 (510,701) Outdoor Power Equipment Stores ,192,595-2,192,595 Nursery and Garden Centers ,279,945 14,983,241 (2,703,296) Food and Beverage Stores Other Genl Merch Stores ,270, ,801,249 (39,530,905) Grocery Stores ,516, ,027,084 (48,510,157) Supermarkets, Grocery (Ex Conv) Stores ,728, ,956,119 (52,227,926) Convenience Stores ,788,733 5,070,965 3,717,768 Specialty Food Stores ,186,441 5,491,388 (304,947) Beer, Wine and Liquor Stores ,566,976 4,282,776 9,284,200 Other General Merchandise Stores ,045, ,172,066 (6,126,712) Health and Personal Care Stores ,997,545 86,980,870 (983,325) Pharmancies and Drug Stores ,249,931 76,429,102 (2,179,171) Cosmetics, Beauty Supplies, Perfume Stores ,094,086 2,236, ,721 Optical Goods Stores ,177,963 3,441,373 (263,410) Other Health and Personal Care Stores ,475,564 4,874, ,534 Gasoline Stations ,107, ,325,318 17,782,127 Gasoline Stations With Conv Stores ,354, ,745,495 7,609,476 Other Gasoline Stations ,752,474 30,579,822 10,172,652 Clothing and Clothing Accessories Stores ,232, ,742,083 (27,509,804) Clothing Stores ,329,445 82,371,398 (28,041,953) Men's Clothing Stores ,378,826 2,494, ,786 Women's Clothing Stores ,623,198 14,271,786 (648,588) Childrens, Infants Clothing Stores ,117,691 1,398,463 1,719,228 Family Clothing Stores ,275,610 52,859,571 (23,583,961) Clothing Accessories Stores ,318, ,148 1,023,819 Other Clothing Stores ,615,152 11,052,390 (7,437,238) Shoe Stores ,335,619 12,409,958 (2,074,339) Jewelry, Luggage, Leather Goods Stores ,567,216 8,960,727 2,606,489 Jewelry Stores ,725,744 8,960,727 1,765,017 Luggage and Leather Goods Stores , ,472
54 50 Appendix J continued RMP Opportunity Gap - Retail Stores (Sectors 445 and 452 modified) Covington/Mandeville Polygon - p Demand 2009 Supply Opportunity Retail Stores (Consumer Expenditures) (Retail Sales) Gap/Surplus Sporting Goods, Hobby, Book, Music Stores ,599,523 40,859,124 (7,259,601) Sportng Goods, Hobby, Musical Inst Stores ,798,896 23,722,491 76,405 Sporting Goods Stores ,959,467 3,522,139 9,437,328 Hobby, Toys and Games Stores ,065,710 15,635,166 (8,569,456) Sew/Needlework/Piece Goods Stores ,554,859 3,649,902 (2,095,043) Musical Instrument and Supplies Stores ,218, ,284 1,303,576 Book, Periodical and Music Stores ,800,626 17,136,634 (7,336,008) Book Stores and News Dealers ,662,849 14,078,611 (7,415,762) Book Stores ,324,677 14,078,611 (7,753,934) News Dealers and Newsstands , ,172 Prerecorded Tapes, CDs, Record Stores ,137,777 3,058,022 79,755 General Merchandise Stores ,259, ,708,958 Department Stores Excl Leased Depts ,214, ,536,892 (19,449,596) (13,322,885) Miscellaneous Store Retailers ,161,257 82,784,245 (45,622,988) Florists ,145,496 8,012,205 (4,866,709) Office Supplies, Stationery, Gift Stores ,526,802 38,674,873 (22,148,071) Office Supplies and Stationery Stores ,384,966 20,462,849 (11,077,883) Gift, Novelty and Souvenir Stores ,141,836 18,212,023 (11,070,187) Used Merchandise Stores ,667,877 3,412, ,288 Other Miscellaneous Store Retailers ,821,082 32,684,578 (18,863,496) Non-Store Retailers ,996,335 70,325,606 32,670,729 Foodservice and Drinking Places ,540, ,429,802 12,110,398 Full-Service Restaurants ,132,345 73,715,562 (4,583,217) Limited-Service Eating Places ,713,903 61,213,261 2,500,642 Special Foodservices ,882,117 2,596,545 10,285,572 Drinking Places -Alcoholic Beverages ,811,835 3,904,434 3,907,401 GAFO * 416,368, ,923,908 General Merchandise Stores ,259, ,708,958 Clothing and Clothing Accessories Stores ,232, ,742,083 Furniture and Home Furnishings Stores ,143,032 66,263,969 Electronics and Appliance Stores ,607,574 75,674,902 Sporting Goods, Hobby, Book, Music Stores ,599,523 40,859,124 Office Supplies, Stationery, Gift Stores ,526,802 38,674,873 (141,555,336) (19,449,596) (27,509,804) (29,120,937) (36,067,328) (7,259,601) (22,148,071) * GAFO (General merchandise, Apparel, Furniture and Other) represents sales at stores that sell merchandise normally sold in department stores. This category is not included in Total Retail Sales Including Eating and Drinking Places. Claritas' RMP data is derived from two major sources of information. The demand data is derived from the Consumer Expenditure Survey (CE Survey), which is fielded by the U.S. Bureau of Labor Statistics (BLS). The supply data is derived from the Census of Retail Trade (CRT), which is made available by the U.S. Census. Additional data sources are incorporated to create both supply and demand estimates. The difference between demand and supply represents the opportunity gap or surplus available for each retail outlet in the specified reporting geography. When the demand is greater than (less than)the supply, there is an opportunity gap (surplus) for that retail outlet. For example, a positive value signifies an opportunity gap, while a negative value signifies a surplus CLARITAS INC. All rights reserved.
55 51 Appendix K RMP Opportunity Gap - Retail Stores (Sectors 445 and 452 modified) City of Denham Springs Polygon 2009 Demand 2009 Supply Opportunity Retail Stores (Consumer Expenditures) (Retail Sales) Gap/Surplus Total Retail Sales Incl Eating and Drinking Places 536,817, ,694, ,123,227 Motor Vehicle and Parts Dealers ,330,085 13,799,816 68,530,269 Automotive Dealers ,715,583 7,917,316 60,798,267 Other Motor Vehicle Dealers ,077, ,305 5,428,409 Automotive Parts/Accsrs, Tire Stores ,536,788 5,233,195 2,303,593 Furniture and Home Furnishings Stores ,243,346 9,239,145 2,004,201 Furniture Stores ,003,712 3,033,918 2,969,794 Home Furnishing Stores ,239,634 6,205,227 (965,593) Electronics and Appliance Stores ,914,668 4,352,137 8,562,531 Appliances, TVs, Electronics Stores ,657,641 3,907,965 5,749,676 Household Appliances Stores ,342,664 1,197,080 1,145,584 Radio, Television, Electronics Stores ,314,978 2,710,885 4,604,093 Computer and Software Stores ,687, ,173 2,243,791 Camera and Photographic Equipment Stores , ,062 Building Material, Garden Equip Stores ,774,806 52,446,285 8,328,521 Building Material and Supply Dealers ,124,503 41,010,744 15,113,759 Home Centers ,056,448 5,212,425 17,844,023 Paint and Wallpaper Stores ,254,411 65,519 1,188,892 Hardware Stores ,888, ,929 4,491,868 Other Building Materials Dealers ,924,847 35,335,871 (8,411,024) Building Materials, Lumberyards ,480,189 13,823,925 (3,343,736) Lawn, Garden Equipment, Supplies Stores ,650,304 11,435,541 (6,785,237) Outdoor Power Equipment Stores , ,930 Nursery and Garden Centers ,951,374 11,435,541 (7,484,167) Food and Beverage Stores Other Genl Merch Stores ,785,969 75,051,124 32,734,845 Grocery Stores ,594,824 22,827,180 41,767,644 Supermarkets, Grocery (Ex Conv) Stores ,260,228 11,542,787 49,717,441 Convenience Stores ,334,596 11,284,393 (7,949,797) Specialty Food Stores ,889,099 2,280,874 (391,775) Beer, Wine and Liquor Stores ,815,782-3,815,782 Other General Merchandise Stores ,486,264 49,943,070 (12,456,806) Health and Personal Care Stores ,723,694 34,274,548 (3,550,854) Pharmancies and Drug Stores ,609,824 33,321,636 (6,711,812) Cosmetics, Beauty Supplies, Perfume Stores ,112, , ,035 Optical Goods Stores ,035,802 64, ,107 Other Health and Personal Care Stores ,965, ,716 1,206,816 Gasoline Stations ,497,017 74,734,072 (12,237,055) Gasoline Stations With Conv Stores ,147,353 46,368, ,534 Other Gasoline Stations ,349,664 28,365,252 (13,015,588) Clothing and Clothing Accessories Stores ,936,022 2,185,819 22,750,203 Clothing Stores ,069,866 1,707,320 16,362,546 Men's Clothing Stores ,086,720-1,086,720 Women's Clothing Stores ,544,118 1,685,360 2,858,758 Childrens, Infants Clothing Stores ,086,740-1,086,740 Family Clothing Stores ,714,306-9,714,306 Clothing Accessories Stores , ,480 Other Clothing Stores ,210,503 21,960 1,188,543 Shoe Stores ,684, ,499 3,206,383 Jewelry, Luggage, Leather Goods Stores ,181,274-3,181,274 Jewelry Stores ,898,458-2,898,458 Luggage and Leather Goods Stores , ,816
56 52 Appendix K continued RMP Opportunity Gap - Retail Stores (Sectors 445 and 452 modified) City of Denham Springs Polygon - p Demand 2009 Supply Opportunity Retail Stores (Consumer Expenditures) (Retail Sales) Gap/Surplus Sporting Goods, Hobby, Book, Music Stores ,541, ,991 9,759,011 Sportng Goods, Hobby, Musical Inst Stores ,680, ,540 7,003,888 Sporting Goods Stores ,016, ,200 3,491,051 Hobby, Toys and Games Stores ,435,973 72,763 2,363,210 Sew/Needlework/Piece Goods Stores ,183 31, ,413 Musical Instrument and Supplies Stores ,021 46, ,214 Book, Periodical and Music Stores ,860, ,450 2,755,124 Book Stores and News Dealers ,910,842 58,002 1,852,840 Book Stores ,792,933 58,002 1,734,931 News Dealers and Newsstands , ,909 Prerecorded Tapes, CDs, Record Stores ,731 47, ,283 Department Stores Excl Leased Depts ,720,581 37,652,750 (1,932,169) Department Stores Excl Leased Depts ,720,581 37,652,750 (1,932,169) Miscellaneous Store Retailers ,727,234 35,994,616 (23,267,382) Florists ,004,162 1,341,692 (337,530) Office Supplies, Stationery, Gift Stores ,500,641 3,178,913 2,321,728 Office Supplies and Stationery Stores ,114,950 2,281, ,951 Gift, Novelty and Souvenir Stores ,385, ,914 1,488,778 Used Merchandise Stores ,174,596 1,800,926 (626,330) Other Miscellaneous Store Retailers ,047,834 29,673,085 (24,625,251) Non-Store Retailers ,734, ,805 34,525,498 Foodservice and Drinking Places ,889,100 48,973, ,607 Full-Service Restaurants ,998,192 13,006,076 8,992,116 Limited-Service Eating Places ,687,892 34,659,897 (12,972,005) Special Foodservices ,336,297 1,258,753 3,077,544 Drinking Places -Alcoholic Beverages ,866,719 48,767 1,817,952 GAFO * 138,342, ,333,824 31,008,700 General Merchandise Stores ,206,845 87,595,819 (14,388,974) Clothing and Clothing Accessories Stores ,936,022 2,185,819 22,750,203 Furniture and Home Furnishings Stores ,243,346 9,239,145 2,004,201 Electronics and Appliance Stores ,914,668 4,352,137 8,562,531 Sporting Goods, Hobby, Book, Music Stores ,541, ,991 9,759,011 Office Supplies, Stationery, Gift Stores ,500,641 3,178,913 2,321,728 * GAFO (General merchandise, Apparel, Furniture and Other) represents sales at stores that sell merchandise normally sold in department stores. This category is not included in Total Retail Sales Including Eating and Drinking Places. Claritas' RMP data is derived fromtwo major sources of information. The demand data is derived fromthe Consumer Expenditure Survey (CE Survey), which is fielded by the U.S. Bureau of Labor Statistics (BLS). The supply data is derived fromthe Census of Retail Trade (CRT), which is made available by the U.S. Census. Additional data sources are incorporated to create both supply and demand estimates. The difference between demand and supply represents the opportunity gap or surplus available for each retail outlet in the specified reporting geography. When the demand is greater than (less than) the supply, there is an opportunity gap (surplus) for that retail outlet. For example, a positive value signifies an opportunity gap, while a negative value signifies a surplus CLARITAS INC. All rights reserved.
57 53 Appendix L RMP Opportunity Gap - Retail Stores (Sectors 445 and 452 modified) Town of Franklinton Polygon 2009 Demand 2009 Supply Opportunity Retail Stores (Consumer Expenditures) (Retail Sales) Gap/Surplus Total Retail Sales Incl Eating and Drinking Places 66,435, ,395,546 (60,959,632) Motor Vehicle and Parts Dealers-441 8,616,582 10,143,168 (1,526,586) Automotive Dealers ,023,556 6,445, ,523 Other Motor Vehicle Dealers ,897 71, ,917 Automotive Parts/Accsrs, Tire Stores ,129 3,626,154 (2,690,025) Furniture and Home Furnishings Stores-442 1,317,580 2,032,077 (714,497) Furniture Stores ,170 1,627,712 (932,542) Home Furnishing Stores , , ,045 Electronics and Appliance Stores-443 1,460, , ,884 Appliances, TVs, Electronics Stores ,119, , ,459 Household Appliances Stores , ,497 (370,480) Radio, Television, Electronics Stores , , ,939 Computer and Software Stores ,669 52, ,739 Camera and Photographic Equipment Stores ,685-50,685 Building Material, Garden Equip Stores ,480,165 5,100,249 2,379,916 Building Material and Supply Dealers ,922,625 2,772,666 4,149,959 Home Centers ,814,304-2,814,304 Paint and Wallpaper Stores , ,994 Hardware Stores ,216 2,032,095 (1,447,879) Other Building Materials Dealers ,379, ,571 2,638,540 Building Materials, Lumberyards ,330, ,724 1,040,468 Lawn, Garden Equipment, Supplies Stores ,540 2,327,583 (1,770,043) Outdoor Power Equipment Stores , ,434 (85,583) Nursery and Garden Centers ,689 2,159,149 (1,684,460) Food and Beverage Stores Other Genl Merch Stores ,590,968 35,391,680 (20,800,712) Grocery Stores ,931,927 23,480,388 (14,548,461) Supermarkets, Grocery (Ex Conv) Stores ,485,618 23,459,375 (14,973,757) Convenience Stores ,309 21, ,295 Specialty Food Stores , , ,084 Beer, Wine and Liquor Stores , , ,848 Other General Merchandise Stores ,816,112 11,494,295 (6,678,183) Health and Personal Care Stores-446 4,367,609 25,949,106 (21,581,497) Pharmancies and Drug Stores ,805,165 25,887,567 (22,082,402) Cosmetics, Beauty Supplies, Perfume Stores ,086 61, ,547 Optical Goods Stores , ,690 Other Health and Personal Care Stores , ,667 Gasoline Stations-447 8,396,909 29,721,093 Gasoline Stations With Conv Stores ,335,846 21,089,875 Other Gasoline Stations ,061,062 8,631,218 (21,324,184) (14,754,029) (6,570,156) Clothing and Clothing Accessories Stores-448 2,829,570 2,940,390 (110,820) Clothing Stores ,022,397 1,353, ,273 Men's Clothing Stores , ,201 (11,379) Women's Clothing Stores ,835 1,216,096 (723,261) Childrens, Infants Clothing Stores , ,076 Family Clothing Stores ,089,327-1,089,327 Clothing Accessories Stores ,361-46,361 Other Clothing Stores ,976 5, ,149 Shoe Stores ,880 28, ,461 Jewelry, Luggage, Leather Goods Stores ,293 1,558,847 (1,199,554) Jewelry Stores ,280 1,558,847 (1,231,567) Luggage and Leather Goods Stores ,013-32,013
58 54 Appendix L continued RMP Opportunity Gap - Retail Stores (Sectors 445 and 452 modified) Town of Franklinton Polygon - p Demand 2009 Supply Opportunity Retail Stores (Consumer Expenditures) (Retail Sales) Gap/Surplus Sporting Goods, Hobby, Book, Music Stores-451 1,134, , ,213 Sportng Goods, Hobby, Musical Inst Stores , , ,596 Sporting Goods Stores , , ,630 Hobby, Toys and Games Stores , ,315 Sew/Needlework/Piece Goods Stores , ,998 (149,464) Musical Instrument and Supplies Stores ,115-75,115 Book, Periodical and Music Stores , , ,617 Book Stores and News Dealers , ,860 Book Stores , ,995 News Dealers and Newsstands ,865-13,865 Prerecorded Tapes, CDs, Record Stores , ,758 (23,243) Department Stores Excl Leased Depts ,314,941 7,531,714 Department Stores Excl Leased Depts ,314,941 7,531,714 (3,216,773) (3,216,773) Miscellaneous Store Retailers-453 1,525,816 2,194,097 (668,281) Florists , ,411 (252,074) Office Supplies, Stationery, Gift Stores , ,153 (181,120) Office Supplies and Stationery Stores , ,377 (178,052) Gift, Novelty and Souvenir Stores , ,776 (3,068) Used Merchandise Stores ,522 10, ,694 Other Miscellaneous Store Retailers ,924 1,006,704 (357,780) Non-Store Retailers-454 4,296,364-4,296,364 Foodservice and Drinking Places-722 6,104,126 4,943,786 1,160,340 Full-Service Restaurants ,731,724 3,277,786 (546,062) Limited-Service Eating Places ,562,586 1,666, ,586 Special Foodservices , ,434 Drinking Places -Alcoholic Beverages , ,382 GAFO * 16,498,520 26,252,815 (9,754,295) General Merchandise Stores-452 9,131,054 19,026,009 (9,894,955) Clothing and Clothing Accessories Stores-448 2,829,570 2,940,390 (110,820) Furniture and Home Furnishings Stores-442 1,317,580 2,032,077 (714,497) Electronics and Appliance Stores-443 1,460, , ,884 Sporting Goods, Hobby, Book, Music Stores-451 1,134, , ,213 Office Supplies, Stationery, Gift Stores , ,153 (181,120) * GAFO (General merchandise, Apparel, Furniture and Other) represents sales at stores that sell merchandise normally sold in department stores. This category is not included in Total Retail Sales Including Eating and Drinking Places. Claritas' RMP data is derived from two major sources of information. The demand data is derived from the Consumer Expenditure Survey (CE Survey), which is fielded by the U.S. Bureau of Labor Statistics (BLS). The supply data is derived from the Census of Retail Trade (CRT), which is made available by the U.S. Census. Additional data sources are incorporated to create both supply and demand estimates. The difference between demand and supply represents the opportunity gap or surplus available for each retail outlet in the specified reporting geography. When the demand is greater than (less than) the supply, there is an opportunity gap (surplus) for that retail outlet. For example, a positive value signifies an opportunity gap, while a negative value signifies a surplus CLARITAS INC. All rights reserved.
59 55 Appendix M RMP Opportunity Gap - Retail Stores (Sectors 445 and 452 modified) Town of Greensburg Polygon 2009 Demand 2009 Supply Opportunity Retail Stores (Consumer Expenditures) (Retail Sales) Gap/Surplus Total Retail Sales Incl Eating and Drinking Places 28,838,415 9,967,585 18,870,830 Motor Vehicle and Parts Dealers-441 3,705,069 1,573,656 2,131,413 Automotive Dealers ,012,666-3,012,666 Other Motor Vehicle Dealers , ,859 Automotive Parts/Accsrs, Tire Stores ,543 1,573,656 (1,166,113) Furniture and Home Furnishings Stores , ,713 Furniture Stores , ,736 Home Furnishing Stores , ,977 Electronics and Appliance Stores ,401 28, ,305 Appliances, TVs, Electronics Stores ,142 18, ,461 Household Appliances Stores ,966 18, ,285 Radio, Television, Electronics Stores , ,176 Computer and Software Stores ,215 9, ,800 Camera and Photographic Equipment Stores ,044-24,044 Building Material, Garden Equip Stores ,577,540 1,612,559 1,964,981 Building Material and Supply Dealers ,312,343 1,450,904 1,861,439 Home Centers ,336,690-1,336,690 Paint and Wallpaper Stores ,611 36,528 32,083 Hardware Stores , ,413 (397,301) Other Building Materials Dealers ,630, , ,967 Building Materials, Lumberyards , , ,826 Lawn, Garden Equipment, Supplies Stores , , ,542 Outdoor Power Equipment Stores ,203-39,203 Nursery and Garden Centers , ,655 64,339 Food and Beverage Stores Other Genl Merch Stores ,060,370 1,333,527 4,726,843 Grocery Stores ,685,200 1,333,527 2,351,673 Supermarkets, Grocery (Ex Conv) Stores ,509,144 1,233,330 2,275,814 Convenience Stores , ,196 75,861 Specialty Food Stores , ,984 Beer, Wine and Liquor Stores , ,319 Other General Merchandise Stores ,087,867-2,087,867 Health and Personal Care Stores-446 1,924, ,543 1,520,864 Pharmancies and Drug Stores ,672, ,543 1,268,657 Cosmetics, Beauty Supplies, Perfume Stores ,713-71,713 Optical Goods Stores ,851-54,851 Other Health and Personal Care Stores , ,643 Gasoline Stations-447 3,630,208 2,758, ,035 Gasoline Stations With Conv Stores ,718,348 2,273, ,488 Other Gasoline Stations , , ,548 Clothing and Clothing Accessories Stores-448 1,290,483 1,017, ,368 Clothing Stores , , ,216 Men's Clothing Stores , ,922 (66,699) Women's Clothing Stores , ,748 98,811 Childrens, Infants Clothing Stores ,003 92,865 (35,862) Family Clothing Stores , , ,700 Clothing Accessories Stores , ,716 (107,970) Other Clothing Stores ,236-63,236 Shoe Stores , ,937 67,283 Jewelry, Luggage, Leather Goods Stores , ,512 (98,131) Jewelry Stores , ,303 (696) Luggage and Leather Goods Stores , ,209 (97,435)
60 56 Appendix M continued RMP Opportunity Gap - Retail Stores (Sectors 445 and 452 modified) Town of Greensburg Polygon - p Demand 2009 Supply Opportunity Retail Stores (Consumer Expenditures) (Retail Sales) Gap/Surplus Sporting Goods, Hobby, Book, Music Stores , ,390 Sportng Goods, Hobby, Musical Inst Stores , ,088 Sporting Goods Stores , ,849 Hobby, Toys and Games Stores , ,626 Sew/Needlework/Piece Goods Stores ,821-31,821 Musical Instrument and Supplies Stores ,792-31,792 Book, Periodical and Music Stores , ,302 Book Stores and News Dealers ,744-88,744 Book Stores ,940-82,940 News Dealers and Newsstands ,804-5,804 Prerecorded Tapes, CDs, Record Stores ,558-47,558 Department Stores Excl Leased Depts ,946,635 39,124 1,907,511 Department Stores Excl Leased Depts ,946,635 39,124 1,907,511 Miscellaneous Store Retailers ,911 27, ,987 Florists ,955 27,924 28,031 Office Supplies, Stationery, Gift Stores , ,446 Office Supplies and Stationery Stores , ,299 Gift, Novelty and Souvenir Stores , ,147 Used Merchandise Stores ,752-58,752 Other Miscellaneous Store Retailers , ,758 Non-Store Retailers-454 1,917, ,916,919 Foodservice and Drinking Places-722 2,341,724 1,173,223 1,168,501 Full-Service Restaurants ,033, , ,934 Limited-Service Eating Places ,013, , ,703 Special Foodservices , ,546 Drinking Places -Alcoholic Beverages , ,186 (373,683) GAFO * 7,360,936 1,084,336 6,276,600 General Merchandise Stores-452 4,034,502 39,124 3,995,378 Clothing and Clothing Accessories Stores-448 1,290,483 1,017, ,368 Furniture and Home Furnishings Stores , ,713 Electronics and Appliance Stores ,401 28, ,305 Sporting Goods, Hobby, Book, Music Stores , ,390 Office Supplies, Stationery, Gift Stores , ,446 * GAFO (General merchandise, Apparel, Furniture and Other) represents sales at stores that sell merchandise normally sold in department stores. This category is not included in Total Retail Sales Including Eating and Drinking Places. Claritas' RMP data is derived from two major sources of information. The demand data is derived from the Consumer Expenditure Survey (CE Survey), which is fielded by the U.S. Bureau of Labor Statistics (BLS). The supply data is derived from the Census of Retail Trade (CRT), which is made available by the U.S. Census. Additional data sources are incorporated to create both supply and demand estimates. The difference between demand and supply represents the opportunity gap or surplus available for each retail outlet in the specified reporting geography. When the demand is greater than (less than) the supply, there is an opportunity gap (surplus) for that retail outlet. For example, a positive value signifies an opportunity gap, while a negative value signifies a surplus CLARITAS INC. All rights reserved.
61 57 Appendix N RMP Opportunity Gap - Retail Stores (Sectors 445 and 452 modified) Hammond/Ponchatoula Polygon 2009 Demand 2009 Supply Opportunity Retail Stores (Consumer Expenditures) (Retail Sales) Gap/Surplus Total Retail Sales Incl Eating and Drinking Places 650,649,847 1,204,302,629 (553,652,782) Motor Vehicle and Parts Dealers ,443, ,704,398 Automotive Dealers ,190, ,982,704 Other Motor Vehicle Dealers ,802,073 29,210,140 Automotive Parts/Accsrs, Tire Stores ,450,747 21,511,555 (182,261,047) (147,792,174) (22,408,067) (12,060,808) Furniture and Home Furnishings Stores ,422,709 12,219, ,852 Furniture Stores ,667,281 5,970, ,169 Home Furnishing Stores ,755,428 6,249,745 (494,317) Electronics and Appliance Stores ,377,707 27,857,562 (12,479,855) Appliances, TVs, Electronics Stores ,560,958 26,734,009 (15,173,051) Household Appliances Stores ,703,278 2,993,896 (290,618) Radio, Television, Electronics Stores ,857,680 23,740,113 (14,882,433) Computer and Software Stores ,223,308 1,123,553 2,099,755 Camera and Photographic Equipment Stores , ,441 Building Material, Garden Equip Stores ,250, ,734,310 (55,483,971) Building Material and Supply Dealers ,180, ,144,228 (58,964,072) Home Centers ,504,595 65,850,173 (40,345,578) Paint and Wallpaper Stores ,315,545 1,227,461 88,084 Hardware Stores ,402,946 1,500,410 3,902,536 Other Building Materials Dealers ,957,070 52,566,184 (22,609,114) Building Materials, Lumberyards ,672,275 20,564,666 (8,892,391) Lawn, Garden Equipment, Supplies Stores ,070,183 1,590,082 3,480,101 Outdoor Power Equipment Stores , ,357 Nursery and Garden Centers ,313,826 1,590,082 2,723,744 Food and Beverage Stores Other Genl Merch Stores ,624, ,349,886 (7,725,251) Grocery Stores ,578,207 33,611,564 47,966,643 Supermarkets, Grocery (Ex Conv) Stores ,444,517 31,541,003 45,903,514 Convenience Stores ,133,690 2,070,560 2,063,130 Specialty Food Stores ,394,044 1,242,967 1,151,077 Beer, Wine and Liquor Stores ,715, ,999 4,214,218 Other General Merchandise Stores ,937, ,994,356 (61,057,189) Health and Personal Care Stores ,503,590 85,727,136 (47,223,546) Pharmancies and Drug Stores ,474,837 80,352,935 (46,878,098) Cosmetics, Beauty Supplies, Perfume Stores ,407, , ,274 Optical Goods Stores ,133,250 1,025, ,375 Other Health and Personal Care Stores ,488,142 3,471,240 (983,098) Gasoline Stations ,720, ,670,260 Gasoline Stations With Conv Stores ,771, ,940,947 Other Gasoline Stations ,949, ,729,313 (184,949,534) (95,169,276) (89,780,259) Clothing and Clothing Accessories Stores ,112,001 21,188,580 8,923,421 Clothing Stores ,719,817 14,514,681 7,205,136 Men's Clothing Stores ,279,345 5,999 1,273,346 Women's Clothing Stores ,478,183 71,992 5,406,191 Childrens, Infants Clothing Stores ,350,880 1,997 1,348,883 Family Clothing Stores ,642,679 14,433,427 (2,790,748) Clothing Accessories Stores , ,972 Other Clothing Stores ,458, ,457,490 Shoe Stores ,694,047 3,788, ,048 Jewelry, Luggage, Leather Goods Stores ,698,137 2,884, ,236 Jewelry Stores ,373,152 2,702, ,929 Luggage and Leather Goods Stores , , ,307
62 58 Appendix N continued RMP Opportunity Gap - Retail Stores (Sectors 445 and 452 modified) Hammond/Ponchatoula Polygon - p Demand 2009 Supply Opportunity Retail Stores (Consumer Expenditures) (Retail Sales) Gap/Surplus Sporting Goods, Hobby, Book, Music Stores ,795,311 27,667,163 (14,871,852) Sportng Goods, Hobby, Musical Inst Stores ,757,081 14,820,460 (6,063,379) Sporting Goods Stores ,446,017 5,329,541 (883,524) Hobby, Toys and Games Stores ,856,889 6,296,807 (3,439,918) Sew/Needlework/Piece Goods Stores , ,206 Musical Instrument and Supplies Stores ,968 3,194,111 (2,418,143) Book, Periodical and Music Stores ,038,231 12,846,703 (8,808,472) Book Stores and News Dealers ,870,995 10,148,978 (7,277,983) Book Stores ,730,075 10,148,978 (7,418,903) News Dealers and Newsstands , ,920 Prerecorded Tapes, CDs, Record Stores ,167,236 2,697,725 (1,530,489) Department Stores Excl Leased Depts ,887,081 48,833,239 Department Stores Excl Leased Depts ,887,081 48,833,239 (5,946,158) (5,946,158) Miscellaneous Store Retailers ,762,935 39,335,139 (24,572,204) Florists ,083,277 1,532,943 (449,666) Office Supplies, Stationery, Gift Stores ,317,215 13,508,255 (7,191,040) Office Supplies and Stationery Stores ,562,227 11,072,001 (7,509,774) Gift, Novelty and Souvenir Stores ,754,988 2,436, ,734 Used Merchandise Stores ,394,092 1,819,920 (425,828) Other Miscellaneous Store Retailers ,968,351 22,474,020 (16,505,669) Non-Store Retailers ,794,747 5,144,511 36,650,236 Foodservice and Drinking Places ,954, ,870,588 (63,915,872) Full-Service Restaurants ,006,016 47,271,445 (20,265,429) Limited-Service Eating Places ,212,429 62,101,935 (35,889,506) Special Foodservices ,256,288 13,525,820 (8,269,532) Drinking Places -Alcoholic Beverages ,479,983 1,971, ,596 GAFO * 165,849, ,269,011 (92,419,819) General Merchandise Stores ,824, ,827,595 (67,003,347) Clothing and Clothing Accessories Stores ,112,001 21,188,580 8,923,421 Furniture and Home Furnishings Stores ,422,709 12,219, ,852 Electronics and Appliance Stores ,377,707 27,857,562 (12,479,855) Sporting Goods, Hobby, Book, Music Stores ,795,311 27,667,163 (14,871,852) Office Supplies, Stationery, Gift Stores ,317,215 13,508,255 (7,191,040) * GAFO (General merchandise, Apparel, Furniture and Other) represents sales at stores that sell merchandise normally sold in department stores. This category is not included in Total Retail Sales Including Eating and Drinking Places. Claritas' RMP data is derived from two major sources of information. The demand data is derived from the Consumer Expenditure Survey (CE Survey), which is fielded by the U.S. Bureau of Labor Statistics (BLS). The supply data is derived from the Census of Retail Trade (CRT), which is made available by the U.S. Census. Additional data sources are incorporated to create both supply and demand estimates. The difference between demand and supply represents the opportunity gap or surplus available for each retail outlet in the specified reporting geography. When the demand is greater than (less than) the supply, there is an opportunity gap (surplus) for that retail outlet. For example, a positive value signifies an opportunity gap, while a negative value signifies a surplus CLARITAS INC. All rights reserved.
63 59 Appendix O RMP Opportunity Gap - Retail Stores (Sectors 445 and 452 modified) Town of Kentwood Polygon 2009 Demand 2009 Supply Opportunity Retail Stores (Consumer Expenditures) (Retail Sales) Gap/Surplus Total Retail Sales Incl Eating and Drinking Places 26,908,445 43,074,373 (16,165,928) Motor Vehicle and Parts Dealers-441 3,434,308 4,835,675 (1,401,367) Automotive Dealers ,785,509 3,502,792 (717,283) Other Motor Vehicle Dealers , ,079 Automotive Parts/Accsrs, Tire Stores ,721 1,332,883 (954,162) Furniture and Home Furnishings Stores ,920 54, ,697 Furniture Stores ,995 54, ,772 Home Furnishing Stores , ,925 Electronics and Appliance Stores , ,560 Appliances, TVs, Electronics Stores , ,277 Household Appliances Stores , ,626 Radio, Television, Electronics Stores , ,650 Computer and Software Stores , ,334 Camera and Photographic Equipment Stores ,949-19,949 Building Material, Garden Equip Stores ,115,205 1,120,023 1,995,182 Building Material and Supply Dealers ,888,989 1,120,023 1,768,966 Home Centers ,166, , ,523 Paint and Wallpaper Stores ,515-59,515 Hardware Stores , ,654 Other Building Materials Dealers ,419, ,694 1,073,273 Building Materials, Lumberyards , , ,805 Lawn, Garden Equipment, Supplies Stores , ,216 Outdoor Power Equipment Stores ,307-33,307 Nursery and Garden Centers , ,909 Food and Beverage Stores Other Genl Merch Stores ,863,770 8,504,138 (2,640,368) Grocery Stores ,607, ,315 2,628,487 Supermarkets, Grocery (Ex Conv) Stores ,437, ,315 2,457,787 Convenience Stores , ,700 Specialty Food Stores , ,565 (160,493) Beer, Wine and Liquor Stores , ,018 Other General Merchandise Stores ,990,878 7,258,258 (5,267,380) Health and Personal Care Stores-446 1,791,416 2,584,978 (793,562) Pharmancies and Drug Stores ,559,706 2,584,978 (1,025,272) Cosmetics, Beauty Supplies, Perfume Stores ,770-66,770 Optical Goods Stores ,372-47,372 Other Health and Personal Care Stores , ,568 Gasoline Stations-447 3,505,297 21,874,095 Gasoline Stations With Conv Stores ,629,413 18,714,335 Other Gasoline Stations ,885 3,159,760 (18,368,798) (16,084,922) (2,283,875) Clothing and Clothing Accessories Stores-448 1,250, ,597 1,117,528 Clothing Stores , ,565 Men's Clothing Stores ,882-50,882 Women's Clothing Stores , ,678 Childrens, Infants Clothing Stores ,790-66,790 Family Clothing Stores , ,335 Clothing Accessories Stores ,315-20,315 Other Clothing Stores , ,565 Shoe Stores , ,255 Jewelry, Luggage, Leather Goods Stores , ,564 9,708 Jewelry Stores , ,674 2,406 Luggage and Leather Goods Stores ,192 4,890 7,302
64 60 Appendix O continued RMP Opportunity Gap - Retail Stores (Sectors 445 and 452 modified) Town of Kentwood Polygon - p Demand 2009 Supply Opportunity Retail Stores (Consumer Expenditures) (Retail Sales) Gap/Surplus Sporting Goods, Hobby, Book, Music Stores , , ,835 Sportng Goods, Hobby, Musical Inst Stores , ,470 24,378 Sporting Goods Stores , ,470 (149,519) Hobby, Toys and Games Stores , ,346 Sew/Needlework/Piece Goods Stores ,624-28,624 Musical Instrument and Supplies Stores ,926-28,926 Book, Periodical and Music Stores , ,457 Book Stores and News Dealers ,920-82,920 Book Stores ,641-77,641 News Dealers and Newsstands ,279-5,279 Prerecorded Tapes, CDs, Record Stores ,537-43,537 Department Stores Excl Leased Depts ,839, ,791 1,705,237 Department Stores Excl Leased Depts ,839, ,791 1,705,237 Miscellaneous Store Retailers , , ,203 Florists , ,421 (75,224) Office Supplies, Stationery, Gift Stores , ,052 Office Supplies and Stationery Stores , ,338 Gift, Novelty and Souvenir Stores , ,713 Used Merchandise Stores ,063-54,063 Other Miscellaneous Store Retailers , ,312 Non-Store Retailers-454 1,758,402-1,758,402 Foodservice and Drinking Places-722 2,144,484 3,382,960 (1,238,476) Full-Service Restaurants ,004 1,439,588 (495,584) Limited-Service Eating Places ,465 1,795,933 (863,468) Special Foodservices , ,304 Drinking Places -Alcoholic Beverages , ,440 (66,729) GAFO * 6,912,868 7,908,340 (995,472) General Merchandise Stores-452 3,829,906 7,392,049 (3,562,143) Clothing and Clothing Accessories Stores-448 1,250, ,597 1,117,528 Furniture and Home Furnishings Stores ,920 54, ,697 Electronics and Appliance Stores , ,560 Sporting Goods, Hobby, Book, Music Stores , , ,835 Office Supplies, Stationery, Gift Stores , ,052 * GAFO (General merchandise, Apparel, Furniture and Other) represents sales at stores that sell merchandise normally sold in department stores. This category is not included in Total Retail Sales Including Eating and Drinking Places. Claritas' RMP data is derived fromtwo major sources of information. The demand data is derived fromthe Consumer Expenditure Survey (CE Survey), which is fielded by the U.S. Bureau of Labor Statistics (BLS). The supply data is derived from the Census of Retail Trade (CRT), which is made available by the U.S. Census. Additional data sources are incorporated to create both supply and demand estimates. The difference between demand and supply represents the opportunity gap or surplus available for each retail outlet in the specified reporting geography. When the demand is greater than (less than) the supply, there is an opportunity gap (surplus) for that retail outlet. For example, a positive value signifies an opportunity gap, while a negative value signifies a surplus CLARITAS INC. All rights reserved.
65 61 Appendix P RMP Opportunity Gap - Retail Stores (Sectors 445 and 452 modified) Town of Livingston Polygon 2009 Demand 2009 Supply Opportunity Retail Stores (Consumer Expenditures) (Retail Sales) Gap/Surplus Total Retail Sales Incl Eating and Drinking Places 31,588,454 23,164,398 8,424,056 Motor Vehicle and Parts Dealers-441 4,536, ,755 4,164,445 Automotive Dealers ,740,181 98,583 3,641,598 Other Motor Vehicle Dealers ,088 11, ,312 Automotive Parts/Accsrs, Tire Stores , , ,535 Furniture and Home Furnishings Stores ,273 3,784,088 (3,143,815) Furniture Stores ,470 3,784,088 (3,442,618) Home Furnishing Stores , ,802 Electronics and Appliance Stores , , ,349 Appliances, TVs, Electronics Stores , , ,613 Household Appliances Stores ,931 38,462 97,469 Radio, Television, Electronics Stores ,944 95, ,144 Computer and Software Stores , ,350 Camera and Photographic Equipment Stores ,386-30,386 Building Material, Garden Equip Stores ,559,736 73,948 3,485,788 Building Material and Supply Dealers ,289,301 73,948 3,215,353 Home Centers ,346,559-1,346,559 Paint and Wallpaper Stores ,610-71,610 Hardware Stores ,649 23, ,042 Other Building Materials Dealers ,585,484 50,342 1,535,142 Building Materials, Lumberyards ,084 19, ,391 Lawn, Garden Equipment, Supplies Stores , ,435 Outdoor Power Equipment Stores ,170-40,170 Nursery and Garden Centers , ,265 Food and Beverage Stores Other Genl Merch Stores ,550,947 6,771,131 (220,184) Grocery Stores ,964,364 1,404,025 2,560,339 Supermarkets, Grocery (Ex Conv) Stores ,757,625 1,404,025 2,353,600 Convenience Stores , ,739 Specialty Food Stores ,650 24,213 91,437 Beer, Wine and Liquor Stores , ,991 Other General Merchandise Stores ,244,942 5,342,893 (3,097,951) Health and Personal Care Stores-446 1,847,610 1,705, ,938 Pharmancies and Drug Stores ,603,635 1,705,672 (102,037) Cosmetics, Beauty Supplies, Perfume Stores ,140-67,140 Optical Goods Stores ,040-58,040 Other Health and Personal Care Stores , ,796 Gasoline Stations-447 3,916,477 6,894,882 (2,978,405) Gasoline Stations With Conv Stores ,958,825 6,894,882 (3,936,057) Other Gasoline Stations , ,653 Clothing and Clothing Accessories Stores-448 1,402,828 99,236 1,303,592 Clothing Stores ,013,873 99, ,637 Men's Clothing Stores ,911-62,911 Women's Clothing Stores ,201 96, ,492 Childrens, Infants Clothing Stores ,433-62,433 Family Clothing Stores , ,085 Clothing Accessories Stores ,625-23,625 Other Clothing Stores ,618 2,527 65,091 Shoe Stores , ,341 Jewelry, Luggage, Leather Goods Stores , ,614 Jewelry Stores , ,073 Luggage and Leather Goods Stores ,541-16,541
66 62 Appendix P continued RMP Opportunity Gap - Retail Stores (Sectors 445 and 452 modified) Town of Livingston Polygon - p Demand 2009 Supply Opportunity Retail Stores (Consumer Expenditures) (Retail Sales) Gap/Surplus Sporting Goods, Hobby, Book, Music Stores , ,564 Sportng Goods, Hobby, Musical Inst Stores , ,355 Sporting Goods Stores , ,468 Hobby, Toys and Games Stores , ,639 Sew/Needlework/Piece Goods Stores , ,254 Musical Instrument and Supplies Stores ,994-35,994 Book, Periodical and Music Stores , ,208 Book Stores and News Dealers , ,417 Book Stores , ,400 News Dealers and Newsstands ,017-7,017 Prerecorded Tapes, CDs, Record Stores ,791-53,791 Department Stores Excl Leased Depts ,069,210-2,069,210 Department Stores Excl Leased Depts ,069,210-2,069,210 Miscellaneous Store Retailers , , ,041 Florists , ,684 (151,033) Office Supplies, Stationery, Gift Stores , ,998 Office Supplies and Stationery Stores , ,552 Gift, Novelty and Souvenir Stores , ,446 Used Merchandise Stores ,097 79,667 (12,570) Other Miscellaneous Store Retailers , , ,646 Non-Store Retailers-454 2,033,036-2,033,036 Foodservice and Drinking Places-722 2,921,535 2,857,035 64,500 Full-Service Restaurants ,282, , ,538 Limited-Service Eating Places ,281,099 2,519,641 (1,238,542) Special Foodservices , ,566 Drinking Places -Alcoholic Beverages , ,937 GAFO * 8,007,376 9,361,431 (1,354,055) General Merchandise Stores-452 4,314,151 5,342,893 (1,028,742) Clothing and Clothing Accessories Stores-448 1,402,828 99,236 1,303,592 Furniture and Home Furnishings Stores ,273 3,784,088 (3,143,815) Electronics and Appliance Stores , , ,349 Sporting Goods, Hobby, Book, Music Stores , ,564 Office Supplies, Stationery, Gift Stores , ,998 * GAFO (General merchandise, Apparel, Furniture and Other) represents sales at stores that sell merchandise normally sold in department stores. This category is not included in Total Retail Sales Including Eating and Drinking Places. Claritas' RMP data is derived from two major sources of information. The demand data is derived from the Consumer Expenditure Survey (CE Survey), which is fielded by the U.S. Bureau of Labor Statistics (BLS). The supply data is derived from the Census of Retail Trade (CRT), which is made available by the U.S. Census. Additional data sources are incorporated to create both supply and demand estimates. The difference between demand and supply represents the opportunity gap or surplus available for each retail outlet in the specified reporting geography. When the demand is greater than (less than) the supply, there is an opportunity gap (surplus) for that retail outlet. For example, a positive value signifies an opportunity gap, while a negative 2010 CLARITAS INC. All rights reserved.
67 63 Appendix Q RMP Opportunity Gap - Retail Stores (Sectors 445 and 452 modified) City of Slidell Polygon 2009 Demand 2009 Supply Opportunity Retail Stores (Consumer Expenditures) (Retail Sales) Gap/Surplus Total Retail Sales Incl Eating and Drinking Places 1,247,844,572 1,974,478,517 (726,633,945) Motor Vehicle and Parts Dealers ,600, ,545,705 20,054,441 Automotive Dealers ,076, ,141,125 26,935,849 Other Motor Vehicle Dealers ,269,499 8,421,129 5,848,370 Automotive Parts/Accsrs, Tire Stores ,253,673 29,983,450 (12,729,777) Furniture and Home Furnishings Stores ,689,860 30,089,599 (3,399,739) Furniture Stores ,293,619 8,211,279 6,082,340 Home Furnishing Stores ,396,241 21,878,320 (9,482,079) Electronics and Appliance Stores ,822,601 67,487,967 (37,665,366) Appliances, TVs, Electronics Stores ,346,640 62,880,094 (40,533,454) Household Appliances Stores ,395,596 10,149,856 (4,754,260) Radio, Television, Electronics Stores ,951,043 52,730,238 (35,779,195) Computer and Software Stores ,169,708 4,607,873 1,561,835 Camera and Photographic Equipment Stores ,306,253-1,306,253 Building Material, Garden Equip Stores ,609, ,195,207 (231,586,139) Building Material and Supply Dealers ,635, ,731,507 (238,095,903) Home Centers ,971, ,966,500 (164,995,397) Paint and Wallpaper Stores ,975, ,303 2,422,379 Hardware Stores ,300,879 10,319, ,017 Other Building Materials Dealers ,387, ,891,842 (76,503,902) Building Materials, Lumberyards ,825,569 54,727,756 (29,902,187) Lawn, Garden Equipment, Supplies Stores ,973,464 4,463,700 6,509,764 Outdoor Power Equipment Stores ,653,874-1,653,874 Nursery and Garden Centers ,319,590 4,463,700 4,855,890 Food and Beverage Stores Other Genl Merch Stores ,972, ,297,580 (305,324,774) Grocery Stores ,182, ,479,603 21,703,238 Supermarkets, Grocery (Ex Conv) Stores ,619, ,950,624 20,668,789 Convenience Stores ,563,429 6,528,978 1,034,451 Specialty Food Stores ,427,751 1,763,284 2,664,467 Beer, Wine and Liquor Stores ,786, ,940 10,186,493 Other General Merchandise Stores ,575, ,454,753 (339,878,972) Health and Personal Care Stores ,134,641 49,128,520 24,006,121 Pharmancies and Drug Stores ,316,879 42,885,159 20,431,720 Cosmetics, Beauty Supplies, Perfume Stores ,658,580 2,018, ,766 Optical Goods Stores ,459,249 1,966, ,639 Other Health and Personal Care Stores ,699,933 2,257,938 2,441,995 Gasoline Stations ,231, ,171,423 Gasoline Stations With Conv Stores ,510, ,373,609 Other Gasoline Stations ,721,439 50,797,814 (139,939,966) (123,863,591) (16,076,375) Clothing and Clothing Accessories Stores ,247,642 56,164,475 1,083,167 Clothing Stores ,234,761 37,144,550 4,090,211 Men's Clothing Stores ,516,804 1,191,697 1,325,107 Women's Clothing Stores ,369,057 10,397,168 (28,111) Childrens, Infants Clothing Stores ,407,799 2,058, ,329 Family Clothing Stores ,184,824 18,814,423 3,370,401 Clothing Accessories Stores , , ,621 Other Clothing Stores ,772,437 4,546,571 (1,774,134) Shoe Stores ,243,465 11,972,734 (3,729,269) Jewelry, Luggage, Leather Goods Stores ,769,416 7,047, ,225 Jewelry Stores ,128,308 7,047,191 81,117 Luggage and Leather Goods Stores , ,107
68 64 Appendix Q continued RMP Opportunity Gap - Retail Stores (Sectors 445 and 452 modified) City of Slidell Polygon - p Demand 2009 Supply Opportunity Retail Stores (Consumer Expenditures) (Retail Sales) Gap/Surplus Sporting Goods, Hobby, Book, Music Stores ,119,241 40,200,841 (16,081,600) Sportng Goods, Hobby, Musical Inst Stores ,199,028 32,139,281 (14,940,253) Sporting Goods Stores ,057,606 8,558, ,832 Hobby, Toys and Games Stores ,371,366 21,369,719 (15,998,353) Sew/Needlework/Piece Goods Stores ,182,583 1,505,013 (322,430) Musical Instrument and Supplies Stores ,587, , ,699 Book, Periodical and Music Stores ,920,213 8,061,560 (1,141,347) Book Stores and News Dealers ,633,257 4,257, ,631 Book Stores ,368,348 4,257, ,722 News Dealers and Newsstands , ,909 Prerecorded Tapes, CDs, Record Stores ,286,956 3,803,934 (1,516,978) Department Stores Excl Leased Depts ,349, ,946,925 Department Stores Excl Leased Depts ,349, ,946,925 Miscellaneous Store Retailers ,734,066 68,484,714 Florists ,368,691 10,995,072 Office Supplies, Stationery, Gift Stores ,530,762 27,201,020 Office Supplies and Stationery Stores ,094,851 16,827,774 Gift, Novelty and Souvenir Stores ,435,911 10,373,246 Used Merchandise Stores ,715,219 3,642,787 Other Miscellaneous Store Retailers ,119,394 26,645,834 (38,597,753) (38,597,753) (39,750,648) (8,626,381) (14,670,258) (9,732,923) (4,937,335) (927,568) (15,526,440) Non-Store Retailers ,707,184 32,038,005 48,669,179 Foodservice and Drinking Places ,626, ,727,556 (8,100,869) Full-Service Restaurants ,640,392 60,361,962 (6,721,570) Limited-Service Eating Places ,076,649 60,834,803 (10,758,154) Special Foodservices ,107,687 3,261,505 6,846,182 Drinking Places -Alcoholic Beverages ,801,960 3,269,285 2,532,675 GAFO * 319,335, ,545,581 (449,210,523) General Merchandise Stores ,924, ,401,678 (378,476,725) Clothing and Clothing Accessories Stores ,247,642 56,164,475 1,083,167 Furniture and Home Furnishings Stores ,689,860 30,089,599 (3,399,739) Electronics and Appliance Stores ,822,601 67,487,967 (37,665,366) Sporting Goods, Hobby, Book, Music Stores ,119,241 40,200,841 (16,081,600) Office Supplies, Stationery, Gift Stores ,530,762 27,201,020 (14,670,258) * GAFO (General merchandise, Apparel, Furniture and Other) represents sales at stores that sell merchandise normally sold in department stores. This category is not included in Total Retail Sales Including Eating and Drinking Places. Claritas' RMP data is derived from two major sources of information. The demand data is derived from the Consumer Expenditure Survey (CE Survey), which is fielded by the U.S. Bureau of Labor Statistics (BLS). The supply data is derived from the Census of Retail Trade (CRT), which is made available by the U.S. Census. Additional data sources are incorporated to create both supply and demand estimates. The difference between demand and supply represents the opportunity gap or surplus available for each retail outlet in the specified reporting geography. When the demand is greater than (less than) the supply, there is an opportunity gap (surplus) for that retail outlet. For example, a positive value signifies an opportunity gap, while a negative value signifies a surplus CLARITAS INC. All rights reserved.
69 65 Appendix R RMP Opportunity Gap - Retail Stores (Sectors 445 and 452 modified) City of Walker Polygon 2009 Demand 2009 Supply Opportunity Retail Stores (Consumer Expenditures) (Retail Sales) Gap/Surplus Total Retail Sales Incl Eating and Drinking Places 184,327, ,957,600 74,369,929 Motor Vehicle and Parts Dealers ,941,473 1,532,096 27,409,377 Automotive Dealers ,123, ,918 23,806,780 Other Motor Vehicle Dealers ,159,101 14,220 2,144,881 Automotive Parts/Accsrs, Tire Stores ,658,674 1,200,958 1,457,716 Furniture and Home Furnishings Stores-442 3,724,381 1,454,593 2,269,788 Furniture Stores ,986,298-1,986,298 Home Furnishing Stores ,738,083 1,454, ,490 Electronics and Appliance Stores-443 4,367,480 71,068 4,296,412 Appliances, TVs, Electronics Stores ,271,839-3,271,839 Household Appliances Stores , ,685 Radio, Television, Electronics Stores ,474,153-2,474,153 Computer and Software Stores ,986 71, ,918 Camera and Photographic Equipment Stores , ,656 Building Material, Garden Equip Stores ,473,913 10,414,698 10,059,215 Building Material and Supply Dealers ,914,235 9,969,970 8,944,265 Home Centers ,757,368 30,021 7,727,347 Paint and Wallpaper Stores , ,184 Hardware Stores ,646,699 46,700 1,599,999 Other Building Materials Dealers ,096,985 9,893,249 (796,264) Building Materials, Lumberyards ,543,056 3,870,387 (327,331) Lawn, Garden Equipment, Supplies Stores ,559, ,728 1,114,949 Outdoor Power Equipment Stores , ,836 Nursery and Garden Centers ,325, , ,113 Food and Beverage Stores Other Genl Merch Stores ,155,586 38,897,870 (1,742,284) Grocery Stores ,342,903 26,297,343 (3,954,440) Supermarkets, Grocery (Ex Conv) Stores ,178,603 26,129,562 (4,950,959) Convenience Stores ,164, , ,519 Specialty Food Stores , , ,692 Beer, Wine and Liquor Stores ,296,481-1,296,481 Other General Merchandise Stores ,861,535 12,332, ,983 Health and Personal Care Stores ,301,061 13,205,159 (2,904,098) Pharmancies and Drug Stores ,930,182 13,163,426 (4,233,244) Cosmetics, Beauty Supplies, Perfume Stores ,578 41, ,845 Optical Goods Stores , ,491 Other Health and Personal Care Stores , ,811 Gasoline Stations ,114,602 12,575,190 9,539,412 Gasoline Stations With Conv Stores ,682,726 8,556,358 8,126,368 Other Gasoline Stations ,431,875 4,018,832 1,413,043 Clothing and Clothing Accessories Stores-448 8,416,238 2,152,081 6,264,157 Clothing Stores ,112, ,046 5,563,130 Men's Clothing Stores , ,919 Women's Clothing Stores ,513, ,470 1,017,946 Childrens, Infants Clothing Stores , ,785 Family Clothing Stores ,290,470-3,290,470 Clothing Accessories Stores ,830 28, ,831 Other Clothing Stores ,757 24, ,180 Shoe Stores ,282, , ,310 Jewelry, Luggage, Leather Goods Stores ,021,718 1,167,001 (145,283) Jewelry Stores ,258 1,167,001 (240,743) Luggage and Leather Goods Stores ,460-95,460
70 66 Appendix R continued RMP Opportunity Gap - Retail Stores (Sectors 445 and 452 modified) City of Walker Polygon - p Demand 2009 Supply Opportunity Retail Stores (Consumer Expenditures) (Retail Sales) Gap/Surplus Sporting Goods, Hobby, Book, Music Stores-451 3,567,103 87,625 3,479,478 Sportng Goods, Hobby, Musical Inst Stores ,608,782 22,625 2,586,157 Sporting Goods Stores ,352,805 11,322 1,341,483 Hobby, Toys and Games Stores ,694 1, ,163 Sew/Needlework/Piece Goods Stores ,782 9, ,010 Musical Instrument and Supplies Stores , ,501 Book, Periodical and Music Stores ,321 65, ,321 Book Stores and News Dealers , ,340 Book Stores , ,089 News Dealers and Newsstands ,251-40,251 Prerecorded Tapes, CDs, Record Stores ,981 65, ,981 Department Stores Excl Leased Depts ,126,452 18,513,796 (6,387,344) Department Stores Excl Leased Depts ,126,452 18,513,796 (6,387,344) Miscellaneous Store Retailers-453 4,377,611 1,226,318 3,151,293 Florists , ,592 Office Supplies, Stationery, Gift Stores ,856,753-1,856,753 Office Supplies and Stationery Stores ,049,098-1,049,098 Gift, Novelty and Souvenir Stores , ,654 Used Merchandise Stores , ,571 82,892 Other Miscellaneous Store Retailers ,790, , ,056 Non-Store Retailers ,751,627 79,016 11,672,611 Foodservice and Drinking Places ,010,002 9,748,089 7,261,913 Full-Service Restaurants ,482,476 2,660,155 4,822,321 Limited-Service Eating Places ,431,899 7,012, ,695 Special Foodservices ,484,304 71,561 1,412,743 Drinking Places -Alcoholic Beverages ,323 4, ,154 GAFO * 46,919,943 34,611,714 12,308,229 General Merchandise Stores ,987,987 30,846,348 (5,858,361) Clothing and Clothing Accessories Stores-448 8,416,238 2,152,081 6,264,157 Furniture and Home Furnishings Stores-442 3,724,381 1,454,593 2,269,788 Electronics and Appliance Stores-443 4,367,480 71,068 4,296,412 Sporting Goods, Hobby, Book, Music Stores-451 3,567,103 87,625 3,479,478 Office Supplies, Stationery, Gift Stores ,856,753-1,856,753 * GAFO (General merchandise, Apparel, Furniture and Other) represents sales at stores that sell merchandise normally sold in department stores. This category is not included in Total Retail Sales Including Eating and Drinking Places. Claritas' RMP data is derived from two major sources of information. The demand data is derived from the Consumer Expenditure Survey (CE Survey), which is fielded by the U.S. Bureau of Labor Statistics (BLS). The supply data is derived from the Census of Retail Trade (CRT), which is made available by the U.S. Census. Additional data sources are incorporated to create both supply and demand estimates. The difference between demand and supply represents the opportunity gap or surplus available for each retail outlet in the specified reporting geography. When the demand is greater than (less than) the supply, there is an opportunity gap (surplus) for that retail outlet. For example, a positive value signifies an opportunity gap, while a negative value signifies a surplus CLARITAS INC. All rights reserved.
71 67

72 68
appendix 6: retail market potential opportunity gap retail stores 2007 Appendix Kensington and Vicinity Sector Plan Appendix 70
 appendix 6: retail market potential opportunity gap retail stores 2007 Appendix Kensington and Vicinity Sector Plan Appendix 70 Total Retail Sales Incl Eating and Drinking Places 32,442,099 95,578,148
RMP Opportunity Gap - Retail Stores 2007
 Radius 1: 5737 S TRANSIT RD, LOCKPORT, NY 14094-5892, 0.00-3.00 Miles, Total Total Retail Sales Incl Eating and Drinking Places 552,172,317 460,321,140 Motor Vehicle and Parts Dealers-441 103,214,550 82,475,641
RMP Opportunity Gap - Retail Stores
 Radius 1:, 0.00-3.00 Miles, Total Total Retail Sales Incl Eating and Drinking Places 709,535,602 1,041,558,846 Motor Vehicle and Parts Dealers-441 136,302,785 84,961,319 Automotive Dealers-4411 120,666,093
RMP Opportunity Gap - Retail Stores
 Radius 1:, 0.00-1.00 Miles, Total Total Retail Sales Incl Eating and Drinking Places 265,416,122 83,489,366 Motor Vehicle and Parts Dealers-441 45,469,731 11,931,711 Automotive Dealers-4411 40,430,946
RMP Opportunity Gap - Retail Stores
 Radius 1:, 0.00-1.00 Miles, Total Total Retail Sales Incl Eating and Drinking Places 20,171,574 13,300,717 Motor Vehicle and Parts Dealers-441 3,793,941 601,379 Automotive Dealers-4411 3,202,573 356,177
Retail Leakage and Surplus Analysis
 Retail Leakage and Surplus Analysis The Retail Leakage and Surplus Analysis examines the quantitative aspect of the community's retail opportunities. It is a guide to understanding retail opportunities
Retail Leakage and Surplus Analysis
 Retail Leakage and Surplus Analysis The Retail Leakage and Surplus Analysis examines the quantitative aspect of the community's retail opportunities. It is a guide to understanding retail opportunities
Retail Leakage and Surplus Analysis
 The Retail Leakage and Surplus Analysis examines the quantitative aspect of the community's retail opportunities. It is a guide to understanding retail opportunities but it is not an analysis that indicates
Hammond Retail Study
 Hammond Retail Study February 2007 Southeastern Louisiana University Business Research Center Compiled By: John Giamalva Acknowledgement of contributors to this study: Southeastern Louisiana University,
Northshore Commerce Study
 Northshore Commerce Study An Overview of Demographics, Employment, and Business Activity of the Northshore Region of Louisiana September 2008 Southeastern Louisiana University Business Research Center
PROPERTY INFORMATION Executive Summary
 PROPERTY INFORMATION Executive Summary OFFERING SUMMARY Sale Price: $749,000 Lease Rate: $15-18 NNN Lot Size: 0.37 Acres Year Built: 1886 Renovated: 2011 PROPERTY HIGHLIGHTS Located on Main Street Route
Business-Facts: Retail NAICS Summary 2015
 Business-Facts: Retail NAICS Summary 215 Lake Anne 215 Polygon 1: LAKE ANNE 2, NAICS Code Business Description Establishment Employees Sales (in Millions) 44,45,722 All Retail (including Food Services
Retail MarketPlace Profile
 Ring: 1 mile radius Latitude: 32.35365 Summary Demographics 2016 Population 7,400 2016 Households 3,138 2016 Median Disposable Income $41,269 2016 Per Capita Income $24,267 Industry Summary (Retail Potential)
Business-Facts: Retail NAICS Summary 2015
 Business-Facts: Retail NAICS Summary 25 McLean CRD 25 Polygon :, NAICS Code Business Description Establishment Employees Sales (in Millions) 44,45,22 All Retail (including Food Services and Drinking Places)
Retail MarketPlace Profile
 Ring: 3 miles radius Longitude: -83.78862 Summary Demographics 21 Population 28,66 21 Households 9,146 21 Median Disposable Income $35,477 21 Per Capita Income $18,259 Industry Summary (Retail Potential)
Retail MarketPlace Profile
 Drive Time: 5 minute radius Longitude: -86.79066 Summary Demographics 2015 Population 10,596 2015 Households 4,648 2015 Median Disposable Income $55,009 2015 Per Capita Income $47,446 Industry Summary
Business-Facts Summary - Retail NAICS Summary
 - Retail NAICS Summary Title Page Title Page Data Version: 2018 Feb (Internal) Report Generation Method: Single Analysis Area: 1789 STATE ST, SAN DIEGO, CA, 92101-2530 Reporting Detail: As Selected Include
Site Map. Meadowlark Dr & Robinhood Rd, Winston Salem, NC, October 31, Esri
 Site Map Robinhood Village Meadowlark Dr & Robinhood Rd, Winston Salem, NC, 27106 Ring: 1, 3, 5 Miles Latitude: 36.120508 Longitude: -80.367204 October 31, 2011 2011 Esri Executive Summary Ring: 1, 3,
Retail MarketPlace Profile
 Summary Demographics Ring: 1 mile radius Longitude: -79.19276 2015 Population 2,497 2015 Households 1,302 2015 Median Disposable Income $36,906 2015 Per Capita Income $31,929 Industry Summary (Retail Potential)
Business-Facts: Retail SIC Summary
 Order #: 9638549 Site: HIGHWAY 6 W AT HIGHWAY 35 S, CARTHAGE, MS 395,. - 5. Miles, + RET All Retailing,4 46. 5 Building Materials, Garden Supply and Mobile Homes 8 5.6 5 Lumber and Other Building Materials.8
KARNS, TENNESSEE 5.7 Acres Available Located on Oak Ridge Highway Excellent Development Opportunity!
 KARNS, TENNESSEE 5.7 Acres Available Located on Oak Ridge Highway Excellent Development Opportunity! DIXON GREENWOOD, CCIM Ball Realty & Auction, Inc. P.O. Box 237, Tazewell, TN 37879 423-626-9393 office
Retail MarketPlace Profile
 Retail MarketPlace Profile Drive Time: 5 minute radius Longitude: -77.40323 Summary Demographics 2015 Population 8,394 2015 Households 3,199 2015 Median Disposable Income $38,578 2015 Per Capita Income
Demographic and Income Profile
 Demographic and Income Profile Summary Census 21 212 217 Population 3,718 3,985 4,362 Households 1,316 1,418 1,571 Families 1,128 1,212 1,336 Average Household Size 2.82 2.81 2.77 Owner Occupied Housing
.33 AC AC RETAIL LAND FOR SALE OR BUILD TO SUIT ORCHARD ROAD & OAK STREET, NORTH AURORA, IL 60542
 Development Opportunity.33 AC - 6.74 AC RETAIL LAND FOR SALE OR BUILD TO SUIT ORCHARD ROAD & OAK STREET, NORTH AURORA, IL 60542 OFFERING SUMMARY Price / Acre: See Enclosed Pricing Summary Lot Size:.33
Study Area Maps. Profile Tables. The CORE Shopping Centre Pitney Bowes 2018 Canada Business Summary
 Powered by Sitewise Page 1 Study Area Maps Profile Tables 2018 Canada Business Summary 2018 Canada Businesses By SIC Codes (1-49) 2018 Canada Businesses By SIC Codes (50-99) Prepared on: 4/20/2018 3:45:52
3598 OLD JENNINGS RD 3598 Old Jennings Rd, Middleburg, FL 32068
 LAND FOR SALE 3598 OLD JENNINGS RD 3598 Old Jennings Rd, Middleburg, FL 32068 PROPERTY FEATURES 7.69 Acres at Lighted intersection Adjacent Properties are Zoned MPC, School & Retail NC Across Tynes Water
EDC ADDENDUM to the INTERIM REPORT
 EDC ADDENDUM to the INTERIM REPORT Economic Impact Assessment of Mansfield Park November 2018 STEWARDSHIP STRATEGIES Design Planning Historic Preservation Economic Development INTERIM REPORT - Economic
Retail / Office - Available on Busy Florence Ave.
 Retail / Office - Available on Busy Florence Ave. 1931-1935 Florence Ave. Los Angeles, CA 90001 DEMOS 1 mile 3 mile 5 mile Population 62,398 489,568 1,146,128 Avg. HH Income $43,380 $44,533 $45,775 Daytime
SUMMARY CENSUS Population 135, , ,685. Households 44,675 52,029 57,758. Families 36,035 41,582 45,978
 Retail Specialty Report 450 US-23, Suwanee, Georgia, 30024 RING: 5 MILES Demographic & Income Profile SUMMARY CENSUS 2010 2017 2022 Population 135,417 157,987 175,685 Households 44,675 52,029 57,758 Families
CUSTOM OFFICE SPACE AVAILABLE 3101 Bristol Road Bensalem, PA 19020
 FOR SALE OR LEASE CUSTOM OFFICE SPACE AVAILABLE 3101 Bristol Road Bensalem, PA 19020 Up to ~7,800 Square Feet Fully Customizable Space Can Be Finished to Suit Building Under Full Renovation & Upgrade Energy
RETAIL PROPERTY FOR LEASE RYLAND PLAZA Ryland Pike, Huntsville, AL Clinton Avenue Suite 501 Huntsville, AL deancre.
 1001 Ryland Pike, Huntsville, AL 35811 2101 Clinton Avenue Suite 501 Huntsville, AL 35805 deancre.com 1001 RYLAND PIKE, HUNTSVILLE, AL 35811 EXECUTIVE SUMMARY OFFERING SUMMARY Available SF: 1,000-2,000
APPENDIX U WEST PLAINS RETAIL DEVELOPMENT OPPORTUNITIES: AIRWAY HEIGHTS, WASHINGTON PRIMARY MARKET ASSESSMENT
 APPENDIX U : AIRWAY HEIGHTS, WASHINGTON PRIMARY MARKET ASSESSMENT WEST PLAINS RETAIL DEVELOPMENT OPPORTUNITIES AIRWAY HEIGHTS, WASHINGTON PRIMARY MARKET ASSESSMENT JULY 30, 2009 For more information contact:
RAMHIC Eligible SIC Codes: Wholesale and Retail 5012 Automobiles and other Motor Vehicles 5013 Motor Vehicle Supplies and New Parts 5014 Tires and
 RAMHIC Eligible SIC Codes: Wholesale and Retail 5012 Automobiles and other Motor Vehicles 5013 Motor Vehicle Supplies and New Parts 5014 Tires and Tubes 5015 Motor Vehicle Parts, Used 5021 Furniture 5023
SECOND FLOOR STUDIO AVAILABLE ON VENTURA BLVD
 SECOND FLOOR STUDIO AVAILABLE ON VENTURA BLVD Located at 13563 1/2 Ventura Blvd, Sherman Oaks, CA 91423 DEMOS 1 mile 3 mile 5 mile Population 24,151 187,734 519,845 Avg. HH Income $121,056 $109,474 $101,327
Real Estate/Economic Considerations
 Real Estate/Economic Considerations Why a Market Study? Understand demographic trends & real estate market conditions Translate growth forecasts into New housing Workplace uses Hotel/lodging Retail & supporting
the GARRISON at Stafford
 the GARRISON at Stafford 425 GARRISONVILLE ROAD STAFFORD, VA 22556 STAFFORD COUNTY VA FOR LEASING INFORMATION PLEASE CONTACT: Dallon L. Cheney 703-268-2703 dcheney@klnb.com DEVELOPED BY: Melissa Welch
5245 South Durango Drive Las Vegas, Nevada
 Revised 01.17.17 Charles Creigh 702.221.2500 ext. 305 ccreigh@newmarketadvisors.com Bob Touma 702.221.2500 ext. 318 Cell/Text 702.371.3467 btouma@newmarketadvisors.com FEATURES Deer Springs Town Center
Legendary COMMERCIAL REAL ESTATE
 764 ive, San Bernardino, CA 92408 Retail Availability & Lease Rates: > ±1,782 Sq. Ft. to ±16,790 Sq. Ft. of High Density Retail Space Available > Anchor Space Rate: $1.25 PSF Mo +.25 NNN s > Shop Space
5245 South Durango Drive Las Vegas, Nevada newmarketadvisors.com
 Revised 11.9.18 Charles Creigh 702.221.2500 ext. 305 ccreigh@newmarketadvisors.com Bob Touma 702.221.2500 ext. 318 Cell/Text 702.371.3467 btouma@newmarketadvisors.com Features Deer Springs Town Center
Retail Availability. 1-Mile 3-Mile 5-Mile 23, , ,400 $74,386 $66,319 $63,873. Legendary COMMERCIAL REAL ESTATE
 Retail Availability Retail Availability Retail Availability & Lease Rates: > ±800 SF to ± 4,920 SF In-Line Stores - $2.75 PSF + 0.45 NNN Charges > ±24,980 SF - Anchor Space - Leased to 99 ONLY Stores Join
Canadian Retail Sales Slide During Icy Winter
 Canadian Retail Sales Slide During Icy Winter Retailers struggled to bring in sales this December and finished the year on a weak note. All Stores sales increased by 2.1% and All Stores Less Automotive,
VIA CAMPO PLAZA 2809 Via Campo, Montebello, CA Super Market Anchor Space Available
 Retail Availability Freeway Visible Pylon Retail Availability & Lease Rates: Join Project & Area Tenants: > ±767 SF to ± 3,595 SF In-Line Stores - $2.75 PSF + 0.45 NNN Charges > ±24,980 SF - Anchor Space
Legendary COMMERCIAL REAL ESTATE
 RETAIL ANCHOR & IN-LINE STORES FOR LEASE ±7,000 SF to ±8,250 SF Anchor Store Available & In-Line Shops In-Line Shops - 5 Available Stores at 1,250 Sq. Ft. Each Retail Availability & Lease Rates: > Anchor
Retail Market Place Analysis Village of Monroe Comprehensive Plan. Prepared by
 Retail Market Place Analysis Village of Monroe Comprehensive Plan Prepared by January 31, 2011 Introduction It is clear from travelling around the Village that Monroe's current land use pattern is not
TATE ECONOMIC RESEARCH INC
 Appendix E Page 13 Rockhaven Plaza - Retail Market Commentary City of Peterborough Prepared for: Crombie REIT. May 25, 2015 TATE ECONOMIC RESEARCH INC Appendix E Page 14 TATE ECONOMIC RESEARCH INC. Mr.
ARTICLE XVIII C 1 CENTRAL BUSINESS DISTRICT
 ARTICLE XVIII C 1 CENTRAL BUSINESS DISTRICT SECTION 1. INTENT AND PURPOSE OF DISTRICT: The C 1 Central Business District is intended for the purpose of grouping retail merchandising activities into a concentrated
333 Troutman Street MSNYC RETAIL. myspacenyc.com
 333 Troutman Street MSNYC RETAIL myspacenyc.com 888.484.1115 About the Property This 17,000 square foot corner property boasts 170 square feet of property on Troutman and is only a block away from the
Missouri Retail Trade
 MISSOURI RETAIL TRADE ANALYSIS 2000-2007 Table of Contents Missouri Retail Trade... 1 Retail Trade Sectors...2 Retail Trade Measures... 3 Retail Trade 2000-2004... 4 Retail Trade 2004-2007... 7 Retail
Rural. by John Gruidl and Steven Kline 1. Strategies of Discount Chains
 Rural RESEARCH REPORT Published by the Illinois Institute for Rural Affairs Stipes Hall 518 Western Illinois University 1 University Circle The Impact of Large Discount Stores on Retail Sales in Illinois
6. Results for the Wholesale and Retail Trade Sectors
 6. Results for the Wholesale and Retail Trade Sectors A total of seven sectors comprise the U.S. horticultural wholesale and retail trade industries: 1) wholesale flower, nursery stock & florist supply;
AGENDA MONDAY, FEBRUARY 24, :30 P.M.
 EDC Agenda February 24, 2014 CITY OF HUGHSON ECONOMIC DEVELOPMENT COMMITTEE MEETING CITY HALL COUNCIL CHAMBERS 7018 Pine Street, Hughson, CA CALL TO ORDER: AGENDA MONDAY, FEBRUARY 24, 2014-5:30 P.M. ROLL
Chapter 1: Introduction 8. Chapter 2: About Outdoor Living Industry Sales & Growth 13
 Chapter 1: Introduction 8 Research Objectives 8 Consumer Insights on Outdoor Living Lifestyles and Purchases 8 Also Included Is Garden Retailers' Perspective on this Marketplace 9 Consumer Insights Focus
Arlington County Retail Plan
 Arlington County Retail Plan Draft April 28, 2015 EXECUTIVE SUMMARY Arlington will be a community where retail is convenient, appealing, activating and sustainable; that provides interest and authenticity,
2012 Population by Race
 Trends 2012-2017 3 Annual Rate (in percent) 2.5 2 1.5 1 0.5 Area State USA 0 Population Households Families Owner HHs Median HH Income Population by Age 22 20 18 16 Percent 14 12 10 8 6 4 2 0 0-4 5-9 10-14
Electric (208/120 v 3 phase), Natural Gas, Water & Sewer
, Natural Gas, Water & Sewer") FOR LEASE CALL FOR PRICING 2 East Patrick Street, Frederick, Maryland 21701 Exceptional Frederick Historic Location Located at the corner South Market and East Patrick Streets in Downtown Frederick, this
FOR LEASE CALL FOR PRICING 2 East Patrick Street, Frederick, Maryland 21701 Exceptional Frederick Historic Location Located at the corner South Market and East Patrick Streets in Downtown Frederick, this
DOWNTOWN PORTLAND MARKET STUDY. Austin Colson, Brian Keesey Josh Kluzak, Maria Kornakova, Ann Sojka, David Wood
 DOWNTOWN PORTLAND MARKET STUDY Austin Colson, Brian Keesey Josh Kluzak, Maria Kornakova, Ann Sojka, David Wood Michigan State University: Urban and Regional Planning, Spring 2011 Agenda 1. Project Scope
Floor Coverings Industry Distribution Channels
 TABLE OF CONTENTS U.S. FLOOR COVERINGS SPENDING TRENDS AND DISTRIBUTION CHANNEL ANALYSIS... 1 Summary Of Major Findings... 1 Installed Value Of Floor Coverings Spending... 2 Hard Surface Versus Soft Surface
Business and Marketing Practices of U.S. Green Industry
 Business and Marketing Practices of U.S. Green Industry Ariana Torres, Ph.D. Assistant Professor Marketing Specialist Purdue University torres2@purdue.edu January 17, 2018 Business Category Type of Business
SOUTH DADE PLAZA N. Dixie Highway Cutler Bay, FL
 18591 N. Dixie Highway Cutler Bay, FL SUMMARY Description South Dade Plaza is a fully renovated 30,270 square foot outparcel. Staples, currently occupies two-thirds of the building. The space available
Locations in Chinese Retail Industry
 David F. Miller Center For Retailing Education and Research International Retailing Education and Training (IRET ) Locations in Chinese Retail Industry David F. Miller Center For Retailing Education and
Appendix D: Background Data and Definition of Terms
 Appendix D: Background Data and Definition of Terms Gross Leasable Area (GLA) Gross leasable area (GLA) is the total retail floor area designed for tenant occupancy and exclusive use, including basements,
FOR LEASE. Downtown Frederick Retail/Office Space for Lease. Property Details PRESENTING
 FOR LEASE $3,500/SF (Modified Gross Lease) 630 North Market Street, 1 st Floor, Frederick, Maryland 21701 PRESENTING Location: 630 North Market Street, 1 st Floor, Frederick, MD 21701 Downtown Frederick
ELLIS COUNTY Kansas. Community Retail Analysis
 ELLIS COUNTY Kansas Community Retail Analysis February 2010 Updated from October 2008 Study Prepared by ROIC analytics, LLC for Ellis County Coalition for Economic Development Introduction In February
CITY OF SURREY BY-LAW NO. 2076
 CITY OF SURREY BY-LAW NO. 2076 A By-law to exempt certain defined classes of shops in the City from the Shop Closing Provisions of the "Municipal Act"....................................................
Mercantile Classifications
 Mercantile s Refer to the following table for a list of eligible Mercantile s. If the risk does not match one of the descriptions from the classification table but is similar to one of the classifications,
and Establishments Report
 TOTAL Population (2012) 441,874 Sex (2012) Male 215,584 48.79 Female 226,290 51.21 Age Distribution (2012) 0 4 22,026 4.98 5 9 23,005 5.21 10 19 54,427 12.32 20 29 56,542 12.8 30 39 49,124 11.12 40 49
Business-Facts Summary - Workplace Business and Employment
 - Workplace Business and Employment Title Page Title Page Data Version: 2018 Feb (Internal) Report Generation Method: Single Analysis Area: 1789 STATE ST, SAN DIEGO, CA, 92101-2530 Reporting Detail: As
The Economic Value of Protected Open Space in Southeastern Pennsylvania
 The Economic Value of Protected Open Space in Southeastern Pennsylvania SUMMARY REPORT Looking at the landscape. 200,000+ Acres Protected in Southeastern Pennsylvania. 30% Privately Owned or Eased Lands
SECOND QUARTER 2018 CHARLOTTE-MECKLENBURG GROWTH REPORT
 SECOND QUARTER HIGHLIGHTS SECOND QUARTER 2018 CHARLOTTE-MECKLENBURG GROWTH REPORT Manufacturing, Professional Services Investments Lead Strong Second Quarter CLT ranked No. 2 Best Airport for Business
FOR LEASE. Ideal Downtown Frederick Location for Retail, Restaurant or Fitness PRESENTING
 FOR LEASE CALL FOR PRICING 125 East All Saints Street, Frederick, Maryland 21701 Ideal Downtown Frederick Location for Retail, Restaurant or Fitness Here is where the downtown action is today and will
Antique shops. Aquariums. Art goods and bric-a-brac shops. Artists' studios. Auditoriums. Automobile hire.
 Sec. 62-1482. - General retail commercial, BU-1. The BU-1 general retail commercial zoning classification encompasses land devoted to general retail shopping, offices and personal services to serve the
Midtown Greenway PROJECT REPORT CARD
 Midtown Greenway PROJECT REPORT CARD Project Overview and History The Midtown Greenway is a 5.5-mile multi-use trail that connects the Mississippi River to the Minneapolis Chain of Lakes. The corridor,
124 Rivington Street MSNYC RETAIL myspacenyc.com
 124 Rivington Street MSNYC RETAIL 888.484.1115 myspacenyc.com ABOUT THE PROPERTY 124 Rivington Street Rental Rate: Building Size: Space Available: Year Built: Property Type: Property Sub-type: Additional
Retail Gap Analysis Final Report
 Retail Gap Analysis Final Report Prepared for: Town of Sylvan Lake Prepared by: MXD Development Strategists, Ltd. June, 2015 0 TABLE OF CONTENTS 1.0 LOCATION & DEMOGRAPHIC ANALYSIS 3 2.0 CURRENT RETAIL
Brevard, North Carolina: Retail Market Analysis Findings. Tee Coker & Kristen Wyche October 30, 2013
 Brevard, North Carolina: Retail Market Analysis Findings Tee Coker & Kristen Wyche October 30, 2013 Today s Presentation What We Heard Market Data Zip Code Survey Market Defini:on Demographics Retail Leakage
Appendix F PENNSYLVANIA LOCAL PARKS AND THE COMMUNITIES THEY SERVE
 Appendix F PENNSYLVANIA LOCAL PARKS AND THE COMMUNITIES THEY SERVE August 8, 2014 By The Center for Rural Pennsylvania Profile Data Profiles and Analysis Introduction To assist in the development of the
Treasure Coast Regional Planning Council
 Treasure Coast Regional Planning Council Began these Services in 1989 Lead 93 Public Charrettes Regionally & Statewide Assisted with 23 Other Public Charrettes Services Include: Citizen-Based Planning
Planning and Operational Applications of TRANSIMS
 Planning and Operational Applications of TRANSIMS Brian Wolshon, Ph.D., P.E. Louisiana State University Gulf Coast Center for Evacuation and Transportation Resiliency 2011 DOTD Congestion Management Seminar
U.S. Fire Department Profile 2015
 U.S. Fire Department Profile 2015 April 2017 Hylton J.G. Haynes Gary P. Stein April 2017 National Fire Protection Association Abstract NFPA estimates there were approximately 1,160,450 firefighters in
1. EXPLORE A CAREER PLAN IN DESIGN AND MERCHANDISING
 21 st Century Learning Interior Design and Merchandising High School Interior Design and Merchandising is an elective that focuses on creating beauty, comfort and convenience in rooms and homes. The principles
Estimating the Level of Free Riders in the Refrigerator Buy-Back Program
 Estimating the Level of Free Riders in the Refrigerator Buy-Back Program Diane M. Fielding, B.C. Hydro An impact evaluation, conducted in 1993 on B.C. Hydro s Refrigerator Buy-Back Program, employed an
Flow Research, Inc. (781) Water Street (781) (fax) Dear Marketing Manager:
 Water Street (781) (fax) Dear Marketing Manager:") Flow Research, Inc. (781) 245-3200 27 Water Street (781) 224-7552 (fax) Wakefield, MA 01880 www.flowresearch.com Dear Marketing Manager: I am very pleased to let you know about our new study, The Market
Flow Research, Inc. (781) 245-3200 27 Water Street (781) 224-7552 (fax) Wakefield, MA 01880 www.flowresearch.com Dear Marketing Manager: I am very pleased to let you know about our new study, The Market
Retail Ireland Monitor
 Issue 1 February 2015 Retail Ireland Monitor Christmas trading boosts retail s recovery The CSO s retail sales statistics for the all-important month of December returned positive, albeit modest, growth,
Annual Wellness Visit prepaid card: Merchant categories
 Annual Wellness Visit prepaid card: Merchant categories You can use your prepaid card for healthy foods, activities, and services, such as: Book stores Grocery stores Bowling Restaurants Community education
Wal-Mart, Magazine Street, and Retail Competition
 University of New Orleans ScholarWorks@UNO University of New Orleans Theses and Dissertations Dissertations and Theses 12-19-2003 Wal-Mart, Magazine Street, and Retail Competition Richard Moore University
Price Elasticity Number Name Type. Income Elasticity. Income Elasticity
 Consumption Categories for Policy Insight v9.5 Consumption Categories for PI + v Number Name Type Income Price Number Name Type Income Price parts Necessities 0.46-0. New autos Luxuries.4 -. Net purchases
The Remodeling Market
 The Remodeling Market Kermit Baker Remodeling Futures Program International Builders Show January 21, 2010 www.jchs.harvard.edu Remodeling Market Issues 1. Where do we stand in the remodeling cycle at
Clemson University Public Service Activities
 Contributions of the Ornamental Horticulture and Turfgrass Industries to the State Economy: South Carolina, 1994 Prepared by P. James Rathwell Professor and Extension Agricultural Economist Mark S. Henry
DRAFT Land Use Chapter
 Stevens Creek Urban Village DRAFT 1 18 17 Land Use Chapter INTRODUCTION This Land Use Chapter describes how the Stevens Creek Urban Village will accommodate the growth that is planned for it in the Envision
WEST LAKE DRIVE PLAN. City of Detroit Lakes, Minnesota DRAFT - March 28, 2018
 WEST LAKE DRIVE PLAN City of Detroit Lakes, Minnesota DRAFT - March 28, 2018 ACKNOWLEDGMENTS MAYOR Matt Brenk CITY OF DETROIT LAKES Kelcey Klemm, City Administrator Larry Remmen, Community Development
Appendix A: Retail Planning Assessment
 Rotherham Town Centre Masterplan Appendix A: Retail Planning Assessment 139 Appendix A Rotherham Town Centre Masterplan Retail Planning Background and Policy Context 1. Introduction 1.1 The Masterplan
LAND USE OVERVIEW WHAT YOU WILL FIND IN THIS CHAPTER
 LAND USE WHAT YOU WILL FIND IN THIS CHAPTER Information about the City s expected population and employment growth. Description and capacity of existing and future land use designations. Policies that
Realities and Assets in an In-Town Shopping Center
 SUSTAIN SOUTHERN MAINE MILL CREEK PILOT LESSONS LEARNED April 15, 2013 Realities and Assets in an In-Town Shopping Center 1. An older shopping district that was laid out in a low-density, strip center
O'REILLY AUTO PARTS. Investment Property Offering $1,220,000. West Spring St. & Swanson Dr., Monroe, GA Offering Highlights
 Investment Property Offering $1,220,000 O'REILLY AUTO PARTS West Spring St. & Swanson Dr., Monroe, GA 30655 Presented By: Cindy Langman 322 Washington Street, Suite 101 Gainesville, GA 30501 (770)531-9992
Buying Products for Home Building & Remodeling: Who and Where. By Paul Emrath, Ph.D. Economics and Housing Policy
 Buying Products for Home Building & Remodeling: Who and Where Special Studies,, 2012 By Paul Emrath, Ph.D. Economics and Housing Policy In the course of their business, home builders and remodelers buy
APN#: Lot Size: ±5,625 SF. Vacant corner lot. Current Height Limit: 70 FT. Current Zoning: CB - Central Business District
 900 MacDonald Avenue Richmond, CA 900 MacDonald Avenue Richmond Berkeley Features APN#: 538-260-001-2 Lot Size: ±5,625 SF Vacant corner lot Current Height Limit: 70 FT Current Zoning: CB - Central Business
Port Lavaca Future Land Use
 Port Lavaca Future Land Use Introduction The City of Port Lavaca is beginning to see sustained growth, after many years of relative stable population. New single family homes, apartments, and businesses
Spotlight on Upholstery
 SPECIAL SUPPLEMENT TO FURNITURE TODAY APRIL 8, 2013 CONSUMER VIEWS Spotlight on Upholstery PRESENTATION SPONSORED BY 2 FURNITURE TODAY APRIL 8, 2013 Stain-resistant fabric is top priority for buyers Americans
Committee Meeting: Downtown Today & Concept Refinement September 11, 2017
 Committee Meeting: Downtown Today & Concept Refinement September 11, 2017 AGENDA 1. Brief Input Update 2. Comprehensive Plan Principles 3. Downtown Today 4. Concept Updates 5. Future Schedule What is a
Michigan City Alternative Analysis Realignment Study. Progress Status Update Report Presentation to City Council February 1, 2012
 Michigan City Alternative Analysis Realignment Study Progress Status Update Report Presentation to City Council Project Web Site Project Web Site is Active www. emichigancity.com Click on NICTD logo at