Amtrak Station Area Planning and Land Use Analysis
|
|
|
- Colin Hunter
- 5 years ago
- Views:
Transcription

1 Virginia Department of Rail & Public Transportation Amtrak Station Area Planning and Land Use Analysis CARMEL CHURCH STATION CAROLINE COUNTY August 2008
2 Table of Contents 0.0 EXECUTIVE SUMMARY Background Land Use Plan Market and Economic Impacts Implementation: Funding and Financing Implementation: Infrastructure and Environment PROJECT OVERVIEW DESCRIPTION OF STATION AND STATION AREA Station function proposed service and relationship to other stations General overview of the study area at station location Overarching themes for station area plan LAND USE Background / Existing Character Planning Context Site Potential and Proposed Land Use Site Constraints MARKET CONDITIONS Office Retail Residential Summary Economic Impact Earnings, employment and output effects from capital expenditures Capital expenditures Construction impacts Potential Local Funding Mechanism Tax Increment Financing General Assessment of the TIF Mechanism in Virginia SUPPORTING TRANSPORTATION ANALYSIS Roadway Network Traffic Impacts Under Build Condition Transit Network Pedestrian Accessibility Bicycle Accessibility Summary of Recommended Infrastructure Improvements...37 Technical Memorandum: Carmel Church Station i
3 8.0 SUPPORTING ENVIRONMENTAL CONSIDERATIONS Forested Areas Water Resources Historic Sites Hazardous Materials Protected Species...41 List of Tables Table 4-1: Office Construction Value and Tax Revenue Caroline County...19 Table 4-2: Office Construction Value and Tax Revenue Carmel Church Station Area...20 Table 4-3: Retail Construction Value and Tax Revenues Caroline County...21 Table 4-4: Retail Construction Value and Tax Revenues Carmel Church Station Area...22 Table 4-5: Housing Demand, Construction Value and Tax Revenue Caroline County...23 Table 4-6: Housing Demand, Construction Value and Tax Revenue Carmel Church Station Area...24 Table 5-1: Projected Construction Impacts by Property Type at Carmel Church Station...27 Table 6-1: Carmel Church Station TIF Summary...29 Table 6-2: Incremental Property Tax Revenues for Carmel Church Station...30 Table 7-1: Derivation of Traffic Growth Factors...32 Table 7-2: Ridership Projections for Caroline County Station...33 Table 7-3: Estimated Intersection Level of Service...35 Table 7-4: Estimated Costs of Infrastructure Improvements...37 Table 8-1: Caroline County Protected Species...41 List of Figures Figure 1-1: Project Station Locations...6 Figure 2-1: Carmel Church Station Area...8 Figure 3-1: Carmel Church Station Proposed Land Use-Concept Plan...14 Figure 3-2: Carmel Church Station Illustrative Plan...15 Figure 3-3: Example Photographs...16 Figure 3-4: Thoroughfare and Alley Sketches...17 Figure 7-1: Concept for Growth in Traffic Volumes...33 Figure 7-2: Proposed Street Infrastructure Improvements...34 Technical Memorandum: Carmel Church Station ii
4 0.0 EXECUTIVE SUMMARY 0.1 Background Caroline is a small rural county with a progressive approach to planned growth. The county is located strategically along I-95 between Fredericksburg and Richmond, yet it has experienced little of the sprawling development that dominates the I-95 corridor in neighboring counties. According to the 2004 Comprehensive Plan, Caroline recognizes that growth is inevitable, but will only accept development that benefits, rather than burdens, future generations. Carmel Church, one of several subareas within the county, has absorbed about half of the county s growth since It was first identified as a primary growth center in the county s 1977 Comprehensive Plan and has retained this designation through subsequent comprehensive planning efforts. Currently, Carmel Church is the location for a county-led transit oriented development (TOD) planning initiative. The proposed TOD location is 27 miles south of Fredericksburg Station and 11 miles north of the Ashland Station on the existing CSX rail line. 0.2 Land Use Plan The proposed land use concept for the station area builds on the general land use approach established in the TOD Study Bubble Plan prepared by Caroline County. While it follows the general concept of the Bubble Plan to the west of the CSX railroad, it expands upon and modifies some aspects of the Bubble Plan. In the vicinity of the station on both sides of the railroad, the proposed concept recommends higher mixed-use densities in the long term, in order to maximize the potential of the transit station. It also diverges from the Bubble Plan in the addition of recreation uses and a potential school site to the east of the rail line, the removal of roundabouts from mixed-use areas on the west side of the railroad to improve pedestrian circulation, and the addition of new roundabouts in the northern portion of the study area. Key elements of the proposed plan include: Creation of two medium-scale, retail mixed-use neighborhood centers on the site, surrounding by medium to low scale residential development. Long-term high density development adjacent to I-95. Creation of a River Walk as a central feature of the TOD. Inclusion of a potential school site and several large recreation facilities. Big box retail at the northern end of the site. Minimum 100 buffers between Route 1 and the TOD, in order to maintain the road s rural character. Similar buffers between the TOD and Rogers Clark Boulevard and I- 95. Preservation of the environmentally sensitive and historically significant land at the southern end of the site. Constraints to development include significant environmental constraints in the form of wetlands and Chesapeake Bay Resource Protection Areas. Other development challenges include protection of an important Civil War battlefield site on southern portion of the site and Technical Memorandum: Carmel Church Station 1
5 the need to maintain the rural character of Route 1 as it passes through the study area. In addition, development on both sides of the railroad will require significant investment in bridge construction to enable access to the eastern portion of the study area. To implement this land use plan the County will need to change its zoning (the maximum density currently allowed is 10 to 15 dwelling units per acre). County staff have expressed an interest in developing a Transit-Oriented Development zone that incorporates form-based codes. These zoning changes, like the proposed land use plans, will require public review. The County has committed funds for the next round of studies needed for plan implementation and has applied for additional funding. 0.3 Market and Economic Impacts The proposed land use plan would have the following estimated market impacts: The site plan for the Carmel Church Station indicates build-out of 636,500 square feet of office space, which is about double the total projected for Caroline County. While this could be viewed as somewhat aggressive, it may be supported by attracting commercial tenants that rely on travel to the Washington DC and/or Richmond areas, which would be easily accommodated by the enhanced Amtrak service. The site plan for the Carmel Church Station indicates build-out of 636,500 square feet of retail space, which is about 130 percent of the total projected for Caroline County. According to the County Business Patterns for 2005, there were 67 establishments in Caroline County engaged in retail trade, 39 of which had 1 to 4 employees. This implies that 58 percent of retail consists of extremely small operations. This causes County shoppers to travel to Fredericksburg and Richmond for a variety of shopping needs. The retail build-out associated with the Carmel Church site plan may reflect the reality of bringing more and varied shopping opportunities to a vastly underserved market. The site plan for the Carmel Church Station area indicates build-out of 2,935 residential units totaling 3,249,500 square feet which is about 67 percent of the total projected for Caroline County. This appears to be a reasonable share for an area that is a designated growth area emphasizing TOD that will greatly exceed current densities in the County. For all classes of development, construction value is estimated to generate about $78 million in property taxes from 2013 through 2030 at the Carmel Church Station Area. This is about 70 percent of the property taxes projected for Caroline County from new development over the same time period. An economic impact analysis was conducted as part of the station planning exercise to project potential effects of construction expenditures at the sites around the proposed Carmel Church Station on the regional economy in terms of increased employment and related economic effects. The analysis concluded that station area construction on the scale proposed in the land use plan would create an average of over 500 jobs per year during the 18-year assumed period of construction between 2013 and Technical Memorandum: Carmel Church Station 2
6 0.4 Implementation: Funding and Financing A critical step in the implementation of any new station or station improvements is funding the local share of station construction costs. Planners are evaluating two major mechanisms that are being used in several U.S. cities to finance localized transportation improvements Tax Increment Financing (TIF) and Transportation Improvement Districts (TID). Tax increment financing (TIF) is widely used in Virginia and across the United States as a method for financing current investments (including public infrastructure such as rail stations) by capturing and dedicating expected future gains in property tax revenues in the area around the investment and using those gains to pay back the investment s initial cost. Tax assessment districts are also widely used in the United States as a way to ensure that businesses and residents who will benefit from a public investment also share in its costs. In the context of intercity rail stations, such a district might more specifically be called a transportation improvement district (TID). The TID would involve designation of a welldefined geographic area around the station in which an additional property tax assessment would be levied on property owners, and the revenues from that tax would then be dedicated to repaying the station costs. In weighing the decision to pursue TIF or TID funding mechanisms, jurisdictions must evaluate not only the overall economic feasibility, but also the likelihood of successful implementation, and each approach has its pros and cons. TIF districts are currently in use in various locations across Virginia and are generally much easier to implement under existing legislation. However, the ease of creation is balanced by the significant uncertainty associated with the future revenue stream. The locality must consistently work with developers to ensure that the projected development actually occurs, and the development and resulting tax revenue may take a significant amount of time to come online. A TID, by contrast, can be quite difficult to set up under Virginia statute. Only Counties (not Cities) with population over 500,000 currently have the authority to pursue TIDs. Cities and smaller Counties wanting to pursue a TID will need legislative action by the General Assembly in order to be granted that authority. Moreover, even with that authority and with a popular planned investment, it can be very difficult to convince a majority of the property owners within the proposed district to agree to the extra assessment. However, once a TID is in place, it has the significant advantage of producing a sizable stream of revenue immediately upon its adoption. 0.5 Implementation: Infrastructure and Environment Other critical implementation steps include coordination of local infrastructure improvements (particularly transit service improvements and street grid upgrades) with station enhancements and land development/redevelopment projects. Unless the groundwork for development is clearly in place, investment in the station site will not occur at the desired scale or pace. This groundwork also includes proper documentation and mitigation of environmental issues associated with the site and its surroundings. Development of the scales and densities proposed around the Caroline County station will require an array of different transit services to complement increased intercity train service. This transit network would be centered on the proposed high density areas near the rail station and would provide frequent service to the station area from the town of Carmel Church and outlying portions of the planned development. The proposed new road infrastructure will consist of approximately 110,000 linear feet of new roads and streets. Of these new roads, 21,000 linear feet are assumed to be four-lane Technical Memorandum: Carmel Church Station 3
7 arterials, while the remainder would be smaller two-lane collectors. Pedestrian accessibility is promoted through a small block size design, and all roads and streets will have bike lanes and sidewalks. To increase accessibility within the site and to outside development, two motor vehicle bridges and one bridge exclusively for pedestrians will be constructed over the CSX rail line. An additional bridge for vehicular traffic will be constructed over I-95. To improve traffic control, four new signalized intersections will be created on Jefferson Davis Highway and Roger Clark Boulevard. Areas of potential environmental concern identified for this station area include forested areas, water resources, historic resources, and hazardous materials. Technical Memorandum: Carmel Church Station 4
8 1.0 PROJECT OVERVIEW This memo is one in a series of in depth station planning and land use analyses conducted by the Department of Rail and Public Transportation (DRPT). DRPT chose to undertake this project for the following reasons: Several recent high-profile reports and articles have called attention to the connection between recent land use trends and mounting economic, environmental, health, and social costs. In June the New York Times reported that even as home prices decline in outlying suburbs, some urban areas such as Washington D.C. have, instead seen an increase in property values. Americans are no longer able to justify auto dependent lifestyles given doubling fuel prices. The connection between land use and transportation is once again becoming intuitive beginning to shape daily decisions in a society where low fuel costs have been the norm for decades. Over the long term, this new calculus for deciding the where to live and where to do business will exert a stronger and stronger influence on land development patterns. With increasing rail service along the major metropolitan corridors in Virginia, it will become more and more possible for families and businesses to make location choices that minimize financial, environmental, and social costs. The stations will serve a variety of purposes, from daily commutes to occasional recreational trips. Over time, the station areas will become nodes of residential and economic activity. Market assessment can help predict the scale of potential development and the mix of appropriate land uses. It also helps decision makers to understand the level of focus that they will need to put toward these areas in order to channel development that would normally happen in other parts of their jurisdictions. Redevelopment of station areas over time can be planned to take advantage of economies of scale and the natural convergence of activities (density) at station areas. Urban design and planning shapes walkable town centers that are attractive to new residents, businesses, and travelers. These new developments must be wellserved by transit. In addition to the intercity and commuter rail transit that provide the focus for development, there must be a significant investment in local and regional transit that support and complement the rail service. The task of organizing new centers of development and financing major transit investments presents challenges for any jurisdiction. Jurisdictions that pursue these changes will need to develop an overarching strategy and follow aggressive timelines as they implement portions of the strategy. For example, zoning ordinances and plan review protocols will in many cases need to be adjusted substantially to achieve the desired land use densities and mix of uses. Technical Memorandum: Carmel Church Station 5


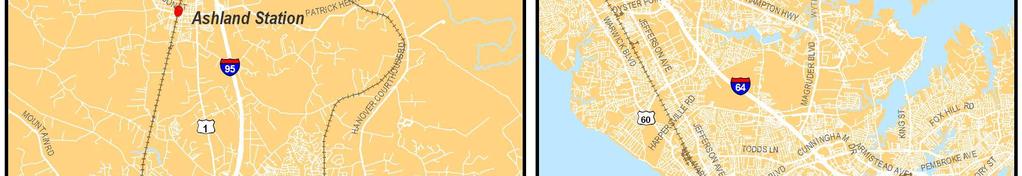
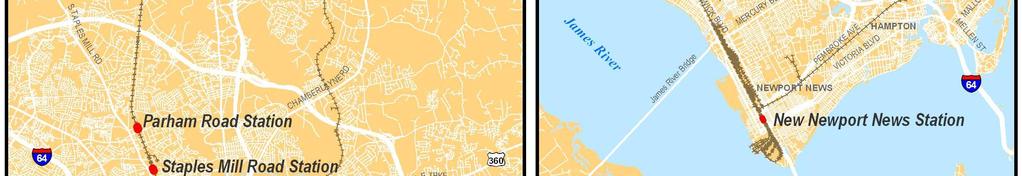
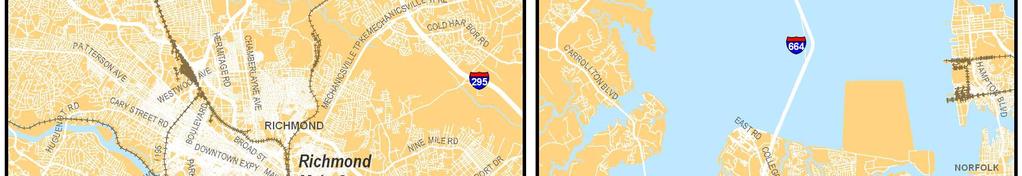
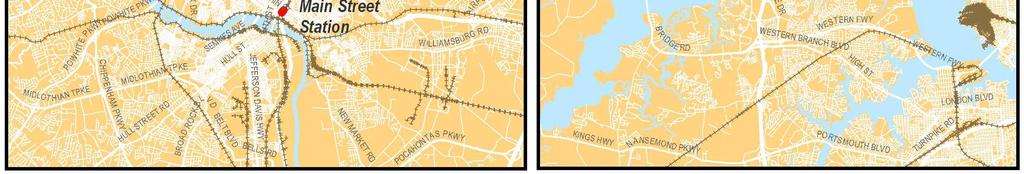
9 Figure 1-1: Project Station Locations Technical Memorandum: Carmel Church Station 6
10 2.0 DESCRIPTION OF STATION AND STATION AREA 2.1 Station function proposed service and relationship to other stations Caroline is a largely rural county located between Fredericksburg and Richmond. Interstate 95 extends through western Caroline, yet it has experienced little of the sprawling development that dominates the I-95 corridor in neighboring counties. This is, in part, due to forward thinking leadership and careful planning within the community. According to the 2004 Comprehensive Plan, Caroline recognizes that growth is inevitable, but will only accept development that benefits, rather than burdens, future generation. In 2000 the county population was 22,121. Since that time county population has grown at approximately 3% per year. Carmel Church, one of several subareas within the county, has absorbed about half of the county s growth since It was first identified as a primary growth center in the county s 1977 Comprehensive Plan and has retained this designation through subsequent comprehensive planning efforts. Currently, Carmel Church is the location for a county-led TOD planning initiative. The proposed TOD location is 27 miles south of Fredericksburg Station and 11 miles north of the Ashland Station on the existing CSX rail line. Figure 2-1 shows the proposed Carmel Church station location. 2.2 General overview of the study area at station location The proposed station location is a greenfield site bound by Route 1 to the west and I-95 to the east. The CSX rail line runs through the center of this site and has the dimensions to accommodate a 1200 foot platform. There are sensitive environmental features, such as wetlands and creeks, at the center of the site. The initial county TOD plans, however, demonstrate that these features can be protected and incorporated into a future dense development in this area. There is no existing development within a quarter mile of the station. There is a limited amount of residential single-family development within a half mile of the station. 2.3 Overarching themes for station area plan The station area plan provides additional detail and a few modifications to the Carmel Church Bubble Plan recently proposed for this location. It recommends establishment of two medium-scale, mixed-use centers, and a big box retail center. The plan emphasizes pedestrian scale development and clear circulation patterns throughout the site. Key elements of the plan include: Creation of two medium-scale, retail mixed-use neighborhood centers on the site, surrounding by medium to low scale residential development. Long-term high density development adjacent to I-95. Creation of a River Walk as a central feature of the TOD. Inclusion of a potential school site and several large recreation facilities. Big box retail at the northern end of the site. Minimum 100 buffers between Route 1 and the TOD, in order to maintain the road s rural character. Similar buffers between the TOD and Rogers Clark Boulevard and I- 95. Technical Memorandum: Carmel Church Station 7


11 Preservation of the environmentally sensitive and historically significant land at the southern end of the site. Phasing recommendations for implementation of the plan. Figure 2-1: Carmel Church Station Area Technical Memorandum: Carmel Church Station 8
12 3.0 LAND USE 3.1 Background / Existing Character Immediate Vicinity of Station The proposed station site is mostly undeveloped. What development exists near the site consists of scattered single-family residences east of Route 1 and south of Opal Lane. Surrounding Area Much of the area between Route 1 and Interstate 95 is currently undeveloped. Along Route 1, land uses are primarily residential, except for areas of industrial uses on Route 1 north of Opal Lane and further south opposite the intersection with Beverly Circle. 3.2 Planning Context Zoning Zoning on the site is primarily residential and industrial. Two large parcels fronting Route 1 and much of the land east of the CSX railroad are zoned M-1 (Industrial). The remaining parcels along Route 1 are zoned residential. The only commercial / business (B-1) zoning is located north of the site along Jericho Road and Rogers Clark Boulevard. Plans and Policies 1. Carmel Church Community Plan (January 2007) The Carmel Church Community Plan serves as part of the Caroline County Comprehensive Plan and provides a vision for future development in the Carmel Church community, which includes the study area. The plan recommends the development of a Village Core, or town center, in the Carmel Church community while preserving the surrounding rural landscape and quality of life. In the Village Core, located between Route 1 and Interstate 95, the plan envisions higher density development (10-15 units per acre) with a diversity of uses and a transit station at its center and gradually decreasing densities further away from the center. As envisioned, the Village Core also includes public facilities, such as a library, recreational areas and a usable public space at its center. Along Route 1, the plan anticipates residential and mixed-use development interspersed with two areas of industrial uses. 2. Caroline TOD Study: Bubble Plan This plan builds on the vision for a town center in Carmel Church that was first articulated in the Carmel Church Community Plan. The plan provides a general concept to allow for testing and advancement of development and transportation concepts for the site. It provides a representation of the scale and general arrangement of land use that is proposed for the site, including the central TOD site focused on a rail station and the surrounding parcels. The plan envisions the development of a town center on both the east and west sides of the railroad tracks and proposed station. On the east side, vertically integrated mixed-use development surrounds a town green adjacent to the proposed station. Multi-family residential uses are located to the north and south of the proposed mixed-use development, along with additional parking and a park at the northern end of the central site. On the west side, vertically-integrated mixed-use development surrounds a town green adjacent to the station with multi-family residential located to the west of these uses and parking located to the north adjacent to the railroad tracks. Technical Memorandum: Carmel Church Station 9
13 Outside the town center area, the plan envisions single-family residential to the east, between the town center and Route 1, and office/retail uses further north along Route 1 To the south of the town center, the plan includes areas of open space and a park/conservation area as well as a cultural amenity associated with a Civil War battlefield site. Development assumptions for the plan include estimates for low and high ranges of development. Low-range assumptions for the TOD central site include 399,600 square feet of office space, 220,000 square feet of retail and 1,500 multi-family residential units. Lowrange assumptions for the northern site include an additional 199,800 square feet of office space and 220,00 square feet of retail. High-range assumptions for the TOD central site include 549,450 square feet of office space, 320,00 square feet of retail and multifamily residential units. High-range assumptions for the northern site include 274,725 square feet of office space and 320,000 square feet of retail. Moreover, the plan recommends a total of 1,500 single-family residential along Route 1 (no low or high range assumptions provided for these uses). Procedures for Updating and Amending Zoning and Plans The County will need to change its zoning, since the maximum density currently allowed is dwelling units per acre. County staff have expressed an interest in developing a Transit-Oriented Development zone that incorporates form-based coding. Furthermore, since the Bubble Plan has not yet been reviewed by the public, the County will need to bring the public into the process at some point in the future. In addition, the County is looking to conduct additional studies to assess issues such as access from I-95 and needed infrastructure upgrades (particularly water and sewer). The County has already committed $500,000 for the next round of studies needed for plan implementation and has applied for additional funding. 3.3 Site Potential and Proposed Land Use The main goals of the proposed land use concept include: Maintaining the rural character of major roadways and entrances to the county Preserving as much of the North Anna River Civil War battlefield area as possible In early phases, establishing medium-scale village character and some higher-density mixed-use in those areas to the west of CSX rail line. In the long-term, most of the higher-scale mixed use occurs in the neighborhoods to the east of the CSX rail line Ensuring that the proposed big-box retail area is thoroughly buffered and segregated from Route 1 and Jericho Road Establishing undisturbed, 100-foot vegetative buffers between I-95 and the mixed-use area, along Route 1, and along Jericho Road / Rogers Clark Boulevard. The proposed land use concept, shown in Figures 3-1 and 3-2, builds on the general land use approach established in the TOD Study Bubble Plan. While it follows the general concept of the Bubble Plan to the west of the CSX railroad and maintains its approach to entrance locations in this area, it expands upon and modifies some aspects of the Bubble Plan in some respects. In the vicinity of the station on both sides of the railroad, the proposed concept recommends higher mixed-use densities in the long term, in order to maximize the potential of the transit station. It also diverges from the Bubble Plan in the addition of recreation uses and a potential school site to the east of the rail line, the removal of Technical Memorandum: Carmel Church Station 10
14 roundabouts from mixed-use areas on the west side of the railroad to improve pedestrian circulation, and the addition of new roundabouts in the northern portion of the study area. To preserve the visual character of Route 1, the proposed concept recommends a 100-foot vegetated buffer from the area north of Jericho Road to the North Anna River and along Jericho Road and Rogers Clark Boulevard at the northern edge of the study area. Examples of the concepts in this section are exhibited in Figure 3-3. The concept features high- and medium-scale mixed-use development in the vicinity of the proposed station, surrounded by low-scale mixed-use development and long-term, higherdensity mixed-use development located near I-95. Areas of small-lot, single-family detached and medium-density residential uses surround the mixed-use core. Mixed-use development is organized as two mixed-use neighborhoods with retail mixed-use cores. The first of these neighborhoods, located to the west of the rail line and closest to the Amtrak station, contains mixed-use at a variety of densities, with high-density development clustered closest to the train station and around a town green and lower densities to the north and west. Densities diminish in the areas closer to Route 1, where medium-scale residential surrounds a town park that serves as an entrance to the town center and a transition from the rural character along Route 1. Development transitions to single-family residential neighborhoods further north and south of the mixed-use core. The second mixed-use neighborhood contains higher-density, mixed-use development that is focused on a destination greenway lined with themed restaurants and retail. This destination area is surrounded by high-density residential uses and medium-density mixeduse development. Further north, a single-family residential neighborhood separates the mixed-use core from another mixed-use center oriented around a proposed school site and a large recreation area. Parking in all mixed-use area is envisioned as structured parking. However, structured parking may be phased in over time from surface parking as new development occurs. The retail area located in the northern portion of the study area incorporates all undeveloped parcels between the town center and Rogers Clark Boulevard. This area is envisioned as a potential location for big box types of retail uses. The concept calls for one major throughaccess route in this area, an extension of Welcome Way Drive that connects to the mixeduse area to the south. Traffic circles are recommended in the retail area to help accommodate higher traffic flows. An undisturbed, 150-foot buffer separates the retail area from I-95. The concept recommends that no additional access points should be added to either Route 1 or Rogers Clark Boulevard. A battlefield preservation and interpretative area is recommended for the area south of Gravel Hill Road. Some residential estate uses (2-acre minimum) are proposed along the northern edge of the battlefield as a low-impact use for some of the outer battlefield areas. A battlefield drive is planned for those areas on both sides of the railroad, with access only from inside of the proposed development and a loop road that curves back to the main road. Three bridges provide access to the mixed-use areas to the east of the rail station and the CSX railroad. In the long term, a fourth bridge will cross both the proposed outer ring road and I-95. A separate pedestrian bridge also connects the station to the River Walk area and eastern portion of the town center. The concept includes guiding assumptions for access to future development. In the initial phases of development, Route 1 is envisioned as the major access point to the development. For the later, more intense phases of mixed-use and big box retail development, an extension of the existing Welcome Way will serve as a primary access point to the Technical Memorandum: Carmel Church Station 11
15 development and will help address traffic-related impacts on Route 1 and in the vicinity of the battlefield. By utilizing a connected street grid and four entrances off of Route 1, the overall goal is to reduce street widths and keep blocks compact. Entrances from Route 1 should feel integral to the rural road network surrounding the area proposed for development. The connected road network reduces bottlenecks and enables these compact entrances. To create the traditional neighborhood design called for in the Carmel Church Community Plan, alleys (see Figures 3-4 B and C) are essential elements. All residential-only uses are accessed off of 24-foot-wide alleys for service and parking, while only the proposed residential estate development is accessed via front driveway. Moreover, all mixed-use areas with commerce at ground floor will be accessed off of 30-foot-wide alleys. Proposed build-to lines for streets are illustrated in Figure 3-4 A. The public streetscape between the build-to lines is envisioned as a key part of the community open space system and includes curbside stormwater management, except on those streets facing commerce (retail or office) ground-floor use. Public squares and greens should be appropriately sized (not too big), should appear busy and well-utilized, even in the early phases of development, and shall be contained by public streetscapes on at least two sides. The average floor area ratio for developable parcels is 3.6 (not including public spaces such as streets, open space and railroad corridors). Development Assumptions Area of Estimate: Estimate includes all areas of proposed change within the 1/4-mile distance from the Amtrak Station. Use Types o Low-Scale Mixed Use: Ground-level commerce (office or retail) required, upper floors residential or office use; 3-floor-maximum building height (3 floor height used in estimates); Surface parking provided; floor area ratio of 1.2. o Medium-Scale Mixed Use: Ground level commerce (office or retail) required; upper floors residential or office us; 5-floor-maximum building height (4 floors average used for estimate); above-grade, structured parking provided in block center; floor area ratio of 2.0. o High-Scale mixed Use: Ground-level commerce (office or retail) required; upper floors residential or office; 8-floor-maximum height (7 floors used for estimate); above-grade structured parking provided in block center; floor area ratio of 3.5. o Medium-scale residential (Townhouse or small multifamily / condominium building): 3-floor-maximum height; parking provided in unit garage on alley; floor area ratio of 1.5. Average residential/ office mix for all low-scale, medium-scale and high-scale upper floors = 20% Office, 80% Residential Residential units are calculated at average 1000 GSF per multifamily / condominium unit and 1,500 GSF per townhome. Parking strategy: A parking strategy is utilized with a maximum quantity required for dedicated parking and a minimum quantity required for shared parking for each project. Technical Memorandum: Carmel Church Station 12
16 If the developer wishes to allocate more dedicated parking than the maximum, the developer must assist funding of district-wide shared parking facilities. On street parking adjacent to each development can be used to meet the shared parking requirement. 3.4 Site Constraints Constraints to development include significant environmental constraints in the form of wetlands and Chesapeake Bay Resource Protection Areas. Other development challenges include protection of an important Civil War battlefield site on southern portion of the site and the need to maintain the rural character of Route 1 as it passes through the study area. In addition, development on both sides of the railroad will require significant investment in bridge construction to enable access to the eastern portion of the study area. Bridge length to accommodate pedestrian and automobile traffic over CSX lines was major constraint in the design of the internal circulation system. Technical Memorandum: Carmel Church Station 13


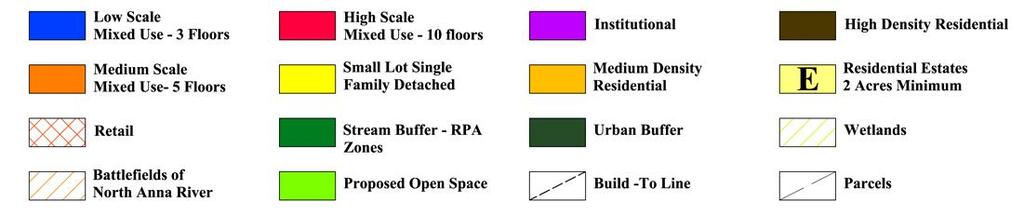

17 Figure 3-1: Carmel Church Station Proposed Land Use - Concept Plan Technical Memorandum: Carmel Church Station 14


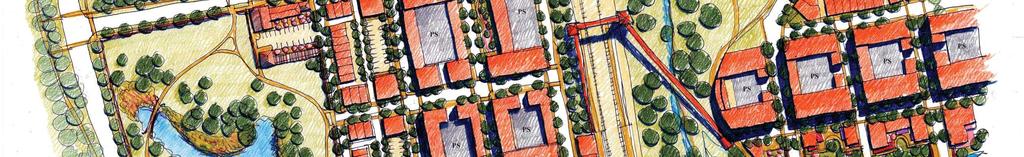
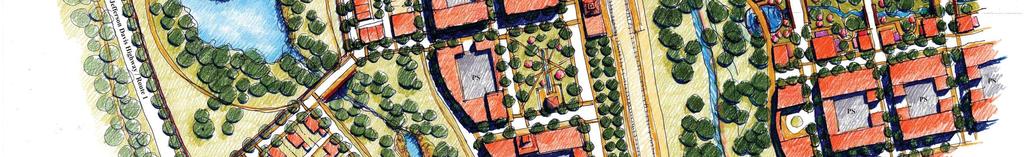
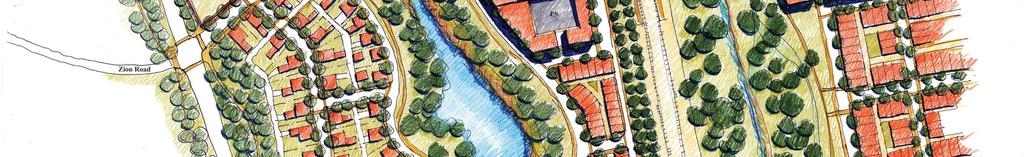

18 Figure 3-2: Carmel Church Station Illustrative Plan Technical Memorandum: Carmel Church Station 15


. C.")


19 Figure 3-3: Example Photographs A. Example of medium-density housing in the form of small- lot, single-family residential, as recommended for Carmel Church. All of these homes have their parking and service access off of rear alleys B. An example of the low-scale mixed use, which includes buildings of 2 or 3 floors with office or residential on the upper floor(s). C. An example of town houses, as recommended for the medium-scale residential areas indicated on the land use plan. D. This residential mixed-use area is similar in scale to that recommended for the high-scale mixed-use areas in the land use plan. F. An example precedent for the special entertainment district, with its mediumscale mixed use structures surrounding paved and planted open spaces. This area is located in a natural depression, and water could be a featured element of the open spaces G. Three vehicular and pedestrian bridges will be needed to cross the railroad and the adjacent stream and buffer. This is an example of a bridge design suitable to cross both an urban neighborhood and a natural area. Brick and precast would facilitate the creation of timeless civic minded bridges H. The southern portion of the plan, facing the North Anna River, is the site of a civil war battlefield. The railroad bridge at that location was destroyed as part of the battle, as shown in the photograph above. A visitor s center and battlefield drive has been recommended as part of the plan. I. Technical Memorandum: Carmel Church Station E. Another example for high-scale mixed use, as recommended in the plan. Rendering of General Mead s troops building pontoon bridges across the North Anna River. Battle maps indicate several of these bridges being constructed at the southern portion of the project site. 16
")


20 Figure 3-4: Thoroughfare and Alley Sketches A. Illustration of the 66 width (between building walls) thoroughfare used for most of the interior connecting streets in the various plans. B. Illustration of the 24 foot width alley used for the residential districts. C. Illustration of the 30 foot width alley used for mixed use sites. Technical Memorandum: Carmel Church Station 17
21 4.0 MARKET CONDITIONS The proposed station at Carmel Church will be sited in one of Caroline County s three designated growth areas. Current build-out is occurring in the Ladysmith growth area, the third designated area is the county seat, Bowling Green. The Carmel Church site has been designated for TOD and has the support of the Caroline County Board and the property owner. Obstacles to development are minimal as the majority of the land is controlled by one owner and the Board is extremely supportive of new urbanism approach to development. The Amtrak service and a station sited at Carmel Church are a necessary component for development to move forward. Current land uses are forest land and scattered low value residential. The major real estate firms that track trends and provide projections for various classes of property do not cover Caroline County. The market assessment was developed based on employment and population data. Employment is the primary driver for commercial space and population is the primary driver fueling demand for residential and retail. The area around the proposed station in Carmel Church has outstanding potential from a market perspective. The land is controlled by one owner, who is encouraging development The current land use is forest land and low value residential providing a land use footprint for any type of desired development Carmel Church is within commuting distance to both the Washington DC and Richmond areas The rural setting is attractive to various demographics for residential product at different pricing points Current full service retail for Caroline County is located in Fredericksburg and north of Richmond making the Carmel Church area an attractive alternative The site will have access to I Office Demand for office space in Caroline County was developed based on employment projections to Since the projections include all industries the employment figures were scaled down to reflect those industries that typically require office space, e.g., FIRE, government, professional and technical services. These data we accessed from the Virginia Employment Commission and were current as of September An assumption of 200 square feet per employee was used to estimate the space requirements on a yearly basis from County employment growth. Cost per square foot was taken from RS Means Square Foot Costs for office structures of five to ten stories. Costs were escalated at 3.3 percent per year from the Construction Cost Index reported by Engineering News Record. The projections from 2013 through 2030 are shown in Table 4-1. Over the 18 year period, employment increases will require about 292,000 square feet of office space, with a construction value of over $58 million. This will generate property taxes of $2.7 million over the same time period, assuming the tax rate for 2008 at $0.530 per $100 or assessed value. Technical Memorandum: Carmel Church Station 18
22 Table 4-1: Office Construction Value and Tax Revenue Caroline County YEAR CONSTRUCTION VALUE (Cumulative) PROPERTY TAX (Annual) 2013 $ 2,433,804 $ 12, $ 4,947,924 $ 26, $ 7,545,009 $ 39, $ 10,227,799 $ 54, $ 12,999,120 $ 68, $ 15,861,896 $ 84, $ 18,819,142 $ 99, $ 21,873,978 $ 115, $ 25,029,624 $ 132, $ 28,289,405 $ 149, $ 31,656,760 $ 167, $ 35,135,237 $ 186, $ 38,728,504 $ 205, $ 42,440,349 $ 224, $ 46,274,684 $ 245, $ 50,235,553 $ 266, $ 54,327,131 $ 287, $ 58,553,730 $ 310,335 Total $ 2,678,512 The site plan for the Carmel Church Station indicates build-out of 636,500 square feet of office space, which is about double the total projected for Caroline County. While this could be viewed as somewhat aggressive, it may be supported by attracting commercial tenants that rely on travel to the Washington DC and/or Richmond areas, which would be easily accommodated by the enhanced Amtrak service. Additionally, Carmel Church probably is the most attractive location to focus commercial development in Caroline County given the combination of access to I-95 and frequent rail service. Development sites in Caroline County are constrained by the presence of Fort A.P. Hill, which currently occupies approximately one-half of the land area of the county. Table 4-2 shows the construction value and property tax for 2013 though 2030 for the Carmel Church Station area. Technical Memorandum: Carmel Church Station 19
23 Table 4-2: Office Construction Value and Tax Revenue Carmel Church Station Area YEAR CONSTRUCTION VALUE (Cumulative) PROPERTY TAX (Annual) 2013 $ 4,802,182 $ 25, $ 9,762,837 $ 51, $ 14,887,193 $ 78, $ 20,180,652 $ 106, $ 25,648,796 $ 135, $ 31,297,389 $ 165, $ 37,132,385 $ 196, $ 43,159,936 $ 228, $ 49,386,396 $ 261, $ 55,818,330 $ 295, $ 62,462,517 $ 331, $ 69,325,962 $ 367, $ 76,415,901 $ 405, $ 83,739,808 $ 443, $ 91,305,405 $ 483, $ 99,120,665 $ 525, $ 107,193,830 $ 568, $ 115,533,408 $ 612,327 Total $ 5,285, Retail Demand for retail space was developed based on population projections to The U.S. Census-Quick Facts reported retail sales per capita for Caroline County at $11,359. Increases in population were applied to the retail sales per capita to derive total sales. To estimate the square feet needed as additions to retail stock a value of $300 per square foot per year was used. This is an average that takes into consideration varying categories of retail from General Merchandise at $154 per square foot per year to Jewelry at $748 per square foot per year. Cost per square foot was taken for RS Means Square Foot Costs. Costs were escalated at 3.3 percent per year from the Construction Cost Index reported by Engineering News Record. The projections from 2013 through 2030 are shown in Table 4-3. Over the 18 year period, retail space is projected to increase by about 489,000 square feet, with a construction value of over $67 million. This will generate property taxes of $3.1 million over the same time period, assuming the tax rate for 2008 at $0.530 per $100 or assessed value. Technical Memorandum: Carmel Church Station 20
24 Table 4-3: Retail Construction Value and Tax Revenues Caroline County YEAR POPULATION TOTAL CONSTRUCTION VALUE (Cumulative) PROPERTY TAX (Annual) ,455 $ 357,302,267 $ 2,819,512 $ 14, ,173 $ 365,458,408 $ 5,732,069 $ 30, ,892 $ 373,614,549 $ 8,740,739 $ 46, ,610 $ 381,770,689 $ 11,848,696 $ 62, ,328 $ 389,926,830 $ 15,059,215 $ 79, ,046 $ 398,082,970 $ 18,375,681 $ 97, ,764 $ 406,239,111 $ 21,801,591 $ 115, ,482 $ 414,395,252 $ 25,340,556 $ 134, ,200 $ 422,551,392 $ 28,996,307 $ 153, ,918 $ 430,707,533 $ 32,772,697 $ 173, ,636 $ 438,863,674 $ 36,673,708 $ 194, ,354 $ 447,019,814 $ 40,703,453 $ 215, ,072 $ 455,175,955 $ 44,866,179 $ 237, ,790 $ 463,332,095 $ 49,166,276 $ 260, ,508 $ 471,488,236 $ 53,608,275 $ 284, ,226 $ 479,644,377 $ 58,196,860 $ 308, ,944 $ 487,800,517 $ 62,936,869 $ 333, ,662 $ 495,956,658 $ 67,833,298 $ 359,516 Total $ 3,103,002 The site plan for the Carmel Church Station indicates build-out of 636,500 square feet of retail space, which is about 130 percent of the total projected for Caroline County. From a strict comparison of development totals it appears unreasonable that the station area plan could exceed County totals. The County totals are based on growth projections of population. This does not take into consideration the retail opportunities in the County. According to the County Business Patterns for 2005, there were 67 establishments in Caroline County engaged in retail trade, 39 of which had 1 to 4 employees. This implies that 58 percent of retail consists of extremely small operations (mom and pop stores). This causes County shoppers to travel to Fredericksburg and Richmond for a variety of shopping needs. The retail build-out associated with the Carmel Church site plan may reflect the reality of bringing more and varied shopping opportunities to a vastly underserved market. Additionally, the site plan has 2,935 residential units, which will provide substantial demand for retail. Table 4-4 shows the construction value and property tax for 2013 though 2013 for the Carmel Church Station area. Technical Memorandum: Carmel Church Station 21
25 Table 4-4: Retail Construction Value and Tax Revenues Carmel Church Station Area YEAR TOTAL CONSTRUCTION VALUE (Cumulative) PROPERTY TAX (Annual) 2013 $ 357,302,267 $ 3,667,216 $ 19, $ 365,458,408 $ 7,455,449 $ 39, $ 373,614,549 $ 11,368,694 $ 60, $ 381,770,689 $ 15,411,077 $ 81, $ 389,926,830 $ 19,586,858 $ 103, $ 398,082,970 $ 23,900,440 $ 126, $ 406,239,111 $ 28,356,370 $ 150, $ 414,395,252 $ 32,959,345 $ 174, $ 422,551,392 $ 37,714,219 $ 199, $ 430,707,533 $ 42,626,004 $ 225, $ 438,863,674 $ 47,699,878 $ 252, $ 447,019,814 $ 52,941,189 $ 280, $ 455,175,955 $ 58,355,464 $ 309, $ 463,332,095 $ 63,948,410 $ 338, $ 471,488,236 $ 69,725,923 $ 369, $ 479,644,377 $ 75,694,094 $ 401, $ 487,800,517 $ 81,859,214 $ 433, $ 495,956,658 $ 88,227,784 $ 467,607 Total $ 4,035, Residential The market for residential housing is largely determined by population and household size. Projections for Caroline County show population increasing from the 2000 Census figure of 22,121 to 43,662 in year Average household size as reported in the 2000 Census was 2.69 persons per household. Based on these data the demand for residential product can be estimated on a yearly basis. Yearly increases in population averaging 718 per year will require an addition of 267 residential units Assuming 1,000 square feet per unit equates to build-out of 267,000 square feet per year of residential product Total construction value exceeds $1 billion for 2013 through 2030 Total tax revenue over the 18 year period from 2013 through 2030 is $100 million Table 4-5 shows the increase in property taxes on a yearly basis from 2013 to 2030 as the 4,800,000 square feet of residential product enters the market. Technical Memorandum: Carmel Church Station 22
26 Table 4-5: Housing Demand, Construction Value and Tax Revenue Caroline County YEAR CONSTRUCTION VALUE (Annual) CONSTRUCTION VALUE (Cumulative) PROPERTY TAX (Annual) 2013 $ 44,076,360 $ 44,076,360 $ 233, $ 45,530,880 $ 89,607,240 $ 985, $ 47,033,399 $ 136,640,639 $ 1,503, $ 48,585,501 $ 185,226,140 $ 2,037, $ 50,188,823 $ 235,414,963 $ 2,589, $ 51,845,054 $ 287,260,017 $ 3,159, $ 53,555,941 $ 340,815,958 $ 3,748, $ 55,323,287 $ 396,139,244 $ 4,357, $ 57,148,955 $ 453,288,199 $ 4,986, $ 59,034,871 $ 512,323,070 $ 5,635, $ 60,983,021 $ 573,306,092 $ 6,306, $ 62,995,461 $ 636,301,553 $ 6,999, $ 65,074,311 $ 701,375,864 $ 7,715, $ 67,221,764 $ 768,597,628 $ 8,454, $ 69,440,082 $ 838,037,709 $ 9,218, $ 71,731,605 $ 909,769,314 $ 10,007, $ 74,098,747 $ 983,868,061 $ 10,822, $ 76,544,006 $ 1,060,412,067 $ 11,664,533 Total $100,425,826 The site plan for the Carmel Church Station area indicates build-out of 2,935 residential units totaling 3,249,500 square feet which is about 67 percent of the total projected for Caroline County. This appears to be a reasonable share for an area that is a designated growth area emphasizing TOD that will greatly exceed current densities in the County. Table 4-6 shows the construction value and property tax for 2013 though 2030 for the Carmel Church Station area. Technical Memorandum: Carmel Church Station 23
27 Table 4-6: Housing Demand, Construction Value and Tax Revenue Carmel Church Station Area YEAR CONSTRUCTION VALUE (Annual) CONSTRUCTION VALUE (Cumulative) PROPERTY TAX (Annual) 2013 $ 32,308,400 $ 32,308,400 $ 171, $ 33,374,577 $ 65,682,976 $ 722, $ 34,475,938 $ 100,158,914 $ 1,101, $ 35,613,644 $ 135,772,558 $ 1,493, $ 36,788,894 $ 172,561,452 $ 1,898, $ 38,002,928 $ 210,564,380 $ 2,316, $ 39,257,024 $ 249,821,404 $ 2,748, $ 40,552,506 $ 290,373,910 $ 3,194, $ 41,890,739 $ 332,264,648 $ 3,654, $ 43,273,133 $ 375,537,781 $ 4,130, $ 44,701,146 $ 420,238,928 $ 4,622, $ 46,176,284 $ 466,415,212 $ 5,130, $ 47,700,102 $ 514,115,313 $ 5,655, $ 49,274,205 $ 563,389,518 $ 6,197, $ 50,900,254 $ 614,289,772 $ 6,757, $ 52,579,962 $ 666,869,734 $ 7,335, $ 54,315,101 $ 721,184,835 $ 7,933, $ 56,107,499 $ 777,292,334 $ 8,550,216 Total $ 73,613, Summary For all classes of development, construction value is estimated to generate about $78 million in property taxes from 2013 through 2030 at the Carmel Church Station Area. This is about 70 percent of the property taxes projected for Caroline County from new development over the same time period. This appears to be reasonable since the existing land use encourages a bold vision for TOD and approvals by the County would act to focus growth around the station area. Additionally, Carmel Church is one of only three designated growth areas and will most likely build-out with greater density because of the Amtrak service, access to I-95, and an existing land area and ownership that encourage the desired planned development. Technical Memorandum: Carmel Church Station 24
28 5.0 Economic Impact This analysis assesses the economic effects of the projected real estate development in the Carmel Church Station Area. Commercial, retail and residential impacts are assessed. The analysis projects the economic effects that construction expenditures to develop the sites around Carmel Church would have on the State of Virginia economy in terms of increased employment and related economic effects 1. The construction activity represents the most immediate impact of the station-area real estate investments. Construction firms hire workers and purchase materials and support services in the local economy in order to complete the project. This is the direct effect on the economy. The construction workers earnings translate into a proportional increase in consumer demand as these workers purchase goods and services in the region across a variety of industrial sectors. The jobs and incomes supported through the circulation of these earnings in the state economy represent the station area development s indirect impact. The economic impacts associated with construction expenditures in the station areas are measured using regional multipliers from the Bureau of Economic Analysis (BEA) within the U.S. Department of Commerce. Derived from the Regional Input-Output Modeling System, the so-called RIMS II multipliers measure the total change (direct + indirect effects) in output, employment, and earnings that results from an incremental change to a particular industry. The multipliers were constructed by BEA to reflect the Virginia economy. The multipliers are based on the 2005 Annual Input-Output Table for the nation and 2005 regional accounts data; they represent the most updated version available at the time this analysis was prepared. The economic impact analysis builds on the findings of the Carmel Church Market Analysis, using the projections of commercial, retail, and residential construction to provide a consistent estimate of economic impacts. Projections of development and the attendant construction costs refer to the station area plans. 5.1 Earnings, employment and output effects from capital expenditures Construction of the station area development projects represents significant capital investment in the local economy. This spending will increase the employment, earnings and output for the duration of the construction process, projected to occur between 2013 and 2030 in the Market Analysis. Capital cost estimates/construction values for this analysis are presented in year of expenditure dollars to be consistent with the analysis developed in the Market Analysis. The following section describes the project expenditures and anticipated economic impacts. 5.2 Capital expenditures The capital expenditures for construction of the station area developments range widely across property type. At the low end of the cost range are the projections for commercial and retail investment at $115 million and $88 million, respectively. The projections for residential investment in the station area are much higher at $777 million. Although every building material required for the project may not be produced in Virginia, the RIMS II multipliers reflect the supplier linkages for the industry, and thus account for this leakage from the state economy. 1 The investment to construct and improve the stations themselves would have a similar impact on the economy; project costs are not yet available at the time of this analysis to permit an economic assessment. Technical Memorandum: Carmel Church Station 25
29 Construction costs are assumed to include materials and labor and are funded 100% by the private sector. There is no land costs included in the construction costs. 5.3 Construction impacts The net construction cost derived in Table 5-1 is translated into an economic impact through the application of the multipliers, as shown in the middle rows of the exhibit, labeled Construction Multipliers. Because the multipliers summarize information about Virginia s economy, they are the same across all the property types. The interpretation of the multipliers for the construction industry shown in Table 5-1 is as follows. The Final Demand Earnings Multiplier represents the total dollar change in earnings of households employed by all industries for each additional dollar of output delivered to final demand by the construction industry. The Final Demand Employment Multiplier represents the total change in number of jobs that occurs in all industries for each $1 million of output delivered to final demand by the construction industry. The Final Demand Output Multiplier represents the total dollar change in output that occurs in all industries for each additional dollar of output delivered to final demand by the construction industry. Applying the Final Demand Multipliers for the construction industry to the amount of new resources that will be used for capital expenditures provides estimates of the net earnings, employment, and output impacts generated by each development scenario. The results are summarized in the bottom rows of Table 5-1, labeled Construction Impact. Note that these are one-time impacts that last for the duration of the project s construction. One job is defined as a job for one person of one year s duration. As an example, a job for one person that had duration of three years would be defined as three jobs. There are no long-term effects associated with the economic impacts generated by capital expenditures. Construction-related impacts last for the duration of the buildout around the station. Just as the expected investment varies across property type, the economic impacts vary as well. Job impacts range from a low of 845 jobs over the 18-year period or about 47 jobs per year attributable to the retail development investment to a high of 7,444 over the same 18-year period for an average of 413 jobs per year for the residential development. Technical Memorandum: Carmel Church Station 26
30 Table 5-1: Projected Construction Impacts by Property Type at Carmel Church Station CARMEL CHURCH STATION STATION AREA DEVELOPMENT SCENARIO Commercial Retail Residential COST (YOE$) Total Construction Cost (materials and labor) $115,533,408 $88,227,784 $777,292,334 CONSTRUCTION MULTIPLIERS Earnings Employments Output CONSTRUCTION IMPACT Earnings $76,483,116 $48,406,793 $514,567,525 Employment 1, ,444 Output $252,163,216 $192,565,961 $1,696,518,248 Notes: As the Final Demand Employment multiplier is based on 2005 data, the capital expenditure is deflated to 2005 dollars for this calculation. Technical Memorandum: Carmel Church Station 27
31 6.0 Potential Local Funding Mechanism A critical step in the implementation of the Caroline County Station is the ability to fund the local share of the station s construction costs. In addition to the station building itself, these costs may include additional investment in utilities, parking, and other civil improvements such as drainage. No formal estimates of station capital costs have been prepared for the proposed Station, but DRPT generally expects that local jurisdictions will be asked to fund a significant portion of the cost of station improvements to support expanded intercity rail service. In order to explore potential local funding options, this section assumes that local funding of $5 million will be necessary for the Caroline County Station. This amount is intended simply as a placeholder and is noted as such throughout this section. Any future estimates of costs and funding needs will require both a detailed engineering cost analysis and a policy decision by DRPT about the share of costs that localities will have to provide. This section provides an analysis of a potential mechanism that Caroline County could use to generate its share of the required funds for station improvements. Tax Increment Financing (TIF). The analysis is a theoretical example designed to illustrate the general economic viability of this mechanism and does not speak to any specific technical issues that would need to be addressed in order to achieve successful implementation. However, a brief discussion of feasibility, given the broad economic and legal constraints in the Commonwealth and in Caroline, is provided at the end of this section. 6.1 Tax Increment Financing Tax increment financing (TIF) is widely used in Virginia and across the United States as a method for financing current investments (including public infrastructure such as rail stations) by capturing and dedicating expected future gains in property tax revenues in the area around the investment and using those gains to pay back the investment s initial cost. To assess the economic viability of a TIF for the Caroline County Station, the placeholder local funding assumption of $5 million is compared to the net present value (NPV) of the stream of incremental property tax revenues resulting from future development around the station for the period from 2013 to These dates were selected as the estimate for when station construction would likely be undertaken and as a reasonable period for the incremental property tax revenues to be dedicated. The assumptions, methodology, and results for this analysis are outlined below. Assumptions In addition to projections of the station cost and future development around the station, the TIF analysis relies on assumptions about inflation rates and discount rates. These rates are preliminary estimates, and more detailed projections of these rates would be used in any future analyses. Construction cost inflation: An annual rate of 3.3% is used to inflate the station cost estimates from 2008 to 2013 dollars. As a comparison, the Florida DOT is currently using 3.3% as its long-run cost inflation figure. Discount rate: A discount rate of 5.5% is used in the calculation of NPV. Technical Memorandum: Carmel Church Station 28
32 Methodology The methodology used in the TIF analysis is summarized below: 1. A placeholder local funding amount of $5 million for the Caroline County Station was assumed. 2. Preliminary real estate development estimates for each station were received and analyzed. (These are the same development estimates described in previous sections of this report.) These estimates provide annual projected incremental property tax revenue for three major development categories (office/commercial, retail, and residential) around the Caroline County Station for the period from 2013 to The net present value of the stream of incremental property tax revenue from Step 2 was calculated and compared to the placeholder local funding amount Step 1. This allows for the determination of the required portion of the incremental property revenue that must be dedicated to the Caroline County Station through a TIF in order to equalize the assumed local funding and the NPV of the dedicated future revenues. A discount rate of 5.5% was used in the calculation of NPV. The results are summarized in Table 6-1, which presents the placeholder local funding assumption, the NPV of the incremental tax revenue, and the required portion of the incremental tax revenue that would need to be dedicated as a TIF. Table 6-1: Caroline County Station TIF Summary Example "Placeholder" Local Funding Assumption (2013) $5.0 million NPV of Incremental Tax Revenue from Development $43.2 million Required Portion of Increment Dedicated to Station 12% Table 6-2 presents the detailed annual calculations of incremental property tax revenue for Caroline County Station. Technical Memorandum: Carmel Church Station 29
33 Table 6-2: Incremental Property Tax Revenues for Caroline County Station YEAR COMMERCIAL/ OFFICE RETAIL RESIDENTIAL TOTAL DEDICATED SHARE OF TOTAL 2013 $25,452 $19,436 $171,235 $216,122 $25, $51,743 $39,514 $722,513 $813,770 $94, $78,902 $60,254 $1,101,748 $1,240,904 $143, $106,957 $81,679 $1,493,498 $1,682,134 $194, $135,939 $103,810 $1,898,176 $2,137,925 $247, $165,876 $126,672 $2,316,208 $2,608,757 $301, $196,802 $150,289 $2,748,035 $3,095,126 $358, $228,748 $174,685 $3,194,113 $3,597,545 $416, $261,748 $199,885 $3,654,911 $4,116,544 $476, $295,837 $225,918 $4,130,916 $4,652,671 $538, $331,051 $252,809 $4,622,628 $5,206,489 $602, $367,428 $280,588 $5,130,567 $5,778,583 $668, $405,004 $309,284 $5,655,268 $6,369,557 $737, $443,821 $338,927 $6,197,285 $6,980,032 $807, $483,919 $369,547 $6,757,187 $7,610,654 $880, $525,340 $401,179 $7,335,567 $8,262,085 $956, $568,127 $433,854 $7,933,033 $8,935,014 $1,034, $612,327 $467,607 $8,550,216 $9,630,150 $1,114,453 Total $5,285,020 $4,035,937 $73,613,105 $82,934,062 $9,597,579 Net Present Value (at 5.5%) $43,205,721 $5,000,000 Results As Table 6-1 above shows, Caroline County would need to dedicate approximately 12% of the incremental property tax revenue generated by the projected new development around the proposed Station from 2013 to 2030 in order to support the placeholder $5 million local funding assumption. 6.2 General Assessment of the TIF Mechanism in Virginia In weighing the decision to pursue TIF funding, a local jurisdiction must evaluate not only the overall economic feasibility, but also the likelihood of successful implementation, and the approach has its pros and cons. TIF districts are currently in use in various locations across Virginia and are generally much easier to implement under existing legislation. However, the ease of creation is balanced by the significant uncertainty associated with the future revenue stream. The locality must consistently work with developers to ensure that the projected development actually occurs, and the development and resulting tax revenue may take a significant amount of time to come online. The risk associated with this uncertainty and potential for delay may make it prohibitively expensive to attempt to finance the station costs with a pure TIF-backed revenue bond. Thus, many localities have used different versions of a shadow TIF approach: Shadow TIF (Weak): In this approach, the City or County does not actually set up the TIF district, and any bonds issued to pay for upfront investment costs are general obligation (GO) debt, as is normally the case for infrastructure investment in a locality. However, the results of the TIF analysis demonstrating the expected future Technical Memorandum: Carmel Church Station 30
34 development and tax revenues are used to convince the public of the worth of the investment and its ability to pay for itself over time. Shadow TIF (Strong): In this approach, the City or County does actually designate and create a TIF district and segregates the incremental property tax revenues in that district into a separate account which is dedicated to paying back the investment costs. However, the bonds are still GO bonds (thus avoiding the high costs associated with a pure TIF-backed revenue bond), and City or County general funds are likely to be used to pay debt service in the early years, while TIF revenues are still building. In later years, once the majority of the development has occurred, the TIF fund would then be able to take over the debt service and also pay back the general fund for its earlier expenditures. Technical Memorandum: Carmel Church Station 31
35 7.0 SUPPORTING TRANSPORTATION ANALYSIS 7.1 Roadway Network Understanding existing and future traffic conditions around the future station site helps define the potential of the existing roadway network to accommodate new demand for accessibility to the station site. The analysis is based on existing traffic conditions near the station. Future conditions are estimated based on projected growth patterns, and future build conditions are estimated assuming the proposed land use plans and improved rail transportation access. Existing Conditions The Caroline County station site is located in a rural area along the CSX Main Line near Carmel Church and approximately ½ mile west of I-95 and ¼ mile east of Jefferson Davis Highway (US 1). The road network in the vicinity of this site is very sparse and there are currently no connections to the road network from the proposed station. Pennsylvania Avenue, a southeast/northwest running road from Jefferson Davis Highway, comes to a dead-end about 1,000 feet northwest to the site. This is the closest road to the site. The closest significant road is nearly two miles to the north where Jefferson Davis Highway crosses the east/west running Jericho Road/Rogers Clark Boulevard (Rt. 207). At the Caroline location, sample 15 minute counts were conducted for Jefferson Davis Highway and Jericho Road/Rogers Clark Boulevard at their intersection during the AM and PM peak hours. This count was converted into a peak 1 hour count. Signal cycle lengths were also measured in the field. This data was used to develop a Synchro traffic model at this key intersection which will help planners understand existing traffic behavior. The model serves as the basis for forecasts of future conditions as it is expanded to include several proposed intersections. No Build 2030 Conditions Based on data provided by the Fredericksburg Area Metropolitan Planning Organization, traffic growth factors were developed around the station. These growth factors were applied to the key intersection in the vicinity of the station site. A growth rate reflecting proposed employment and population growth within a quarter mile of the station was used to estimate the change between current and 2030 No Build traffic volumes, as shown in Table 7-1 below. Table 7-1: Derivation of Traffic Growth Factors Study Area Percent of Population Change Percent of Employment Change Caroline Station CAROLINE COUNTY 97.38% % Traffic Factor Growth Quarter Mile % % % Half Mile 97.30% % 98.65% The key traffic signal was optimized for the No Build 2030 volumes using Synchro. No planned land development projects in the vicinity of the station could be identified, therefore the future year signal cycle length and lane configuration is assumed to be the same as existing conditions. Technical Memorandum: Carmel Church Station 32
36 Build Conditions Based on the Intercity Ridership Forecasting model, Regional Travel Demand model, and economic and land use assumptions, the increase in travel activity around the station area was estimated for peak travel periods. Figure 7-1 demonstrates this process through a flow chart. Based on recent surveys conducted by Amtrak, the mode split, or portion of model trips for each station access mode was estimated. This ridership component also reflects future trips based on proposed changes in land use and density that might attract additional trips. Based on the preferred combination of land use/ density and ridership at the station, the Synchro model was updated with the Build 2030 traffic volumes. Figure 7-1: Concept for Growth in Traffic Volumes Build Condition 2030 traffic Volumes = No Build 2030 traffic volumes + Trips based on change in ridership (A) Two major components are expected to affect Build traffic conditions: + Trips due to proposed development at the station (B) A. Trips based on Amtrak ridership growth. Ridership projections for No Build and Build options as well as assumed mode of access are shown in Table 7-2. B. Trips based on proposed development at the station. These trips were projected using the land use densities proposed as part of the land use plan and assuming trip generation rates according to Institute of Transportation Engineers (ITE) standard practice. Table 7-2: Ridership Projections for Caroline County Station Total Annual Ons & Offs by Option No Build - Low No Build - High Option 1 - Low Option 1 - High Caroline County ,975 51,494 Notes: 1. No Build represents current Amtrak service in Option 1 represents new service at Caroline County, improved frequency and travel times in Newport News - Richmond - DC corridor 3. Traffic analysis assumes 2030 mode of station access is 5% by transit and 20% by walking. Regarding signal timings and lane configurations, all signals were optimized for Build 2030 volumes; no cycle lengths were changed. The future year lane configurations are based on a report by Michael Baker Inc. dated June 6, Traffic Impacts Under Build Condition This station site contains significant potential for development. Proposed traffic impacts could overtax the existing arterial road network. The proposed grid of streets is designed to mitigate these potential traffic impacts. First, the dense grid provides multiple paths for trips within the development, facilitating improved mobility around the station for automobiles and pedestrians. Second, major north-south and east-west routes are set up to provide traffic Technical Memorandum: Carmel Church Station 33


37 routes parallel to Route 1 and I-95, giving travelers opportunities to bypass incidents or congestion. Future demand for automobile trips on existing streets will require the addition of three new signalized intersections along Route 1. These intersections will be located at key access points and will control vehicle access into and out of the proposed development. No additional improvements to the existing road network are assumed. Figure 7-2 shows the new streets proposed as part of the station area plan, and Table 7-3 provides detailed results of the traffic analysis. Figure 7-2: Proposed Street Infrastructure Improvements Technical Memorandum: Carmel Church Station 34
Gold Line Bus Rapid Transit Transit Oriented Development (BRTOD) Helmo Station Area Plan
 Helmo Station Area Plan") Appendix F Gold Line Bus Rapid Transit Transit Oriented Development (BRTOD) Helmo Station Area Plan Introduction and Purpose of the Plan The Gold Line Bus Rapid Transit facility is an eleven-mile dedicated
Appendix F Gold Line Bus Rapid Transit Transit Oriented Development (BRTOD) Helmo Station Area Plan Introduction and Purpose of the Plan The Gold Line Bus Rapid Transit facility is an eleven-mile dedicated
Chapter 1.0 Introduction
 Chapter 1.0 Introduction 1.1 Background The North Metro commuter rail line is part of the RTD FasTracks regional transit system expansion program to build more than 100 miles of rail transit throughout
The transportation system in a community is an
 7 TRANSPORTATION The transportation system in a community is an important factor contributing to the quality of life of the residents. Without a sound transportation system to bring both goods and patrons
Developer s Program. The Station at East 54
 Developer s Program The Station at East 54 Existing Conditions The Station at East 54 is proposed for a 1.12 acre site at the northeast corner of Hamilton Road and Prestwick Road, tucked between the East
Metro. Activity Center Design Guidelines. Recommendations For Developing Focused, Mixed-Use Commercial/Residential Centers
 Metro Activity Center Design Guidelines Recommendations For Developing Focused, Mixed-Use Commercial/Residential Centers Metro Activity Centers What is a MAC? Legacy, the adopted guide for the future growth
EXISTING COMPREHENSIVE PLAN
 EXISTING COMPREHENSIVE PLAN Town Center Land Use Element: V. LAND USE POLICIES Town Center Mercer Island's business district vision as described in "Your Mercer Island Citizen-Designed Downtown" was an
LAND USE OVERVIEW WHAT YOU WILL FIND IN THIS CHAPTER
 LAND USE WHAT YOU WILL FIND IN THIS CHAPTER Information about the City s expected population and employment growth. Description and capacity of existing and future land use designations. Policies that
Town Center (part of the Comprehensive Plan)
") Town Center (part of the Comprehensive Plan) Mercer Island Town Center Looking North (2014) In 1994, a year-long process culminated in a set of design guidelines and code requirements for the Town Center
Town Center (part of the Comprehensive Plan) Mercer Island Town Center Looking North (2014) In 1994, a year-long process culminated in a set of design guidelines and code requirements for the Town Center
Implementation Guide Comprehensive Plan City of Allen
 Implementation Guide 2030 Comprehensive Plan City of Allen DRAFT 2015 Implementation Guide Allen 2030 Comprehensive Plan INTRODUCTION The Comprehensive Plan serves as a guide for the growth and development
CHAPTER 7: Transportation, Mobility and Circulation
 AGLE AREA COMMUNITY Plan CHAPTER 7 CHAPTER 7: Transportation, Mobility and Circulation Transportation, Mobility and Circulation The purpose of the Transportation, Mobility and Circulation Chapter is to
Land Use Amendment in Southwood (Ward 11) at and Elbow Drive SW, LOC
 at and Elbow Drive SW, LOC") 2018 November 15 Page 1 of 10 EXECUTIVE SUMMARY This land use amendment application was submitted by Rick Balbi Architect on 2017 August 31 on behalf of Sable Developments Ltd, and with authorization from
2018 November 15 Page 1 of 10 EXECUTIVE SUMMARY This land use amendment application was submitted by Rick Balbi Architect on 2017 August 31 on behalf of Sable Developments Ltd, and with authorization from
ARLINGTON COUNTY, VIRGINIA
 ARLINGTON COUNTY, VIRGINIA County Board Agenda Item Meeting October 15, 2005 DATE: September 28, 2005 SUBJECT: Request to Advertise the adoption of the 2005 Clarendon Sector Plan C. M. RECOMMENDATION:
Policies and Code Intent Sections Related to Town Center
 Policies and Code Intent Sections Related to Town Center The Town Center Vision is scattered throughout the Comprehensive Plan, development code and the 1994 Town Center Plan. What follows are sections
6 Growth Management Challenges and Opportunities
 6 Growth Management Challenges and Opportunities The Town has established a goal of attaining a 50% participation rate with respect to employment opportunities versus residential population. The Town s
Establish a network of streetscaped vehicle and pedestrian routes that connect within and outside the Plan area.
 This Plan s urban design goals are to create an urban scale, walkable community with connections to transit, parks, and services and with amenities and facilities for residents and employees. The 1992
EXHIBIT A. Tax Increment Reinvestment Zone No. 1 (Town Center) First Amended Project Plan 1
 First Amended Project Plan 1") EXHIBIT A Tax Increment Reinvestment Zone No. 1 (Town Center) First Amended Project Plan 1 1 As amended by Resolution No. 2008-02-001(TR1R) of the Tax Increment Reinvestment Zone No.1, and approved to
EXHIBIT A Tax Increment Reinvestment Zone No. 1 (Town Center) First Amended Project Plan 1 1 As amended by Resolution No. 2008-02-001(TR1R) of the Tax Increment Reinvestment Zone No.1, and approved to
hermitage town center
 hermitage town center A Community Vision prepared by Strada for The City of Hermitage and The Mercer County Regional Planning Commission January 2007 table of contents introduction 3 design principles
Urban Planning and Land Use
 Urban Planning and Land Use 701 North 7 th Street, Room 423 Phone: (913) 573-5750 Kansas City, Kansas 66101 Fax: (913) 573-5796 Email: planninginfo@wycokck.org www.wycokck.org/planning To: From: City Planning
1.0 Circulation Element
 5/9/18 1.0 Circulation Element 1.1 Introduction As growth and development occur in Apache County, enhancements to its circulation system will be necessary. With time, more roads will be paved and air and
17.11 Establishment of Land Use Districts
 17.11 Establishment of Land Use Districts 17.11.010 Purpose. To promote the health, safety, and general welfare of City residents and those who come to South Salt Lake to work, exchange commerce and recreate.
This Review Is Divided Into Two Phases:
 Semiahmoo Town Centre Review The purpose of this review: To review the Semiahmoo Town Centre Concept Plan, originally approved in 1993, to ensure that this centre will continue to serve the needs of South
DEVELOPMENT FRAMEWORK POST 2030 LAND USE PLAN INTRODUCTION
 INTRODUCTION Oak Grove s Comprehensive Plan identifies a future Metropolitan Urban Service Area (MUSA). The Metropolitan Council does not anticipate extending utilities to this area prior to 2030. The
CHAPTER 7: VISION AND ACTION STATEMENTS. Noble 2025 Vision Statement
 CHAPTER 7: VISION AND ACTION STATEMENTS This chapter presents the vision, policy and action statements that transform the comprehensive planning study, an analysis of Noble s past, future trends and community
Secrest Short Cut and Monroe Expressway Small Area Plan AUGUST 29, 2018
 Secrest Short Cut and Monroe Expressway Small Area Plan AUGUST 29, 2018 Background and Process Monroe Expressway will be open by the end of 2018 Union County and Indian Trail identified a need to revisit
Economic Development & Housing Council Committee Comprehensive Plan Update September 20, 2005
 1 Economic Development & Housing Council Committee Comprehensive Plan Update September 20, 2005 Purpose To update the Committee on the ForwardDallas! Plan, including: Status Anticipated Products Public
Joint Meeting City Council and the Plan Commission. September 1st, 2015
 Joint Meeting City Council and the Plan Commission September 1st, 2015 1 The City Plan Commission shall recommend a City Plan for the physical development of the City Article IX Section 2 of the City of
4.1.3 LAND USE CATEGORIES
 4.1.3 LAND USE CATEGORIES a. City Center District The City Center District incorporates the existing character and mix of uses in downtown Belmont to encourage redevelopment and new development in keeping
Planning Districts INTRODUCTION
 INTRODUCTION To facilitate detailed examination of development prospects for all areas of the community, Delano has been divided into 14 planning districts. The location of these planning districts is
CITY OF PUYALLUP. Background. Development Services
 CITY OF PUYALLUP Development Services 333 South Meridian Puyallup WA 98371 To: City Council From: Katie Baker, AICP, Planning Division Re: South Hill Neighborhood Plan Adoption Date: (Meeting date: February
13 THORNHILL YONGE STREET STUDY IMPLEMENTATION CITY OF VAUGHAN OPA 669 AND TOWN OF MARKHAM OPA 154
 13 THORNHILL YONGE STREET STUDY IMPLEMENTATION CITY OF VAUGHAN OPA 669 AND TOWN OF MARKHAM OPA 154 The Planning and Economic Development Committee recommends the adoption of the recommendations contained
C. Westerly Creek Village & The Montview Corridor
 C. Westerly Creek Village & The VISION Community Vision When the goals of the city are achieved Westerly Creek Village, a distinctive community defined by Montview Boulevard and Westerly Creek, is a strong
Living in Albemarle County s Urban Places
 Living in Albemarle County s Urban Places ALBEMARLE COUNTY, VIRGINIA A Closer Look at Albemarle s Approach to Managing Growth and Creating Quality Urban Environments www.albemarle.org Page 2 Living in
THAT the attached Terms of Reference for the Thornhill Centre Street Study be approved.
 COMMITTEE OF THE WHOLE AUGUST 18, 2003 THORNHILL CENTRE STREET STUDY PLANNING FILE: 15.92 Recommendation The Commissioner of Planning recommends: THAT the attached Terms of Reference for the Thornhill
Public may provide comments on the GDP within the next two weeks (December 24)
") 25/70 General Development Plan (GDP) Public Meeting Wednesday, December 10, 2014 6:00 8:00 P.M. District 1 Police Station Community Room 1311 W 46th Ave, Denver, CO 80211 Council Woman Montero: This particular
25/70 General Development Plan (GDP) Public Meeting Wednesday, December 10, 2014 6:00 8:00 P.M. District 1 Police Station Community Room 1311 W 46th Ave, Denver, CO 80211 Council Woman Montero: This particular
Review of Opportunity Area C Draft Comprehensive Plan and Draft BOS Follow-On Motions. Special Working Group Meeting March 4, 2015
 Review of Opportunity Area C Draft Comprehensive Plan and Draft BOS Follow-On Motions Special Working Group Meeting March 4, 2015 The slides that follow identify where the draft Comprehensive Plan has
3.1 community vision. 3.3 required plan elements
 Chapter 3 Community Form 3.1 community vision 3.2 Parks & landscaping concepts 3.3 required plan elements D R A F T 20 Community Form Chapter 3 3.0 Community form 3.1 community vision The Specific Plan
Concord Community Reuse Project Goals and Guiding Principles. Overarching Goals (OG)
") Concord Community Reuse Project Goals and Guiding Principles Overarching Goals (OG) No priority is implied by the order of presentation of the goals and guiding principles. Overarching goals for the Concord
Concord Community Reuse Project Goals and Guiding Principles Overarching Goals (OG) No priority is implied by the order of presentation of the goals and guiding principles. Overarching goals for the Concord
Chapter 1 - General Design Guidelines CHAPTER 1 GENERAL DESIGN GUIDELINES
 CHAPTER 1 GENERAL DESIGN GUIDELINES 1.0 INTRODUCTION This Publication has been developed to provide current, uniform procedures and guidelines for the application and design of safe, convenient, efficient
Urban Development Area (UDA) Process in Virginia: History & Requirements
 Process in Virginia: History & Requirements") Urban Development Area (UDA) Process in Virginia: History & Requirements J. Kelli Nash Office of Intermodal Planning and Investment VDOT Coordinating Transportation & Land Use Forum Thursday, June 2, 2016
Urban Development Area (UDA) Process in Virginia: History & Requirements J. Kelli Nash Office of Intermodal Planning and Investment VDOT Coordinating Transportation & Land Use Forum Thursday, June 2, 2016
CITY OF TIGARD EXPECTED SERVICE AREA
 CITY OF TIGARD EXPECTED SERVICE AREA City overview / Background Incorporated in 1961, the has experienced rapid growth over the years. This growth can be attributed to many factors, primarily the close
TRANSIT SUPPORTIVE DEVELOPMENT ANALYSIS
 7 TRANSIT SUPPORTIVE DEVELOPMENT ANALYSIS One of the key comments heard over and over through the public involvement process was that the region needs a more robust transit system to provide a viable alternative
Proposed Comprehensive Plan Strategies DRAFT for discussion June 28, 2017
 Proposed Comprehensive Plan Strategies DRAFT for discussion June 28, 2017 Land Use Rural Areas Refine the Farm and Forest area (FF) Update FF boundaries to account for existing lots less than five acres
D-O LRT Zoning Discussion. Chapel Hill Boards & Commissions October 16, 2017
 D-O LRT Zoning Discussion Chapel Hill Boards & Commissions October 16, 2017 Update on Overall D-O LRT Station Area Initiative Objectives Design and educate on principles of Good Transit-Oriented Development
IMPLEMENTATION STRATEGIES. In This Chapter. Goals & Strategies 182 Project List 183 Future Land Use 186 CHAPTER 11 IMPLEMENTATION STRATEGIES
 In This Chapter Goals & Strategies 182 Project List 183 Future Land Use 186 11 IMPLEMENTATION STRATEGIES NORTH AUGUSTA, SC 2017 COMPREHENSIVE PLAN 179 Individual commitment to a group effort that is what
TRANSIT ORIENTED DEVELOPMENT PINELLAS COUNTY MPO LIVABLE COMMUNITIES INITIATIVE PINELLAS COUNTY COMPREHENSIVE PLAN AMENDMENTS
 PINELLAS COUNTY MPO LIVABLE COMMUNITIES INITIATIVE MODEL LAND DEVELOPMENT CODE TRANSIT ORIENTED DEVELOPMENT PINELLAS COUNTY COMPREHENSIVE PLAN AMENDMENTS MPO Livable Communities Initiative Goal: Improve
Overview of the Plan. The Building Blocks of Centers, Neighborhoods and Network INTERNAL DRAFT
 Overview of the Plan 4 East Davidson Ramah Church Rd June Washam Rd Bradford District Park Bradford Shearer Rd Campus District NC 73 Davidson-Concord North Rocky River This Master Plan projects an approximate
Plano Tomorrow Vision and Policies
 Plano Tomorrow Vision and Policies PLANO TOMORROW PILLARS The Built Environment The Social Environment The Natural Environment The Economic Environment Land Use and Urban Design Transportation Housing
Strategic Growth Area #1 Northampton Boulevard Corridor Area
 Strategic Growth Area #1 Northampton Boulevard Corridor Area Description Strategic Growth Area #1 has established itself as a major employment center in Southside Hampton Roads. Opportunities exist to
TOWN COUNCIL / PLANNING COMMISSION
 Workshop #3 TOWN COUNCIL / PLANNING COMMISSION January 20, 2011 Consultant Team In Attendance Tonight BMS Design Group Nevada City and San Francisco Michael Smiley, AICP, ASLA Partner-in-Charge Nancy L.
Michigan City Alternative Analysis Realignment Study. Progress Status Update Report Presentation to City Council February 1, 2012
 Michigan City Alternative Analysis Realignment Study Progress Status Update Report Presentation to City Council Project Web Site Project Web Site is Active www. emichigancity.com Click on NICTD logo at
Olde Towne Vision Plan
 Olde Towne Vision Plan Introduction In 2016, the City of Bellevue will complete its move of City offices from Olde Towne Bellevue to its new municipal complex on Wall Street. The City intends to sell its
December 1, 2014 (revised) Preliminary Report -- Thomas Jefferson Site Evaluation
 Preliminary Report -- Thomas Jefferson Site Evaluation") December 1, 2014 (revised) TO: FROM: RE Arlington County Board Thomas Jefferson Site Evaluation Working Group by Carrie Johnson, Chair Preliminary Report -- Thomas Jefferson Site Evaluation The Thomas
December 1, 2014 (revised) TO: FROM: RE Arlington County Board Thomas Jefferson Site Evaluation Working Group by Carrie Johnson, Chair Preliminary Report -- Thomas Jefferson Site Evaluation The Thomas
2. Form and Character. 2.1 Introduction. 2.2 The Downtown Addition Plan. 2.1 Introduction
 2.1 Introduction 2.1 Introduction This section of the Specific Plan describes and illustrates the desired form, character and uses of the Downtown Addition and explains the underlying design principles.
Dwelling Units Max 12 dwelling units per acre/min 8 dwelling units per acre. Development Mix 80% non residential/20% residential
 13. OSTEEN LOCAL PLAN Background: The Osteen Local Plan area is located in southwest Volusia County along the SR 415 corridor between Lemon Bluff Road and Acorn Lake Road and includes 3,990 acres. The
Small Area Plan. South Gateway
 Small Area Plan Adopted May 12, 2008 South Gateway Purpose. The South Gateway Small Area Plan defines the City s expectations for the future of the southern entrance to the City at Interstate 85 and Highway
Urban Development Areas Frederick County
 18 Urban Development Areas Frederick County UDA Needs Profile: All UDAs Frederick County, Virginia's northernmost county has two UDA s, surrounded by the City of Winchester and located adjacent to the
1.0 Future Land Use. 1.1 Introduction. 1.2 Future Land Use Objectives
 1.0 Future Land Use 1.1 Introduction Can Holly Springs continue to accommodate significant growth while retaining and enhancing a Village-like atmosphere? Can enough commercial land be set aside for business
Staff Report to the North Ogden City Planning Commission
 Staff Report to the North Ogden City Planning Commission SYNOPSIS / APPLICATION INFORMATION Application Request: Concept review on a legislative application to rezone land located at approximately 1750
FUNDING CORRIDOR REVITALIZATION
 FUNDING CORRIDOR REVITALIZATION Integrated corridor planning for the 21 st Century America Planning Association Annual Conference Atlanta, GA April 27, 2014 Mariia Zimmerman, MZ Strategies, LLC mariia@mzstrategies.com
Executive Summary. NY 7 / NY 2 Corridor
 Executive Summary NY 7 / NY 2 Corridor Transportation and Land Use Study December 2005 Prepared for: Town of Colonie Capital District Transportation Committee Prepared by: Introduction: Land use decisions
PLAN ELEMENTS WORKSHOP. April 5, 2016
 PLAN ELEMENTS WORKSHOP April 5, 2016 needs more housing. But there is no one-size fits-all solution. Every neighborhood has its own character. In some places, density is not only appropriate it is badly
BROOKHILL NEIGHBORHOOD MODEL ZONING MAP AMENDMENT PREFACE TO APPLICATION
 BROOKHILL NEIGHBORHOOD MODEL ZONING MAP AMENDMENT PREFACE TO APPLICATION June 15, 2015 Revised: August 1, 2016 I. VISION Brookhill is a proposed community based upon the principles of Albemarle County
Northern Territory Compact Urban Growth Policy
 Northern Territory Compact Urban Growth Policy A Reference Policy Document to clause 2.7 (Reference to Policy) of the NT Planning Scheme May 2015 Table of Contents 1 Policy Setting... 3 1.1 Context for
Realities and Assets in an In-Town Shopping Center
 SUSTAIN SOUTHERN MAINE MILL CREEK PILOT LESSONS LEARNED April 15, 2013 Realities and Assets in an In-Town Shopping Center 1. An older shopping district that was laid out in a low-density, strip center
1 Adapted from the Statewide Transit-Oriented Development Study by CalTrans, 2006
 APPENDIX C: LAND USE PLANNING FOR ENHANCED RAIL SERVICE 72 BACKGROUND One of the consistent themes heard from localities in the Route 29 corridor Planning Forums was the need for expanding rail service
ITEM #8. Regional Smart Growth Program. Regional Smart Growth Program. Presentation Overview. Coast Highway Vision and Stategic Plan.
 Regional Smart Growth Program Economic Development Commission What is Smart Growth? Adopted as part of the Regional Comprehensive Plan (RCP) RCP provides vision for region based on Smart Growth and sustainability
CITY OF CHARLOTTESVILLE, VIRGINIA CITY COUNCIL AGENDA
 CITY OF CHARLOTTESVILLE, VIRGINIA CITY COUNCIL AGENDA Agenda Date: December 16, 2013 Action Required: Adoption of Resolution Presenter: Staff Contacts: Title: James E. Tolbert, AICP, Director of NDS James
Rio/29 Small Area Plan. Design Plan & Implementation Framework Open House - January 25, 2018
 Rio/29 Small Area Plan Design Plan & Implementation Framework Open House - January 25, 2018 MEETING PURPOSE PRESENTATION 1. Orient to the updated design plans 2. Introduce implementing options 3. Explain
9 th Street Sub Area Plan
 9 th Street Sub Area Plan In the 1990 s, when the Township prepared the last Master Plan, the 9 th Street corridor was studied as part of a larger 9 th Street Focus Area that included the West Main Street
Land Use. Hardware Street Vendor Mixed-Use
 Land Use Definition Land Use is the way a piece of real estate is utilized. Existing, proposed, and adopted land uses all play a role in the planning process. Once a land use plan is adopted, the next
Regency Developments. Urban Design Brief. Holyrood DC2 Rezoning
 Regency Developments Urban Design Brief Holyrood DC2 Rezoning Stantec Consulting Ltd. 7-31-2017 1. Overview Regency Developments intends to rezone the lands located at 8510 and 8511 93 Avenue, within the
DOMINION BOULEVARD CORRIDOR STUDY AND ECONOMIC DEVELOPMENT STRATEGIC PLAN A MODEL FOR CHESAPEAKE S FUTURE
 DOMINION BOULEVARD CORRIDOR STUDY AND ECONOMIC DEVELOPMENT STRATEGIC PLAN A MODEL FOR CHESAPEAKE S FUTURE Overview I. Draft Plan Process II. Draft Plan Overview a. Market Analysis b. Master Land Use Plan
2.0 AREA PLANS. Lakeside Business District. Lakeside Business District Land Use Categories:
 Lakeside Business District Lakeside Business District Land Use Categories: Campus Commercial Campus Commercial means a mixture of uses which includes corporate offices, office parks, hotels, commercial,
COLVER ROAD INDUSTRIAL CONCEPT PLAN
 COLVER ROAD INDUSTRIAL CONCEPT PLAN A CONCEPTUAL LAND USE AND TRANSPORTATION PLAN FOR TA-4 AN URBAN RESERVE AREA OF THE CITY TALENT City of Talent Adopted by City Council Resolution No., June, 2015 PART
TREASURE COAST REGIONAL PLANNING COUNCIL M E M O R A N D U M. To: Council Members AGENDA ITEM 5H
 TREASURE COAST REGIONAL PLANNING COUNCIL M E M O R A N D U M To: Council Members AGENDA ITEM 5H From: Date: Subject: Staff October 17, 2008 Council Meeting Local Government Comprehensive Plan Review Draft
Windsor Locks Transit-Oriented Development Planning Grant Request. Project Background
 Windsor Locks Transit-Oriented Development Planning Grant Request Project Background Downtown Windsor Locks runs along Main Street in the vicinity of the intersection of Routes 159 and 140. The current
Subregion 4 Central Avenue-Metro Blue Line Corridor Transit-Oriented Development (TOD) Implementation Project. Community Meeting April 27, 2011
 Implementation Project. Community Meeting April 27, 2011") Subregion 4 Central Avenue-Metro Blue Line Corridor Transit-Oriented Development (TOD) Implementation Project Community Meeting April 27, 2011 Overview Introduction to Subregion 4 TOD Implementation Program
Subregion 4 Central Avenue-Metro Blue Line Corridor Transit-Oriented Development (TOD) Implementation Project Community Meeting April 27, 2011 Overview Introduction to Subregion 4 TOD Implementation Program
Town Center. Block 5 Existing multifamily residential units are expected to remain.
 Area Guidelines Germantown s districts should be developed as distinct communities with unique features that are supported through the guidelines. The guidelines not only help distinguish these districts
REVIEW AND EVALUATION OF REGIONAL LAND USE
 REVIEW AND EVALUATION OF REGIONAL LAND USE AND TRANSPORTATION SCENARIOS #220831 Environmental Justice Task Force October 7, 2014 VISION 2050 Process Development of Guiding Vision for Land Use and Transportation
Port Lavaca Future Land Use
 Port Lavaca Future Land Use Introduction The City of Port Lavaca is beginning to see sustained growth, after many years of relative stable population. New single family homes, apartments, and businesses
ESTABLISH AN EFFICIENT TOWN CENTER
 ESTABLISH AN EFFICIENT TOWN CENTER 4 Overview Lisbon residents are proud of the history of Newent and at the same time recognize its current importance as a centralized location for a variety of municipal
HE VISION. Building a Better Connected Place
 HE VISION Building a Better Connected Place WALK INTO THE FUTURE. Life in Cranberry, 2030 Here s what our residents told us they wanted to see in their community by 2030: The Cranberry of 2030 is a place
3. VISION AND GOALS. Vision Statement. Goals, Objectives and Policies
 Vision Statement Queen Creek s interconnected network of parks, trails, open spaces and recreation opportunities provide safe and diverse activities and programs that sustain its unique, small town, equestrian
3.0 PROJECT DESCRIPTION
 3.0 PROJECT DESCRIPTION 3.1 BACKGROUND Under California law (Government Code Section 65300 et seq.), every city and county is required to have a general plan. The general plan is to be comprehensive and
A BLUEPRINT FOR BROCKTON A CITY-WIDE COMPREHENSIVE PLAN
 A BLUEPRINT FOR BROCKTON A CITY-WIDE COMPREHENSIVE PLAN Public Meeting October 2016 1 Plan Summary and Discussion Public Meeting May 4 2017 City of Brockton Bill Carpenter, Mayor Department of Planning
Midtown Greenway Land Use and Development Plan Executive Summary
 Midtown Greenway Land Use and Development Plan Executive Summary Introduction The Midtown Greenway Land Use and Development Plan sets policy direction for land use and development in the Midtown Greenway
Ten Mile Creek Planning Area
 PLANNING AREA POLICIES TEN MILE CREEK Ten Mile Creek Planning Area Location and Context The Ten Mile Creek Planning Area ( Ten Mile Creek area ) is located south of the current Boise AOCI, generally south
SPRINGHILL LAKE TRANSIT VILLAGE
 Greenbelt Metro Area Sector Plan - Subarea Design Policies and Guidelines - Springhill Lake Transit Village 113 SPRINGHILL LAKE TRANSIT VILLAGE Residential Neighborhood and Village Center CONCEPT Springhill
4-Town Comprehensive Plan DRAFT 7/30/07
 4-Town Comprehensive Plan DRAFT 7/30/07 Acknowledgements ning Committee Town of Harrisburg Norman Roof Randy Nicol Town of Martinsburg Terry Thisse Paul Kelly Town of Montague Jan Bagdanowicz Wendy Perry
City Center Specific Plan Amendments And Background Report City of Richmond. PLANNING COMMISION FINAL DRAFT January, 2001
 City Center Specific Plan Amendments And Background Report City of Richmond PLANNING COMMISION FINAL DRAFT January, 2001 TABLE OF CONTENTS Page LIST OF TABLES... LIST OF FIGURES... INDEX... OVERVIEW...
URBAN DESIGN BRIEF URBAN DESIGN BRIEF 721 FRANKLIN BLVD, CAMBRIDGE August 2018
 URBAN DESIGN BRIEF URBAN DESIGN BRIEF 721 FRANKLIN BLVD, CAMBRIDGE August 2018 DESIGN BRIEF CONTENTS PART A 1.0 INTRODUCTION 2.0 DESCRIPTION & ANALYSIS OF SITE CONTEXT 3.0 DESIGN CONSTRAINTS AND OPPORTUNITIES
BUILDER LOTS FOR SALE
 BUILDER LOTS FOR SALE NORTHERN CULPEPER - 135 ACRES RESIDENTIAL DEVELOPMENT 1256 Old Bridge Road, Amissville, VA 20106 SALE PRICE: $995,000 LOT SIZE: 135+ Acres APN #: Tax Map 2 Parcel 23 ZONING: R-1 ACCESS:
A Plan for the Heart of the Region: Tukwila, WA
 : Tukwila, WA 1 The Plan orchestrates the Restructuring of a 1,000-acre Regional Shopping Area into a Social and Symbolic for the Region. REGIONAL CONTEXT Downtown Seattle (Metropolitan ) 20 miles Bellevue
Wasatch CHOICE for 2040
 Wasatch CHOICE for 2040 Economic Opportunities We Can Choose a Better Future We enjoy an unparalleled quality of life along the Wasatch Front. People from all over the world are drawn to our stunning scenery,
Silver Line CPAM UPDATE. Transportation and Land Use Committee October 14, 2016
 Silver Line CPAM UPDATE Transportation and Land Use Committee October 14, 2016 Purpose Recap Project History and Map Changes Provide Overview of CPAM Components Discuss Transportation Impacts Discuss Fiscal
Corridor Vision. 1Pursue Minnehaha-Hiawatha Community Works Project. Mission of Hennepin County Community Works Program
 1Pursue Minnehaha-Hiawatha Community Works Project Minnehaha-Hiawatha Community Works is a project within the Hennepin Community Works (HCW) program. The mission of the HCW program is to enhance how the
Vision Statement for the Town of Flower Mound Master Plan The Town of Flower Mound Master Plan furthers the established community based vision to:
 Vision Statement for the The furthers the established community based vision to: Preserve the country atmosphere and natural environment that makes Flower Mound a unique and desirable community; Mitigate
Transportation. Strategies for Action
 Transportation A major priority for the Overlake Neighborhood is to develop a multimodal transportation system. To achieve this system, a balance has to be found among travel, circulation and access needs;
OVERVIEW OF PLANS FOR THE JEFFERSON COUNTY COUNTRYSIDE FARM In the Context of Quality Place Characteristics
 OVERVIEW OF PLANS FOR THE JEFFERSON COUNTY COUNTRYSIDE FARM In the Context of Quality Place Characteristics By Steve Grabow, Professor and Community Development Educator University of Wisconsin-Extension,
RESOLUTION NO. R Refining the route, profile and stations for the Downtown Redmond Link Extension
 RESOLUTION NO. R2018-32 Refining the route, profile and stations for the Downtown Redmond Link Extension MEETING: DATE: TYPE OF ACTION: STAFF CONTACT: Capital Committee Board PROPOSED ACTION 09/13/2018