Division of Fire Safety. State of New Jersey Department of Community Affairs FIRE IN NEW JERSEY
|
|
|
- Clarence Shelton
- 6 years ago
- Views:
Transcription


1 Division of Fire Safety State of New Jersey Department of Community Affairs FIRE IN NEW JERSEY 2006
2 Cover photograph courtesy of Rodman Meyer
3 DEDICATION We honor the firefighters who selflessly gave their lives to protect the citizens of their communities. Edward Marbet Burlington Township Fire Department Robert Ockie Wisting Rio Grande Fire Company # 1 Kevin A. Apuzzio East Franklin Volunteer Fire Department Vincent R. Neglia North Hudson Regional Fire & Rescue Department Thomas J. Van Liew New Brunswick Fire Department
4

5 FIRE IN NEW JERSEY 2006 DIVISION OF FIRE SAFETY Lawrence Petrillo, Director/State Fire Marshal PREPARED BY: Heather Puskar, Supervisor Fire Incident Reporting Unit New Jersey Division of Fire Safety P.O. Box 809 Trenton, New Jersey (609)


6 CONGRATULATIONS TO THE FOLLOWING COUNTIES FOR 100% PARTICIPATION BURLINGTON CAMDEN CAPE MAY GLOUCESTER HUDSON MERCER PASSAIC SALEM 6
7 TABLE OF CONTENTS NFIRS CONTACT INFORMATION 8 REPORT CONTENTS 9 NEW CATEGORY INFORMATION 10 FAST STATS 11 FIRE DEPARTMENT RESPONSES 12 RESPONSES BY COUNTY 13 PROPERTY USE INCIDENT TOTALS BY COUNTY 34 INCIDENT TYPES WITH PROPERTY/CONTENTS LOSS/VALUE 37 FREQUENCY OF INCIDENT TYPES BY MONTH 40 FIRES BY TYPE 76 STRUCTURE FIRES BY MONTH 76 STRUCTURE FIRES BY DAY OF WEEK 76 FACTORS CONTRIBUTING TO IGNITION 77 FIRE SUPPRESSION FACTORS 77 STRUCTURE FIRES BY PROPERTY TYPE 78 RESIDENTIAL FIRES 79 HEAT SOURCES OF RESIDENTIAL FIRES 80 DORMITORY FIRES AREA OF FIRE ORIGIN 84 CAUSE OF IGNITION 88 DETECTOR PRESENCE & PERFORMANCE 92 CIVILIAN FIRE FATALITIES 98 CIVILIAN FIRE INJURIES 102 FIREFIGHTER INJURIES & FATALITIES 104 SCHOOL FIRES 107 VEHICLE FIRES 112 HAZARDOUS MATERIALS RELEASES 114 WILDLAND FIRES 116 SPECIAL STUDIES 118 INVESTIGATION UNIT STATISTICAL REPORT 119 FIRE DEPARTMENT PARTICIPATION 120 COUNTY REPORTING PERCENTAGES
8 NFIRS CONT ONTACT INFORMATION NFIRS staff is available to assist fire departments with NFIRS training and technical support. Please feel free to contact your NFIRS Field Representative. Heather Puskar, Supervisor (609) Frederick Connin, Field Representative (609) Fred assists fire departments Statewide. Ronald Svrchek, Field Representative (609) Ron assists fire departments in Bergen, Essex, Hudson, Middlesex, Morris, Passaic, Somerset, Sussex, Union, and Warren County. Steven Hearn, Field Representative (609) Steve assists fire departments in Atlantic, Burlington, Camden, Cape May, Cumberland, Gloucester, Hunterdon, Mercer, Monmouth, Ocean, and Salem County. Sonia Salva, Technical Support Specialist (609) Sonia receives NFIRS files from fire departments and processes the files into the State and Federal NFIRS databases. Sonia also calculates reporting percentages, population percentages, and manages the State NFIRS database. This report would not be possible without the hard work, support and dedication of the NFIRS staff. 8
9 REPORT CONTENTS The data presented in this report is representative of the incident data that has been submitted to the Division of Fire Safety s NFIRS Unit. Data received has been processed into the State and Federal databases. Please refer to pages 120 through 138 to see if your fire department has contributed to the information in this report. Based upon incidents received, New Jersey fire departments responded to 397,945 incidents in Data submission is broken down as follows: Of the 745 fire departments in the state, 719 (96%) submitted data. Note: 25 fire departments submitted less than six months of data. 26 fire departments did not submit any data. The number of fire departments in the state differs from 2005 due to the merging of two departments in Somerset County (East Franklin Twp. Fire Co. and Community Vol. Fire Co. #1). Data in this report does not include military installation fire department data. Military installation fire departments report directly to the Department of Defense. All of the charts included in this report are based on 2006 totals unless otherwise specified. 99
10 NEW CATEGORY ADDED Please note, a new category has been added in some charts called Information Not Provided By FD. Our intent with adding this category is to draw attention to the fact that information has not been entered in certain incident report fields. These fields have been left blank by the reporting fire department. If this information had been provided there would be a more accurate picture of the fire problem in New Jersey. The new category can be found in the charts on the following pages: Dormitory Fires Pages 82 to 83 Area Of Fire Origin Pages 84 to 87 Cause Of Ignition Page 88 Detector Presence And Performance Pages 92 to 97 Civilian Fire Fatalities Page 99 Civilian Fire Injuries Pages 102 to 103 Firefighter Injuries And Fatalities Pages 105 to 106 Vehicle Fires Pages 112 to 113 Hazardous Materials Releases Pages 114 to
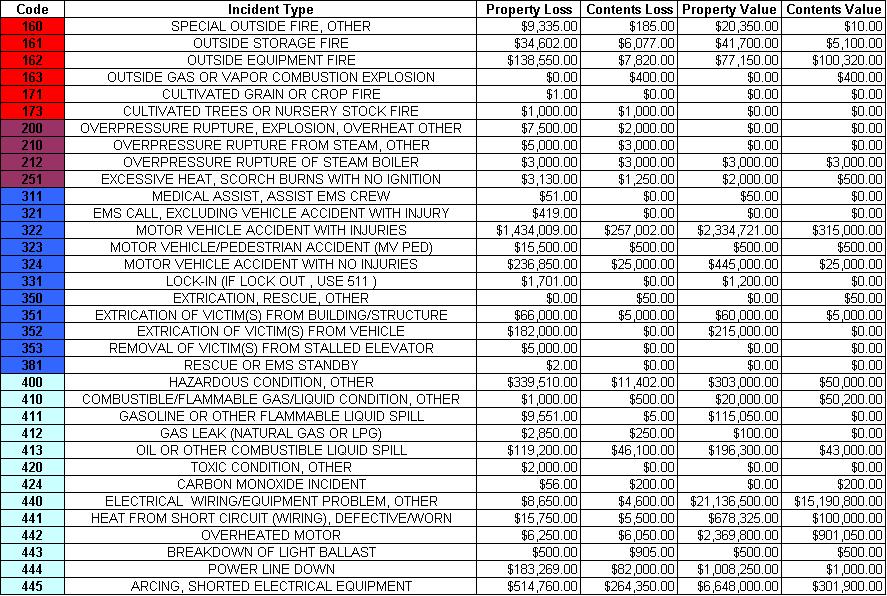
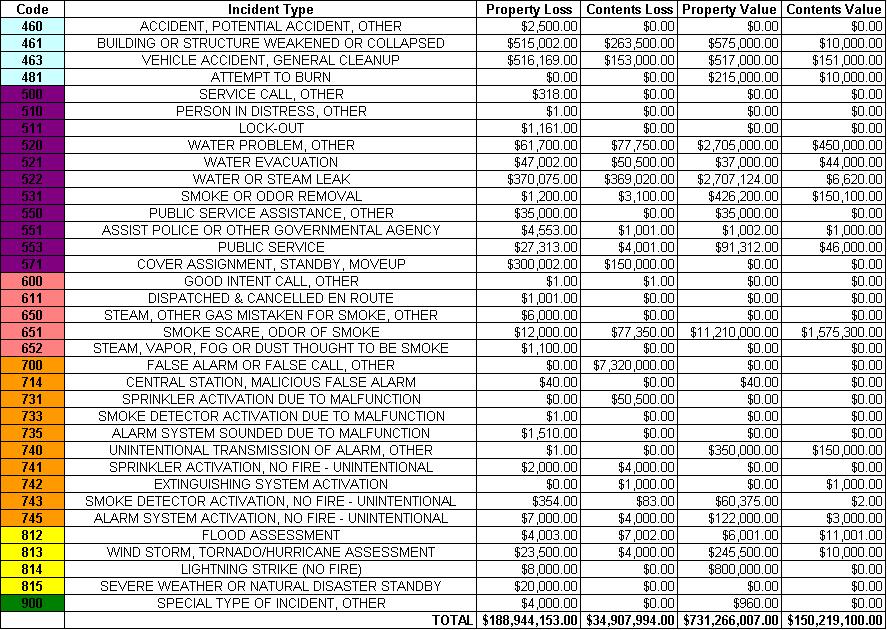
11 FAST STATS TS for firefighters died in the line of duty. (Pg. 104) 75 civilians lost their lives as the result of fire. (Pg. 98) 920 firefighters were injured responding to emergency incidents. (Pg 105) 477 civilians were injured as a result of fire. (Pg. 102) 70 percent of all civilian fire fatalities occurred in residential properties. (Pg. 98) 46,499 fires were reported. (Pg. 12) 78 percent of all structure fires involved residential properties. (Pg. 78) 62 percent of residential fires occurred in 1 or 2 family dwellings. (Pg. 79) 330 fires were intentionally set in residential properties. (Pg. 88) 80 percent of all vehicle fires involved passenger vehicles. (Pg. 112) 12 civilian fire fatalities occurred in passenger vehicles. (Pg. 113) 111 vehicle fires were intentionally set. (Pg. 113) 1,667 acres burned. (Pg. 116) 528 school fires were reported. (Pg. 107) 12 percent of all incidents were fire incidents. (Pg. 12) Total reported property loss was $188,944, (Pg. 39) 11
12 FIRE DEPAR ARTMENT RESPONSES The following charts represent the number of incidents that fire departments responded to in Incident Type Summary False Alarm 111,501 28% Weather 1,985 0% 3,363 1% Fire 46,499 12% Explosion/Overpressure - No Fire 1,868 0% EMS 89,961 23% Good Intent 39,872 10% Service 47,387 12% Hazardous Condition 55,509 14% Incident types Incident types, which are entered and reported to the Division of Fire Safety s NFIRS Unit, include structure fires, vehicle fires, trash fires, hazardous materials incidents, false alarms, and various special emergencies. Total Incidents ATLANTIC BERGEN BURLINGTON CAMDEN CAPE MAY CUMBERLAND ESSEX GLOUCESTER HUDSON HUNTERDON MERCER MIDDLESEX MONMOUTH MORRIS OCEAN PASSAIC SALEM SOMERSET SUSSEX UNION WARREN
13 Responses by County The following charts show the breakdown of incident type responses by category in each county. Incidents by Time of Day Atlantic County Noon to 4 P.M. 24% 4 A.M. to 8 A.M. 9% 4 P.M. to 8 P.M. 22% Midnight to 4 A.M. 8% 8 P.M. to Midnight 15% 8 A.M. to Noon 22% Incidents by Month Jan 1133 Feb 1075 Mar 1071 Apr 1129 May 1121 Jun 1100 Jul 1209 Aug 1266 Sep 1332 Oct 1114 Nov 992 Dec 1077 Incident Total Atlantic County Participation Percentage Participating FDs 90% 39/43 Total FDs Incident Type Responses by Category Atlantic County Incidents by Day Of Week Sun 1952 Mon 2059 Tue 1873 Wed 1901 Thu 1805 Fri 2197 Sat 1832 Incident Total W eather 34 Service Hazardous Condition 1902 Good Intent 1121 Fire 1614 False Alarm 2790 Explosion/Overpressure-No Fire 55 EMS
14 Incidents by Time of Day Bergen County 4 A.M. to 8 A.M. 8% Noon to 4 P.M. 24% 4 P.M. to 8 P.M. 23% Midnight to 4 A.M. 7% 8 P.M. to Midnight 15% 8 A.M. to Noon 23% Incidents by Month Jan 2950 Feb 2444 Mar 2728 Apr 2689 May 2875 Jun 3012 Jul 3222 Aug 3182 Sep 3485 Oct 3005 Nov 2548 Dec 2574 Incident Total Bergen County Participation Percentage Participating FDs 95% 67/70 Total FDs Incidents by Day Of Week Sun 4271 Mon 4906 Tue 5155 Wed 5376 Thu 5030 Fri 5217 Sat 4759 Incident Total Incident Responses by Category Bergen County Weather 237 Service Hazardous Condition 5255 Good Intent 2549 Fire 3612 False Alarm Explosion/Overpressure-No Fire 175 EMS
15 Noon to 4 P.M. 23% Incidents by Time of Day Burlington County 4 A.M. to 8 A.M. 10% 4 P.M. to 8 P.M. 23% Midnight to 4 A.M. 7% 8 P.M. to Midnight 16% 8 A.M. to Noon 21% Incidents by Month Jan 1890 Feb 1823 Mar 1916 Apr 1979 May 1883 Jun 2443 Jul 2506 Aug 2060 Sep 1979 Oct 2026 Nov 1902 Dec 1981 Incident Total Burlington County Participation Percentage Participating FDs 100% 50/50 Total FDs Incidents by Day Of Week Sun 3177 Mon 3247 Tue 3465 Wed 3404 Thu 3736 Fri 3945 Sat 3414 Incident Total Incident Type Responses by Category Burlington County Weather 108 Service Hazardous Condition 4180 Good Intent 3785 Fire 3200 False Alarm 5254 Explosion/Overpressure-No Fire 81 EMS
16 Noon to 4 P.M. 23% Incidents by Time of Day Camden County 4 A.M. to 8 A.M. 10% 4 P.M. to 8 P.M. 23% Midnight to 4 A.M. 8% 8 P.M. to Midnight 16% 8 A.M. to Noon 20% Incidents by Month Jan 2711 Feb 2571 Mar 2693 Apr 2585 May 2708 Jun 3071 Jul 3156 Aug 3098 Sep 2725 Oct 2755 Nov 2567 Dec 2604 Incident Total Camden County Participation Percentage Participating FDs 100% 45/45 Total FDs Incidents by Day Of Week Sun 4434 Mon 4737 Tue 4750 Wed 4927 Thu 4803 Fri 5018 Sat 4575 Incident Total Incident Type Responses by Category Camden County Weather 214 Service Hazardous Condition 4452 Good Intent 4107 Fire 4379 False Alarm 7778 Explosion/Overpressure-No Fire 80 EMS
17 Noon to 4 P.M. 23% Incidents by Time of Day Cape May County 4 A.M. to 8 A.M. 9% 4 P.M. to 8 P.M. 21% Midnight to 4 A.M. 10% 8 P.M. to Midnight 17% 8 A.M. to Noon 20% Incidents by Month Jan 662 Feb 640 Mar 590 Apr 658 May 861 Jun 1053 Jul 1373 Aug 1285 Sep 1059 Oct 802 Nov 650 Dec 655 Incident Total Cape May County Participation Percentage Participating FDs 100% 26/26 Total FDs Incidents by Day Of Week Sun 1586 Mon 1438 Tue 1351 Wed 1274 Thu 1331 Fri 1580 Sat 1728 Incident Total Incident Type Responses by Category Cape May County Weather 39 Service Hazardous Condition 1353 Good Intent 456 Fire 815 False Alarm 2020 Explosion/Overpressure-No Fire 28 EMS
18 Incidents by Time of Day C um berland C ounty Noon to 4 P.M. 23% 4 A.M. to 8 A.M. 9% 4 P.M. to 8 P.M. 24% Midnight to 4 A.M. 8% 8 P.M. to Midnight 15% 8 A.M. to Noon 21% Incidents by Month Jan 473 Feb 469 Mar 517 Apr 442 May 562 Jun 548 Jul 584 Aug 514 Sep 521 Oct 463 Nov 508 Dec 466 Incident Total 6067 Cumberland County Participation Percentage Participating FDs 96% 24/25 Total FDs Incidents by Day Of Week Sun 929 Mon 797 Tue 845 Wed 868 Thu 809 Fri 907 Sat 912 Incident Total 6067 Incident Type Responses by Category Cumberland County Weather 18 Service Hazardous Condition 1084 Good Intent 790 Fire 1129 False Alarm 1654 Explosion/Overpressure-No Fire 27 EMS
19 Noon to 4 P.M. 23% Incidents by Time of Day Essex County 4 A.M. to 8 A.M. 8% 4 P.M. to 8 P.M. 21% Midnight to 4 A.M. 8% 8 P.M. to Midnight 16% 8 A.M. to Noon 24% Incidents by Month Jan 3275 Feb 3183 Mar 3341 Apr 3076 May 3133 Jun 3290 Jul 3631 Aug 3365 Sep 3187 Oct 3546 Nov 3089 Dec 3231 Incident Total Essex County Participation Percentage Participating FDs 95% 20/21 Total FDs Incidents by Day Of Week Sun 4950 Mon 5570 Tue 5880 Wed 5969 Thu 5715 Fri 5882 Sat 5381 Incident Total Incident Type Responses by Category Essex County Weather 301 Service Hazardous Condition 5135 Good Intent 2989 Fire 4101 False Alarm Explosion/Overpressure-No Fire 304 EMS
20 Incidents by Time of Day Gloucester County Noon to 4 P.M. 23% 4 A.M. to 8 A.M. 11% 4 P.M. to 8 P.M. 23% Midnight to 4 A.M. 7% 8 P.M. to Midnight 16% 8 A.M. to Noon 20% Incidents by Month Jan 944 Feb 941 Mar 978 Apr 970 May 786 Jun 1064 Jul 1200 Aug 987 Sep 999 Oct 898 Nov 782 Dec 807 Incident Total Gloucester County Participation Percentage Participating FDs 100% 38/38 Total FDs Incidents by Day Of Week Sun 1628 Mon 1544 Tue 1687 Wed 1626 Thu 1586 Fri 1742 Sat 1543 Incident Total Incident Type Responses by Category Gloucester County Weather 98 Service Hazardous Condition 1660 Good Intent 2090 Fire 2041 False Alarm 2430 Explosion/Overpressure-No Fire 45 EMS
21 Noon to 4 P.M. 23% Incidents by Time of Day Hudson County 4 A.M. to 8 A.M. 9% 4 P.M to 8 P.M. 21% Midnight to 4 A.M. 9% 8 P.M. to Midnight 18% 8 A.M. to Noon 20% Incidents by Month Jan 3652 Feb 3282 Mar 3156 Apr 3288 May 3600 Jun 3617 Jul 3622 Aug 3477 Sep 2435 Oct 2637 Nov 2304 Dec 2464 Incident Total Hudson County Participation Percentage Participating FDs 100% 8/8 Total FDs Incidents by Day Of Week Sun 5130 Mon 5506 Tue 5247 Wed 5441 Thu 5270 Fri 5556 Sat 5384 Incident Total Incident Type Responses by Category Hudson County Weather 41 Service Hazardous Condition 4338 Good Intent 2293 Fire 2951 False Alarm 8316 Explosion/Overpressure-No Fire 75 EMS

22 Incidents by Time of Day Hunterdon County Noon to 4 P.M. 24% 4 A.M. to 8 A.M. 11% 4 P.M. to 8 P.M. 24% M idnight to 4 A.M. 7% 8 P.M. to Midnight 13% 8 A.M. to Noon 21% Incidents by Month Jan 377 Feb 345 Mar 509 Apr 386 May 354 Jun 485 Jul 504 Aug 378 Sep 382 Oct 377 Nov 311 Dec 406 Incident Total 4814 Hunterdon County Participation Percentage Participating FDs 96% 26/27 Total FDs Incidents by Day Of Week Sun 550 Mon 637 Tue 702 Wed 704 Thu 700 Fri 772 Sat 749 Incident Total 4814 Incident Type Responses by Category Hunterdon County Weather 50 Service Hazardous Condition 747 Good Intent 902 Fire 895 False Alarm 1302 Explosion/Overpressure-No Fire 22 EMS
23 Noon to 4 A.M. 24% Incidents by Time of Day Mercer County 4 A.M. to 8 A.M. 9% 4 P.M. to 8 P.M. 22% Midnight to 4 A.M. 8% 8 P.M. to Midnight 15% 8 A.M. to Noon 22% Incidents by Month Jan 1624 Feb 1521 Mar 1746 Apr 1621 May 1671 Jun 1760 Jul 2065 Aug 1659 Sep 1428 Oct 1856 Nov 1723 Dec 1614 Incident Total Mercer County Participation Percentage Participating FDs 100% 26/26 Total FDs Incidents by Day Of Week Sun 2728 Mon 2947 Tue 2924 Wed 2838 Thu 2843 Fri 3166 Sat 2842 Incident Total Incident Type Responses by Category Mercer County Weather 45 Service Hazardous Condition 2036 Good Intent 3521 Fire 2555 False Alarm 5439 Explosion/Overpressure-No Fire 111 EMS
24 Noon to 4 P.M. 24% Incidents by Time of Day Middlesex County 4 A.M. to 8 A.M. 9% 4 P.M. to 8 P.M. 23% Midnight to 4 A.M. 8% 8 P.M. to Midnight 15% 8 A.M. to Noon 21% Incidents by Month Jan 2828 Feb 2691 Mar 2909 Apr 2855 May 2899 Jun 2952 Jul 2527 Aug 2511 Sep 2467 Oct 2499 Nov 2206 Dec 2150 Incident Total Middlesex County Participation Percentage Participating FDs 95% 46/48 Total FDs Incidents by Day Of Week Sun 4102 Mon 4507 Tue 4481 Wed 4545 Thu 4668 Fri 4856 Sat 4335 Incident Total Incident Type Responses by Category Middlesex County Weather 155 Service Hazardous Condition 4033 Good Intent 2660 Fire 3295 False Alarm 8618 Explosion/Overpressure-No Fire 111 EMS
25 Noon to 4 P.M. 23% Incidents by Time of Day Monmouth County 4 A.M. to 8 A.M. 9% 4 P.M. to 8 P.M. 22% Midnight to 4 A.M. 9% 8 P.M. to Midnight 16% 8 A.M. to Noon 21% Incidents by Month Jan 2029 Feb 2047 Mar 1978 Apr 2107 May 2072 Jun 2416 Jul 3019 Aug 2599 Sep 2059 Oct 1797 Nov 1461 Dec 1456 Incident Total Monmouth County Participation Percentage Participating FDs 98% 66/67 Total FDs Incidents by Day Of Week Sun 3440 Mon 3474 Tue 3475 Wed 3557 Thu 3523 Fri 3787 Sat 3784 Incident Total Incident Type Responses by Category Monmouth County Weather 115 Service Hazardous Condition 3994 Good Intent 2503 Fire 3155 False Alarm 8759 Explosion/Overpressure-No Fire 131 EMS
26 Incidents by Time of Day Morris County 4 A.M. to 8 A.M. 10% Noon to 4 P.M. 24% 4 P.M. to 8 P.M. 22% M idnight to 4 A.M. 6% 8 P.M. to Midnight 14% 8 A.M. to Noon 24% Incidents by Month Jan 1456 Feb 1190 Mar 1289 Apr 1284 May 1227 Jun 1328 Jul 1459 Aug 1373 Sep 1286 Oct 1296 Nov 1112 Dec 1202 Incident Total Morris County Participation Percentage Participating FDs 94% 52/55 Total FDs Incidents by Day Of Week Sun 1794 Mon 2251 Tue 2333 Wed 2434 Thu 2282 Fri 2424 Sat 1984 Incident Total Incident Type Responses by Category Morris County Weather 38 Service Hazardous Condition 2160 Good Intent 1750 Fire 1960 False Alarm 6002 Explosion/Overpressure-No Fire 59 EMS
27 Incidents by Time of Day Ocean County Noon to 4 P.M. 24% 4 A.M. to 8 A.M. 9% 4 P.M. to 8 P.M. 22% Midnight to 4 A.M. 9% 8 P.M. to Midnight 15% 8 A.M. to Noon 21% Incidents by Month Jan 1200 Feb 1228 Mar 1406 Apr 1273 May 1278 Jun 1433 Jul 1757 Aug 1720 Sep 1925 Oct 1303 Nov 1202 Dec 1216 Incident Total Ocean County Participation Percentage Participating FDs 95% 45/47 Total FDs Incidents by Day Of Week Sun 2279 Mon 2319 Tue 2392 Wed 2249 Thu 2455 Fri 2756 Sat 2491 Incident Total Incident Type Responses by Category Ocean County Weather 192 Service Hazardous Condition 3317 Good Intent 1706 Fire 2665 False Alarm 5064 Explosion/Overpressure-No Fire 78 EMS
28 Incidents by Time of Day Passaic County Noon to 4 P.M. 23% 4 A.M. to 8 A.M. 9% 4 P.M. to 8 P.M. 22% Midnight to 4 A.M. 8% 8 P.M. to Midnight 17% 8 A.M. to Noon 21% Incidents by Month Jan 1598 Feb 1418 Mar 1499 Apr 1529 May 1662 Jun 1682 Jul 2018 Aug 1681 Sep 1593 Oct 1582 Nov 1525 Dec 1445 Incident Total Passaic County Participation Percentage Participating FDs 100% 23/23 Total FDs Incidents by Day Of Week Sun 2516 Mon 2705 Tue 2812 Wed 2872 Thu 2659 Fri 2978 Sat 2690 Incident Total Incident Type Responses by Category Passaic County Weather 59 Service Hazardous Condition 2663 Good Intent 1950 Fire 2492 False Alarm 5602 Explosion/Overpressure-No Fire 187 EMS
29 Incidents by Time of Day Salem County Noon to 4 P.M. 22% 4 A.M. to 8 A.M. 10% 4 P.M. to 8 P.M. 26% Midnight to 4 A.M. 9% 8 P.M. to Midnight 16% 8 A.M. to Noon 17% Incidents by Month Jan 240 Feb 203 Mar 265 Apr 207 May 178 Jun 229 Jul 249 Aug 280 Sep 209 Oct 169 Nov 218 Dec 248 Incident Total 2695 Salem County Participation Percentage Participating FDs 100% 19/19 Total FDs Incidents by Day Of Week Sun 388 Mon 397 Tue 372 Wed 363 Thu 334 Fri 425 Sat 416 Incident Total 2695 Incident Type Responses by Category Salem County Weather 15 Service Hazardous Condition 190 Good Intent 463 Fire 577 False Alarm 694 Explosion/Overpressure-No Fire 8 EMS
30 Incidents by Time of Day Somerset County 4 A.M. to 8 A.M. 10% Noon to 4 P.M. 25% 4 P.M. to 8 P.M. 23% Midnight to 4 A.M. 6% 8 P.M. to Midnight 12% 8 A.M. to Noon 24% Incidents by Month Jan 1018 Feb 837 Mar 1039 Apr 984 May 974 Jun 947 Jul 1120 Aug 1007 Sep 933 Oct 976 Nov 847 Dec 791 Incident Total Somerset County Participation Percentage Participating FDs 88% 32/36 Total FDs Incidents by Day Of Week Sun 1192 Mon 1702 Tue 1748 Wed 1748 Thu 1782 Fri 1925 Sat 1376 Incident Total Incident Type Responses by Category Somerset County Weather 33 Service Hazardous Condition 1296 Good Intent 1160 Fire 1427 False Alarm 4180 Explosion/Overpressure-No Fire 52 EMS
31 Noon to 4 P.M. 26% Incidents by Time of Day Sussex County 4 A.M. to 8 A.M. 9% 4 P.M. to 8 P.M. 24% Midnight to 4 A.M. 7% 8 P.M. to Midnight 14% 8 A.M. to Noon 20% Incidents by Month Jan 385 Feb 320 Mar 354 Apr 358 May 307 Jun 406 Jul 356 Aug 310 Sep 283 Oct 344 Nov 243 Dec 328 Incident Total 3994 Sussex County Participation Percentage Participating FDs 92% 25/27 Total FDs Incidents by Day Of Week Sun 561 Mon 567 Tue 559 Wed 563 Thu 572 Fri 567 Sat 605 Incident Total 3994 Incident Type Responses by Category Sussex County Weather 23 Service Hazardous Condition 599 Good Intent 335 Fire 753 False Alarm 1135 Explosion/Overpressure-No Fire 16 EMS
32 Incidents by Time of Day Union County 4 A.M. to 8 A.M. 8% Noon to 4 P.M. 26% 4 P.M. to 8 P.M. 22% Midnight to 4 A.M. 7% 8 P.M. to Midnight 14% 8 A.M. to Noon 23% Incidents by Month Jan 2963 Feb 2612 Mar 2766 Apr 2712 May 2923 Jun 2792 Jul 3128 Aug 2677 Sep 2715 Oct 2659 Nov 2510 Dec 2603 Incident Total Union County Participation Percentage Participating FDs 95% 20/21 Total FDs Incidents by Day Of Week Sun 4045 Mon 4758 Tue 4861 Wed 4952 Thu 4947 Fri 5120 Sat 4377 Incident Total Incident Type Responses by Category Union County Weather 126 Service Hazardous Condition 4612 Good Intent 2335 Fire 2349 False Alarm 8099 Explosion/Overpressure-No Fire 212 EMS
33 Noon to 4 P.M. 23% Incidents by Time of Day Warren County 4 A.M. to 8 A.M. 10% 4 P.M. to 8 P.M. 26% Midnight to 4 A.M. 7% 8 P.M. to Midnight 16% 8 A.M. to Noon 18% Incidents by Month Jan 235 Feb 207 Mar 261 Apr 249 May 209 Jun 297 Jul 305 Aug 211 Sep 207 Oct 223 Nov 227 Dec 224 Incident Total 2855 Warren County Participation Percentage Participating FDs 95% 22/23 Total FDs Incidents by Day Of Week Sun 352 Mon 428 Tue 400 Wed 408 Thu 410 Fri 432 Sat 425 Incident Total 2855 Incident Type Responses by Category Warren County Weather 44 Service Hazardous Condition 503 Good Intent 407 Fire 534 False Alarm 747 Explosion/Overpressure-No Fire 11 EMS

34 Proper operty Use Incident Totals by county Figures do not include Mutual/Automatic Aid Given Educational Property Use Incident Totals Explosion/Overpressure - False Good Hazardous EMS No Fire Alarm Fire Intent Condition Service Weather Grand Total Atlantic Bergen Burlington Camden Cape May Cumberland Essex Gloucester Hudson Hunterdon Mercer Middlesex Monmouth Morris Ocean Passaic Salem Somerset Sussex Union Warren Grand Total 1, , , ,310 Health Care/Detention Property Use Incident Totals Explosion/Overpressure - False Good Hazardous EMS No Fire Alarm Fire Intent Condition Service Weather Grand Total Atlantic Bergen Burlington Camden Cape May Cumberland Essex Gloucester Hudson Hunterdon Mercer Middlesex Monmouth Morris Ocean Passaic Salem Somerset Sussex Union Warren Grand Total 7, , ,894
35 Residential Property Use Incident Totals Explosion/Overpressure - False Good Hazardous EMS No Fire Alarm Fire Intent Condition Service Weather Grand Total Atlantic Bergen Burlington Camden Cape May Cumberland Essex Gloucester Hudson Hunterdon Mercer Middlesex Monmouth Morris Ocean Passaic Salem Somerset Sussex Union Warren Grand Total 41, ,332 17,496 12,503 17, ,979 1, ,278 Mercantile Property Use Incident Totals Explosion/Overpressure - False Good Hazardous EMS No Fire Alarm Fire Intent Condition Service Weather Grand Total Atlantic Bergen Burlington Camden Cape May Cumberland Essex Gloucester Hudson Hunterdon Mercer Middlesex Monmouth Morris Ocean Passaic Salem Somerset Sussex Union Warren Grand Total 3, ,239 2,071 1,909 2, , ,892 Industrial Property Use Incident Totals Explosion/Overpressure - False Good Hazardous EMS No Fire Alarm Fire Intent Condition Service Weather Grand Total Atlantic Bergen Burlington Camden Cape May Cumberland Essex Gloucester Hudson Hunterdon Mercer Middlesex Monmouth Morris Ocean Passaic Salem Somerset Sussex Union Warren Grand Total ,
36 Manufacturing Property Use Incident Totals Explosion/Overpressure - False Good Hazardous EMS No Fire Alarm Fire Intent Condition Service Weather Grand Total Atlantic Bergen Burlington Camden Cape May Cumberland Essex Gloucester Hudson Hunterdon Mercer Middlesex Monmouth Morris Ocean Passaic Salem Somerset Sussex Union Warren Grand Total , ,414 Storage Property Use Incident Totals Explosion/Overpressure - False Good Hazardous EMS No Fire Alarm Fire Intent Condition Service Weather Grand Total Atlantic Bergen Burlington Camden Cape May Cumberland Essex Gloucester Hudson Hunterdon Mercer Middlesex Monmouth Morris Ocean Passaic Salem Somerset Sussex Union Warren Grand Total , , , Outside/Special Property Use Incident Totals Explosion/Overpressure- False Good Hazardous EMS No Fire Alarm Fire Intent Condition Service Weather Grand Total Atlantic Bergen Burlington Camden Cape May Cumberland Essex Gloucester Hudson Hunterdon Mercer Middlesex Monmouth Morris Ocean Passaic Salem Somerset Sussex Union Warren Grand Total 23, ,351 12,779 7,112 26, , ,889

37 Statewide tewide Incident Type list with total dollar loss and val alue 37
38 38
39 39
40 January Incidents 1% Service 12% Weather 1% EMS 23% Hazardous Condition 16% Explosion/Overpressure 1% Good Intent 10% Fire 10% False Alarm 26% Most Frequent Fire Incidents In January Passenger Vehicle Fire 13% Outside Rubbish, Trash Or Waste Fire 5% Trash Or Rubbish Fire, Contained 4% Brush Or Brush-And-Grass Mixture Fire 5% Building Fire 28% Fuel Burner/Boiler Malfunction, Fire Confined 6% Fire, 7% Cooking Fire, Confined To Container 27% Chimney Or Flue Fire, Confined To Chimney Or Flue 5% JANUARY Overpressure Rupture Of Steam Pipe Or Pipeline 6% Overpressure Rupture Of Steam Boiler 7% Most Frequent Explosion/Overpressure - No Fire Incidents In January Overpressure Rupture, Explosion, Overheat 15% Overpressure Rupture Of Boiler From Air Or Gas 7% Overpressure Rupture Of Air Or Gas Pipe/Pipeline 8% Blasting Agent Explosion (No Fire) 6% Overpressure Rupture From Air Or Gas, 7% Excessive Heat, Scorch Burns With No Ignition 44% 40
41 Most Frequent EMS Incidents In January EMS Call, Excluding Vehicle Accident With Injury 49% Rescue, EMS Incident, 12% Removal Of Victim(s) From Stalled Elevator 2% Motor Vehicle Accident With No Injuries 4% Motor Vehicle Accident With Injuries 12% Extrication Of Victim(s) From Vehicle 4% Medical Assist, Assist EMS Crew 17% Most Frequent Hazardous Condition Incidents In January Vehicle Accident, General Cleanup 13% Arcing, Shorted Electrical Equipment 12% Carbon Monoxide Incident 11% Power Line Down 23% Electrical Wiring/Equipment Problem, 7% Overheated Motor 2% Oil Or Combustible Liquid Spill 3% Water Evacuation 4% Smoke Or Odor Removal 16% Water Or Steam Leak 10% Service Call, 14% Hazardous Condition, 11% Most Frequent Service Incidents In January Water Problem, 5% Gas Leak (Natural Gas Or LPG) 14% Gasoline Or Flammable Liquid Spill 4% Assist Police Or Governmental Agency 9% Public Service 9% Lock-Out 12% Cover Assignment, Standby, Moveup 21% JANUARY 41
42 Most Frequent Good Intent Incidents In January Smoke Scare, Odor Of Smoke 28% Steam, Vapor, Fog Or Dust Thought To Be Smoke 6% No Incident Found On Arrival At Dispatch Address 5% Dispatched & Cancelled En Route 42% Hazmat Release Investigation W/No Hazmat 4% Good Intent Call, 15% Most Frequent False Alarm Incidents In January System Malfunction, 6% Unintentional Transmission Of Alarm, 7% Alarm System Activation, No Fire - Unintentional 19% JANUARY Smoke Detector Activation, No Fire - Unintentional 14% Smoke Detector Activation Due To Malfunction 10% 42 False Alarm Or False Call, Detector Activation, No Fire 9% - Unintentional 5% Severe Weather Or Natural Disaster, 18% Weather Incidents In January Wind Storm, Tornado/Hurricane Assessment 59% Severe Weather Or Natural Disaster Standby 12% CO Detector Activation Due To Malfunction 5% Alarm System Sounded Due To Malfunction 19% Carbon Monoxide Detector Activation, No CO 6% Flood Assessment 4% Lightning Strike (No Fire) 7%
43 February Incidents 1% Service 12% Weather 0% EMS 23% Hazardous Condition 14% Explosion/Overpressure 1% Good Intent 10% Fire 12% False Alarm 27% Most Frequent Fire Incidents In February Outside Rubbish, Trash Or Waste Fire 6% Passenger Vehicle Fire 10% Trash Or Rubbish Fire, Contained 4% Brush Or Brush-And-Grass Mixture Fire 9% Fuel Burner/Boiler Malfunction, Fire Confined 5% Building Fire 33% Fire, 6% Overpressure Rupture Of Steam Pipe Or Pipeline 12% Cooking Fire, Confined To Container 22% Chimney Or Flue Fire, Confined To Chimney Or Flue 5% Most Frequent Explosion/Overpressure - No Fire Incidents In February Overpressure Rupture, Explosion, Overheat 20% Overpressure Rupture Of Steam Boiler 16% Excessive Heat, Scorch Burns With No Ignition 31% Overpressure Rupture Of Air Or Gas Pipe/Pipeline 12% Overpressure Rupture From Air Or Gas, 9% FEBRUARY 43
44 Most Frequent EMS Incidents In February EMS Call, Excluding Vehicle Accident With Injury 49% Rescue, EMS Incident, 12% Extrication Of Victim(s) From Vehicle 3% Removal Of Victim(s) From Stalled Elevator 3% Motor Vehicle Accident Motor Vehicle Accident With No Injuries 3% With Injuries 11% Medical Assist, Assist EMS Crew 19% Most Frequent Hazardous Condition Incidents In February Power Line Down 20% Vehicle Accident, General Cleanup 14% Arcing, Shorted Electrical Equipment 11% Carbon Monoxide Incident 11% Electrical Wiring/Equipment Problem, 7% FEBRUARY Overheated Motor 3% Smoke Or Odor Removal 16% Oil Or Combustible Liquid Spill 4% Hazardous Condition, 11% Water Or Steam Leak 9% Service Call, 12% Most Frequent Service Incidents In February Water Problem, 4% Public Service 11% Gasoline Or Flammable Liquid Spill 6% Assist Police Or Governmental Agency 10% Lock-Out 14% Gas Leak (Natural Gas Or LPG) 13% Cover Assignment, Standby, Moveup 24% 44
45 Most Frequent Good Intent Incidents In February Smoke Scare, Odor Of Smoke 27% No Incident Found On Arrival At Dispatch Address 5% Steam, Vapor, Fog Or Dust Thought To Be Smoke 5% Dispatched & Cancelled En Route 44% Hazmat Release Investigation W/No Hazmat 4% Good Intent Call, 15% Most Frequent False Alarm Incidents In February Smoke Detector Activation, No Fire - Unintentional 14% System Malfunction, 5% Unintentional Transmission Of Alarm, 6% Alarm System Activation, No Fire - Unintentional 20% Smoke Detector Activation Due To Malfunction 10% Alarm System Sounded Due To Malfunction 20% False Alarm Or False Call, 9% Detector Activation, No Fire - Unintentional 5% Lightning Strike (No Fire) 1% Wind Storm, Tornado/Hurricane Assessment 9% Weather Incidents In February Severe Weather Or Natural Disaster Standby 59% Carbon Monoxide Detector Activation, No CO 6% CO Detector Activation Due To Malfunction 5% Severe Weather Or Natural Disaster, 31% FEBRUARY 45
46 March Incidents 1% Service 11% Weather 0% EMS 24% Hazardous Condition 11% Explosion/Overpressure 1% Good Intent 10% Fire 17% False Alarm 25% Most Frequent Fire Incidents In March Outside Rubbish, Trash Or Waste Fire 7% Grass Fire 4% Passenger Vehicle Fire 8% Trash Or Rubbish Fire, Contained 3% Brush Or Brush-And-Grass Mixture Fire 27% Forest, Woods Or Wildland Fire 5% Fire, 6% Cooking Fire, Confined To Container 16% Building Fire 24% MARCH Overpressure Rupture Of Steam Boiler 8% Overpressure Rupture Of Air Or Gas Pipe/Pipeline 7% Most Frequent Explosion/Overpressure - No Fire Incidents In March Overpressure Rupture, Explosion, Overheat 22% Overpressure Rupture From Steam, 8% Blasting Agent Explosion (No Fire) 10% Overpressure Rupture From Air Or Gas, 9% Excessive Heat, Scorch Burns With No Ignition 36% 46
47 Most Frequent EMS Incidents In March EMS Call, Excluding Vehicle Accident With Injury 51% Rescue, EMS Incident, 12% Removal Of Victim(s) From Stalled Elevator 2% Motor Vehicle Accident With No Injuries 3% Motor Vehicle Accident With Injuries 11% Extrication Of Victim(s) From Vehicle 3% Medical Assist, Assist EMS Crew 18% Most Frequent Hazardous Condition Incidents In March Power Line Down 12% Overheated Motor 3% Vehicle Accident, General Cleanup 18% Aircraft Standby 3% Arcing, Shorted Electrical Equipment 8% Carbon Monoxide Incident 12% Electrical Wiring/Equipment Problem, 7% Oil Or Combustible Liquid Spill 5% Hazardous Condition, 9% Gasoline Or Flammable Liquid Spill 6% Gas Leak (Natural Gas Or LPG) 17% Smoke Or Odor Removal 15% Service Call, 13% Most Frequent Service Incidents In March Water Or Steam Leak 7% Public Service 9% Lock-Out 15% Assist Police Or Governmental Agency 10% Cover Assignment, Standby, Moveup 31% MARCH 47
48 Most Frequent Good Intent Incidents In March Steam, Vapor, Fog Or Dust Thought To Be Smoke 4% Smoke Scare, Odor Of Smoke 30% Dispatched & Cancelled En Route 45% No Incident Found On Arrival At Dispatch Address 5% Good Intent Call, 16% Most Frequent False Alarm Incidents In March Unintentional Transmission Of Alarm, System Malfunction, 6% 6% Alarm System Activation, No Fire - Unintentional 20% Smoke Detector Activation, No Fire - Unintentional 15% Smoke Detector Activation Due To Malfunction 8% False Alarm Or False Call, Detector Activation, No Fire 10% - Unintentional 5% CO Detector Activation Due To Malfunction 5% Alarm System Sounded Due To Malfunction 20% Carbon Monoxide Detector Activation, No CO 5% MARCH Wind Storm, Tornado/Hurricane Assessment 33% Weather Incidents In March Severe Weather Or Natural Disaster, 67% 48
49 April Incidents 1% Service 12% Weather 0% EMS 24% Hazardous Condition 11% Explosion/Overpressure 0% Good Intent 10% Fire 16% False Alarm 26% Most Frequent Fire Incidents In April Passenger Vehicle Fire 8% Trash Or Rubbish Fire, Contained 4% Brush Or Brush-And-Grass Mixture Fire 25% Building Fire 19% Outside Rubbish, Trash Or Waste Fire 7% Outside Rubbish Fire, 3% Natural Vegetation Fire, 3% Grass Fire 3% Forest, Woods Or Wildland Fire 3% Cooking Fire, Confined To Container 18% Dumpster Or Outside Trash Receptacle Fire 2% Fire, 5% Most Frequent Explosion/Overpressure - No Fire Incidents In April Overpressure Rupture Of Air Or Gas Pipe/Pipeline 18% Overpressure Rupture From Air Or Gas, 11% Overpressure Rupture, Explosion, Overheat 11% Blasting Agent Explosion (No Fire) 10% Excessive Heat, Scorch Burns With No Ignition 50% APRIL 49
50 Most Frequent EMS Incidents In April EMS Call, Excluding Vehicle Accident With Injury 49% Rescue, EMS Incident, 11% Removal Of Victim(s) From Stalled Elevator 2% Motor Vehicle Accident With No Injuries 4% Motor Vehicle Accident With Injuries 12% Extrication Of Victim(s) From Vehicle 4% Medical Assist, Assist EMS Crew 18% Most Frequent Hazardous Condition Incidents In April Vehicle Accident, General Cleanup 22% Arcing, Shorted Electrical Equipment 11% Carbon Monoxide Incident 9% Power Line Down 15% Oil Or Combustible Liquid Spill 5% Hazardous Condition, 9% Gas Leak (Natural Gas Or LPG) 16% Gasoline Or Flammable Liquid Spill 7% Electrical Wiring/Equipment Problem, 6% Most Frequent Service Incidents In April APRIL Unauthorized Burning 3% Smoke Or Odor Removal 12% Service Call, 12% Water Or Steam Leak 7% Public Service 11% Water Problem, 4% Lock-Out 13% Assist Police Or Governmental Agency 10% Cover Assignment, Standby, Moveup 28% 50
51 Most Frequent Good Intent Incidents In April Steam, Vapor, Fog Or Dust Thought To Be Smoke 4% Dispatched & Cancelled En Route 45% Steam, Gas Mistaken For Smoke, 2% Smoke Scare, Odor Of Smoke 26% No Incident Found On Arrival At Dispatch Address 6% Good Intent Call, 14% Hazmat Release Investigation W/No Hazmat 3% Most Frequent False Alarm Incidents In April Unintentional Transmission Of Alarm, 6% System Malfunction, 5% Alarm System Activation, No Fire - Unintentional 24% Smoke Detector Activation, No Fire - Unintentional 16% Smoke Detector Activation Due To Malfunction 10% False Alarm Or False Call, 11% Detector Activation, No Fire - Unintentional 6% Alarm System Sounded Due To Malfunction 22% Wind Storm, Tornado/Hurricane Assessment Severe Weather Or Natural 8% Disaster, 14% Weather Incidents In April Flood Assessment 5% Lightning Strike (No Fire) 73% APRIL 51
52 May Incidents 1% Service 11% Weather 0% EMS 24% Hazardous Condition 13% Explosion/Overpressure 0% Good Intent 10% Fire 14% False Alarm 27% Most Frequent Fire Incidents In May Brush Or Brush-And-Grass Mixture Fire 22% Building Fire 20% Trash Or Rubbish Fire, Contained 3% Passenger Vehicle Fire 11% Outside Rubbish, Trash Or Waste Fire 7% Outside Rubbish Fire, 3% Natural Vegetation Fire, 3% Cooking Fire, Confined To Container 21% Dumpster Or Outside Trash Receptacle Fire 3% Fire, 5% Forest, Woods Or Wildland Fire 2% Most Frequent Explosion/Overpressure - No Fire Incidents In May MAY Overpressure Rupture Of Steam Pipe Or Pipeline 6% Overpressure Rupture Of Air Or Gas Pipe/Pipeline 10% 52 Overpressure Rupture, Explosion, Overheat 15% Overpressure Rupture From Steam, 4% Explosion (No Fire), 7% Blasting Agent Explosion (No Fire) 4% Chemical Reaction Rupture Of Process Vessel 4% Excessive Heat, Scorch Burns With No Ignition 50%
53 Most Frequent EMS Incidents In May EMS Call, Excluding Vehicle Accident With Injury 48% Rescue, EMS Incident, 12% Removal Of Victim(s) From Stalled Elevator 3% Motor Vehicle/Pedestrian Accident 2% Extrication Of Victim(s) From Vehicle 3% Medical Assist, Assist EMS Crew 16% Motor Vehicle Accident With Injuries 12% Motor Vehicle Accident With No Injuries 4% Most Frequent Hazardous Condition Incidents In May Vehicle Accident, General Cleanup 20% Arcing, Shorted Electrical Equipment 12% Carbon Monoxide Incident 7% Power Line Down 16% Oil Or Combustible Liquid Spill 6% Hazardous Condition, 8% Gasoline Or Flammable Liquid Spill 9% Electrical Wiring/Equipment Problem, 7% Gas Leak (Natural Gas Or LPG) 15% Most Frequent Service Incidents In May Water Or Steam Leak 9% Water Problem, 4% Assist Police Or Governmental Agency 11% Smoke Or Odor Removal 13% Service Call, 12% Public Service 9% Lock-Out 15% Cover Assignment, Standby, Moveup 27% MAY 53
54 Most Frequent Good Intent Incidents In May Steam, Vapor, Fog Or Dust Thought To Be Smoke 5% Smoke Scare, Odor Of Smoke 25% Dispatched & Cancelled En Route 47% No Incident Found On Arrival At Dispatch Address 6% Good Intent Call, 17% Most Frequent False Alarm Incidents In May System Malfunction, 6% Unintentional Transmission Of Alarm, 5% Alarm System Activation, No Fire - Unintentional 23% Smoke Detector Activation, No Fire - Unintentional 16% Smoke Detector Activation Due To Malfunction 11% False Alarm Or False Call, 11% Detector Activation, No Fire - Unintentional 6% Alarm System Sounded Due To Malfunction 22% Weather Incidents In May Wind Storm, Tornado/Hurricane Assessment 28% Flood Assessment 3% MAY Severe Weather Or Natural Disaster, 10% Severe Weather Or Natural Disaster Standby 3% Lightning Strike (No Fire) 56% 54
55 June Incidents 1% Service 12% Weather 1% EMS 23% Hazardous Condition 14% Explosion/Overpressure 0% Good Intent 9% Fire 10% False Alarm 30% Most Frequent Fire Incidents In June Passenger Vehicle Fire 16% Trash Or Rubbish Fire, Contained 4% Brush Or Brush-And-Grass Mixture Fire 11% Outside Rubbish, Trash Or Waste Fire 6% Fire, 7% Building Fire 30% Dumpster Or Outside Trash Receptacle Fire 4% Cooking Fire, Confined To Container 22% Most Frequent Explosion/Overpressure - No Fire Incidents In June Overpressure Rupture, Explosion, Overheat 14% Blasting Agent Explosion (No Fire) 5% Overpressure Rupture Of Air Or Gas Pipe/Pipeline 19% Overpressure Rupture From Steam, 4% Fireworks Explosion (No Fire) 7% Explosion (No Fire), 5% Excessive Heat, Scorch Burns With No Ignition 46% JUNE 55
56 Most Frequent EMS Incidents In June EMS Call, Excluding Vehicle Accident With Injury 48% Rescue, EMS Incident, 11% Removal Of Victim(s) From Stalled Elevator 3% Motor Vehicle/Pedestrian Accident 2% Motor Vehicle Accident With No Injuries 4% Extrication Of Victim(s) From Vehicle 3% Medical Assist, Assist EMS Crew 16% Motor Vehicle Accident With Injuries 13% Most Frequent Hazardous Condition Incidents In June Vehicle Accident, General Cleanup 17% Arcing, Shorted Electrical Equipment 17% Carbon Monoxide Incident 6% Power Line Down 26% Hazardous Condition, 8% Gasoline Or Flammable Liquid Spill 6% Electrical Wiring/Equipment Problem, 8% Gas Leak (Natural Gas Or LPG) 12% Most Frequent Service Incidents In June Water Or Steam Leak 9% Water Problem, 6% Assist Police Or Governmental Agency 11% JUNE Water Evacuation 5% Smoke Or Odor Removal 10% Service Call, 14% Public Service 9% Lock-Out 11% Cover Assignment, Standby, Moveup 25% 56
57 Most Frequent Good Intent Incidents In June Dispatched & Cancelled En Route 49% Steam, Vapor, Fog Or Dust Thought To Be Smoke 4% Smoke Scare, Odor Of Smoke 23% No Incident Found On Arrival At Dispatch Address 6% Good Intent Call, 14% Hazmat Release Investigation W/No Hazmat 4% Most Frequent False Alarm Incidents In June Smoke Detector Activation, No Fire - Unintentional 13% System Malfunction, 5% Unintentional Transmission Of Alarm, 4% Alarm System Activation, No Fire - Unintentional 22% Smoke Detector Activation Due To Malfunction 11% Alarm System Sounded Due To Malfunction 23% False Alarm Or False Call, 10% Detector Activation, No Fire - Unintentional 5% Carbon Monoxide Detector Activation, No CO 4% CO Detector Activation Due To Malfunction 3% Severe Weather Or Natural Disaster, 5% Severe Weather Or Natural Disaster Standby 7% Lightning Strike (No Fire) 50% Weather Incidents In June Wind Storm, Tornado/Hurricane Assessment 8% Flood Assessment 30% JUNE 57
58 July Incidents 1% Service 13% Weather 2% EMS 21% Hazardous Condition 16% Explosion/Overpressure 0% Good Intent 9% Fire 9% False Alarm 29% Most Frequent Fire Incidents In July Passenger Vehicle Fire 15% Brush Or Brush-And-Grass Mixture Fire 9% Outside Rubbish, Trash Or Waste Fire 8% Fire, 7% Building Fire 33% Dumpster Or Outside Trash Receptacle Fire 4% Cooking Fire, Confined To Container 24% Most Frequent Explosion/Overpressure - No Fire Incidents In July Overpressure Rupture, Explosion, Overheat 11% JULY Overpressure Rupture Of Air Or Gas Pipe/Pipeline 15% Overpressure Rupture From Air Or Gas, 8% Fireworks Explosion (No Fire) 17% Excessive Heat, Scorch Burns With No Ignition 49% 58
59 Most Frequent EMS Incidents In July EMS Call, Excluding Vehicle Accident With Injury 52% Rescue, EMS Incident, 10% Removal Of Victim(s) From Stalled Elevator 3% Motor Vehicle/Pedestrian Accident 1% Motor Vehicle Accident With No Injuries 3% Extrication Of Victim(s) From Vehicle 3% Medical Assist, Assist EMS Crew 16% Motor Vehicle Accident With Injuries 12% Most Frequent Hazardous Condition Incidents In July Vehicle Accident, General Cleanup 13% Arcing, Shorted Electrical Equipment 17% Carbon Monoxide Incident 5% Power Line Down 33% Electrical Wiring/Equipment Problem, 8% Hazardous Condition, 7% Gasoline Or Flammable Liquid Spill 6% Gas Leak (Natural Gas Or LPG) 11% Most Frequent Service Incidents In July Smoke Or Odor Removal 10% Water Or Steam Leak 10% Water Evacuation 10% Service Call, 17% Public Service 11% Assist Police Or Governmental Agency 12% Lock-Out 9% Cover Assignment, Standby, Moveup 21% JULY 59
60 Most Frequent Good Intent Incidents In July Smoke Scare, Odor Of Smoke 21% Steam, Vapor, Fog Or Dust Thought To Be Smoke 3% No Incident Found On Arrival At Dispatch Address 8% Dispatched & Cancelled En Route 48% Hazmat Release Investigation W/No Hazmat 2% Good Intent Call, 16% EMS Call, Party Transported By Non-Fire Agency 2% Most Frequent False Alarm Incidents In July Smoke Detector Activation, No Fire - Unintentional 10% System Malfunction, 7% Unintentional Transmission Of Alarm, 4% Alarm System Activation, No Fire - Unintentional 22% Smoke Detector Activation Due To Malfunction 12% Alarm System Sounded False Alarm Or False Call, Due To Malfunction 27% 9% CO Detector Activation Due Detector Activation, No Fire - Unintentional 5% To Malfunction 4% Wind Storm, Tornado/Hurricane Assessment 15% Weather Incidents In July Flood Assessment 6% JULY Severe Weather Or Natural Disaster, 9% Severe Weather Or Natural Disaster Standby 36% Lightning Strike (No Fire) 34% 60
61 August Incidents 1% Service 12% Weather 0% EMS 23% Hazardous Condition 13% Explosion/Overpressure 0% Good Intent 9% Fire 11% False Alarm 31% Most Frequent Fire Incidents In August Trash Or Rubbish Fire, Contained Passenger Vehicle Fire 4% 12% Brush Or Brush-And-Grass Mixture Fire 17% Outside Rubbish, Trash Or Waste Fire 7% Fire, 7% Dumpster Or Outside Trash Receptacle Fire 3% Cooking Fire, Confined To Container 21% Building Fire 29% Most Frequent Explosion/Overpressure - No Fire Incidents In August Overpressure Rupture, Explosion, Overheat 20% Overpressure Rupture Of Air Or Gas Pipe/Pipeline 18% Explosion (No Fire), 11% Blasting Agent Explosion (No Fire) 10% Excessive Heat, Scorch Burns With No Ignition 41% AUGUST 61
62 Most Frequent EMS Incidents In August EMS Call, Excluding Vehicle Accident With Injury 51% Rescue, EMS Incident, 11% Removal Of Victim(s) From Stalled Elevator 3% Motor Vehicle Accident With No Injuries 3% Motor Vehicle Accident With Injuries 13% Extrication Of Victim(s) From Vehicle 3% Medical Assist, Assist EMS Crew 16% Most Frequent Hazardous Condition Incidents In August Vehicle Accident, General Cleanup 18% Arcing, Shorted Electrical Equipment 15% Carbon Monoxide Incident 8% Power Line Down 19% Electrical Wiring/Equipment Problem, 8% Hazardous Condition, 7% Gasoline Or Flammable Liquid Spill 7% Gas Leak (Natural Gas Or LPG) 18% AUGUST Smoke Or Odor Removal 12% Water Problem, 6% Water Or Steam Leak 10% Service Call, 14% Most Frequent Service Incidents In August Public Service 10% Assist Police Or Governmental Agency 12% Lock-Out 10% Cover Assignment, Standby, Moveup 26% 62
63 Most Frequent Good Intent Incidents In August Smoke From Barbecue, Tar Kettle 2% No Incident Found On Arrival At Dispatch Address 6% Smoke Scare, Odor Of Smoke 23% Steam, Vapor, Fog Or Dust Thought To Be Smoke 3% Dispatched & Cancelled En Route 48% Hazmat Release Investigation W/No Hazmat 3% Good Intent Call, 13% EMS Call, Party Transported By Non-Fire Agency 2% Most Frequent False Alarm Incidents In August Smoke Detector Activation, No Fire - Unintentional 12% System Malfunction, 6% Unintentional Transmission Of Alarm, 4% Alarm System Activation, No Fire - Unintentional 23% Smoke Detector Activation Due To Malfunction 14% False Alarm Or False Call, 9% Detector Activation, No Fire - Unintentional 5% Alarm System Sounded Due To Malfunction 27% Severe Weather Or Natural Disaster Standby 2% Lightning Strike (No Fire) 44% Weather Incidents In August Severe Weather Or Natural Disaster, 8% Wind Storm, Tornado/Hurricane Assessment 2% Flood Assessment 44% AUGUST 63
64 September Incidents 1% Service 12% Weather 1% EMS 21% Hazardous Condition 17% Explosion/Overpressure 0% Good Intent 10% Fire 8% False Alarm 30% Most Frequent Fire Incidents In September Outside Rubbish, Trash Or Waste Fire 7% Passenger Vehicle Fire 14% Trash Or Rubbish Fire, Contained 3% Brush Or Brush-And-Grass Mixture Fire 5% Building Fire 29% Fire, 7% SEPTEMBER Dumpster Or Outside Trash Receptacle Fire 3% Overpressure Rupture From Steam, 6% Overpressure Rupture From Air Or Gas, 9% Cooking Fire, Confined To Container 32% Most Frequent Explosion/Overpressure - No Fire Incidents In September Overpressure Rupture, Explosion, Overheat 9% Overpressure Rupture Of Air Or Gas Pipe/Pipeline 17% Explosion (No Fire), 6% Blasting Agent Explosion (No Fire) 6% Excessive Heat, Scorch Burns With No Ignition 47% 64
65 Most Frequent EMS Incidents In September EMS Call, Excluding Vehicle Accident With Injury 48% Rescue, EMS Incident, 10% Removal Of Victim(s) From Stalled Elevator 3% Extrication Of Victim(s) From Vehicle 4% Medical Assist, Assist EMS Crew 17% Motor Vehicle Accident With No Injuries 4% Motor Vehicle Accident With Injuries 14% Most Frequent Hazardous Condition Incidents In September Vehicle Accident, General Cleanup 13% Arcing, Shorted Electrical Equipment 17% Carbon Monoxide Incident 6% Power Line Down 32% Smoke Or Odor Removal 12% Service Call, 18% Hazardous Condition, 7% Water Or Steam Leak 5% Public Service Assistance, 3% Most Frequent Service Incidents In September Water Problem, 4% Public Service 13% Gasoline Or Flammable Liquid Spill 5% Assist Police Or Governmental Agency 11% Lock-Out 10% Electrical Wiring/Equipment Problem, 7% Gas Leak (Natural Gas Or LPG) 13% Cover Assignment, Standby, Moveup 24% SEPTEMBER 65
66 Most Frequent Good Intent Incidents In September Smoke Scare, Odor Of Smoke 22% Steam, Vapor, Fog Or Dust Thought To Be Smoke 3% No Incident Found On Arrival At Dispatch Address 6% Dispatched & Cancelled En Route 51% Hazmat Release Investigation W/No Hazmat 3% Good Intent Call, 13% EMS Call, Party Transported By Non-Fire Agency 2% Most Frequent False Alarm Incidents In September System Malfunction, 6% Unintentional Transmission Of Alarm, 5% Alarm System Activation, No Fire - Unintentional 20% SEPTEMBER Smoke Detector Activation, No Fire - Unintentional 13% Smoke Detector Activation Due To Malfunction 13% Wind Storm, Tornado/Hurricane Assessment 40% 66 False Alarm Or False Call, 9% Detector Activation, No Fire - Unintentional 5% Severe Weather Or Natural Disaster, 10% Weather Incidents In September Severe Weather Or Natural Disaster Standby 9% CO Detector Activation Due To Malfunction 4% Alarm System Sounded Due To Malfunction 21% Carbon Monoxide Detector Activation, No CO 4% Flood Assessment 37% Lightning Strike (No Fire) 4%
67 October Incidents 1% Service 11% Weather 0% EMS 22% Hazardous Condition 15% Explosion/Overpressure 1% Good Intent 10% Fire 10% False Alarm 30% Most Frequent Fire Incidents In October Outside Rubbish, Trash Or Waste Fire 8% Fuel Burner/Boiler Malfunction, Fire Confined 6% Passenger Vehicle Fire 13% Brush Or Brush-And-Grass Mixture Fire 7% Building Fire 29% Fire, 7% Overpressure Rupture Of Steam Boiler 8% Overpressure Rupture Of Air Or Gas Pipe/Pipeline 8% Overpressure Rupture From Steam, 12% Cooking Fire, Confined To Container 30% Most Frequent Explosion/Overpressure - No Fire Incidents In October Overpressure Rupture Of Steam Pipe Or Pipeline 14% Overpressure Rupture, Explosion, Overheat 20% Excessive Heat, Scorch Burns With No Ignition 38% OCTOBER 67
68 Most Frequent EMS Incidents In October EMS Call, Excluding Vehicle Accident With Injury 46% Rescue, EMS Incident, 11% Extrication Of Victim(s) From Vehicle 4% Removal Of Victim(s) From Stalled Elevator 3% Motor Vehicle/Pedestrian Accident 2% Motor Vehicle Accident With No Injuries 4% Motor Vehicle Accident With Injuries 13% Medical Assist, Assist EMS Crew 17% Most Frequent Hazardous Condition Incidents In October Vehicle Accident, General Cleanup 15% Arcing, Shorted Electrical Equipment 12% Carbon Monoxide Incident 10% Power Line Down 27% Electrical Wiring/Equipment Problem, 7% OCTOBER Smoke Or Odor Removal 17% Service Call, 16% Hazardous Condition, 8% Water Or Steam Leak 8% Most Frequent Service Incidents In October Public Service 13% Gasoline Or Flammable Liquid Spill 5% Assist Police Or Governmental Agency 12% Lock-Out 12% Gas Leak (Natural Gas Or LPG) 16% Cover Assignment, Standby, Moveup 22% 68
69 Most Frequent Good Intent Incidents In October Steam, Vapor, Fog Or Dust Thought To Be Smoke 5% Smoke Scare, Odor Of Smoke 24% No Incident Found On Arrival At Dispatch Address 7% Dispatched & Cancelled En Route 44% Hazmat Release Investigation W/No Hazmat 3% EMS Call, Party Transported By Non-Fire Agency 2% Good Intent Call, 15% Most Frequent False Alarm Incidents In October Unintentional Transmission Of Alarm, 5% System Malfunction, 6% Alarm System Activation, No Fire - Unintentional 21% Smoke Detector Activation, No Fire - Unintentional 15% Smoke Detector Activation Due To Malfunction 12% Severe Weather Or Natural Disaster, 18% False Alarm Or False Call, 9% Weather Incidents In October Wind Storm, Tornado/Hurricane Assessment 52% Severe Weather Or Natural Disaster Standby 15% Alarm System Sounded Due To Malfunction 22% Carbon Monoxide Detector Activation, No CO Detector Activation, No Fire 5% - Unintentional 5% Flood Assessment 8% Lightning Strike (No Fire) 7% OCTOBER 69
70 November Incidents Hazardous Condition 13% 1% Service 12% Weather 0% EMS 23% Explosion/Overpressure 0% Good Intent 11% False Alarm 29% Fire 11% Most Frequent Fire Incidents In November Outside Rubbish, Trash Or Waste Fire Fuel Burner/Boiler 6% Malfunction, Fire Confined 4% Fire, 6% Passenger Vehicle Fire 13% Brush Or Brush-And-Grass Mixture Fire 8% NOVEMBER Cooking Fire, Confined To Container 32% Overpressure Rupture Of Steam Pipe Or Pipeline 12% 70 Building Fire 31% Most Frequent Explosion/Overpressure - No Fire Incidents In November Overpressure Rupture, Explosion, Overheat 21% Overpressure Rupture Of Air Or Gas Pipe/Pipeline 15% Overpressure Rupture From Steam, 11% Excessive Heat, Scorch Burns With No Ignition 41%
71 Most Frequent EMS Incidents In November EMS Call, Excluding Vehicle Accident With Injury 46% Rescue, EMS Incident, 12% Extrication Of Victim(s) From Vehicle 3% Removal Of Victim(s) From Stalled Elevator 3% Motor Vehicle/Pedestrian Accident 2% Motor Vehicle Accident With No Injuries 5% Medical Assist, Assist EMS Crew 16% Motor Vehicle Accident With Injuries 13% Most Frequent Hazardous Condition Incidents In November Vehicle Accident, General Cleanup 23% Arcing, Shorted Electrical Equipment 14% Carbon Monoxide Incident 13% Power Line Down 16% Hazardous Condition, 7% Water Problem, Water Or Steam Leak 7% 9% Water Evacuation 7% Smoke Or Odor Removal 15% Service Call, 11% Most Frequent Service Incidents In November Electrical Wiring/Equipment Problem, 7% Gas Leak (Natural Gas Or LPG) 20% Assist Police Or Governmental Agency 10% Public Service 9% Lock-Out 10% Cover Assignment, Standby, Moveup 22% NOVEMBER 71
72 Most Frequent Good Intent Incidents In November Dispatched & Cancelled En Route 48% Steam, Vapor, Fog Or Dust Thought To Be Smoke 5% Smoke Scare, Odor Of Smoke 24% No Incident Found On Arrival At Dispatch Address 6% Good Intent Call, 14% Hazmat Release Investigation W/No Hazmat 3% NOVEMBER Smoke Detector Activation, No Fire - Unintentional 15% Smoke Detector Activation Due To Malfunction 11% 72 System Malfunction, 5% False Alarm Or False Call, 8% Detector Activation, No Fire - Unintentional 5% Most Frequent False Alarm Incidents In November Unintentional Transmission Of Alarm, 5% Weather Incidents In November Flood Assessment 76% Wind Storm, Tornado/Hurricane Assessment 8% Severe Weather Or Natural Disaster, 6% Alarm System Activation, No Fire - Unintentional 21% CO Detector Activation Due To Malfunction 5% Severe Weather Or Natural Disaster Standby 8% Alarm System Sounded Due To Malfunction 21% Carbon Monoxide Detector Activation, No CO 4% Lightning Strike (No Fire) 2%
73 December Incidents 1% Service 12% Weather 0% EMS 23% Hazardous Condition 13% Explosion/Overpressure 1% Good Intent 11% False Alarm 26% Fire 13% Most Frequent Fire Incidents In December Outside Rubbish, Trash Or Waste Fire 6% Fuel Burner/Boiler Malfunction, Fire Confined 5% Fire, 6% Passenger Vehicle Fire 11% Brush Or Brush-And-Grass Mixture Fire 9% Building Fire 32% Overpressure Rupture, Explosion, Overheat 14% Cooking Fire, Confined To Container 27% Chimney Or Flue Fire, Confined To Chimney Or Flue 4% Most Frequent Explosion/Overpressure - No Fire Incidents In December Overpressure Rupture Of Steam Boiler 13% Excessive Heat, Scorch Burns With No Ignition 49% Overpressure Rupture Of Air Or Gas Pipe/Pipeline 10% Overpressure Rupture From Steam, 14% DECEMBER 73
74 Most Frequent EMS Incidents In December EMS Call, Excluding Vehicle Accident With Injury 46% Rescue, EMS Incident, 12% Removal Of Victim(s) From Stalled Elevator 3% Motor Vehicle Accident With No Injuries 5% Motor Vehicle Accident With Injuries 14% Extrication Of Victim(s) From Vehicle 4% Medical Assist, Assist EMS Crew 16% Most Frequent Hazardous Condition Incidents In December Vehicle Accident, General Cleanup 18% Power Line Down 13% Arcing, Shorted Electrical Equipment 11% Carbon Monoxide Incident 15% DECEMBER Overheated Motor 3% Oil Or Combustible Liquid Spill 5% Smoke Or Odor Removal 17% Water Or Steam Leak 9% Service Call, 13% Hazardous Condition, 6% Most Frequent Service Incidents In December Water Problem, 4% Public Service 9% Gas Leak (Natural Gas Or LPG) 17% Gasoline Or Flammable Liquid Spill 6% Assist Police Or Governmental Agency 10% Lock-Out 12% Electrical Wiring/Equipment Problem, 6% Cover Assignment, Standby, Moveup 26% 74
75 Most Frequent Good Intent Incidents In December Smoke Scare, Odor Of Smoke 25% No Incident Found On Arrival At Dispatch Address 7% Steam, Vapor, Fog Or Dust Thought To Be Smoke 4% Dispatched & Cancelled En Route 44% Hazmat Release Investigation W/No Hazmat 3% Good Intent Call, 15% EMS Call, Party Transported By Non-Fire Agency 2% Most Frequent False Alarm Incidents In December Smoke Detector Activation, No Fire - Unintentional 14% Smoke Detector Activation Due To Malfunction 11% System Malfunction, 6% False Alarm Or False Call, 8% Wind Storm, Tornado/Hurricane Assessment 17% Unintentional Transmission Of Alarm, 5% Detector Activation, No Fire - Unintentional 6% Weather Incidents In December Severe Weather Or Natural Disaster Standby 61% Alarm System Activation, No Fire - Unintentional 21% CO Detector Activation Due To Malfunction 5% Carbon Monoxide Detector Activation, No CO 5% Severe Weather Or Natural Disaster, 22% Alarm System Sounded Due To Malfunction 19% DECEMBER 75
76 Fires by Type Vehicle Fires 14% Trash Fires 13% Confined Fires 31% Structure Fires 17% Cultivated Vegetation Fires 0% Special Outside Fires 2% Natural Vegetation Fires 18% Fire, 5% Structure Fires by Month November 8% December 9% January 8% February 10% October 7% March 10% September 6% August 8% April 9% July 8% June 8% May 9% Structure Fires by Day of Week Saturday 16% Sunday 15% Friday 14% Monday 14% Thursday 14% Tuesday 14% Wednesday 13% 76
77 Fact ctors Contrib ontributing to Ignition Factors Contributing to Ignition Worn Out Unspecified Short-Circuit Arc Undetermined Short-Circuit Arc From Defective, Worn Insulation Playing With Heat Source Natural Condition, Misuse Of Material Or Product, Mechanical Failure, Malfunction, Leak Or Break Heat Source Too Close To Combustibles Failure To Clean Factors Contributing To Ignition, Exposure Fire Equipment Unattended Electrical Failure, Malfunction, Abandoned Or Discarded Materials Or Products fire suppression fact ctors Fire suppression factors are factors that inhibit fire suppression efforts or contribute to the growth or spread of fire. Most Frequent Fire Suppression Factors Drought Or Low Fuel Moisture Poor Access For Firefighters Power Lines Down/Arcing Balloon Construction Roof Collapse W ind, Including Hurricanes Or Tornadoes Poor Or No Access For Fire Department Apparatus Difficult To Ventilate Flammable/Combustible Liquid Hazard Delayed Detection Of Fire Building Construction Or Design Factors, Delayed Reporting Of Fire Fire Supression Factor,


78 Photograph courtesy of John Honer Structure Fires by Property Type Residential 4053 = 78% Outside/Special Property 57 = 1% Mercantile/Business 408 = 8% Manufacturing 101 = 2% Industrial 22 = 0% Health Care/Detention/Correction 94 = 2% Educational 67 = 1% Storage 244 = 5% Assembly 180 = 3% 78 Photograph courtesy of Frank Clark

79 residential fires Fires in 1 & 2 family residential structures account for approximately 62% of all fires in residential property uses. Fires in multifamily dwelling structures show the next highest incident rate of 31%. Fires in Residential Property Uses Residential Board and Care 120 = 1% Residential, 407 = 2% Hotel/Motel Commercial 254 = 2% Sorority/Fraternity House 20 = 0% Multifamily Dwelling 4,993 = 31% 1 or 2 Family Dwelling 10,194 = 62% Dormitory-Type Residence, 143 = 1% Boarding/Rooming House, Residential Hotels 190 = 1% Barracks, Dormitory 46 = 0% Photograph courtesy of Frank Clark 79
80 Heat sources of residential fires Most Frequent Heat Sources of 1 or 2 Family Dwelling Fires Undetermined 1536 Spark, Ember or Flame from Operating Equipment 279 Radiated, Conducted Heat from Operating Equipment 573 Match 91 Hot or Smoldering Object, 167 Hot Ember or Ash 193 Heat Source: 176 Heat from Powered Equipment, 368 Heat from Open Flame or Smoking Materials 163 Electrical Arcing 424 Cigarette 144 Candle Most Frequent Heat Sources of Multifamily Dwelling Fires Undetermined 545 Spark, Ember or Flame from Operating Equipment 112 Radiated, Conducted Heat from Operating Equipment 300 Match 29 Hot or Smoldering Object, 56 Hot Ember or Ash 42 Heat Source: 67 Heat from Powered Equipment, 119 Heat from Open Flame or Smoking Materials 69 Electrical Arcing 112 Cigarette 55 Candle
81 Most Frequent Heat Sources of Boarding/Rooming House, Residential Hotel Fires Undetermined 21 Spark, Ember Or Flame From Operating Equipment 2 Radiated, Conducted Heat From Operating Equipment 27 Hot Or Smoldering Object, 2 Hot Ember Or Ash 4 Heat From Open Flame Or Smoking Materials 7 Electrical Arcing 3 Cigarette 4 Candle Most Frequent Heat Sources of Residential Board & Care Fires Undetermined 8 Spark, Ember Or Flame From Operating Equipment 2 Radiated, Conducted Heat From Operating Equipment 12 Lighter: Cigarette, Cigar 1 Hot Or Smoldering Object, 1 Heat From Open Flame Or Smoking Materials 3 Flame/Torch Used For Lighting 1 Electrical Arcing 2 Cigarette 1 Candle

82 Most Frequent Heat Sources of Residential Building Fires Undetermined Photograph courtesy of Rodman Meyer Spark, Ember or Flame from Operating Equipment Radiated, Conducted Heat from Operating Equipment Match Hot or Smoldering Object, Hot Ember or Ash Heat Source: Heat from Powered Equipment, Heat from Open Flame or Smoking Materials Electrical Arcing Cigarette Candle DORMITOR ORY Y FIRES Property Use Day of Week Alarm Date Alarm Tim e Incident Type De te ctor Presence Detector Type Barracks, Dormitory Sun 05-Mar-06 04:45:00 Building Fire Present Undetermined Barracks, Dormitory Tue 21-Feb-06 18:42:00 Building Fire Undetermined Information Not Provided by FD Barracks, Dormitory Thu 23-Feb-06 10:04:50 Building Fire Present Barracks, Dormitory Sat 09-Dec-06 05:14:00 Building Fire Present Smoke Barracks, Dormitory Thu 12-Oct-06 09:49:00 Building Fire Present Smoke Barracks, Dormitory Thu 21-Sep-06 23:48:00 Building Fire Present Smoke Barracks, Dormitory Mon 20-Nov-06 20:36:00 Cooking Fire, Confined to Container Present Combination Smoke-Heat Barracks, Dormitory Thu 26-Oct-06 20:47:00 Cooking Fire, Confined to Container Present Smoke Dormitory-Type Residence, Sun 08-Jan-06 16:26:00 Building Fire Undetermined Information Not Provided by FD Dormitory-Type Residence, Tue 28-Mar-06 03:06:00 Building Fire Present Combination Smoke-Heat Dormitory-Type Residence, Fri 17-Feb-06 13:04:00 Building Fire Present Smoke Dormitory-Type Residence, Thu 16-Mar-06 22:14:00 Building Fire Present Heat Dormitory-Type Residence, Fri 12-May-06 15:35:00 Building Fire Undetermined Information Not Provided by FD Dormitory-Type Residence, Fri 05-May-06 14:39:00 Building Fire Present Smoke Dormitory-Type Residence, Thu 30-Mar-06 05:11:26 Building Fire Present Smoke Dormitory-Type Residence, Sun 02-Jul-06 00:04:00 Building Fire Present Smoke Dormitory-Type Residence, Fri 17-Mar-06 19:24:00 Building Fire Present Smoke Sorority House, Fraternity House Thu 02-Feb-06 10:49:00 Building Fire Present Information Not Provided by FD Sorority House, Fraternity House Thu 02-Feb-06 10:49:00 Building Fire Present Information Not Provided by FD Sorority House, Fraternity House Sat 04-Nov-06 08:58:00 Building Fire Undetermined Information Not Provided by FD 82

83 Most Frequent Fires by Type in Residential Property Uses 8000 Photograph courtesy of Christopher Eckert Brush or Brush-and- Grass Mixture Fire Building Fire 506 Chimney or Flue Fire, Cooking Fire, Confined Confined to Chimney or to Container Flue 834 Fuel Burner/Boiler Malfunction, Fire Confined 519 Outside Rubbish, Trash or Waste Fire Autom atic Extinguishm ent System Type Autom atic Extinguishm ent System Operation Sprinkler He ads Activated Autom atic Extinguishm ent System Failure Re as on Wet-Pipe Sprinkler System System Operated and Was Effective 1 Information Not Provided by FD Information Not Provided by FD 0 Wet-Pipe Sprinkler System Fire Too Small to Activate the System 0 Information Not Provided by FD Information Not Provided by FD 0 Wet-Pipe Sprinkler System Fire Too Small to Activate the System 0 Wet-Pipe Sprinkler System System Did Not Operate 0 Fire Not in Area Protected by the System Wet-Pipe Sprinkler System Information Not Provided by FD 0 Wet-Pipe Sprinkler System Information Not Provided by FD 0 Information Not Provided by FD Information Not Provided by FD 0 Information Not Provided by FD Information Not Provided by FD 0 Wet-Pipe Sprinkler System System Operated and Was Effective 1 Wet-Pipe Sprinkler System Fire Too Small to Activate the System 0 Fire Not in Area Protected by the System Information Not Provided by FD Information Not Provided by FD 0 Wet-Pipe Sprinkler System System Operated and Was Effective 1 Wet-Pipe Sprinkler System System Operated and Was Effective 1 Information Not Provided by FD Information Not Provided by FD 0 Information Not Provided by FD Information Not Provided by FD 0 Undetermined Fire Too Small to Activate the System 0 Type of Sprinkler System 0 Information Not Provided by FD Information Not Provided by FD

84 Area of fire Origin Most Frequent Areas of Fire Origin All Property Uses Information Not Provided By FD 52% Highway, Parking Lot, Street: On Or Near 5% Engine Area, Running Gear, Wheel Area 8% Courtyard, Patio, Porch, Terrace 1% Cooking Area, Kitchen 6% Bedroom - < 5 Persons; Included Are Jail Or Prison 2% Open Area - Outside; Included Are Farmland, Field 5% 2% Operator/Passenger Area Of Transportation Equipment 2% Outside Area, 6% Undetermined 8% Wildland, Woods 3% Photograph courtesy of Ron Svrchek TEN MOST FREQUENT AREAS OF FIRE ORIGIN Property Use Incidents Property Loss Contents Loss Undetermined 2762 $8,624, $2,267, Engine Area, Running Gear, Wheel Area 2447 $3,672, $387, Cooking Area, Kitchen 1841 $5,075, $1,688, Outside Area, 1728 $1,266, $446, Open Area - Outside; Included are Farmland, Field 1424 $39, $2, Highway, Parking Lot, Street: On or Near 1405 $57, $ Wildland, Woods 833 $2, $ Bedroom - < 5 Persons; Included are Jail or Prison 654 $8,058, $1,945, $632, $154, Operator/Passenger Area of Transportation Equipment 514 $1,210, $41,
85 Most Frequent Areas of Fire Origin Residential Property Uses Information Not Provided By FD 70% Laundry Area, Wash House (Laundry) 2% Courtyard, Patio, Porch, Terrace 2% Cooking Area, Kitchen 11% Common Room, Den, Family Room, Living Room, Lounge 2% Bedroom - < 5 Persons; Included Are Jail Or Prison 4% Undetermined 5% Outside Area, 3% Wall Surface: Exterior 1% Most Frequent Areas of Fire Origin Educational Property Uses Information Not Provided By FD 72% Highway, Parking Lot, Street: On Or Near 2% Open Area - Outside; Included Are Farmland, Field 3% Cooking Area, Kitchen 3% Outside Area, 8% Bathroom, Checkroom, Lavatory, Locker Room 7% Wildland, Woods 2% Undetermined 3% 85
86 Most Frequent Areas of Fire Origin Mercantile/Business Property Uses Highway, Parking Lot, Street: On Or Near 7% Engine Area, Running Gear, Wheel Area 6% Courtyard, Patio, Porch, Terrace 2% Cooking Area, Kitchen 4% Wall Surface: Exterior 2% Information Not Provided By FD 51% Undetermined 10% Sales Area, Showroom (Exclude Display Window) 1% Laundry Area, Wash House (Laundry) 2% Outside Area, 8% Roof Surface: Exterior 1% Open Area - Outside; Included Are Farmland, Field 3% Operator/Passenger Area Of Transportation Equip. 1% 2% Most Frequent Areas of Fire Origin Assembly Property Uses Information Not Provided By FD 58% Highway, Parking Lot, Street: On Or Near 3% Courtyard, Patio, Porch, Terrace 1% Cooking Area, Kitchen 8% Bathroom, Checkroom, Lavatory, Locker Room 2% Undetermined Outside Area, 8% 10% Roof Surface: Exterior 2% Open Area - Outside; Included Are Farmland, Field 6% 2% 86
87 Most Frequent Areas of Fire Origin Health Care, Detention & Correction Property Uses Information Not Provided By FD 80% Highway, Parking Lot, Street: On Or Near 2% Laundry Area, Wash House (Laundry) 2% Cooking Area, Kitchen 8% Undetermined 3% Machinery Room Or Area; Elevator Machinery Room 1% Outside Area, 4% Most Frequent Areas of Fire Origin Storage Property Uses Information Not Provided By FD 41% Engine Area, Running Gear, Wheel Area 8% Wall Surface: Exterior 4% Vehicle Storage Area; Garage, Carport 12% Undetermined 13% Outside Area, 6% Storage Area, 9% Storage: Supplies Or Tools; Dead Storage 7% 87
88 Cause of Ignition Cause of Ignition Unintentional 34% Unknown 1% Act Of Nature 2% Cause Under Investigation 18% Intentional 6% Failure Of Equipment Or Heat Source 11% Cause, 6% Cause Undetermined After Investigation 22% Assembly Education Health Care, Detention & Correction Industrial Manufacturing Act Of Nature Cause Under Investigation Cause Undetermined After Investigation Cause, Failure Of Equipment Or Heat Source Information Not Provided By FD Intentional Unintentional Outside/ Mercantile, Business Special Property Residential Storage Act Of Nature Cause Under Investigation Cause Undetermined After Investigation Cause, Failure Of Equipment Or Heat Source Information Not Provided By FD Intentional Unintentional
89 Atlantic Bergen Burlington Camden Cape May Cumberland Essex Gloucester Hudson Hunterdon Mercer Middlesex Monmouth Morris Ocean Passaic Salem Somerset Sussex Union Warren Cause of Ignition: Act of Nature Atlantic Bergen Burlington Camden Cape May Cumberland Essex Gloucester Hudson Hunterdon Mercer Middlesex Monmouth Morris Ocean Passaic Salem Somerset Sussex Union Warren Cause of Ignition: Failure of Equipment or Heat Source
90 Atlantic Bergen Burlington Camden Cape May Cumberland Essex Gloucester Hudson Hunterdon Mercer Middlesex Monmouth Morris Ocean Passaic Salem Somerset Sussex Union Warren Cause of Ignition: Intentional Atlantic Bergen Burlington Camden Cape May Cumberland Essex Gloucester Hudson Hunterdon Mercer Middlesex Monmouth Morris Ocean Passaic Salem Somerset Sussex Union Warren Cause of Ignition: Under Investigation
91 Atlantic Bergen Burlington Camden Cape May Cumberland Essex Gloucester Hudson Hunterdon Mercer Middlesex Monmouth Morris Ocean Passaic Salem Somerset Sussex Union Warren Cause of Ignition: Undetermined After Investigation Atlantic Bergen Burlington Camden Cape May Cumberland Essex Gloucester Hudson Hunterdon Mercer Middlesex Monmouth Morris Ocean Passaic Salem Somerset Sussex Union Warren Cause of Ignition: Unintentional
92 detector presence and performance Detector Presence by County Atlantic Bergen Burlington Camden Cape May Cumberland Essex Gloucester Hudson Hunterdon Mercer Middlesex Monmouth Morris Ocean Passaic Salem Somerset Sussex Union Warren Information Not Provided by FD None Present Present Undetermined Detector Presence By Property Use Information Not Provided by FD None Present Present Undetermined Grand Total Assembly Educational Health Care/Detention/Correction Industrial Manufacturing Mercantile/Business None Outside/Special Property Residential Storage Undetermined Grand Total
93 Detector Presence Information Not Provided by FD None Present Present Undetermined 2500 Detector Type Com bination Smoke/Heat in Single Unit 54 Heat 155 Information Not Provided by FD 95 More Than One Type Present 18 Othe r Sm oke Sprinkle r, Water Flow Detection Undetermined Detector Effectiveness When Detectors Are Present De te ctor Ale rte d Occupants, Occupants Failed To Respond Detector Alerted Occupants, Occupants Responded Detector Failed to Alert Occupants Inform ation Not Provided by FD There Were No Occupants Undetermined 93
94 Detector Power Battery Only 890 Hardwire Only 556 Hardwire With Battery Backup 709 Information Not Provided by FD 155 Mechanical 9 Multiple Detectors & Power Supplies Plug-In 4 Plug-In With Battery Backup 12 Undetermined Detector Failure Reasons Undetermined 165 Power Failure, Shut Off, Disconnected Lack of Maintenance 17 Information Not Provided by FD 21 Improper Installation/Placement of Detector 7 Defective Detector 5 Battery Missing or Disconnected 89 Battery Discharged or Dead

95 Automatic Extinguishment System Presence by County Atlantic Bergen Burlington Camden Cape May Cumberland Essex Gloucester Hudson Hunterdon Mercer Middlesex Monmouth Morris Ocean Passaic Salem Somerset Sussex Union Warren Information Not Provided by FD None Present Present Undetermined Automatic Extinguishment System Presence By Property Use Information Not Provided by FD None Present Present Undetermined Grand Total Assembly Educational Health Care/Detention/Correction Industrial Manufacturing Mercantile/Business None Outside/Special Property Residential Storage Undetermined Grand Total
96 Automatic Extinguishment System Presence Undetermined Present 4303 None Present Information Not Provided by FD Automatic Extinguishment System Type Wet-Pipe Sprinkler System 327 Undetermined 49 Special Hazard System, 4 Sprinkler System 46 Information Not Provided by FD 122 Dry-Pipe Sprinkler System 16 Dry Chemical System 22 Carbon Dioxide System
97 Automatic Extinguishment System Operation Undetermined 32 System Operated And Was Not Effective 21 System Operated And Was Effective 104 System Did Not Operate Information Not Provided by FD 188 Fire Too Small To Activate The System Automatic Extinguishment System Failure Reasons Undetermined 31 System Shut Off 2 11 Not Enough Agent Discharged To Control The Fire Lack Of Maintenance 1 1 Information Not Provided by FD 18 Inappropriate System For The Type Of Fire 1 Fire Not In Area Protected by the System 34 Agent Discharged, But Did Not Reach The Fire
98 civilian fire fatalities alities Heat Source of Fire Civilian Fire Fatalities in Residential Property Uses Undetermined 60% Spark, Ember or Flame from Operating Equipment 5% Radiated, Conducted Heat from Operating Equipment 7% Multiple Heat Sources Including Multiple Ignitions 2% Lighter: Cigarette, Cigar 2% Heat Source: 5% Cigarette 12% Heat from Open Flame or Smoking Materials 5% Heat from Powered Equipment, 2% Civilian Fire Fatalities * 54 * 55* Year * Figures differ from those in Fire in New Jersey 2001 to 2003 due to the fact that there is a 20% increase in participation with NFIRS from fire departments. Reports have recently been submitted with data from previous years. 98
99 Fire Fatalities Female Male Civilian Firefighter Civilian Fire Fatalities by Age Group Female Male to 9 10 to to to to to to to to 89 Age Group Civilian Fire Fatalities Repair Garage 4% Plane 1% Single Family Dwelling 29% 1 or 2 Family Dwelling 9% Information Not Provided By FD 5% Manufacturing 1% Mobile Home 3% Motor Vehicle 17% Outside Tent 1% Outside 1% Multi-Family Dwelling 29% 99
100 20 18 Civilian Fire Fatalities & Detector Presence 18 Female Male N/A Not Present Present Undetermined Female Civilian Fire Fatalities Time of Incident Midnight to 4 AM 8 PM to Midnight 4 AM to 8 AM 4 PM to 8 PM Noon to 4 PM 8 AM to Noon Multiple Civilian Fire Fatalities alities Date Alarm Time Municipality Address FD Age Gender 1/10/06 2:47 Camden 4113 Westfield Avenue City of Camden FD 22 Male 1/10/06 2:47 Camden 4113 Westfield Avenue City of Camden FD 1 Male 1/10/06 15:21 Hillsborough 25 Old Camplain Road Hillsborough Fire Co #2 54 Male 1/10/06 15:21 Hillsborough 25 Old Camplain Road Hillsborough Fire Co #2 38 Male 4/3/06 7:40 Oakland Edison Ave & W Oakland Ave Oakland FD 25 Male 4/3/06 7:40 Oakland Edison Ave & W Oakland Ave Oakland FD 22 Male 5/5/06 23:35 Clifton 3 Elmhill Road Clifton FD 76 Female 5/5/06 23:35 Clifton 3 Elmhill Road Clifton FD 80 Male 7/14/06 2:11 Millville 103 N 8th Street Millville FD 28 Female 7/14/06 2:11 Millville 103 N 8th Street Millville FD 9 Male 7/14/06 2:11 Millville 103 N 8th Street Millville FD 2 Male 8/3/06 9:59 Burlington City 834 Columbus Road City of Burlington FD 23 Female 8/3/06 9:59 Burlington City 834 Columbus Road City of Burlington FD 49 Male 8/22/06 4:11 Dover 6 Mase Avenue Dover FD 48 Female 8/22/06 4:11 Dover 6 Mase Avenue Dover FD 17 Female 8/22/06 4:11 Dover 6 Mase Avenue Dover FD 18 Male 8/30/06 3:41 Englew ood 79 James Street Englew ood FD 41 Male 8/30/06 3:41 Englew ood 79 James Street Englew ood FD 27 Female 8/30/06 3:41 Englew ood 79 James Street Englew ood FD 22 Male 1/7/06 2:48 Manahaw kin mm66.5 N GSP Stafford Tw p FD 31 Female 1/7/06 2:48 Manahaw kin mm66.5 N GSP Stafford Tw p FD 39 Male 100
101 30 26 Civilian Fire Fatalities & Detector Performance Female Male N/A Undetermined Detector Did Not Operate Detector Operated Male Civilian Fire Fatalities Time of Incident Midnight to 4 AM 8 PM to Midnight 4 AM to 8 AM 4 PM to 8 PM 8 AM to Noon Noon to 4 PM Cause of Fire Property Use Room of Origin Detector Detector Operation Undetermined Multi-Family Dw elling 1St. Floor Present Detector Did Not Operate Undetermined Multi-Family Dw elling 1St. Floor Present Detector Did Not Operate Explosion Involving Asphalt Truck Repair Garage Outside Of Structure N/A N/A Explosion Involving Asphalt Truck Repair Garage Outside Of Structure N/A N/A Dump Truck Hit By Train Railroad Right-Of-Way N/A N/A N/A Dump Truck Hit By Train Railroad Right-Of-Way N/A N/A N/A Undetermined Single Family Dw elling Living Room Undetermined Undetermined Undetermined Single Family Dw elling Living Room Undetermined Undetermined Under Investigation 1 Or 2 Family Dw elling Foyer/Living Room Not Present N/A Under Investigation 1 Or 2 Family Dw elling Foyer/Living Room Not Present N/A Under Investigation 1 Or 2 Family Dw elling Foyer/Living Room Not Present N/A Undetermined Single Family Dw elling Kitchen Present Undetermined Undetermined Single Family Dw elling Kitchen Present Undetermined Faulty Electrical Outlet In Living Room Multi-Family Dw elling Information Not Provided By FD Not Present N/A Faulty Electrical Outlet In Living Room Multi-Family Dw elling Information Not Provided By FD Not Present N/A Faulty Electrical Outlet In Living Room Multi-Family Dw elling Information Not Provided By FD Not Present N/A Undetermined Single Family Dw elling Basement Hall Present Detector Did Not Operate Undetermined Single Family Dw elling Basement Hall Present Detector Did Not Operate Undetermined Single Family Dw elling Basement Hall Present Detector Did Not Operate Information Not Provided By FD Highw ay N/A N/A N/A Information Not Provided By FD Highw ay N/A N/A N/A 101
102 civilian fire injuries Most Frequent Fire Type Resulting In Civilian Injuries Building Fire 79% Brush Or Brush-And-Grass Mixture Fire 1% Cooking Fire, Confined To Container 11% Passenger Vehicle Fire 3% Mobile Property (Vehicle) Fire, 1% Fires In Structure Than In A Building 2% Fire, 2% Fire In Mobile Home Used As Fixed Residence 1% Severity of Civilian Fire Injuries Minor 247 = 51% Life Threatening 22 = 5% Moderate 127 = 27% Information Not Provided By FD 1 = 0% Undetermined 42 = 9% Severe 38 = 8% 102
103 Cause of Civilian Fire Injuries Caught Or Trapped Exposed To Fire Products Exposed To Hazardous Materials Or Toxic Fumes 21 Fell, Slipped Or Tripped 6 Information Not Provided By FD 117 Jumped In Escape Attempt 7 Multiple Causes 4 6 Overexertion Or Strain 4 Struck By Or Contact With Object 6 Undetermined Civilian Fire Injuries - Age Group Female Male 68 Information Not Provided By FD to 9 10 to to to to to to to to Age Group 103
104 firefighter injuries and fatalities alities Firefighter Fatalities Year Firefighter Injuries Female 34 4% Male % Number of Male Firefighters in New Jersey 42,233 = 96.9% Number of Female Firefighters in New Jersey 1,337 = 3.1% 104
105 Cause of Firefighter Injuries Undetermined 78 Struck or Assaulted by Person/Animal/Object 60 Slip/Trip 78 Overexertion/Strain 169 Jump 7 Information Not Provided by FD 236 Fall 64 Exposure to Hazard 105 Contact with Object (Firefighter Moved Into/Onto) 90 Cause of Injury, Firefighter Injuries Most Frequent Activities When Injuries Occurred Information Not Provided by FD 192 Ventilation with Hand Tools 21 Using Hand Tools in Extinguishment Activity 29 Suppression Support, 57 Providing EMS Care 22 Overhaul 39 Incident Scene Activity, Moving Tools or Equipment Around Scene Handling Charged Hose Lines 117 Extinguishing Fire/Neutralizing Incident, 58 Activity, Firefighter Injuries Most Frequent Incident Types When Injuries Occurred Medical Assist, Assist EMS Crew 41 Extrication of Victim(s) from Vehicle 26 EMS Call, Excluding Vehicle Accident with Injury 72 Cooking Fire, Confined to Container 20 Building Fire
106 Severity of Firefighter Injuries Treated by Physician, Not a Lost-Time Injury 25% Information Not Provided by FD 8% Death 1% First Aid Only 14% Life Threatening, Lost-Time Injury 1% Severe, Lost-Time Injury 2% Moderate Severity, Lost- Time Injury 27% Report Only, Including Exposure 22% Severity of Firefighter Injuries Information Not Provided by FD 72 T reated by Physician, Not a Lost-T ime Injury 232 Severe, Lost-Time Injury 14 Report Only, Including Exposure 199 Moderate Severity, Lost-Time Injury 260 Life T hreatening, Lost-T ime Injury 5 First Aid Only 133 Death Time of Day Firefighter Injuries Occurred 8 PM to Midnight 16% Midnight to 4 AM 11% 4 AM to 8 AM 11% 4 PM to 8 PM 20% 8 AM to Noon 18% Noon to 4 PM 24% 106
107 SCHOOL FIRES 700 Reported School Fires 2000 To Reported School Fires By County For 2000 To Grand Total Atlantic Bergen Burlington Camden Cape May Cumberland Essex Gloucester Hudson Hunterdon Mercer Middlesex Monmouth Morris Ocean Passaic Salem Somerset Sussex Union Warren Grand Total
108 250 Reported School Fires By School Type Educational, Elementary School, Including Kindergarten High School/Junior High School/Middle School Preschool Schools, Non-Adult, Reported School Fires By County Atlantic 15 Bergen 48 Burlington 27 Camden 31 Cape May 1 Cumberland 9 Essex 54 Gloucester 14 Hudson 52 Hunterdon 5 Mercer 28 Middlesex 52 Monmouth 40 Morris 20 Ocean 32 Passaic 28 Salem 1 Somerset 10 Sussex 7 Union 52 Warren

109 Reported School Fires By Day of Week Thursday 17% Sunday 9% Saturday 11% Friday 17% Wednesday 15% Tuesday 16% Monday 15% Reported School Fires By Time of Day Photograph courtesy of Fred Connin 8 PM to Midnight 13% Midnight to 4 AM 4% 4 AM to 8 AM 7% 4 PM to 8 PM 21% 8 AM to Noon 28% Noon to 4 PM 27% 109
110 110
111 111
 Fire 30 1% Aircra ft Fire 10 0% Water Vehicle Fire 59 1% Road Freight Or Transport Vehicle Fire 484 8% S e lf-p rope lle d M otor Hom e Or Recreational Vehicle 11 0% Most")
112 Vehicle fires Vehicle Fires Passenger Vehicle Fire % O ff-roa d V e hicle O r He a vy Equipment Fire 110 2% Rail Vehicle Fire 19 0% Mobile Property (Vehicle) Fire, 453 8% Camper Or Recreational Vehicle (RV) Fire 30 1% Aircra ft Fire 10 0% Water Vehicle Fire 59 1% Road Freight Or Transport Vehicle Fire 484 8% S e lf-p rope lle d M otor Hom e Or Recreational Vehicle 11 0% Most Frequent Heat Sources of Vehicle Fires Photograph courtesy of John Honer Undetermined 2922 Spark, Ember Or Flame From Operating Equipment 159 Radiated, Conducted Heat From Operating Equipment 386 Information Not Provided By Fd 830 Hot Or Smoldering Object, 109 Heat, Spark From Friction 102 Heat Source: 187 Heat From Powered Equipment, 381 Electrical Arcing Frequency of Occurrence 112
113 Vehicle Fires Cause of Ignition Unintentional 24% Act Of Nature 0% Cause Under Investigation 18% Intentional 2% Inform ation Not Provided By FD 15% Failure Of Equipment Or Heat Source 17% Cause, 5% Cause Undetermined After Investigation 19% Vehicle Fires - Cause of Ignition Cause of Ignition Total Incidents Property Loss Contents Loss Act Of Nature 21 $12, $3, Cause Under Investigation 1015 $2,165, $60, Cause Undetermined After Investigation 1104 $862, $213, Cause, 302 $371, $33, Failure Of Equipment Or Heat Source 968 $1,387, $82, Information Not Provided By FD 849 $20, $1, Intentional 111 $403, $3, Unintentional 1356 $1,684, $293, Total 5726 $6,908, $690, Vehicle Fire Fatalities Female Male Aircraft Fire Fire In Motor Home, Camper, Recreational Vehicle Mobile Property (Vehicle) Fire, Passenger Vehicle Fire Road Freight Or Transport Vehicle Fire 113
114 HaZardous materials releases Most Frequent Container Types Involved in Hazardous Materials Releases Can or Bottle Cylinder Drum Information Not Provided by FD Machinery or Process Equipment Pipe or Pipeline Portable Container, Tank or Silo Vehicle Fuel Tank and Associated Piping Type of Environment Contaminated by Hazardous Materials Releases Air Air and Ground Air, Water, and Ground Ground Water Water and Air Water and ground 114
115 Mobile Properties Involved in Hazardous Materials Incidents Trailer - Travel, Designed to be Towed Trailer - Semi, Designed for Freight Tank Truck - Nonflammable Cargo Tank Truck - Flammable or Combustible Liquid Personal Aircraft Less Than 12,500 lb. Gross Wt. Passenger Road Vehicle, Information Not Provided by FD Hauling Rig (Non-Motorized), Pickup Truck General Use Truck, Dump Truck, Fire Apparatus Garbage, Waste, Refuse Truck Freight Road Transport Vehicle, Construction Vehicle Automobile, Passenger Car, Ambulance, Race Car Most Frequent Hazardous Materials Involved in Hazardous Materials Incidents Carbon Monoxide Diesel Gasoline Natural Gas Propane 115


116 wildland fires Acres Burned Number of Acres Burned Frequency of Occurance Photograph courtesy of Paul Allen Total Acres Burned Atlantic 85 Bergen 54 Burlington 186 Camden 47 Cape May 57 Cumberland 81 Essex 12 Gloucester 28 Hudson 35 Hunterdon 71 Mercer 14 Middlesex 242 Monmouth 27 Morris 19 Ocean 50 Passaic 61 Salem 533 Somerset 12 Sussex 28 Union 15 Warren 10 Photograph courtesy of Paul Allen 116
117 Incident Types Brush or Brush-and-Grass Mixture Fire 129 Building Fire 2 Cultivated Vegetation, Crop Fire, Fire in Mobile Hom e Used as Fixed Residence Fires in Structure than in a Building Forest, W oods or W ildland Fire 70 Garbage Dump or Sanitary Landfill Fire 1 Grass Fire 6 Natural Vegetation Fire, 10 Passenger Vehicle Fire Property Use Frequency of Occurance 1 or 2 Fam ily Dw elling Bridge, Trestle Department or Discount Store Fixed-use Recreation Places, Gas Distribution, Gas Pipeline High School/Junior High School/Middle School Hospita l - M edica l or Psychiatric None Outside or Special Property, Pipeline, Pow er Line or Utility Right-of-W ay Public or Government, Ra ilroa d Ya rd Schools, Non-Adult, Undeterm ined Item First Ignited Frequency of Occurance Electrical W ire, Cable Insulation 1 He a vy Ve ge ta tion - Not Crop 36 Light Vegetation - Not Crop 74 M a ttre ss, P illow 2 Oily Rags 1 Organic Materials, 3 Item First Ignited 6 Rubbish, Trash, or Waste 3 Tire 1 Undetermined Frequency of Occurance 117
118 special studies Thermal Imaging Camera Special Study Not Used, = 92% = 3% Used to Search for Missing Firefighter(s)/Firefighter(s) Found 7 = 0% Used to Search for Missing Firefighter(s)/Firefighter(s) Not Found 3 = 0% Used to Conduct Primary Search/Victims Not Found 24 = 0% Used to Locate Primary Fire 9139 = 2% Used to Locate Fire Extension = 3% Used to Conduct Primary Search/No Victims Present 1024 = 0% Used to Conduct Primary Search/Victims Found 23 = 0% Automatic External Defibrillator Special Study * Used on Civilian(s) - Effective (Got Pulse) 390 = 90% Used on Firefighter(s) - Not Effective (Did Not Get Pulse) 1 = 0% Used on Firefighter(s) - Effective (Got Pulse) 2 = 0% Used on Civilian(s) - Not Effective (Did Not Get Pulse) 46 = 10% *Totals do not accurately show how many times departments used this special study. Some departments are incorrectly coding special studies, therefore the totals are extremely low compared to the actual use of this special study field


119 NJ DIVISION OF FIRE SAFETY OFFICE OF THE STATE FIRE MARSHAL ARSON / K-9 UNIT 2006 MONTHLY INVESTIGATION STATISTICAL REPORT CLASSIFICATION JAN FEB MAR APR MAY JUN JUL AUG SEP OCT NOV DEC TOTAL COMPLAINT/INSPECTION ORIGIN & CAUSE INVEST ORIGIN & CAUSE W/CIV. INJ ORIGIN & CAUSE W/CIV. FAT ORIGIN & CAUSE W/FF. INJ ORIGIN & CAUSE W/FF. FAT FF INJURY FF FATALITY K-9 ACCELERANT DETECTION ORIGIN & CAUSE WITH K SPECIAL INVESTIGATION CANCELLED ENROUTE TOTAL TRAINING HOURS K-9 DEMONSTRATIONS OVERTIME HOURS Photograph courtesy of Jeff Silver 119
120 Fire Depar artment par articip ticipation tion The charts on the following pages show fire department participation in NFIRS data submission to the Division of Fire Safety. Please note: fire departments with an X have submitted more than six months of data, fire departments with an asterisk (*) have submitted less than six months of data, and fire departments with a yellow field have not submitted any data for those years indicated. Population FD NAME FDID County Name CITY NAME ATLANTIC COUNTY-43 7,638 Absecon Fire Dept Atlantic Absecon X X X X X X 40,517 Atlantic City Fire Dept Atlantic Atlantic City X X X X X 1291 So Jersey Tran Auth FD Atlantic Little Egg Harbor X * 12,594 Brigantine Fire Dept Atlantic Brigantine X X X X X X 1,936 Landisville Vol Fire Co # Atlantic Landisville X X X X 1,936 Minotola Fire Co Atlantic Minotola X X X X * X 1,487 Richland Vol Fire Co # Atlantic Richland X X X X X 1,487 East Vineland Fire Co # Atlantic East Vineland * X * * 1,487 New tow nville Fire Co Atlantic New tonville * * 1,487 Milmay Vol Fire Co Atlantic Milmay X X X 1,487 Collings Lakes Fire Dept Atlantic Collings Lake X X X X X X 4,545 Egg Harbor City Fire Dept Atlantic Egg Harbor City X X X X X X 6,145 Cardiff Vol Fire Co Atlantic Egg Harbor Tw p X X X X X X 6,145 Bargaintow n Vol Fire Co # Atlantic Egg Harbor Tw p X X X X X X 6,145 Scullville Fire Co # Atlantic Egg Harbor Tw p X X X X X X 6,145 Farmington Vol Fire Co # Atlantic Egg Harbor Tw p X X X X X X 6,145 West Atlantic City Fire Dept Atlantic Egg Harbor Tw p X X X 1,585 Estell Manor Vol Fire Co Atlantic Estell Manor X X * X 1,972 Folsom Vol Fire Co Atlantic Folsom X X X X X 6,241 Oceanville Vol Fire Co # Atlantic Oceanville X X X X X X 6,241 Germania Vol Fire Co # Atlantic Cologne X X X X X 6,241 Pomona Vol Fire Assn # Atlantic Pomona X X X X X X 6,241 Bayview Fire Co # Atlantic Abscecon X X X X X X 6,241 South Egg Harbor Vol Fire Co Atlantic South Egg Harbor X X X X X X 4,099 Mays Landing Fire Dept Atlantic Mays Landing X X X * X 4,099 Mizpah Vol Fire Co Atlantic Mizpah 4,099 Laureldale Fire/Rescue Co Atlantic Mays Landing X X X X X X 4,099 Weymouth Vol Fire Co Atlantic Mays Landing 4,099 Cologne Vol Fire Co Atlantic Mays Landing X X X X X X 12,604 Hammonton Fire Dept Atlantic Hammonton X X X X * 7,172 Linw ood Fire Dept Atlantic Linw ood X X X X X X 1,054 Longport Vol Fire Dept Atlantic Longport X X X X X X 8,193 Margate City Fire Dept Atlantic Margate City X X X X X X 1,478 Elw ood Vol Fire Co Atlantic Elw ood X X X X X X 1,478 Nesco Vol Fire Co Atlantic Hammonton X X X 1,478 Weekstow n Vol Fire Co Atlantic Egg Harbor City X X X X X X 1,478 Sw eetw ater Vol Fire Co Atlantic Sw eetw ater X X X X X X 7,725 Northfield Fire Department Atlantic Northfield X X X X X X 19,012 Pleasantville Fire Dept Atlantic Pleasantville X X X X X X 1,037 Port Republic Vol Fire Co Atlantic Port Republic X X X X X X 11,614 Somers Point City Fire Dept Atlantic Somers Point X X X X X X 12,910 Ventnor City Fire Dept Atlantic Ventnor City X X X X X X 1,128 Dorothy Vol Fire Co Atlantic Dorothy X X X X X X 37/2 37/0 36/1 33/1 32/4 32/2 252, , , , , , ,650 NOTE: Populations are based on 2000 Census 120
121 Population FD NAME FDID County Name CITY NAME BERGEN COUNTY ,699 Allendale Fire Dept Bergen Allendale X X X X X X 2,183 Alpine Fire Dept Bergen Alpine X X X X X X 26,247 Bergenfield Boro Fire Dept Bergen Bergenfield X X X X X X 8,249 Bogota Fire Dept Bergen Bogota X X * X X X 5,917 Carlstadt Fire Dept Bergen Carlstadt X X X X X X 23,007 Cliffside Park Fire Dept Bergen Cliffside Park X X X X X * 8,383 Closter Fire Dept Bergen Closter X X X X X X 7,746 Cresskill Fire Dept Bergen Cresskill X X X X X X 4,845 Demarest Boro Fire Dept Bergen Demerest X X X X X X 17,503 Dumont Fire Dept Bergen Dumont X X X X 18,925 Elmw ood Park Fire Dept Bergen Elmw ood Park X X X X X X 8,716 East Rutherford Fire Dept Bergen East Rutherford X X X X X X 7,677 Edgew ater Fire Dept Bergen Edgew ater X X * X X X 7197 Emerson Fire Department Bergen Emerson X X X X X 26,203 Englew ood City Fire Dept Bergen Englew ood City X X X X X X 5,322 Englew ood Cliffs Fire Dept Bergen Englew ood Cliffs X X X X X X 31,637 Fair Law n Fire Dept Bergen Fair Law n X X X X X X 13,255 Fairview Vol Fire Dept Bergen Fairview X X * X * * 35,461 Fort Lee Fire Dept Bergen Fort Lee X X X X X 10,422 Franklin Lakes Boro Fire Dept Bergen Franklin Lakes Boro X X * X X X 29,786 Garfield City Fire Dept Bergen Garfield City X X X X X X 11,546 Glen Rock Fire Dept Bergen Glen Rock X X X X X X 42,677 Hackensack Fire Dept Bergen Hackensack X X X X X X 4,740 Harrington Park Fire Dept Bergen Harrington Park X X X X X X 11,662 Hasbrouck Heights Fire Dept Bergen Hasbrouck Heights X X X X 3,390 Haw orth Fire Dept Bergen Haw orth X X X X 10,087 Hillsdale Vol Fire Dept Bergen Hillsdale X X X X * * 4,063 Ho Ho Kus Fire Dept Bergen Ho Ho Kus X X X X X X 8,914 Leonia Boro Fire Dept Bergen Leonia X X X X X X 10,800 Little Ferry Fire Dept Bergen Little Ferry * * X X 23,971 Lodi Boro Fire Dept Bergen Lodi X X X X X X 19,383 Lyndhurst Vol Fire Dept Bergen Lyndhurst X X X X X * 24,062 Mahw ah Fire Dept Bergen Mahw ah X X X X X X 9,523 Mayw ood Fire Dept Bergen Mayw ood X X X X * X 6,947 Midland Park Fire Dept Bergen Midland Park X X X X X X 7,034 Montvale Boro Fire Dept Bergen Montvale * X X * * 2,754 Moonachie Boro Fire Dept Bergen Moonachie X X X X X X 16,400 New Milford Fire Dept Bergen New Milford X X X X X X 15,181 North Arlington Fire Dept Bergen North Arlington X X X X X X 4,460 Northvale Fire Dept Bergen Northvale X X X X X X 5,751 Norw ood Fire Dept Bergen Norw ood X X X X X X 12,466 Oakland Boro Vol Fire Dept Bergen Oakland Boro X X X X X X 5,482 Old Tappen Boro Fire Co # Bergen Old Tappen Boro X X X X X X 8,047 Oradell Vol Fire Dept Bergen Oradell X X X X X X 121
 70 70 70 70 70 69 17,073 Palisades Park Fire Dept 02450 Bergen Palisades Park X X X X X 25,737 Paramus Fire Dept 02460 Bergen Paramus X X X X 8,708 Park Ridge Fire Dept 02470 Bergen Park Ridge X X")
122 Population FD NAME FDID County Name CITY NAME BERGEN COUNTY (CONT.) ,073 Palisades Park Fire Dept Bergen Palisades Park X X X X X 25,737 Paramus Fire Dept Bergen Paramus X X X X 8,708 Park Ridge Fire Dept Bergen Park Ridge X X X X X X 14,351 Ramsey Boro Fire Dept Bergen Ramsey X X X X X X 10,830 Ridgefield Fire Dept Bergen Ridgefield X X X X X X 12,873 Ridgefield Park Village FD Bergen Ridgefield Park X X X X X X 24,936 Ridgew ood Fire Dept Bergen Ridgew ood X X X X X X 10,946 River Edge Vol Fire Dept Bergen River Edge X X X * 9,449 River Vale Tw p Fire Dept Bergen River Vale X X X X X X 5,528 Rochelle Park Tw p Fire Dept Bergen Rochelle Park X X X X X X 391 Rockleigh Fire Dept Bergen Rockleigh X X X X 18,110 Rutherford Fire Dept Bergen Rutherford X X X X X X 13,155 Saddlebrook Tw p Fire Dept Bergen Saddlebrook X X X X X X 3,201 Saddle River Fire Dept Bergen South River X X X X X X 2,249 South Hackensack Fire Dept Bergen South Hackensack X X X X X X 39,260 Teaneck Fire Dept Bergen Teaneck X X X X X X 13,806 Tenafly Fire Dept Bergen Tenafly X X X X X X 7,741 Upper Saddle River Fire Dept Bergen Upper Saddle River X X X X X X 9,622 Waldw ick Boro Fire Dept Bergen Waldw ick Boro X X * * X 11,583 Wallington Boro Fire Dept Bergen Wallington Boro X X X X X X 8,938 Tw p of Washington Fire Dept Bergen Tw p of Washington X X X X X X 10,999 Westw ood Vol Fire Dept Bergen Westw ood X X X X X X 5,745 Woodcliff Lake Fire Dept Bergen Woodcliff Lake X X X X X X 7,644 Wood-Ridge Fire Dept Bergen Wood-Ridge X X X X X X 16,508 Wyckoff Tw p Vol Fire Dept Bergen Wyckoff X X X X X X Meadow lands Fire Dept Bergen N/A 66/1 67/1 62/4 64/3 60/5 57/5 884, , , , , , , Photograph courtesy of Michael Gallagher
123 Population FD NAME FDID County Name CITY NAME BURLINGTON COUNTY-50 19,079 Maple Shade Fire Dept Burlington Maple Shade X X X X X X 3,237 Delanco Fire Dept Burlington Delanco X X X X X * 2,661 Beverly Fire Dept Burlington Beverly X X X X * 10,461 Lumberton Fire Dept Burlington Lumberton X X X X X X 33,008 Willingboro Fire Dept Burlington Willingboro X X X X X X 5,194 Vincent Fire Co Burlington Vincentow n X X X X X X 5,194 Hampton Lakes Vol Co # Burlington Southampton X X X X X X 7,172 Brow ns Mills Fire Dept Burlington Brow ns Mills X X X X X X 7,172 Country Lakes Vol Fire Co Burlington Brow ns Mills X X X * X X 7,172 Presidential Lakes Fire & Res Burlington New Lisbon X X 7,172 Magnolia Rd Fire Co # Burlington Pemberton Tow nship X X X X X X 1,210 Goodw ill Fire Co # Burlington Pemberton Tow nship X X X X X X 14,595 Cinnaminson Fire Dept # Burlington Cinnaminson X X X X X X Juliustow n Vol Fire Co Burlington Juliustow n X X X X 1076 Jacksonville Fire Co Burlington Springfield Tw p X X X 1,075 Springfield Tw p Fire Co Burlington Jobstow n X X X X X X 42,275 Evesham Fire-Rescue Burlington Evesham X X X X X X 15,536 Delran Fire Dept # Burlington Delran X X X X X X 2,759 Riverton Fire Dept Burlington Riverton X X X X X X 22,253 Medford Tw p Fire Division Burlington Medford X X X X X X 2,977 Union Fire Co # Burlington Crossw icks X X X 2,977 Chesterfield Hose Co Burlington X X X X 7,217 Westampton Tw p Fire Dept Burlington Westampton X X X X * 6,462 Indian Mills Vol Fire Co Burlington Shamong X X X X 585 Chatsw orth Fire Co Burlington Chatsw orth X X X X X 585 Lebanon Lakes Vol Fire Co Burlington Chatsw orth X X X X X X 20,294 Burlington Tw p Fire Dept # Burlington Burlington X X X X X 9,523 Moorestow n Fire Dept Dist # Burlington Moorestow n X X X X * X 9,523 Lenola Vol Fire Co # Burlington Morrestow n X X X X * 4,190 Bordentow n Tw p Fire Dist # Burlington Bordentow n X X X X X X 4,190 Bordentow n Tw p Fire Dist # Burlington Bordentow n X * X X * X 5,090 Franklin Fire Co # Burlington Columbus X X X X X X 6,202 Eastampton Tw p Fire & Rescue Burlington Eastampton X X X 40,221 Mt Laurel Fire Dept Burlington Mt Laurel X X X X X 4,173 Medford Lakes Fire Dept Burlington Medford Lakes X X X X X X 9,744 Cookstow n Vol Fire Co # Burlington Cookstow n X X X X X X 4,126 Hainesport Vol Fire Co Burlington Hainesport X X X X X X 3,582 Florence Tw p Fire Dept Burlington Florence X X X X X X 748 Wrightstow n Vol Fire Co Burlington Wrightstow n Boro X X X X X X 1,510 New Gretna Fire Co Burlington New Gretna X X X 7,170 Medford Farms Vol Fire Co Burlington Tabernacle X X X X X 310 Green Bank Vol Fire Co Burlington Egg Harbor X X X 310 Low er Bank Vol Fire Co Burlington Egg Harbor X X X X X X 7,347 Jacobstow n Vol Fire Co Burlington North Hanover X * X X X X 2,682 Mt Holly Fire Dist # Burlington Mt. Holly X X X X X X 4,868 Consolidated Fire Assn Burlington Bordentow n X X * X * X 4,868 Bordentow n City Fire Dept Burlington Bordentow n City X X X X X X 7,911 Riverside Fire Co # Burlington Riverside X X X X X * 7,091 Palmyra Fire Dept Burlington Palmyra X X X X X X 9,736 City of Burlington Fire Dept Burlington Burlington City X X X X X X 50/0 47/2 47/1 39/1 38/4 37/4 405, , , , , , ,
124 Population FD NAME FDID County Name CITY NAME CAMDEN COUNTY ,182 Audubon Boro Fire Co # Camden Audubon X X X X X * 7,547 Haddon Heights Fire Dept Camden Haddon Heights X X X X X X Merged Bellmaw r Fire Dept Camden Bellmaw r N/A N/A X X X X Bellmaw r Park VFC Camden Bellmaw r N/A N/A X X X * Bellmaw r Fire Dept Camden Bellmaw r X X N/A N/A N/A N/A 4,495 Mt Ephraim Fire Department Camden Mt Ephraim X X X X X X 11,484 Gloucester City Fire Dept Camden Gloucester City X X X X X X 8,533 Runnemede Fire Dept Camden Runnemede X X X X * X 9,192 Glendora Vol Fire Co Camden Glendora X X X X X X 9,192 Chew s Landing Fire Dept Camden Blackw ood X X X X X X 9,192 Blenheim Fire Co # Camden Blackw ood X X X * X X Blackw ood Fire Co Dist # Camden Blackw ood X X X X X X 9,192 Gloucester Tw p Fire Dist # Camden Gloucester Tw p X X 9,192 Erial Fire Dept Camden Erial X X X X X X 7,084 Barrington Fire Co # Camden Barrington X X X X * X 79,904 City of Camden Fire Dept Camden Camden X X X X X X 35,737 Pennsauken Fire Dept Camden Pennsauken X X X X X 3,801 Niagara Fire Co Camden Merchantville X X X * X X 69,965 Cherry Hill Fire Dept Camden Cherry Hill X X X X X X 11,659 Haddon Fire Co # Camden Haddonfield X X X X * X 7,325 Westmont Fire Co Camden Westmont X X X X X X 7,325 West Collingsw ood Hgt Fire Dep Camden Haddon Tw p X X X X * X 14,326 Collingsw ood Fire Dept Camden Collingsw ood X X X X X X 2,796 Woodlynne Fire Co # Camden Woodlynne X X X X X 4,188 Oaklyn Fire Dept Camden Oaklyn X X X X X X 1,102 Audubon Park Fire Dept Camden Audubon Park X X X X X X 6,149 Berlin Boro Fire Co Camden Berlin X X X X X X 5,290 West Berlin Fire-Rescue Camden West Berlin X X * * X X 10,494 Waterford Tw p Fire Dept Camden Atco X X X X X X 1,520 Chesilhurst Vol Fire Co # Camden Waterford X 29,667 Winslow Tw p Fire Dist # Camden Sicklerville X X X X N/A N/A Merged Winslow FC Camden N/A N/A N/A N/A X X Cedar Brook FC Camden N/A N/A N/A N/A X X Tansboro FC Camden N/A N/A N/A N/A X X Albion FC Camden N/A N/A N/A N/A X X Sicklerville FC Camden N/A N/A N/A N/A X X Waterford FC Camden N/A N/A N/A N/A X X Elm FC Camden N/A N/A N/A N/A X X 4,944 Ancora Fire Dept Camden Ancora X X X X X X 2,692 Law nside Fire Co # Camden Law nside X * X X X X Camden County Div of Fire Camden Blackw ood X X * X X 4,409 Magnolia Boro Fire Co Camden Magnolia X X X X X X 2,354 Brooklaw n Boro Fire Co Camden Brooklaw n X X X X X * 1,970 Laurel Springs Fire Dept Camden Laurel Springs X X X 4,986 Clementon Fire Dept Camden Clementon X X X X * X 10,880 Pine Hill Fire Dept Camden Pine Hill X X X X X X 5,804 Lindenw old Boro Fire Co # Camden Lindenw old X X X X X X 5,804 Lindenw old Fire Co # Camden Clementon X X X X X X 5,804 Lindenw old Fire Co # Camden Lindenw old X X * X X 7,271 Stratford Fire Dept Camden Stratford X X X X X X 5,192 Somerdale Fire Dept Camden Somerdale X X X X * X 28,126 Voorhees Fire Dist Camden Voorhees X X X X X X 2,435 Gibbsboro Fire Co # Camden Gibbsboro X * X X X X 1,029 Hi-Nella Fire Co # Camden Hi-Nella X X X X X X 45/0 42/2 41/2 38/4 41/6 45/3 499, , , , , , ,
125 Population FD NAME FDID County Name CITY NAME CAPE MAY COUNTY ,378 Ocean City Fire Dept Cape May Ocean City X X X X X X 4,935 North Wildw ood City Fire Dept Cape May North Wildw ood X X X X X X 5,436 City of Wildw ood Fire Dept Cape May Wildw ood X X X X X X 3,980 Wildw ood Crest Fire Co # Cape May Wildw ood Crest X X X X X X 4,034 Cape May City Fire Dept Cape May Cape May X X X X X 3,028 Strathmere Vol Fire Co Cape May Strathmere * X X X X X 2,835 Sea Isle City Fire Dept Cape May Sea Isle City X X X X 2,143 Avalon Boro Vol Fire Dept Cape May Avalon X X X * * * 1,128 Stone Harbor Vol Fire Co # Cape May Stone Harbor X * X X X X 3,028 Marmora Volunteer Fire Co Cape May Marmora X X X X X X 2,164 Ocean View Vol Fire Co Inc Cape May Ocean View * X X X X X 3028 Seaville Vol Fire Rescue Cape May Seaville X X cc *cc X X 448 West Wildw ood Vol Fire Co Cape May West Wildw ood X X X X X X 1,095 West Cape May Vol Fire Co Cape May West Cape May X * X X 241 Cape May Point Vol Fire Co # Cape May Cape May Point X X X X X X U.S. Coast Guard FD Cape May Cape May Point N/A N/A X X X X 1,623 Villas Vol Fire Co Inc Cape May Villas X X X X X X 1,623 Tow n Bank Vol Fire Co Cape May North Cape May X X X X X X 1,623 Erma Vol Fire Co Cape May Erma X X X X X X 4,101 Middle Tw p Vol Fire Co # Cape May Cape May Courthouse X X X X X X 4,101 Rio Grande Fire Co Cape May Rio Grande X X X X X X 4,101 Green Creek Vol Fire Co Cape May Green Creek X X X X * X 4,101 Goshen Vol Fire Co Cape May Goshen X X X X X X 2,716 Woodbine Vol Fire Co Cape May Woodbine X * X * * X 2,164 Dennis Tw p Vol Fire Co Cape May Dennisville X X X X X X 3,028 Tuckahoe Vol Fire Co Cape May Tuckahoe X X X X X * 2,164 Belleplain Vol Fire Co Cape May Woodbine X X X X X X 24/2 23/2 25/0 23/4 22/3 24/2 84,246 84,246 83,151 80,123 84,246 77,377 81,411 CUMBERLAND COUNTY ,271 Vineland Fire Dept Cumberland Vineland X X X X X X 22,771 Bridgeton Fire Dept Cumberland Bridgeton X X X X X X 1,753 Port Norris Fire Dept Cumberland Port Norris X X X X 1,753 Mauricetow n Fire Dept Cumberland Mauricetow n X X X X 1,753 Laurel Lake Vol Fire Co Cumberland Millville X X X X X X 847 Greenw ich Fire Dept Cumberland Greenw ich X X * 3,141 Fairfield Tw p Fire Co # Cumberland Bridgeton X X X X X X 3,141 Fairton Fire Dept Cumberland Fairton X X X X X X 2,721 Cedarville Fire Dept Cumberland Cedarville X X X X X X 2,164 Dividing Creek Fire Co Cumberland Dividing Creek X X X X X X Merged New port Fire Dept (now 06195) Cumberland New port X X X X X X Merged Fortescue Fire Co #1(now 06195) Cumberland Fortescue X X X X X X 4,328 Dow ne Tw p. Fire/Rescue Co Cumberland Fortescue N/A N/A N/A N/A N/A N/A 4,434 Hopew ell-stow Creek Fire Co Cumberland Shiloh X X X X X X 1,385 Cumberland Vol Fire Co# Cumberland Millville X X X 1,385 Delmont Vol Fire Dept Cumberland Delmont X * 1,385 Heislerville Vol Fire Co Cumberland Heislerville X X X X X X 1,385 Leesburg Vol Fire Co # Cumberland Leesburg X X X 1,385 Port Elizabeth Fire Dept Cumberland Port Elizabeth X X 1,468 Carmel Vol Fire Co Cumberland Millville X X X 1,468 Rosenhayn Vol Fire Co Cumberland Rosenhayn * X X X 26,847 Millville Fire Dept Cumberland Millville X X X X X X 2,518 Upper Deerfield Fire Co # Cumberland Deerfield X * * * * X 2,518 Seabrook Fire & Rescue Cumberland Seabrook X X X X X X 2,518 Upper Deerfield Fire Co # Cumberland Seabrook X X X * X X 534 Shiloh Boro Fire Dept Cumberland Shiloh X X X X X X 23/1 23/2 21/1 16/2 16/1 17/1 149, , , , , , ,644 NOTE: cc - Computer Crash 125

126 Photograph courtesy of John Honer Population FD NAME FDID County Name CITY NAME ESSEX COUNTY-21 32,928 Belleville Fire Dept Essex Belleville X X X X X X 47,683 Bloomfield Fire Dept Essex Bloomfield X X X X X X 7,584 Caldw ell Vol Fire Dept Essex Caldw ell X X 12,300 Cedar Grove Tw p Vol Fire Essex Cedar Grove Tw p X X X X X X 69,824 East Orange Fire Dept Essex East Orange X X * * X X 2,162 Essex Fells Fire Dept Essex Essex Fells X X 7,063 Fairfield Fire Dept Essex Fairfield X X X X X X 60,695 Irvington Fire Dept Essex Irvington X X X X X X 27,391 Livingston Fire Dept Essex Livingston X X X X X X 23,868 Maplew ood Fire Dept Essex Maplew ood X X X X X X 19,765 Millburn Tw p Fire Dept Essex Millburn X X X X X X 38,977 Montclair Fire Dept Essex Montclair X X X X X X 273,546 New ark Fire Dept Essex New ark X X X X X X 7,375 North Caldw ell Fire Dept Essex North Caldw ell X X X X X X 27,362 Nutley Fire Dept Essex Nutley X X X X X * 32,868 City of Orange Tw p Essex Orange X X X X X X 5,298 Roseland Vol Fire Dept Essex Roseland X X X X X X 16,964 South Orange Fire Dept Essex South Orange X X X X X X 13,533 Verona Boro Fire Dept Essex Verona * X * X 11,233 West Caldw ell Tw p Fire Dept Essex West Caldw ell X X X X X X 44,943 West Orange Fire Dept Essex West Orange X X X X X X 19/1 2 0 / 0 18 / 1 18 / 2 19 / 0 17/ 1 783, , , , , , ,
127 Population FD NAME FDID County Name CITY NAME GLOUCESTER COUNTY ,307 Woodbury Fire Dept Gloucester Woodbury X X X X X X 4,500 Westville Fire Dept Gloucester Westville X X X X X X 2,317 Wenonah Fire Dept Gloucester Wenonah X X X X X X 2,988 Woodbury Hgts Boro Fire Dept Gloucester Woodbury Heights Boro X X X X X X 4,879 Gibbstow n Vol Fire Co Gloucester Gibbstow n X X X X X X 3,032 Woolw ich Fire Dept Gloucester Woolw ich X X X X X X 19,068 Glassboro Fire Dept # Gloucester Glassboro X X X X X X 3,110 Pitman Fire Department Gloucester Pitman X X X X X X 2,417 Harrisonville Fire Co Gloucester Harrisonville X X X * 7,139 Clayton Vol Fire Co # Gloucester Clayton X X X X X X 1,616 New field Boro Fire Dept Gloucester New field * X * X X 4,842 Thorofare Fire Co Gloucester Thorofare X X X X X 4,842 Verga Fire Co Gloucester Westville X X X X * X 4,842 Colonial Manor Fire Assn Gloucester Woodbury X X X X X X 3,842 Greenfields Fire Co Gloucester Woodbury X X X X * 3,205 National Park Boro Dept # Gloucester National Park X X X 26,763 Deptford Fire Dept Gloucester Deptford X X X X X X 47,114 Washington Tw p Fire Dept Gloucester Turnersville X X X X X 6160 Paulsboro Fire Dept Gloucester Paulsboro X X X X X X 3,016 Bridgeport Vol Fire Dept Gloucester Bridgeport X X X X X X 3,016 Repaupo Vol Fire Co Gloucester Logan Tow nship X X X * X X 4930 East Greenw ich Fire Dept Gloucester Clarksboro * N/A N/A N/A N/A Merged East Greenw ich Fire Dept Gloucester Clarksboro N/A N/A * X Mt. Royal FC N/A N/A X X X X 3,554 Barnsboro Vol Fire Co Gloucester Sew ell X X X X X 3,554 Mantua Vol Fire Co # Gloucester Mantua X X X X X 3,554 Centre City Vol Fire Co Gloucester Mantua X X X X X X 3,554 Mutual Fire Co #1 - Sew ell Gloucester Sew ell X X X * X * 4,394 Harmony Vol Fire Dept Gloucester Mullica Hill X X X * * 4,394 Ew an Vol Fire Co Gloucester Ew an X X X X X * 14,483 Williamstow n Fire Dept Co # Gloucester Williamstow n X X X X X X 14,483 Cecil Fire Co #1 Inc Gloucester Cecil X X X X X X 1,171 Aura Vol Fire Co # Gloucester Glassboro X * X X * X 1,171 Ferrell Vol Fire Co # Gloucester Monroeville X X X 1,171 Law ns Vol Fire Co # Gloucester Glassboro X 3,093 Franklinville Fire Co Gloucester Franklinville X X X * X X 3,093 Janvier Vol Fire Co Gloucester Franklinville X X X 3,093 Star Cross Vol Fire Co Gloucester Franklinville X X X X X X 3,093 Malaga Vol Fire Co Gloucester Malaga X X X X X X Forest Grove Vol Fire Co Gloucester Vineland X X X X * X 36/2 35/1 36/2 29/4 27/5 26/3 244, , , , , , ,
128 Population FD NAME FDID County Name CITY NAME HUDSON COUNTY-8 61,842 Bayonne Fire Dept Hudson Bayonne X X * * X X 2,377 East New ark Boro Fire Dept Hudson East New ark X X X 14,424 Harrison Fire Dept Hudson Harrison X X X * X * 38,577 City of Hoboken Hudson Hoboken X X X X X X 240,055 Jersey City Fire Dept Hudson Jersey City X X X X X X 40,513 Kearny Fire Dept Hudson Kearny X X X X X 15,931 Secaucus Fire Dept Hudson Secaucus X X X * 195,256 North Hudson Reg FD Hudson North Bergen X X X X X X 8/0 8/0 7/1 4/2 6/0 4/2 608, , , , , , ,085 HUNTERDON COUNTY-27 1,488 Frenchtow n Fire Dept Hunterdon Frenchtow n X X X X X X 1,902 Glen Gardner Fire Co # Hunterdon Glen Gardner X X X X X X 1,546 Hampton Boro Fire Co Hunterdon Hampton X X X X X * 3,776 High Bridge Fire Dept Hunterdon High Bridge X X X X X X 5,124 Holland Tw p Vol Fire Co Hunterdon Milford X * 3,782 Kingw ood Tw p Vol Fire Co Hunterdon Baptistow n X X X X X 3,868 Lambertville Boro Fire Dept # Hunterdon Lambertville X X X X 1,085 Lebanon Fire Co Hunterdon Lebanon X X X X X X 5,816 Lebanon Tw p Vol Fire Dept Inc Hunterdon Glen Gardner X X X X X X 19,809 Raritan Tw p Fire Co Hunterdon Flemington X X X X X X 3,950 Whitehouse Station Fire Dept Hunterdon Whitehouse Station X X X X X X 560 Stockton Fire Co Hunterdon Stockton X X X X X X 5,541 Oldw ick Fire Co Hunterdon Oldw ick * X X X 6,160 Pattenburg Vol Fire Co Hunterdon Clinton X X X X X X 2,383 West Amw ell Tw p Fire Dept Hunterdon Three Bridges X X * * 3,950 East Whitehouse Fire Dept Hunterdon Whitehouse X X X X X X 3,950 Readington Vol Fire Co Hunterdon Whitehouse Station X X X X X X 3,950 Three Bridges Vol Fire Co Hunterdon Three Bridges X X X X X X 886 Bloomsbury Hose Fire Dept Hunterdon Bloomsbury X X X X X X 1,055 Califon Boro Fire Co Hunterdon Califon X X X X X X 6,478 Clinton Tw p Fire Dept Hunterdon Clinton X X X X X * 6,478 Annandale Hose Co # Hunterdon Annandale X X X X X X 4,478 Sergeantsville Vol Fire Co Hunterdon Delaw are Tw p X X X X * X 4,455 Amw ell Valley Fire Co Hunterdon Ringoes X X X X X X 4,200 Flemington Boro Fire Dept Hunterdon Flemington X X X X X X 2,990 Quakertow n Fire Co Hunterdon Pittstow n X X X X X X 1,195 Milford Boro Fire Co Inc Hunterdon Milford X X X X X X 25/1 26/1 25/0 25/1 22/1 21/3 110, , , , ,731 94,025 96,

129 Population FD NAME FDID County Name CITY NAME MERCER COUNTY-26 9,678 Hamilton Tw p Fire Dist # Mercer Hamilton Tow nship X X X X X X 9,678 Hamilton Fire Dist # Mercer Hamilton Tow nship X X X X X * 9,678 Hamilton Fire Co # Mercer Hamilton Tow nship X X X X X X 9,678 DeCou Fire Co Mercer Hamilton Tow nship X X X X X X 9,678 White Horse Fire Co # Mercer Hamilton Tow nship X X X X X * 9,678 Nottingham Vol Fire Co Mercer Hamilton Square X X X X X X 9,678 Colonial Vol Fire Co Mercer Hamilton Tow nship X X X X X X 9,678 Hamilton Tw p Fire Dist # Mercer Hamilton Tow nship X X X X X X 9,719 Slackw ood Vol Fire Co Mercer Law renceville X X X X X X 9,719 Law rence Rd Fire Dept Mercer Law renceville X X X X X X 9,719 Law renceville Fire Co Mercer Law renceville X X X X X X 8,926 Prospect Hgts Vol Fire Co # Mercer Ew ing X X X X X X 8,926 Pennington Road Fire Co Mercer Ew ing X X X X X X 8,926 West Trenton Vol Fire Co Mercer West Trenton X X X X X X 8,926 Trenton-Mercer Airport FD Mercer West Trenton X X X 10,275 Washington Vol Firemen Inc Mercer Robbinsville X X X X X X 5,216 Hightstow n Eng Co # Mercer Hightstow n X X X X X X 12,459 East Windsor Fire Co # Mercer East Windsor X X X X X X 12,459 West Windsor Tw p Vol FC # Mercer Princeton-Junction X X X X X 10,953 Princeton Junction Fire Dept Mercer Princeton Junction X X X X 10,953 East Windsor Vol Fire Co # Mercer East Windsor X X X X X 2,696 Pennington Boro Fire Dept Mercer Pennington X X * X * 2,035 Hopew ell Boro Fire Dept Mercer Hopew ell X X X X X X 16,105 Hopew ell Tw p Fire Dist # Mercer Titusville X X X X X X 14,203 Princeton Boro Fire Dept Mercer Princeton X X X X X X 85,403 Trenton Fire Dept Mercer Trenton X X X X X X 26/0 26/0 25/1 22/0 24/0 21/3 325, , , , , , ,163 Photograph courtesy of Chris Pujat 129
130 Population FD NAME FDID County Name CITY NAME MIDDLESEX COUNTY-48 20,709 Carteret Fire Dept Middlesex Carteret X X X X X X 3,227 Cranbury Tw p Fire Dept Middlesex Cranbury X X X 6,823 Dunellen Fire Dept Middlesex Dunellen X X X X X X 97,687 Edison Division of Fire Middlesex Edison X X X * X X 1,825 Helmetta Boro Fire Dept Middlesex Helmetta X X X X X 13,999 Highland Park Boro Fire Dept Middlesex Highland Park X X X X X X 6,025 Jamesburg Boro Vol Fire Co Middlesex Jamesburg X X X X X 13,717 Middlesex Fire Department Middlesex Middlesex X X X X X 7,000 Milltow n Boro Fire Dept Middlesex Milltow n X X X X X X 48,711 New Brunsw ick Fire Dept Middlesex New Brunsw ick X X X X X X 36,287 North Brunsw ick Vol Co # Middlesex North Brunsw ick X X X X X X 47,303 Perth Amboy Fire Dept Middlesex Perth Amboy X X X X X X 20,215 Plainsboro Fire Co Middlesex Plainsboro X X X X X X 40,377 Sayreville Fire Dept Middlesex Sayreville X X X X X X 21,810 South Plainfield Vol Fire Co Middlesex South Plainfield X X X X X X 15,322 South River Fire Dept Middlesex South River X X X X 7,880 Spotsw ood Fire Dept Middlesex Spotsw ood X X X X X X 15,585 E Brunsw ick Tw p Ind Fire Co Middlesex East Brunsw ick X X X X X Princeton Plasma Physics Lab Middlesex X X X X 12,840 Metuchen Fire Dept Middlesex Metuchen X X X X X X 15,114 Old Bridge Vol Fire Co Middlesex East Brunsw ick X * X X X X 15,114 Laurence Harbor Fire Co Middlesex Laurence Harbor X X X 9,333 Monroe Tw p Fire Dept Middlesex Spotsw ood X X X X X X 8,413 New Market Fire Co Middlesex Piscataw ay X X X X * 12,578 Kendall Park Fire Dept Middlesex Kendall Park * 10,800 Woodbridge Fire Dept Middlesex Woodbridge X X X X X X 7,913 South Amboy Fire Dept Middlesex South Amboy X X X * X X 15,114 Cheesequake Vol Fire Co Middlesex Mataw an X X X X X * 9,333 Applegarth Fire Dept # Middlesex Monroe Tow nship X X X X X X 8,413 North Stelton Vol Fire Co Middlesex Piscataw ay X X X X 13,217 Monmouth Junction Vol Fire Middlesex Monmouth Junction X X X X X X 10,800 Port Reading Fire Dept Middlesex Port Reading X X X X * 15,585 Brookview Vol Fire Co # Middlesex East Brunsw ick X X X 15,114 So Old Bridge Vol Fire Dept Middlesex Old Bridge X X X X X X 9,333 Central Monroe Fire Dept # Middlesex Jamesburg X X X X X X 8,413 Arbor Hose Co # Middlesex Piscataw ay X X X X X X 12,578 Kingston Vol Fire Co # Middlesex Kingston X X X X X X 10,800 Iselin Hook & Ladder # Middlesex Iselin X X X X * * 15,114 Madison Park Fire Dist # Middlesex Parlin X X X X X X 8,413 River Road Fire Co Middlesex Piscataw ay X X X X X X 10,800 Keasbey Fire Dept Middlesex Keasbey X X X 8,413 Holmes Marshall Vol Fire Co Middlesex Piscataw ay X X X X 10,800 Avenel Fire Dist # Middlesex Avenel X X X X X X 8,413 Possumtow n Vol Fire Co Middlesex Piscataw ay X X * X * * 10,800 Colonia Chemical Hook & Ladder Middlesex Colonia X X X X X X 10,800 Fords Fire Co # Middlesex Fords X X X X X X 10,800 Hopelaw n Engine Co # Middlesex Hopelaw n X X X X X X 10,800 Iselin Vol Fire Co # Middlesex Iselin X X * * 46/0 45/1 44/2 40/2 33/4 33/5 750, , , , , , ,
131 Population FD NAME FDID County Name CITY NAME MONMOUTH COUNTY Allenhurst Fire Dept Monmouth Allenhurst X X 1,882 Hope Fire Co # Monmouth Allentow n Boro X X X X X 16,930 Asbury Park Fire Dept Monmouth Asbury Park X X X X X X 3763 Wayside Fire Co Monmouth Tinton Falls X X 3,763 Tinton Falls Fire Co Monmouth Tinton Falls X X X X X 3,763 Pinebrook Fire Co Monmouth Eatontow n Boro X 3,763 North Side Engine Co # Monmouth Tinton Falls X X 7126 Hazlet Fire Co Monmouth Hazlet X X X X X X 12,331 Colts Neck Vol Fire Dept Monmouth Colts Neck Tow nship X X X X X X 7,126 West Keansburg Fire Co Monmouth West Keansburg * X X X X X 7,126 Hazlet Tw p./no. Centerville FD Monmouth Hazlet X X X X * 4,705 Atlantic Highlands Fire Dept Monmouth Atlantic Highlands X X X X X X 2,244 Avon By The Sea Fire Dept Monmouth Avon X X X 6,045 Belmar Boro Fire Dept Monmouth Belmar Boro X X X X * * 4,793 Bradley Beach Vol Fire Dept Monmouth Bradley Beach * X X X X X 4,893 Brielle Fire Co # Monmouth Brielle X X X X 1,070 Deal Fire Co # Monmouth Deal X X X X X 14,008 Eatontow n Fire Dept Monmouth Eatontow n X X X X * 1,764 Englishtow n Fire Dept Monmouth Englishtow n X X X X 5,937 Fair Haven Boro Fire Dept Monmouth Fair Haven 1,587 Farmingdale Fire Dept # Monmouth Farmingdale X X X X X X 10,976 Freehold Boro Fire Dept Monmouth Freehold X X X X * * 15,768 East Freehold Fire Co Monmouth Freehold X X X X X X 15,768 Independent Fire Co # Monmouth Freehold X X X * 5,097 Highlands Fire Department Monmouth Highlands X X X X X X 15,781 Holmdel Fire Department Monmouth Holmdel X X X X X X 9,780 How ell Tw p Fire Dist # Monmouth Farmingdale X X X X X 9,780 Adelphia Fire Co Monmouth Adelphia X X X X X X 9,780 Southard Fire Dept Monmouth How ell X X X X X X 9,780 Ramtow n-how ell Fire Co # Monmouth How ell X X X X * X 9,780 Freew ood Acres Fire Co Monmouth How ell X X * X X 10,732 Keansburg Fire Dept Monmouth Keansburg X * * 7,568 Keyport Fire Dept Monmouth Keyport X X X X * 6,170 Little Silver Fire Dept Monmouth Little Silver * X X X X 31,340 Long Branch Fire Dept Monmouth Long Branch X X X X X X 16,711 Manalapan Tw p Fire Co # Monmouth Manalapan X 16,711 Gordons Corner Fire Co Monmouth Manalapan X X X X X X 6,310 Manasquan Fire Dept Monmouth Manasquan X X X 7,279 Marlboro Vol Fire Co Monmouth Marlboro X X X X X X 7,279 Robertsville Fire Co # Monmouth Morganville X * * * 7,279 Morganville Vol Fire Co# Monmouth Morganville X X X X X X 8,910 Mataw an Vol Fire Dept Monmouth Mataw an X X X X X 8,727 Aberdeen Tw p Hose/Chem # Monmouth Aberdeen X X X X X X 8,727 Cliffw ood Vol # Monmouth Cliffw ood X X X X X X 66,327 Middletow n Tw p Fire Dept Monmouth Leonardo X X X * X 131
 67 67 67 67 67 67 8,970 Millstone Tw p Fire Co 13320 Monmouth Clarksburg X X X X X X 3,595 Monmouth Beach Fire Dept 13330 Monmouth Monmouth Beach X X X X X X 13,845 Neptune Tw p Fire Bureau 13340")
132 Population FD NAME FDID County Name CITY NAME MONMOUTH COUNTY (CONT.) ,970 Millstone Tw p Fire Co Monmouth Clarksburg X X X X X X 3,595 Monmouth Beach Fire Dept Monmouth Monmouth Beach X X X X X X 13,845 Neptune Tw p Fire Bureau Monmouth Neptune X X X X X * 13,845 Ocean Grove Fire Dept Monmouth Ocean Grove X X X X 5,218 Neptune City Fire Dept Monmouth Neptune City X X X X 13,481 Oakhurst Fire Dept Monmouth Oakhurst X X X X X X 13,481 Wanamassa Fire Co # Monmouth Ocean X X X X X X 5,807 Oceanport Fire Dept Monmouth Oceanport X X X X X * 11,844 Red Bank Fire Dept Monmouth Red Bank X X X X X X 933 Roosevelt Vol Fire Dept Monmouth Roosevelt X 7,137 Rumson Boro Fire Dept Monmouth Rumson X * X X X X 1,818 Sea Bright Boro Fire Dept Monmouth Sea Bright Boro X X X 2,148 Sea Girt Fire Co # Monmouth Sea Girt X X X * 3,590 Shrew sbury Hose Co # Monmouth Shrew sbury X X X X X X 1,806 South Belmar Fire Co # Monmouth South Belmar X X X 3,567 Spring Lake Boro Fire Dept Monmouth Spring Lake X X X * X 5,227 Independent Fire Co # Monmouth Spring Lake Heights X X X X X X 6,649 Union Beach Boro Fire Dept Monmouth Union Beach X X X X X X 25,261 Wall Fire Co # Monmouth X * X * X X 8,420 Glendola Fire Co # Monmouth Wall X X X X X X 8,420 South Wall Fire Co # Monmouth Belmar X X X X X X 8,258 West Long Branch Fire Dept Monmouth Long Branch X * 63/3 55/ 5 55/1 47/ 4 40/6 37/ 8 611, , , , , , ,453 Photograph courtesy of Michael Gallagher 132
133 Population FD NAME FDID County Name CITY NAME MORRIS COUNTY ,496 Tow n of Boonton Fire Dept Morris Boonton X X X X X 4,287 Boonton Tw p Fire Dept Morris Boonton X X X * 7,420 Butler Fire Dept Morris Butler X X X X X X 5,864 Fairmount Fire Co # Morris Washington Tow nship X X X X X X 8,460 Chatham Boro Fire Dept Morris Chatham Boro X X X X * 5,043 Green Village Vol Fire Dept Morris Chatham Tow nship 5,043 Chatham Tw p Vol Fire Dept Morris Chatham X X X X X X 1,635 Chester Vol Fire Co # Morris Chester X X * 15,824 Denville Vol Fire Dept Morris Denville X X X X * X 18,188 Dover Fire Dept Morris Dover X X X X X X Morristow n Aircraft Rescue Morris Morristow n X X X * X X 11,393 East Hanover Fire Dept Morris East Hanover * X X X X X 8,857 Florham Park Vol Fire Dept Morris Florham Park X X X X X X 6,449 Whippany Fire Dept Morris Whippany X X X X X X 6,449 Cedar Knolls Fire Dept Morris Whippany X X X X X * 3,180 New Vernon Vol Fire Dept Morris New Vernon X X X X X X 19,717 Jefferson Tw p Fire Dept Morris Lake Hopatcong X X X X X X 9,365 Kinnelon Vol Fire Co Morris Kinnelon X X X X X X 10,930 Lincoln Park Boro Fire Dept Morris Lincoln Park X X X X X 16,530 Madison Fire Dept Morris Madison X X X X X X 5,097 Mendham Boro Fire Dept Morris Mendham Borough X X X X X X 2,700 Brookside Engine Co. # Morris Brookside X X X X X X 2,700 Ralston Engine Co. # Morris Brookside 3,679 Mine Hill Fire Department Morris Mine Hill X X X X X X 6,985 Pine Brook Vol Fire Dept Morris Pine Brook X X X X X X 6,946 Tow aco Vol Fire Dept Morris Tow aco X X X X X X 6,946 Montville Fire Department Morris Montville X X X X X X 21,796 Morris Tw p Fire Dept Morris Convent Station X X X X X X 5,236 Morris Plains Fire Dept Morris Morris Plains X X X X X X 18,544 Morristow n Tw p Fire Dept Morris Morristow n X X X X * * 4,256 Mountain Lakes Fire Dept Morris Mountain Lakes X X X X X X 4,663 Mt Arlington Fire Dept Morris Mt Arlington X X X 12,096 Flanders Fire & Rescue Morris Flanders X X X X X X 12,096 Budd Lake Fire Dept Morris Budd Lake X X X X X 2,580 Netcong Fire Dept Morris Netcong X X X * * X 7,235 Mt Tabor Fire Dept Morris Mt Tabor X X X X X X 7,235 Rainbow Lakes Vol Dist # Morris Denville X X X X X X 7,235 Lake Parsippany Vol Co # Morris Parsippany X X X X X X 7,235 Lake Hiaw atha Vol Fire Dept Morris Parsippany X X X X X X 7,235 Parsippany Troy Hills Dist # Morris Parsippany X X X X X X 7,235 Parsippany Troy Hills Dist # Morris Parsippany X X X X X 4,016 Millington Vol Fire Co Morris Millington X X X X X 4,016 Stirling Vol Fire Co # Morris Stirling X X X X X 13,888 Pequannock Tw p Fire Dept Morris Pequannock X X X X X X 24,847 Randolph Tw p Fire Dept Morris Randolph X X X X X X 2,498 Riverdale Fire Dept Morris Riverdale X X X X X X 6,473 Rockaw ay Boro Fire Dept Morris Rockaw ay X * * X X X 22,930 Rockaw ay Tw p Fire Dept Morris Rockaw ay X X X X X Green Pond Fire Dept Morris Rockaw ay X X N/A N/A N/A N/A 23,883 Roxbury Tw p Fire Dept Morris Ledgew ood X X X X X X 1,546 Victory Gardens Fire Dept Morris Dover X X 5,864 Long Valley Vol Fire Co Morris Long Valley X X X * X X 5,864 Schooley's Mountain Fire Co Morris Schooleys Mountain X X X X X 6,298 Wharton Fire Dept Morris Wharton X X X X * X Greystone Park Fire Dept Morris Greystone * * * X 50/2 51/1 48/2 44/5 41/6 39/2 454, , , , , , ,
134 Population FD NAME FDID County Name CITY NAME OCEAN COUNTY-47 60,352 Lakew ood Fire Dept Ocean Lakew ood X X X X X X 7,635 Barnegat Fire Co # Ocean Barnegat X X X X X X 7,635 Pinew ood Estates Fire Dept Ocean Barnegat X X * 764 Barnegat Light Vol Fire Co Ocean Barnegat Light X 1,238 Bay Head Fire Co # Ocean Bay Head X X * * 1,278 Beach Haven Vol Fire Co # Ocean Beach Haven X X * 10,375 Beachw ood Vol Fire Co # Ocean Beachw ood X X X X X X 13,330 Bayville Vol Fire Co Ocean Bayville X X X X X X 13,330 Manitou Park Vol Fire Co Ocean Toms River * X X X X X 13,330 Pinew ald Pioneer Vol Fire Co Ocean Bayville X X X X X X 19,029 Brick-Breton Woods FC Ocean Brick X X X X X X 19,029 Brick-Pioneer Hose Co # Ocean Brick X X X X X X 19,029 Brick-Laurelton FC Ocean Brick X X X X X X 19,029 Brick-Herbertsville Fire Co Ocean Bricktow n X X X X X X 89,706 Dover Tw p Fire Dept Ocean Toms River X X * * X 12,976 Manchester Vol Fire Co # Ocean Manchester X X X X X 12,976 Whiting Vol Fire Co # Ocean Manchester X X X X X X 12,976 Ridgew ay Vol Fire Co # Ocean Manchester X * X X * X 423 Mantoloking Fire Co # Ocean Mantoloking X X X 6,450 Waretow n Vol Fire Co # Ocean Waretow n X X X X X X 2,076 Ocean Gate Vol Fire Co Ocean Ocean Gate X X X X X X 1,950 Pine Beach Fire Dept Ocean Pine Beach X X X X X X 7,275 New Egypt Fire Co # Ocean New Egypt X X X * X 19,306 Point Pleasant Boro Co # Ocean Point Pleasant X X X X X X 5314 Pt Pleasant Beach Fire Co # Ocean Pt Pleasant Beach X X X X X X 3,155 Seaside Heights Fire Dept Ocean Seaside Heights X X X X X * 2,263 Seaside Park Vol Fire Dept Ocean Seaside Park X X X X X X 1,384 Ship Bottom Vol Fire Co Ocean Ship Bottom X X X X X X 11,266 Stafford Tw p Fire Co # Ocean Manahaw kin X X X X X X 11,266 Warren Grove Fire Co Ocean Warren Grove X 1,442 Surf City Vol Fire Co # Ocean Surf City X X X X X X 3,517 Tuckerton Fire Co #1 Inc Ocean Tuckerton X X X X X X 359 High Point Vol Fire Co Ocean Harvey Cedars X X X X X 1,441 Eaglesw ood Fire Co Ocean West Creek X X X X X X 1,751 Island Heights Vol Fire Co Ocean Island Heights X X X X X 10,704 Jackson Mills Vol Fire Co Ocean Jackson X X X X X X 10,704 Jackson Tw p Vol Fire Co # Ocean Jackson X X X X X X 10,704 Cassville Vol Fire Co # Ocean Jackson X * X * 10,704 Whitesville Vol Fire Co # Ocean Jackson X X X X X X 8,448 Bamber Lakes Fire Dept Ocean Forked River X X X X X X 8,448 Forked River Fire Dept Ocean Forked River X X X X * 8,448 Lanoka Harbor Fire Dept Ocean Lanoka Harbor X X X X X X 2,522 Lakehurst Fire Dept Ocean Lakehurst X X * 2,665 Lavallette Fire Co # Ocean Lavallette X X X * X 5,315 Parkertow n Fire Co Ocean Little Egg Harbor X X X 5,315 West Tuckerton Fire Co Ocean Little Egg Harbor X X X X X 5,315 LEH Dist #2/Mystic Island VFC Ocean Little Egg Harbor X X 44/1 44/1 37/3 35/4 33/4 32/3 503, , , , , , ,
135 Population FD NAME FDID County Name CITY NAME PASSAIC COUNTY-23 7,610 Bloomingdale Fire Dept Passic Bloomingdale X X X X X 76,672 Clifton Fire Dept Passic Clifton X X X X X X 8,252 Haledon Fire Department Passic Haledon X X X * X X 18,218 Haw thorne Fire Dept Passic Haw thorne X X X X X X 10,855 Little Falls Fire Dept Passic Little Falls X X X X X X 7,920 North Haledon Vol Fire Dept Passic North Haledon X X X X X X 67,861 Passaic Fire Dept Passic Passaic X X X X X X 149,222 Paterson Fire Dept Passic Paterson X X X X X X 10,640 Pompton Lakes Fire Dept Passic Pompton Lakes X X X X * X 5,779 Prospect Park Fire Dept Passic Prospect Park X X X x X 4,132 Erskine Lakes Vol Co # Passic Ringw ood X X X * X * 4,132 Ringw ood Vol Fire Co # Passic Ringw ood X * X 4,132 Skyline Lakes Fire Passic Ringw ood X X X X * 9,892 Totow a Fire Dept Passic Totow a X X X X 10,266 Wanaque Boro Vol Fire Dept Passic Wanaque X X X X X X 54,069 Tw p of Wayne Fire Dept Passic Wayne X X X X X X 4,401 Apshaw a Fire Co # Passic West Milford X X X * X X 4,401 Community Fire Co # Passic West Milford X X X X X X 4,401 Greenw ood Forest Fire Co # Passic West Milford X X X X X X 4,401 Macopin Fire Co # Passic West Milford X X X X X X 4,401 Upper Greenw ood Lake Co Passic Hew itt X X X * X X 4,401 West Milford Fire Co # Passic West Milford X X X X X X 10,987 West Paterson Fire Dept Passic West Paterson X X X X X 23/0 22/1 22/0 18/4 17/2 19/1 487, , , , , , ,411 SALEM COUNTY-19 2,774 Allow ay Tw p Fire Co Salem Allow ay X X X X X X 1,384 Elmer Fire Dept Salem Elmer X X X X X X 1,092 Elsinboro Fire Co Salem Salem X X X X * 1,851 Low er Allow ays Creek Fire/Res Salem Hancocks Bridge X X X X X 6,597 Pennsville Fire/Rescue # Salem Pennsville X X X X X X 6,597 Deepw ater Fire Co Salem Deepw ater X X * X X X 1,559 Mannington Fire Co # Salem Salem X X X X X X 899 Logan Vol Fire Co Salem Pedricktow n X X X X X X 899 Auburn Vol Fire Co Salem Auburn X X X X X * 4,886 Penns Grove Liberty # Salem Penns Grove X X X X X X 2,964 Willow Grove Vol Fire Co Salem Pittsgrove X X X X X X 2,964 Norma-Alliance Fire & Rescue Salem Norma X X X X * 2,964 Centerton Fire Co Salem Pittsgrove X X X X X X 2,786 Quinton Fire Co Salem Quinton X X X X * X 5,857 Salem City Fire Dept Salem Salem X X * X X 7,684 Carneys Point Fire & Rescue Salem Carneys Point X X X X X X 1,734 Daretow n Fire Co Salem Elmer X X X X X X 1,734 Monroeville VFC Salem Monroeville X X X X X X 3,136 Reliance Fire Co Salem Woodstow n X X X X X X 19/0 19 / 0 17/ 2 18 / 0 16 / 3 15/ 1 60,361 60,361 60,361 60,361 58,510 60,361 50,
136 Population FD NAME FDID County Name CITY NAME SOMERSET COUNTY Far Hills-Bedminster Fire Dept Somerset Far Hills X X X X X X 8,302 Pottersville Vol Fire Co Somerset Pottersville X X X X X X 12,287 Basking Ridge Fire # Somerset Basking Ridge * X X X X X 12,287 Liberty Corner Fire Co Somerset Liberty Corner X X 7,345 Bernardsville Fire Co # Somerset Bernardsville * X X X * 10,155 Bound Brook Fire Dept Somerset Bound Brook X X * * X X 4,855 Neshanic Vol Fire Co Somerset Neshanic Station X X X X X X 4,855 North Branch Vol Fire Co Somerset North Branch X X X X X X 4,855 Country Hills Fire Co Somerset Somerville X X X 10,735 Bradley Gardens Vol Fire Co Somerset Bridgew ater X X X X X 10,735 Finderne Fire Dept Somerset Bridgew ater X X X X X 10,735 Green Knoll Vol Fire Co Somerset Bridgew ater X X X X X 10,735 Martinsville Vol Fire Dept Somerset Martinsville X X X 5,655 Millstone Valley Fire Co Somerset East Millstone X X X X X X 5,655 Somerset Vol Fire/Rescue # Somerset Somerset X X X X X X 5,655 Elizabeth Av Vol Fire Co Somerset Somerset X X X X X X Merged East Franklin Tw p Fire Co Somerset Franklin Tw p N/A X (Now 18086) Community Vol Fire Co # Somerset Franklin Tw p N/A X 11,310 Franklin Tw p Fire District # Somerset Franklin Tw p X N/A N/A N/A N/A N/A 5,655 Franklin Park Fire Co # Somerset Franklin Park X * * 5,655 Little Rocky Hill Fire Dept Somerset Princeton 5,655 Middlebush Vol Fire Dept Somerset Somerset X X X X X X 5,655 Griggstow n Vol Fire Co Somerset Princeton 5,654 Green Brook Vol Fire Dept Somerset Green Brook * X X X X 12,211 Hillsborough Vol Fire Co # Somerset Flagtow n X X * X X X 12,211 Hillsborough Fire Co # Somerset Hillsborough X X X X X X 12,211 Hillsborough Vol Fire Co # Somerset Belle Mead X X X X X X 10,343 Manville Fire Dept Somerset Manville X X X X X 8,740 Montgomery Fire Co # Somerset Belle Mead X X X X X X 8,740 Montgomery Fire Co # Somerset Blaw enburg X * X X * 21,103 North Plainfield Fire Dept Somerset North Plainfield X X X X X X 2,433 Peapack Gladstone Fire Co Somerset Gladstone X X X X X X 6,338 Raritan Fire Dept Somerset Raritan X X X X X X 662 Rocky Hill Hook & Ladder # Somerset Rocky Hill X X * X 12,423 Somerville Fire Dept Somerset Somerville X X X X X X 4,492 South Bound Brook Co # Somerset South Bound Brook X X X X X X 14,259 Warren Tw p Vol Fire Dept Somerset Warren X X X X X 5,613 Watchung Fire Dept Somerset Watchung X X X X X 29/3 32/2 29/2 25/1 26/2 24/2 297, , , , , , ,
137 Population FD NAME FDID County Name CITY NAME SUSSEX COUNTY Andover Borough Fire Co Sussex Andover X 5,420 Frankford Tw p Fire Dept Sussex Frankford Tw p X X X X X X 845 Branchville Hose Co # Sussex Branchville X X X X X X 1,825 Sandyston Tw p Fire Dept Sussex Sandyston X X X x X X 5,160 Franklin Fire Dept Sussex Franklin X X X X X X 3,220 Green Tw p Vol Fire Dept Sussex Green Tw p X * X 3,105 Hamburg Boro Fire Dept Sussex Hamburg * X X X X X 4,943 Hampton Tw p Vol Fire Dept Sussex Hampton Tw p X X X X X X 6,171 Hardyston Tw p Fire Dept Sussex Hardyston X X X X X X 2,300 Lafayette Tw p Fire Dept Sussex Lafayette X X X X X X 3,412 Montague Vol Fire Dept Sussex Montague X X X X X X 8,.244 New ton Fire Dept Sussex New ton X X X X X X 2,133 Stillw ater Tw p Fire Dept Sussex Stillw ater X X X X X X 2,133 Sw artsw ood Vol Fire Dept Sussex Stillw ater X X X X X X 2,860 Fredon Vol Fire Co Sussex New ton X X X * * X 6,033 Andover Tw p Fire Dept Sussex New ton X X X X X X 2,638 Ogdensburg Fire Dept Sussex Ogdensburg X X X X X 18,080 Sparta Tw p Fire Dept Sussex Sparta X X X X X X 8,254 Byram Tw p Fire Detp Sussex Byram Tw p * X X X X 3,584 Stanhope Fire Dept Sussex Stanhope X X 15,888 Hopatcong Fire Dept Sussex Hopatcong X X * * X X 6,171 Pochuck Valley Fire Dept Sussex Vernon * X X X X X 10,387 Wantage Fire Dept Sussex Wantage X X X X * X 2,145 Sussex Fire Dept Sussex Sussex X X X X X X 6171 Vernon Vol Fire Co Sussex Vernon X X X X X X 6,171 Highland Lakes Fire Dept Sussex Vernon X X X X X X 6,171 Mc Afee Vol Fire Co Sussex Vernon * X X X X X 22/3 24/2 22/1 22/2 22/2 26/0 144, , , , , , ,619 UNION COUNTY-21 13,407 Berkeley Hgts Fire Dept Union Berkeley Heights X X X X X X 14,597 Clark Vol Fire Dept Union Clark X X X 22,578 Cranford Fire Dept Union Cranford X X X X X X 120,568 Elizabeth Fire Dept Union Elizabeth X X X X X X 7,174 Fanw ood Fire Dept Union Fanw ood X X X X X 4,153 Garw ood Fire Dept Union Garw ood X X X X X X 21,747 Hillside Fire Dept Union Hillside X X X X X X 7,675 Kenilw orth Fire Dept Union Kenilw orth X X X * 39,394 Linden Fire Dept Union Linden X X X X X X 6,602 Mountainside Fire Dept Union Mountainside X X X X X X 11,907 New Providence Fire Dept Union New Providence X X X X X X 47,829 Plainfield Fire Division Union Plainfield X X X X X X 26,500 Rahw ay Fire Dept Union Rahw ay X X * 21,274 Roselle Fire Dept Union Roselle X X X X X X 13,281 Roselle Park Fire Dept Union Roselle Park X X X X * 22,732 Scotch Plains Fire Dept Union Scotch Plains * X X X X 14,429 Springfield Fire Dept Union Springfield X X X X X X 21,131 Summit Fire Dept Union Summit X X X X X X 54,405 Tw p of Union Fire Dept Union Union X X X X X X 29,644 Westfield Fire Dept Union Westfield X X X X X X 1,514 Winfield Fire Dept Union Winfield X X X 20/0 19/1 20/0 18/0 16/1 15/2 522, , , , , , ,
138 Population FD NAME FDID County Name CITY NAME WARREN COUNTY-23 3,877 Allamuchy Tw p Fire Dept Warren Allmuchy X X X X X 2,482 Alpha Vol Fire Co Warren Alpha X X X 1,382 Mt Lake Fire Co Warren Belvidere X X X X * X 1,382 Good Will Fire Co # Warren Belvidere X X X X X X 5,747 Blairstow n Hose Co # Warren Blairstow n * X * X X 1,384 Franklin Tw p Fire Co Warren Broadw ay X X * X X X 1,384 Asbury Fire Co # Warren Asbury X X X X X X 4,365 Stew artsville Vol Fire Co Warren Stew artsville X X X X X X 10,403 Hackettstow n Fire Dept Warren Hackettstow n X X X * 1,663 Tri County Fire Co Warren Hackettstow n X X X X X X 1,891 Hope Tw p Vol Fire Dept Warren Hope X X X X X * 5,603 Independence Vol Fire Co Warren Great Meadow s * X X 2,977 Know lton Tw p Fire/Rescue # Warren Delaw are * X X X 5,765 Lopatcong Fire Dept Warren Philispburg X X X X X X 1,663 Mansfield Tw p Fire Co Warren Port Murry X X * X X 1,663 Mt Bethel Vol Fire Co Warren Oxford X X X 2,307 Oxford Vol Fire Dept Warren Oxford X X X X X X 15,166 Phillipsburg Fire Dept Warren Phillipsburg X X X X X X 2,729 Harmony Tw p Vol Fire Dept Warren Phillipsburg X X X 3,416 Pohatcong Tw p Fire Dept Warren Phillipsburg X X X X X X 6,712 Washington Boro Fire Dept Warren Washington X X X X X X 6,248 Washington Tw p Vol Fire Dept Warren Washington X X X X X X 3,124 Butler Park Vol Fire Co Warren Washington 19/3 21/0 18/2 16/2 16/1 14/1 93,333 90,209 87,232 85,569 77,732 67,329 57,705 TOTAL STATE POPULATION: 8,273,817 POPULATION REPRESENTED 2006 = 8,048,569 = 97% POPULATION REPRESENTED 2005 = 8,104,997 = 97% POPULATION REPRESENTED 2004 = 7,873,048 = 95% POPULATION REPRESENTED 2003 = 7,671,844 = 92% POPULATION REPRESENTED 2002 = 7,512,243 = 90% POPULATION REPRESENTED 2001 = 7,322,201 = 88% Fire Department Participation 2001 to Not Reporting Reporting

139 county reporting per ting percent centages 139


140 State of New Jersey Jon S. Corzine Governor Department of Community Affairs Division of Fire Safety Lawrence Petrillo Director, State Fire Marshal
FIRE IN NEW JERSEY 2007 Division of Fire Safety
 FIRE IN NEW JERSEY 2007 Division of Fire Safety State of New Jersey Department of Community Affairs Cover photograph courtesy of Office of Fire Department Preparedness DEDICATION We honor the firefighters
LAKE JOHANNA FIRE DEPARTMENT
 LAKE JOHANNA FIRE DEPARTMENT 2017 ANNUAL FIRE REPORT REPORT PREPARED BY: DEBI KRAUSE OFFICE MANAGER & TIM BOEHLKE FIRE CHIEF Lake Johanna Fire Department 2017 Annual Fire Report In 2017 the Lake Johanna
FIRE IN NEW JERSEY. Division of Fire Safety. State of New Jersey Department of Community Affairs
 FIRE FIRE IN IN NEW NEW JERSEY JERSEY 009 Division of Fire Safety State of New Jersey Department of Community Affairs DEDICATION We honor the firefighters who selflessly gave their lives to protect the
NFIRSIncidentTypes TypeCode TypeDescription
 Undetermined incident type 1 Fire 10 Fire, other 100 Fire, other 11 Structure Fire 110 Structure fire, other (conversion only) 111 Building fire 1111 Building fire 112 Fires in structure other than in
INCIDENT TYPE: Structure Fire Fire in mobile property used as a fixed structure
 INCIDENT TYPE: Structure Fire 110 Structure fire, other 111 Building fire 112 Fires in structure other than in a building 113 Cooking fire, confined to container 114 Chimney or flue fire, confined to chimney
Mount Prospect Fire Department
 Location Study Mount Prospect Fire Department 2018 Created by: Illinois Fire Chiefs Association Mount Prospect Fire Department Mission Statement: To protect people, property, and the environment by reducing
Garden City Fire Department
 Garden City Fire Department Garden City, KS This report was generated on 2/20/2018 2:15:00 PM Breakdown by Major Incident Types for Date Range Zone(s): All Zones Start Date: 01/01/2017 End Date: 12/31/2017
Fire Department Quarterly Report
 WEST BLOOMFIELD FIRE & EMS SERVICES 5425 West Maple Rd West Bloomfield MI 48322 Chief s Notes Fire Department Quarterly Report January 1, 2018 March 31, 2018 Fire Station 3 is closed; plans are moving
Fire Department Year End Report
 WEST BLOOMFIELD FIRE & EMS SERVICES 5425 West Maple Rd West Bloomfield MI 48322 Fire Department Year End Report January 1, 2017 December 31, 2017 Chief s Notes Closing of Fire Station 3 is scheduled for
Sylvania Township Fire Department. JULY 2015 Monthly Report
 JULY 2015 Monthly Report Our mission is to prevent and minimize the loss of life and property damage from fire to our citizens and visitors; to provide high quality emergency medical services; to mitigate
Fire Chief s Report December 2018 November 2018 Incidents by Station
 Fire Chief s Report December 2018 November 2018 Incidents by Station 150 - Outside rubbish fire, other 1 Total Incidents for : 3 150 - Outside rubbish fire, other 2 324 - Motor vehicle accident with no
Sylvania Township Fire Department. JANUARY 2016 Monthly Report
 JANUARY 2016 Monthly Report Our mission is to prevent and minimize the loss of life and property damage from fire to our citizens and visitors; to provide high quality emergency medical services; to mitigate
FIRE IN NEW JERSEY. Division of Fire Safety. State of New Jersey Department of Community Affairs
 FIRE IN NEW JERSEY 03 Division of Fire Safety State of New Jersey Department of Community Affairs PAGE INTENTIONALLY LEFT BLANK DEDICATION We honor the firefighters who selflessly gave their lives to
Sylvania Township Fire Department. MARCH 2016 Monthly Report
 MARCH 2016 Monthly Report Our mission is to prevent and minimize the loss of life and property damage from fire to our citizens and visitors; to provide high quality emergency medical services; to mitigate
Sylvania Township Fire Department. AUGUST 2015 Monthly Report
 AUGUST 2015 Monthly Report Our mission is to prevent and minimize the loss of life and property damage from fire to our citizens and visitors; to provide high quality emergency medical services; to mitigate
Burlington Fire Department Monthly Report February 2018
 Burlington Fire Department Monthly Report February 2018 The Mission of the Burlington Fire Department is to provide for the fire and life safety needs of the community in the most professional, courteous,
October 2013 SCFIRS Report
 October 2013 SCFIRS Report SCFIRS Team Community Risk Reduction Division of Fire and Life Safety (803)-896-1250 SCFIRS@llr.sc.gov Twitter: @SCFIRS 12/1/2013 1 October 2013 SCFIRS Report 14,526 REPORTED
Response Per EMS Unit. Response Per Supression Unit
 The Kansas City Kansas Department responded to 2,884 incidents during the month of July 2018 based on CAD and NFIRS data. Response Per EMS Unit EMS02 EMS03 EMS04 EMS05 EMS06 EMS09 EMS10 EMS17 EMS18 EMS19
Livermore-Pleasanton Fire Department Annual Report
 Livermore-Pleasanton Fire Department 2015 Annual Report 2015 Annual Report Livermore-Pleasanton Fire Department Introduction The Livermore-Pleasanton Fire Department (LPFD) is an all risk emergency response
FIRE IN NEW JERSEY 2004 & Division of Fire Safety. State of New Jersey Department of Community Affairs
 FIRE IN NEW JERSEY & Division of Fire Safety State of New Jersey Department of Community Affairs Cover photo courtesy of James Bradshaw, Beach Haven Fire Company DEDICATION We honor the firefighters who
MASSACHUSETTS FIRE INCIDENT REPORTING SYSTEM Version 5.0
 MASSACHUSETTS FIRE INCIDENT REPORTING SYSTEM Version 5.0 QUICK REFERENCE GUIDE Massachusetts Revision 11/22/2000 FEDERAL EMERGENCY MANAGEMENT AGENCY UNITED STATES FIRE ADMINISTRATION TABLE OF CONTENTS
Note: All figures and tables referenced in this report are in Appendix A attached, which is required for reference.
 For Information Only Volunteer Firefighter Statistics Update Presented To: Community Services Committee Presented: Monday, Aug 10, 201 Report Date Wednesday, Jul 1, 201 Type: Correspondence for Information
To selflessly provide the highest level of service possible through preparation, prevention, and effective emergency response.
 ANNUAL REPORT 2017 Our responsibility is to be as prepared and competent as possible so we can help people on what may be the worst day of their lives; no matter the incident. Table of Contents Mission,
The mission of the Montrose Fire Protection District is to help improve the quality of life for our citizens by providing prompt, safe, and efficient
 The mission of the Montrose Fire Protection District is to help improve the quality of life for our citizens by providing prompt, safe, and efficient response to emergencies with highly trained professional
Residential Structure Match or Lighter Ignited Fires
 U.S. Fire Administration/National Fire Data Center Residential Structure Match or Lighter Ignited Fires Topical Fire Research Series, Volume 4 Issue 2 October 24 T O P I C A L F I R E R E S E A R C H S
Chief John C. Reese, EFO
 NORTH RIDGEVILLE FIRE DEPARTMENT December 2015 MONTHLY REPORT Chief John C. Reese, EFO This report was generated on 1/2/2016 9:51:59 AM Incident Statistics Start Date: 12/01/2015 End Date: 12/31/2015 APPARATUS
NFIRS 5.0 CODING QUESTIONS MANUAL
 2014 NFIRS 5.0 CODING QUESTIONS MANUAL United States Fire Administration NATIONAL FIRE DATA CENTER Table of Contents NFIRS 1: BASIC MODULE... 3 General Questions... 3 Exposures... 4 Dates and Times...
NFIRS 5.0 Coding Questions and Answers A Reference Guide
 Office of Education and Data Management Division of Fire and Building Services State of Connecticut Department of Construction Services NFIRS 5.0 Coding Questions and Answers A Reference Guide THIS PAGE
Star Fire District staridaho.org/government/firedept.php
 INCIDENT SUMMARY provides fire/first responder (career) services for our community. Through September, 2, a total of emergency incidents have been responded on. Below is a breakdown of the responses by.
City Council Staff Report
 City Council Staff Report Author: Chief William Pope Subject: Fire Department April 214 Report Type of Item: Informational Summary Recommendations: This report is for informational purposes as part of
Star Fire District staridaho.org/government/firedept.php
 INCIDENT SUMMARY provides fire/first responder (career) services for our community. Through July 1, 16, a total of emergency incidents have been responded on. Below is a breakdown of the responses by.
8. PRE-PLANNED FIRE AND EMS RESPONSE SYSTEMS
 8. PRE-PLANNED FIRE AND EMS RESPONSE SYSTEMS Each municipality within Cumberland County will be required to submit and utilize pre-planned Fire and EMS Responses, commonly referred to as a "phantom box"
2010 Fire Log Fire Log. Annual Fire Safety Report
 Annual Fire Safety Report The Higher Education Opportunity Act became law in August 2008 and requires all United States academic institutions to produce an annual fire safety report outlining fire safety
Municipal Utility Worker Falls While Clearing a Clog in a Conveyor Chute
 Fatality Assessment & Control Evaluation Project FACE 99-NJ-108-01 August 18, 2000 Municipal Utility Worker Falls While Clearing a Clog in a Conveyor Chute On December 24, 1999, a 39-year-old municipal
1. STAFF REPORTS / ITEMS REQUIRING IMMEDIATE ATTENTION
 . STAFF REPORTS / ITEMS REQUIRING IMMEDIATE ATTENTION General Services Monthly Report March 6 Refuse Accounts FY 5 FY 6 6 75 88 87 86 85 8 8 8 8 8 79 Refuse Accounts Refuse Collected -Tons 87 8 Tons Collected
South Lyon Fire Department 2012 Annual Report
 South Lyon Fire Department 2012 Annual Report Message from the Chief During 2012, continual improvements were made to the organization, operation, and administration of the South Lyon Fire Department.
STATION RISK PROFILE 2018 EWYAS HAROLD
 COMMUNITY RISK MANAGEMENT PLAN 2014-2020 Mid-Point Review 2017-18 STATION RISK PROFILE 2018 EWYAS HAROLD Station Risk Profile 2018 Contents 1 Introduction 3 2 Fire Station Overview 4 3 Incident Overview
Cheshire Fire Department Monthly Report July 2015
 Cheshire Fire Department Monthly Report The month of July was busy for the Cheshire Fire Department. We responded to 56 calls for service which resulted in approximately $4,500 dollar loss. Despite the
Fiscal Year City of Brentwood Fire Department
 Fiscal Year 2004 City of Brentwood Fire Department MEMORANDUM 2004-15 August 20, 2004 TO: THROUGH: FROM: SUBJECT: Honorable Mayor and Members of the City Commission Michael W. Walker, City Manager Kenny
Completed and submitted the Fourth Quarter State Aggregate Repot for 2016.
 EMS State Aggregate Report Completed and submitted the Fourth Quarter State Aggregate Repot for 2016. CERT Competed Unit 1 - Disaster Preparedness; Unit 2 - Fire Safety and Utility Controls; Unit 3 - Disaster
Prepared by the Washington State Patrol Office of the State Fire Marshal
 Prepared by the Washington State Patrol Office of the State Fire Marshal Table of Contents Letter from the Chief of the Washington State Patrol... 2 Letter from the State Fire Marshal... 3 Letter from
Multiple-Fatality Fires in Residential Buildings
 Top i c a l Fi r e Re p o r t Se r i e s Volume 9, Issue 3 / April 2009 Multiple-Fatality Fires in Residential Buildings These short topical reports are designed to explore facets of the U.S. fire problem
Home Fires Involving Heating Equipment
 Home Fires Involving Heating Equipment December 2017 Richard Campbell December 2017 National Fire Protection Association Abstract In 2011-2015, U.S. fire departments responded to an estimated average of
OREGON OFFICE OF STATE FIRE MARSHAL ANNUAL REPORT SUPPLEMENT
 OREGON OFFICE OF STATE FIRE MARSHAL ANNUAL REPORT SUPPLEMENT 2014 Mission Protecting citizens, their property and the environment from fire and hazardous materials. Vision Premier Public Safety Services.
CITY OF BRYAN FIRE DEPARTMENT
 CITY OF BRYAN FIRE DEPARTMENT 216 ANNUAL REPORT 216 Annual Report UINTRODUCTION In the following pages, you will find the annual report for the City of Bryan Fire Department for 216. The information presented
2013 End of the Year Summary
 Eureka Springs Fire & EMS 144 East Van Buren Avenue Eureka Springs, AR 72632 (479) 253-9616 www.eurekaspringsfire.org --------------------------------------------------------------------------------------------------------------------
Annual Report Components
 Published on MTAS (http://www.mtas.tennessee.edu) April 14, 2019 Dear Reader: The following document was created from the MTAS website (mtas.tennessee.edu). This website is maintained daily by MTAS staff
U.S. STRUCTURE FIRES IN OFFICE PROPERTIES
 U.S. STRUCTURE FIRES IN OFFICE PROPERTIES Richard Campbell August 2013 National Fire Protection Association Fire Analysis and Research Division U.S. STRUCTURE FIRES IN OFFICE PROPERTIES Richard Campbell
NMSU Fire Department Annual Fire Safety Report Clery Act Requirement
 2014 Annual Fire Safety Report Clery Act Requirement New Mexico State University Fire Safety Reporting [18] HEOA Reporting Date: January 1, 2014 to December 31, 2014 NOTE: All fire drills reported below
From 2005 to 2007, an estimated 108,400 winter
 Topical Fire Report Series Volume 10, Issue 5 / February 2010 Winter Residential These topical reports are designed to explore facets of the U.S. fire problem as depicted through data collected in the
FUEL TYPE relating to UK deaths from unintentional carbon monoxide poisoning from to
 FUEL TYPE relating to UK deaths from unintentional Unknown 3% Gas (portable) 15% Solid 31% Gas (mains) 36% Petrol/Diesel 14% Paraffin 0.4% Oil 1% This chart shows that gas is responsible for the greatest
Structure Fires in Hotels and Motels
 Structure Fires in Hotels and Motels John Hall Fire Analysis and Research Division National Fire Protection Association October 2006 National Fire Protection Association, 1 Batterymarch Park, Quincy, MA
STRUCTURE FIRES IN EDUCATIONAL PROPERTIES
 STRUCTURE FIRES IN EDUCATIONAL PROPERTIES Jennifer D. Flynn August 2009 National Fire Protection Association Fire Analysis and Research Division STRUCTURE FIRES IN EDUCATIONAL PROPERTIES Jennifer D. Flynn
SCFIRS Team Community Risk Reduction Division of Fire and Life Safety. Fire Chiefs,
 Fire Chiefs, Greetings from the South Carolina Office of State Fire Marshal. Our Community Risk Reduction team is distributing this monthly SC Fire Incident Reporting System (SCFIRS) report to keep you
Village of Port Dickinson Monthly Board Meeting March 12, 2019 Port Dickinson Village Hall
 Village of Port Dickinson Monthly Board Meeting March 12, 2019 Port Dickinson Village Hall 1 Officers Present: Mayor Kevin M. Burke Trustees Robert Aagre Michael Cashman James DeGennaro Charles Harding
STONY HILL RURAL FIRE DEPARTMENT OPERATING GUIDELINES
 STONY HILL RURAL FIRE DEPARTMENT OPERATING GUIDELINES Subject: Response to Alarms (DRAFT) Approved: Guideline Number: 1006 Date: 11-8-2011 Page: 1 of 6 1.0 PURPOSE To establish a procedure for the acknowledgement
CAMDEN COUNTY FIRE COORDINATOR
 SECTION OPERATIONS EFFECTIVE REVISED 02-20-19 SOG 3-1 CAMDEN COUNTY FIRE COORDINATOR Purpose To establish an appointment protocol for the Camden County Fire Coordinator, and Deputy Camden County Fire Coordinator
ATIO A FIRE PROT CTIO ASSO ATO The lead ing info.r:mation and knowledge :resour,ce on. fire, elecmca and ll'elated hazards
 NFPA ATIO A FIRE PROT CTIO ASSO ATO The lead ing info.r:mation and knowledge :resour,ce on. fire, elecmca and ll'elated hazards TO SAVE YOUR ANSWERS: Close your browser at any time while taking the survey;
Response Per EMS Unit. Response Per Supression Unit
 The Kansas City Kansas Department responded to 2954 incidents during the month of August 2018 based on CAD and NFIRS data. Response Per EMS Unit EMS02 EMS03 EMS04 EMS05 EMS06 EMS09 EMS10 EMS17 EMS18 EMS19
University Housing Fires
 Top i c a l Fi r e Re p o r t Se r i e s Volume 10, Issue 1 / November 2009 University Housing Fires These short topical reports are designed to explore facets of the U.S. fire problem as depicted through
City Council Staff Report
 City Council Staff Report Author: Chief William Pope Subject: Fire Department February 214 Report Type of Item: Informational Summary Recommendations: This report is for informational purposes as part
CITY OF FENTON FIRE DEPARTMENT
 CITY OF FENTON FIRE DEPARTMENT 2013 Annual Report Mission Statement: To protect life and property of the people of our community with the highest quality of service possible. 2013 Annual Report TO: LYNN
City Council Staff Report
 City Council Staff Report Author: Chief William Pope Subject: Fire Department May 24 Report Type of Item: Informational Summary Recommendations: This report is for informational purposes as part of the
City of Quincy, IL Fire Station Location Study March 2017
 City of Quincy, IL Fire Location Study March 2017 The Quincy Fire Department dedicates itself to the protection of Quincy's residents and their property Terms of Use This report is the property of the
Cedar Fire Department Run Statistics and Analysis January 1 st December 31 st, 2013
 Cedar Fire Department Run Statistics and Analysis January 1 st December 31 st, January 1 st December 31 th EMS/FIRE Total EMS Runs and Fire Runs Prepared by: Tim Johnson Organizational Chart of Statistics
Robbinsdale Fire Department Serving Our Community Since 1909
 Robbinsdale Fire Department Serving Our Community Since 1909 2017 Annual Report Welcome by Fire Chief Guy P. Dorholt In 2017, the Robbinsdale Fire Department made Firefighter Health and Wellness a top
Riverside Fire Department
 PERFORMANCE AUDIT Riverside Fire Department Fire Prevention Division ~ Managing False/Avoidable Fire Alarms AU15-01 Office of the City Manager Internal Audit Division Cheryl Johannes, Internal Audit Manager
Independence, Missouri FIRE DEPARTMENT
 Annual Report Independence, Missouri FIRE DEPARTMENT LETTER FROM THE CHIEF Fire Station #1 950 N. Spring Street It is my pleasure to present the 16 annual report. In these pages you will find that we have
Structure Fires in Residential Board and Care Facilities
 Structure Fires in Residential Board and Care Facilities July 2016 Marty Ahrens July 2016 National Fire Protection Association Abstract During 2009-2013, U.S. fire departments responded to an estimated
Section III - Emergency Incidents Served by MOFD
 A REPORT ON THE COSTS, OPERATIONS, PERFORMANCE AND FINANCES OF THE MORAGA-ORINDA FIRE DISTRICT (MOFD) by The Orinda Citizens Emergency Services Task Force (www.orindataskforce.org / Orinda_Task_Force@comcast.net)
Performance and Cost Data. fire services
 Performance and Cost Data fire services 195 PERFORMANCE MEASURES FOR FIRE SERVICES SERVICE DEFINITION Fire Services refers to the activities and programs relating to the prevention and suppression of fires,
City Council Staff Report. Summary Recommendations: This report is for informational purposes as part of the Fire. Description: OPERATIONS
 City Council Staff Report Author: Chief William Pope Subject: Fire Department November Report Type of Item: Informational Summary Recommendations: This report is for informational purposes as part of the
LITTLE GASPARILLA ISLAND FIRE RESCUE
 Fire Chief s Report LITTLE GASPARILLA ISLAND FIRE RESCUE As you review this document, you will note, the scope of our notable achievements and activities performed in 2016. Our team of employees are highly
Frequently Asked Questions
 1. What are the minimum requirements for a fire to be reported to the Fire Commissioner? The event must meet the appropriate definition of fire as defined in the Fire Statistics Reporting Manual. A. Fire
UNIVERSITY OF ROCHESTER ENVIRONMENTAL HEALTH & SAFETY
 Revision No.: 3 Page 1 of 6 I. PURPOSE This policy establishes the steps required for performing the monthly fixed systems inspections and the semi-annual systems testing. Fixed systems include; wet chemical
WASHINGTON STATE PATROL
 2015 HI T JAY INSLEE JOHN R. BATISTE STATE OF WASHINGTON WASHINGTON STATE PATROL General Administration Building PO Box 42642 Olympia, WA 98504-2642 (360) 596-3900 www.wsp.wa.gov April 1, 2016 TO: FROM:
CITY OF BRYAN FIRE DEPARTMENT
 CITY OF BRYAN FIRE DEPARTMENT 217 ANNUAL REPORT 217 Annual Report UINTRODUCTION We are pleased to submit to you, the annual report for the City of Bryan Fire Department for 217. The information presented
May 2013 SCFIRS Report
 May 213 SCFIRS Report Fire Chiefs, To keep you up-to-date regarding how incident data is being used and the benefits of consistent reporting, the State Fire Marshal s Community Risk Reduction team is distributing
Monroe Township Fire District #3
 Monroe Township Fire District #3 Annual Report 2011 TABLE OF CONTENTS Mission Statement 1 Message from the Chief of The Department 2 Staffing Summary 3 Services Provided 4 Organizational Chart 5 Board
City of Santa Ana Fire Services Month End Report February 2017
 Gerardo Mouet City Manager gmouet@santa-ana.org 714-647-5200 NEWS AND EVENTS City of Santa Ana Fire Services Month End Report 17 Juan Villegas OCFA Board of Directors jvillegas@santa-ana.org 714-647-6900
City Council Staff Report. Summary Recommendations: This report is for informational purposes as part of the Fire. Description: OPERATIONS
 City Council Staff Report Author: Chief William Pope Subject: Fire Department May 7 Report Type of Item: Informational Summary Recommendations: This report is for informational purposes as part of the
Fire Loss in the United States During 2015
 Fire Loss in the United States During 2015 September 2016 Hylton J.G. Haynes September 2016 National Fire Protection Association Abstract U.S. fire departments responded to an estimated 1,345,500 fires
City of Davis Annual Report FIRE DEPARTMENT
 City of Davis FIRE DEPARTMENT Annual Report 2013-14 January 1, 2014 the City of Davis and University of California Davis entered into a Shared Fire Management Agreement. This agreement recognized potential
City Council Staff Report. Summary Recommendations: This report is for informational purposes as part of the Fire. Description: OPERATIONS
 City Council Staff Report Author: Chief William Pope Subject: Fire Department October Report Type of Item: Informational Summary Recommendations: This report is for informational purposes as part of the
Fires in Petroleum Refineries and Natural Gas Plants Annual Averages and Trends since 1980
 The following information is taken from the One-Stop Data Shop s special information data package on petroleum refineries and natural gas plant fires. If you are interested in published incident descriptions
NEW JERSEY SMALL BUSINESS ENVIRONMENTAL ASSISTANCE PROGRAM. Instructions and Resource Manual for the Dry Cleaner Compliance Calendar
 NEW JERSEY SMALL BUSINESS ENVIRONMENTAL ASSISTANCE PROGRAM Instructions and Resource Manual for the Dry Cleaner Compliance Calendar Revised 12/2015 Welcome The New Jersey Small Business Environmental Assistance
Today, we re going to talk about emergency action and fire prevention. We hope we never have to face an emergency situation like a fire in our
 Today, we re going to talk about emergency action and fire prevention. We hope we never have to face an emergency situation like a fire in our workplace, but we must always be prepared, just in case. Your
Heating Fires in Residential Buildings
 Topical Fire Research Series Volume 6, Issue 3 / November 2006 Heating Fires in Residential Buildings Findings: The decline in the incidence of heating fires has been dramatic. Over the past 20 years,
Managing Stormwater Runoff with Green Infrastructure "Enhancing Community Resiliency to the Changing Climate"
 Managing Stormwater Runoff with Green Infrastructure "Enhancing Community Resiliency to the Changing Climate" Presented at Stormwater Management on the Whale Pond Brook Watershed Meeting Christopher C.
AROMAS TRI-COUNTY FIRE PROTECTION DISTRICT BOARD OF DIRECTORS MEETING NOTICE & AGENDA
 AROMAS TRI-COUNTY FIRE PROTECTION DISTRICT BOARD OF DIRECTORS MEETING NOTICE & AGENDA Tuesday January 23, 2018-6:30 p.m. 492 Carpenteria Road, Aromas, California 95004 ROLL CALL: Miller Brown Mesiroff
STATION RISK PROFILE 2018 BROMYARD
 COMMUNITY RISK MANAGEMENT PLAN 14- Mid-Point Review 17-18 (Updated September 18) STATION RISK PROFILE 18 BROMYARD Station Risk Profile 18 Contents 1 Introduction 3 2 Bromyard Fire Station Overview 4 3
Medical Facility Fires
 Topical Fire Report Series Volume 9, Issue 4 / May 2009 Medical Facility Fires These short topical reports are designed to explore facets of the U.S. fire problem as depicted through data collected in
Thanksgiving Day Fires in Residential Buildings
 Topical Fire report SerieS Volume 11, Issue 5 / November 2010 Thanksgiving Day Fires in These topical reports are designed to explore facets of the U.S. fire problem as depicted through data collected
There are many different types of restaurants from chain
 Topical Fire report SerieS Volume 12, Issue 1 / April 2011 These topical reports are designed to explore facets of the U.S. fire problem as depicted through data collected in the U.S. Fire Administration
SOUTHEND CARELINE ANNUAL REPORT
 SOUTHEND CARELINE ANNUAL REPORT 2015-2016 Meet some of the CareLine Team Southend Careline TSA accredited 2015-2016 Southend Careline offers reassurance and peace of mind to our service users their family
CITY OF BRYAN FIRE DEPARTMENT
 CITY OF BRYAN FIRE DEPARTMENT 212 ANNUAL REPORT UINTRODUCTION It is my privilege to present to you the annual report for the Fire Department for 212. The information presented within this report represents
LA GRANGE FIRE DEPARTMENT JANUARY 2018
 LA GRANGE FIRE DEPARTMENT JANUARY 2018 A SERVICE PUBLICATION OF THE LA GRANGE FIRE DEPARTMENT 8-579-2338 LOCAL EVENTS 2018 71 st Annual Pet Parade Saturday June 2, 2018 9:30 AM 11:00 AM Farmers Market
City Council Staff Report. Summary Recommendations: This report is for informational purposes as part of the Fire. Description: OPERATIONS
 City Council Staff Report Author: Chief William Pope Subject: Fire Department August Report Type of Item: Informational Summary Recommendations: This report is for informational purposes as part of the
Index. Premises Information 2 About This Log Book 3 Service and Maintenance Requirements 4 8. Fire Risk Assessments 9
 Index Premises Information 2 About This Log Book 3 Service and Maintenance Requirements 4 8 Fire Risk Assessments 9 Fire Alarm Systems 10-20 Locations 10 Servicing 11 12 Activations 13 14 Weekly Checks
BENEFITS of RESIDENTIAL FIRE SPRINKLERS:
 BENEFITS of RESIDENTIAL FIRE SPRINKLERS: Prince George s County 15-Year History with its Single-Family Residential Dwelling Fire Sprinkler Ordinance Prepared by Steve Weatherby August 2009 Produced in