REPORT. Soil, Land Capability and Land Use Assessment Report for the Proposed New Vaal Colliery Life Extension Project.
|
|
|
- Diana Pope
- 5 years ago
- Views:
Transcription

 Declaration of Independence In terms of Section 33 of the EIA Regulations 2006 published in terms of Chapter 5 of the National Environmental Management Act (Act 107 of 1998) specialists involved in")
1 Rehab Green cc Registration No: 2002/094339/23 PI Steenekamp PO Box Queenswood 0121 Pretoria Cell: Fax: Report No: RG/2012/03/09/1 Date: 30 May 2012 REPORT Soil, Land Capability and Land Use Assessment Report for the Proposed New Vaal Colliery Life Extension Project Requested By Golder Associates Africa (Pty) Ltd Compiled By Rehab Green Monitoring Consultants CC Environmental and Rehabilitation Monitoring Consultant cc P.I. Steenekamp (Cert.Sci.Nat.) Declaration of Independence In terms of Section 33 of the EIA Regulations 2006 published in terms of Chapter 5 of the National Environmental Management Act (Act 107 of 1998) specialists involved in Impact Assessment processes must declare their independence and furnish details of experience. I, Piet Steenekamp, hereby declare that I have no conflict of interest related to the work of this report. Specially, I declare that I have no personal financial interests in the property and/or development being assessed in this report, and that I have no personal or financial connections to the relevant property owners, developers, planners, financiers or consultants of the development. I declare that the opinions expressed in this report are my own and a true reflection of my professional expertise. P.I. Steenekamp Date: 17 May 2012
2 2 CONTENTS Page 1. INTRODUCTION Project background Scope of work 6 2. STUDY OBJECTIVES 6 3. STUDY AREA Proposed opencast, underground and infrastructure areas 7 4. METHODOLOGY Preparation of field maps Soil classification Soil sampling and analyses Land capability assessment Agricultural potential classification Wetland and riparian delineation Land use mapping Erodibility evaluation Map compilations Impact Assessment SURVEY RESULTS Dominant soil types Soil types within New Cornelia Block 1 opencast and infrastructure area Soil types within the New Cornelia Vaalbank underground mining area and conveyer route Other soil qualities derived from soil properties Soil chemistry Land capability and agricultural potential Land capability of New Cornelia Block 1 opencast and infrastructure area Land capability of New Cornelia Vaalbank underground mining area and conveyer route Wetland and riparian delineation Pre-mining land use Pre-mining land use within the New Cornelia Block 1 opencast and infrastructure areas Pre-mining land use within the New Cornelia Vaalbank underground mining area and conveyer route 34
3 3 5.7 Historical agricultural production Evidence of misuse PROCEDURES FOR STRIPPING AND HANDLING OF SOIL Principles in stripping and handling of topsoil Construction phase Operational phase (Open Pit) Post-mining land capability commitments Decommissioning phase ENVIRONMENTAL IMPACT ASSESSMENT Construction phase Operational phase Decommissioning phase CONCLUSIONS Soils and land capability Proposed New Cornelia Block 1 opencast area Proposed New Cornelia Vaalbank underground mining area and Conveyer route Pre-mining land use Proposed New Cornelia Block 1 opencast area Proposed New Cornelia Vaalbank underground mining area and Conveyer route Impact assessment RECOMMENDATIONS Requirements for successful rehabilitation 52 REFERENCES TABLES: Table 1: Impact assessment methodology 12 Table 2a Soil legend New Cornelia Block 1 opencast and infrastructure area 17 Table 2b Soil legend Cornelia Vaalbank 20 Table 3 Other derived soil properties 24 Table 4 Soil chemical analyses 25 Table 5 Soil fertility compared to broad fertility guidelines 25 Table 6a Land capability classes, soils and agricultural potential New Cornelia Block 1 opencast and infrastructure areas 29 Table 6b Land capability classes, soils and agricultural potential New Cornelia Vaalbank underground mining area and conveyer route 31 Table 7a Pre-mining land uses within the New Cornelia Block 1 opencast and
4 4 Infrastructure areas 34 Table 7b Pre-mining land uses within the New Cornelia Vaalbank underground Mining area and conveyer route 34 Table 8a Historical agricultural production New Cornelia Block 1 36 Table 8b Historical agricultural production New Cornelia Vaalbank 36 Table 9 Criteria for soil stripping and replacing at New Cornelia Block 1 opencast 40 Table 10 Impact assessment Construction phase 43 Table 11 Impact assessment Operational phase 45 FIGURES: Figure 1 Regional setting of Newvaal Lifex proposed mining areas 5 Figure 2 Study area and key components of the proposed operation 8 Figure 3 a Soil map of the proposed New Cornelia Block 1 open pit and Infrastructure areas 14 Figure 3b Soil map of New Cornelia Vaalbank underground mining area 18 Figure 4 a Land capability map of New Cornelia Block 1 28 Figure 4b Land capability map of the New Cornelia Vaalbank 30 Figure 5a Land use map of New Cornelia Block 1 opencast and infrastructure Areas 33 Figure 5b Land use map of New Cornelia Vaalbank underground mining area And conveyer route 35 Figure 6 Soil stripping and stockpile guide for New Cornelia Block 1 open pit 41 Appendices Appendix A Soil classification system 54 Appendix B Soil properties and characteristics 55 Appendix C Wetland delineation 57 Appendix D Coordinates of soil sampling and stake points 60 Appendix E Soil horizons properties influencing stripping and stockpiling procedures 62
 New Vaal Colliery in the Free State Province is situated approximately 7 km east of the town of Vanderbijlpark and immediately south of Vereeniging (Figure 1).")
5 5 1. INTRODUCTION 1.1 Project background The New Vaal Colliery (NVC) Life Extension (Lifex) Project is generally referred to as the NVC Lifex Project. Anglo American Thermal Coal s (AATC) New Vaal Colliery in the Free State Province is situated approximately 7 km east of the town of Vanderbijlpark and immediately south of Vereeniging (Figure 1). Eskom needs a secure coal supply to keep the Lethabo Power Station running until Anglo American Thermal Coal (AATC) can fulfill this requirement if the life of New Vaal Colliery (NVC) is extended by 13 years, supplemented with additional coal sourced from resources further south of NVC. AATC proposes therefore to blend coal from NVC with coal from the proposed new operations to the south of the existing mine. These operations will include both opencast and underground mining within the following mining blocks (Figure 1): New Cornelia Block 1 (opencast); and New Cornelia Vaalbank (underground). Figure 1: Regional setting of NVC Lifex proposed mining areas
6 6 1.2 Scope of work Rehab Green Monitoring Consultants cc was requested by Golder Associates Africa (Pty) Ltd (Golder) to conduct a detailed soil, land capability and land use assessment of the proposed New Cornelia Block 1 opencast area as well as higher level field assessment of the New Cornelia Vaalbank proposed underground mining areas. The New Cornelia Block 1 proposed opencast area was surveyed during October 2010 and January 2011 and the survey results were compiled in Rehab Green cc Report No. RG/2010/07/10/1, June The proposed underground mining area of New Cornelia, as well as a 500 m wide proposed conveyer corridor was surveyed during January and February 2011 and the survey results were compiled in Rehab Green cc Report No. RG/2010/07/10/1/2, April Rehab Green cc was requested to combine the soil information of the New Cornelia Block 1 opencast and Vaalbank underground mining areas into one report and include new sections for a repositioned conveyer, a new power line, new haul road section, a brine pond, water balancing dam and a water treatment plant. The original New Cornelia Block 1 opencast area was refined and a strip along the western edge was excluded. The soil information was amended based on the refined open pit area. The study provides input to the Environmental Impact Assessment (EIA) as required in terms of the Mineral and Petroleum Resources Development Act (MPRDA), Act 28 of 2002 and the National Environmental Management Act (NEMA), Act 107 of The Acts require that pollution and/or degradation of the environment is to be avoided, or where either aspect cannot be avoided, to be minimized and remedied. 2. STUDY OBJECTIVES The study objectives were to: Conduct as detailed soil assessment of the proposed opencast mining areas; Conduct a higher level soil assessment of the proposed underground mining and infrastructure areas; Classify and map soil forms according to the South African Taxonomic Soil Classification System, 1991; Derive and map land capability based on soil properties; Map all pre-mining and current land uses; Identify soil properties related to wetness to enable the delineation of zones with similar degrees of wetness categorized in permanent, seasonal or temporary wetland zones or riparian zones based on guidelines of the Department of Water Affairs (DWA); Locate a 100 m buffer line along the outer edge of wetland and riparian zones; Determine all possible impacts by the proposed operations and provide associated mitigation measures; and Compile a soil stripping and stockpiling plan with rehabilitation guidelines.
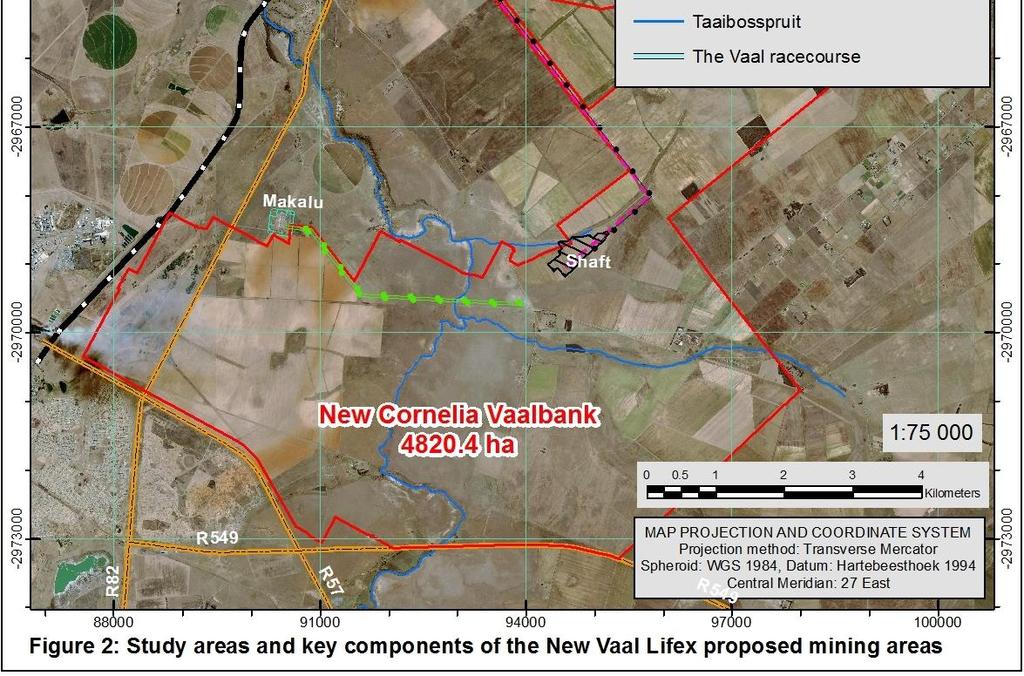
7 7 3. STUDY AREA 3.1 Proposed opencast, underground and infrastructure areas The originally surveyed New Cornelia Block 1 opencast area, demarcated in pink, comprises ha (Figure 2). An amended open pit area, demarcated with a yellow dotted line, was received from Golder, comprising 648 ha. The amended open pit area excludes a large portion of the wetland on the western edge of the original surveyed area. This section was excluded on all the amended soil, land capability and land use maps in this report. The New Cornelia Block 1 study area was expanded to the north to accommodate a proposed brine pond (5.5 ha), balancing dam (11.7 ha) and water treatment facility (0.8 ha), demarcated in turquoise. The study area also includes the proposed new haul road and ramps, shown in purple in Figure 2. The New Cornelia Vaalbank underground mining area, comprising 4820 ha, demarcated in red, was expanded to include the proposed new power line (green) stretching from the existing Makalu substation to the proposed new shaft area (hatched in black). A new conveyer and power line (pink and black respectively) runs parallel from the new shaft area to the existing Lethabo power station. The New Cornelia Block 1 study area is situated on portions of the farms Rietfontein 152, Zandfontein 259, Driefontein 2 and Waagstuk 78. The study area is bordered by the R59 highway and Vaal Race Course to the north, a railway line to the east and the Taaibosspruit to the west. The study area consist of flat to gentle footslopes to the east and valley bottoms to the west and the area is utilised for cattle grazing and sand mining operations. The New Cornelia Vaalbank study area consists of portions of the farms Modderfontein 1311, Zuurbekom 1615, Modderfontein 1279, Smalstreep 1310, Kruissementfontein 84, Die Hoop 1636, Khadie 1309, Emden 1312, Vaalbank 238, Vaalbank 219, Verdun 1138 and Amelia 518. The study area is roughly bordered by the R716 to the north east, the rail road and R57 to the west and southwest and the R549 to the south. The Taaibosstpruit and several of its tributaries cuts through the study area. The major land uses are the cultivation of maize and soybeans (40%, including fallow lands), pastures (10%) and grazing (47%). The majority of the study area consists of flat to gently sloped crests, midslopes and footslopes with average slopes of 0-4%.

8 8
9 9 4. METHODOLOGY 4.1 Preparation of field maps ArcGIS Geographic Information System (GIS) software was used to process all available data for accurate surveying. The location and extents of the mining application areas and infrastructure were obtained from Golder in electronic shapefile format. The shapefiles were superimposed on a Google Earth image as well as 1: scale topographic sheets. A grid of field observation points were generated at a density of 150 x 150 m. The coordinates of the observation points were calculated and loaded on a Geographic Positioning System (GPS) to accurately locate the position of the observation points in the field. Large scale field maps (1:5000 scale) showing the proposed mining area and observation points on both aerial and topographic background data were printed to use during the field assessment. 4.2 Soil classification The soils at New Cornelia Block 1 were investigated by means of auger holes at a density of 150 x 150 m and 300 x 300 m at New Cornelia Vaalbank. Auger holes were made to a depth of 1500 mm or to the depth of refusal. The soils were described and classified according to the South African Taxonomic Soil Classification System (Soil Classification Working Group, 2nd edition 1991). At New Cornelia Block 1 a total of 331 auger observations were made at grid points and 19 randomly where deemed necessary to locate and accurately map soil boundaries. At New Cornelia Vaalbank a total of 350 auger observations were made at a density of approximately 300 x 300 m except at the farms Khadi 1309 and Emden 1312 where access to the property was denied. The system of soil classification is explained in Appendix A. The following procedure was followed to note soil properties and classify soils accordingly: i) Identify applicable diagnostic horizons by noting the physical properties such as: Effective depth (depth of soil suitable for root development); Colour (in accordance with Munsell colour chart); Texture (refers to the particle size distribution); Structure (aggregation of soil particles into structural units); Mottling (alterations due to continued exposure to wetness); Concretions (cohesion of minerals into hard fragments); Leaching (removal of soluble constituents by percolating water); Gleying ( reduction of ferric oxides under anaerobic conditions resulting in grey, low chroma soil colours); and Illuviation of colloidal mater from one horizon to another resulting in the development of grey sandy E-horizons and grey clay G-horizons. ii) Determine according to above properties the appropriate soil Form and soil Family The soil properties that were used in the soil classification are discussed in Appendix B. 4.3 Soil sampling and analyses The A and B or E or G-horizons (0-250 and mm) of the dominant soil types were sampled and analysed at the Institute for Soil, Climate and Water. The analyses
10 10 were conducted according to methods set out in the Handbook of Standard Testing for Advisory Purposes (Soil Science Society of South Africa, 1990). The following analyses were conducted: Soil acidity (ph) in a 1:2.5 water solution; Extractable cations (Na, K, Ca and Mg) according to the ammonium acetate method; and Phosphorus status according to the Bray 1 method. 4.4 Land capability assessment Land capability was assessed according to the definitions outlined in the guidelines for the rehabilitation of mined land by the Chamber of Mines of South Africa and Coaltech Research Association (2007). Soils types were classified into the following categories for areas that exclude wetlands: Arable land; Grazing land; and Wilderness. 4.5 Agricultural potential classification The classification of agricultural potential of soils was based on soil properties noted during auger observations such as effective soil depth, texture, terrain unit, slope, soil wetness and disturbances. The effective soil depth and soil texture is the main soil characteristic that determined the agricultural potential. The criteria applied for the classification of the agricultural potential of soils are as follows: High well-drained and moderately well-drained soils with an effective depth deeper than 900 mm. Moderate - well-drained and moderately well-drained soils with an effective depth of mm. Low - well-drained and moderately well-drained soils with an effective depth less than 600 mm or leached, grey, sandy soils showing evidence of periodic percolating water tables, or black and grey clay soils showing evidence of poor internal drainage or very sandy soils in low rainfall areas. 4.6 Wetland and riparian delineation Wetland and riparian zones are delineated according to the practical field procedure for the identification and delineation of wetlands and riparian areas (Department of Water Affair and Forestry, 2005). Four indicators were used in the study to delineate wetland and riparian zones, namely: Terrain unit; Soil form; Soil wetness; and Wetland and riparian vegetation. Auger observations are made systematically in transects towards the wetland at 50 m intervals in order to locate the point from where clear evidence of wetness occurs within 500 mm from surface. Further details on the delineation of wetland areas are included in Appendix C.
11 Land use mapping The localities and extents of land use practices were surveyed during the time of the soil assessment. 4.8 Erodibility evaluation Erodiblity was broadly assessed based on soil texture, slope and the inherent stability of the parent rock (geology) from which the soil originated. Low: Soils with stable physical and chemical properties which occur on flat to gentle slopes to ensure low erosion susceptibility in the natural state. Few erosion protection measures are necessary. Moderate: Soils with low to moderately unstable physical or chemical properties or soils occurring on moderate to steep slopes. Sheet and rill erosion often occur in the natural state but may become severe when these soils are disturbed or due to any misuse such as overgrazing. Erosion protection measures are necessary. High: Soils with unstable physical and chemical properties or soils occurring on very steep slopes. Rill and donga erosion often occur in the natural state and will become severe during any disturbance or misuse. Specialised erosion protection measures are necessary. 4.9 Map compilations The field data was captured in shapefile format (shp) and processed and stored in a Geographic Information System called ArcGIS, version The maps are compiled on aerial photo back ground in a map extendable document format (mxd) and exported to Jpeg format. The shapefiles can be exported to a dxf or dwg format for CAD users. The shapefiles, dxf and dwg formats are available on request. The maps were generated in a projected coordinate system using the longitude of origin (LO) coordinate system based on the 27 East meridian, WG1984 Elipsoid and Hartebeesthoek 1994 Datum Impact assessment This assessment evaluates the effects of the proposed project on the soil environment. Each potential impact was assessed according to the following criteria: Magnitude is a measure of the degree of change in a measurement or analysis which is classified as minor/negligible, low, moderate, high or very high. Scale/Geographic extent refers to the area that could be affected by the impact and is classified as none, site only, local, regional, national, or international. Duration refers to the length of time over which an environmental impact may occur: i.e. Immediate (less than 1 year), short-term (0 to 7 years), medium term (8 to 15 years), long-term (greater than 15 years with impact ceasing after closure of the project) or permanent. Probability of occurrence is a description of the probability of the impact actually occurring as improbable (less than 5 % chance), low probability (5 %
12 12 to 40 % chance), medium probability (40 % to 60 % chance), highly probable (most likely, 60 % to 90 % chance) or definite (impact will definitely occur). Direction of an impact may be positive, neutral or negative with respect to the particular impact. Reversibility is an indicator of the potential for recovery of the endpoint from the impact. Frequency describes how often the impact may occur within a given time period and is classified as low, medium or high frequency. Seasonal considerations should be discussed where these are important in the evaluation of the impact. The significance of the identified impacts was determined using the approach summarized in Table 1. This incorporates two aspects for assessing the potential significance of impacts (terminology from the Department of Environmental Affairs and Tourism Guideline document on EIA Regulations, April 1998), namely occurrence and severity, which are further sub-divided as shown in Table 1. Table 1: Impact assessment methodology OCCURRENCE Probability of occurrence Duration of occurrence To assess each impact, the following four ranking scales are used: Severity Magnitude (severity) of Scale / extent of impact impact PROBABILITY DURATION 5 - Definite/don t know 5 - Permanent 4 - Highly probable 4 - Long-term 3 - Medium probability 3 - Medium-term (8-15 years) 2 - Low probability 1 - Improbable 1 Immediate 0 - None SCALE 2 - Short-term (0-7 years) (impact ceases after the operational life of the activity) 5 - International 10 - Very high/don t know 4 - National 8 - High 3 - Regional 6 - Moderate 2 - Local 4 - Low 1 - Site only 2 - Minor 0 - None MAGNITUDE The significance of the two aspects, occurrence and severity, is assessed using the following formula: SP (significance points) = (magnitude + duration + scale) x probability The maximum value is 150 significance points (SP). The impact significance points are assigned a rating of high, medium or low with respect to their environmental impact as follows: SP >75 SP SP <30 Indicates high environmental significance Indicates moderate environmental significance Indicates low environmental significance + Positive impact An impact which could influence the decision about whether or not to proceed with the project regardless of any possible mitigation. An impact or benefit which is sufficiently important to require management and which could have an influence on the decision unless it is mitigated. Impacts with little real effect and which should not have an influence on or require modification of the project design. An impact that is likely to result in positive consequences/effects. Potential impacts were assessed using the above calculation and rating system, and mitigation measures were proposed for all relevant project phases (construction to decommissioning).
13 13 5. SURVEY RESULTS 5.1 Dominant soil types Soil types were mapped based on soil information gathered by means of auger observations. The soil information of New Cornelia Block 1 and Vaalbank mining areas were compiled on two separate maps, Figures 3a and 3b respectively. The information of soils along the proposed conveyer route is included in the New Cornelia Vaalbank maps and Tables. Each figure contains an abbreviated soil legend. A detailed soil legend for each of the two areas is provided in Tables 2a and 2b which described the soils in terms of the following aspects: Dominant and subdominant soil forms and families; Average effective soil depth; The estimated clay content of the A and B or E or G-horizons; The derived texture class; A description of the terrain unit and slope, a broad description of the dominant soil form; A description of the soil horizon sequences; The soil s derived land capability and wetland zone classification; and The area and percentage comprised by each soil type Soil types within the New Cornelia Block 1 opencast and infrastructure areas Soil types within the proposed New Cornelia Block 1 opencast and infrastructure areas are shown on Figure 3a. A total of 5 soil types, based on dominant soil form, effective soil depth, internal drainage, terrain unit and slope percentage were identified during field observations and were symbolised as: Cv, Av, Lo2, Lo1 and Kd/Ka. The soil types are summarised in the soil legend Table 2a.

14 14
15 15 Soil type Cv, dominated by the Clovelly soil Form, covering ha (18.39% of the study area), occurs on a gentle footslope (1-2% slopes) and consists of very deep, brownish yellow, well-drained, sandy soils. The soil profile sequence consists of yellow brown, sandy, Orthic A-horizons underlain by brownish yellow, sandy B-horizons often underlain by a greyish yellow E-horizon. This non-diagnostic E-horizon indicates some higher leaching in the lower soil profile but mostly lacks any mottling. However, where mottling does occur, the soils were classified as the Pinedene soil form. The higher leaching in the lower soil profile negatively affects the soil potential and land capability due to the inability to effectively store water in the lower soil profile. The general highly leached status of soil type Cv is confirmed by the fairly rapid fading of the prominent yellow colour of the B-Horizon to a more paler yellow when exposed to sunlight. The land capability was classified as grazing potential with low agricultural potential due to the very sandy texture (<5% clay) which manifest in very low water holding capacity and highly leached status. The erodibility was rated low due to stable physical and chemical properties and gentle slopes. Soil type Av, dominated by the Avalon soil Form, covering ha (50.32% of the study area), occurs on gentle midslopes (1-2% slopes) and consists of deep, brownish yellow, moderately well-drained, sandy soils. The soil profile sequence consists of yellow brown, sandy, Orthic A-horizons underlain by brownish yellow, sandy B1- horizons underlain by slightly mottled soft plinthic B2-horizons. The mottled soft plinthic B2-horizon often contains a small percentage of soft sesquioxide concretions which is the result of accumulation of iron oxides. A slight increase in the clay content of the B2- horizon will have a positive effect on the water holding capacity in the lower soil profile. A non-diagnostic, greyish yellow E-horizon often occurs between the B1 and B2- horizons. The general highly leached status of soil type Av is confirmed by the fairly rapid fading of the prominent yellow colour of the B1-horizon to a paler yellow when exposed to sunlight. The land capability was classified as grazing potential with low agricultural potential due to the very sandy texture (<5% clay) which manifest in very low water holding capacity and highly leached status. The erodibility was rated low due to stable physical and chemical properties and gentle slopes. Soil type Lo2, dominated by the Longlands 2000 soil Form, covering ha (15.78% of the study area), occurs on gentle midslopes (1-2% slopes) and consists of deep, greyish yellow, moderately well-drained, sandy soils. The soil profile sequence consists of greyish brown, sandy, Orthic A-horizons underlain by greyish yellow, sandy E-horizons underlain by slightly mottled soft plinthic B1-horizons. Soil type Lo2 are somewhat similar to soil type Av but are more subjected to leaching. The often fairly strong yellow soil colour below the A-horizon fades to a greyish yellow colour when exposed to sunlight which qualifies as the yellow E-horizon. Although the greyish yellow colour is an indication of wetness it was observed that wetland vegetation constantly lacks in these soils. It is assumed that the degree of wetness in these soils is insufficient to support wetland vegetation. The land capability was classified as grazing potential with low agricultural potential due to the very sandy texture (<5% clay) which manifest in very low water holding capacity and highly leached status. The erodibility was rated low due to stable physical and chemical properties and gentle slopes. Soil type Lo1, dominated by the Longlands soil Form, covering ha (8.4% of the study area), occurs on gentle footslopes (1-2% slopes) and consists of deep, greyish yellow to grey, imperfectly drained, sandy soils. The soil profile sequence consists of greyish brown, sandy, Orthic A-horizons underlain by greyish yellow to grey, sandy E- horizons underlain by mottled soft plinthic B1-horizons. Soil type Lo1 is somewhat similar to soil type Lo2 but clearly differ in the degree of wetness in the soil profile. The grey coloured A-horizons indicate wetness in the upper part of the soil profile and the greyish yellow E-horizons and soft plinthic B-horizons indicate periodic wetness in the
16 16 remainder of the soil profile. Occasional saturated spots with shallow surface water occurred. Water tables were occasionally found in the lower soil profile and wetland vegetation occurred continuously. The land capability was classified as a temporary wetland zone with low agricultural potential due to the degree of wetness in the soil profile. The erodibility was rated low due to stable physical and chemical properties and gentle slopes. Soil type Kd/Ka, dominated by an association of the Kroonstad and Katspruit soil Forms, covering ha (7.1% of the study area), occurs on gentle footslopes (1-2% slopes) and consists of shallow, grey, imperfectly to somewhat poorly drained, sandy soils underlain by gleyed clay. The soil profile sequence consists of grey, sandy, Orthic A-horizons underlain by grey to yellowish grey, sandy E-horizons underlain by gleyed clay (G-horizon). A major difference between soil types Kd/Ka and Lo1 is the degree in wetness indicated by the underlying material (G-horizon versus soft plinthic B-horizon). The soft plinthic B-horizon is an indication of periodic wetness while the G-horizon indicates prolonged wetness. The Katspruit soil form, other than the Kroonstad form lacks an E-horizon and consists of a grey, sandy A-horizon directly underlain by a gleyed G-horizon. However, the A-horizons have similar sandy textures and the Katspruit can in this occasion be seen as a shallow version of the kroonstad form. Frequent saturated spots with shallow surface water occurred. Frequent water tables were found and prominent wetland vegetation occurred. The land capability was classified as a seasonal wetland zone with low agricultural potential due to the degree of wetness in the soil profile. The erodibility was rated low due to stable physical and chemical properties and gentle slopes.
17 17 Table 2a: Soil legend of New Cornelia Block 1 opencast and infrastructure area SOIL LEGEND Soil Type Code Dominant Soil Form and Family Subdominant Soil Form and Family Effective Soil Depth (mm) Cv Clovelly 1100 Pinedene Av Avalon 1100 Lo2 Longlands 2000 Lo1 Longlands 2000 Kd/Ka Kroonstad 1000 Katspruit 1000 Pinedene 1100 Longlands 2000 Avalon 1100, Pinedene Fernwood 1210, Constantia 1100 Longlands Longlands Clay content per horizon A, E, G, B A: 3-5 B: 3-7 E: 1-3 A: 3-5 B1: 3-7 B2: 7-10 A: 3-5 E1: 1-3 B2: 8-15 A: 3-5 E: 1-3 B: 8-20 A: 3-5 E: 1-3 G: Sand Sand Sand Sand Texture Class Sandy - clay Summarized Description of Dominant Soil Form Terrain: Gentle footslope (1-2% slopes); Soil: Very deep, brownish yellow, well-drained, sandy soils; Profile: Yellow brown, sandy, Orthic A- horizons underlain by brownish yellow, sandy B- horizons underlain by greyish yellow E-horizons. Terrain: Gentle midslope (1-2% slopes); Soil: Deep, brownish yellow, moderately well-drained, sandy soils; Profile: Yellow brown, sandy, Orthic A-horizons underlain by brownish yellow, sandy B-horizons underlain by slightly mottled soft plinthite. Terrain: Gentle midslope (1-2% slopes); Soil: Deep, greyish yellow, moderately well-drained, sandy soils; Profile: Yellowish brown, sandy, Orthic A-horizons underlain by greyish yellow, sandy E-horizons underlain by slightly mottled soft plinthite. Terrain: Gentle footslope (1-2% slopes); Soil: Deep, greyish yellow to grey, imperfectly drained, sandy soils; Profile: Greyish brown, sandy, Orthic A-horizons underlain by greyish yellow to grey, sandy E-horizons underlain by mottled soft plinthite. Terrain: Gentle footslope (1-2% slopes); Soil: Shallow, grey, imperfectly to somewhat poorly drained, sandy soils; Profile: Grey, sandy, Orthic A-horizons underlain by grey to yellowish grey, sandy E-horizons underlain by gleyed clay (Ghorizon). Agricultu ral Potential Land Capability Erodibility Number of Units Area (ha) Area (%) Low Grazing Low Low Grazing Low Low Grazing Low Low Wetland Low Low Wetland Low TOTAL


18 Soil types within the New Cornelia Vaalbank underground mining area and conveyer route Soil types within the proposed New Cornelia underground mining area and conveyer route are shown on Figure 3b. A total of 23 soil types, based on dominant soil form, effective soil depth, internal drainage, terrain unit and slope percentage were identified during field observations and were symbolised as: Hu, Bv, Av1, Av2, We1, We3, Pn- We, Ar, ArR, My-Bo, Ms-Sw, Lo-Kd, Lo1, Lo2, Kd, Se-Ka, Ka, Wo, Rg2, Rg3, Un, Wb and Q. The soil types are summarised in the soil legend Table 2b.
19 19 Soil types Hu and Bv are deep, red, well- and moderately well-drained soils classified as arable land with high agricultural potential. Soil types Av1 and Av2 are yellow brown, moderately well-drained soils classified as arable land with moderate to high and moderate to low agricultural potential respectively. Soil type Av2 is the most dominant soil type, comprising approximately 30% of the study area. Soil types We1, We3 and Pn-We are shallow, greyish brown, moderately well- to somewhat poorly drained soils of which the land capability were classified as grazing potential with moderate to low agricultural potential. Soil type We1 is the second dominant soil type in the study area, comprising approximately 21%. Soil types Ar and ArR are moderately deep to very shallow, well-drained, black clay soils with shrink and expand properties of which the land capability were classified as grazing potential with moderate to low agricultural potential. Soil types My-Bo and Ms-Sw are shallow, well-drained, weak to strongly structured, clay loam soils with occasional to frequent exposed rock patches of which the land capability were classified as grazing potential with low to very low agricultural potential. Soil types Lo-Kd, Kd, Lo1 and Lo2 are yellowish grey to grey, imperfectly drained, sandy, soils underlain by soft plinthite or gleyed clay of which the land capability were classified as temporary wetland zones with low to very low agricultural potential. Soil types Se-Ka and Ka are shallow, greyish brown to grey, poorly drained, clay loam to clay soils of which the land capability were classified as temporary and seasonal/permanent wetland zones respectively, with low to very low agricultural potential. Soil types Wo, Rg2 and Rg3 are shallow, poorly drained, black clay soils with shrink and expand properties of which the land capability were classified as seasonal/permanent and seasonal/temporary wetland zones with low to very low agricultural potential. Soil type Un consists mainly of the steep edges and incised streambed of a section of the Taaibosspruit and consist of dark brown to black, clay loam, alluvial soil deposits of which the land capability was classified as a seasonal/temporary wetland zone with very low to no agricultural potential. Soil type Wb comprises a poorly rehabilitated dump which was covered with a thin layer ( mm) of yellow brown, yellowish grey or grey sandy soils. The dump material appeared to be some ashy and stony discard material. Unit Q consist of quarries with no remaining topsoil which was classified wilderness land with no agricultural potential.
20 20 Table 2b: Soil legend for New Cornelia Vaalbank underground mining area and conveyer route SOIL LEGEND Soil Type Code Hu Bv Av1 Av2 We1 We3 Dominant Soil Form and Family Hutton 2200 Bainsvlei 2100 Avalon 2100 Avalon 2100 Westleigh 2000 Westleigh 2000, 1000 Subdominant Soil Form and Family Bainsvlei 2100, Bloemdal 2100 Hutton 2100 Bainsvlei 2200 Bloemdal 2100, 2200 Avalon 2200, Longlands 2000, Pinedene 2100 Effective Soil Depth (mm) Longlands Avalon 2100, Longlands 2000 Glenrosa 1121 Swartland 1111 Sepane % Clay per horizon A, E, G, B A: B: A: B1: B2: A: B1: B2: A: 5-9 B1: 6-12 B2: A: B: A: B: Texture Class Sandy clay loam Sandy clay loam Sandy loam - sandy clay loam Sandy loamy sand Sandy loam - clay loam Sandy loam - clay Terrain Gently sloping crests and midslopes (1-2% slope) Gentle midslopes (1-2% slope) Gentle midslopes (1-2% slope) Crests and gentle midslopes (0-1% slope) Level crests or gentle midslopes (0-1% slope) Level to gently sloping (1-4% slope) crests and upper midslopes Summarized Description of Dominant Soil Form Reddish brown, sandy clay loam Orthic A- horizons, overlying sandy clay loam, well drained, red apedal or weak blocky structured B-horizons overlying weathered dolerite Reddish brown, sandy clay loam Orhtic A- horizons, overlying red, apedal or weakly structured, well-drained, clay loam B1- horizons, overlying reddish grey, mottled soft plinthic B2-horizons, overlying weathered dolerite Greyish brown, sandy loam Orhtic A- horizons, overlying sandy loam or sandy clay loam, yellow brown apedal B1- horizons, underlain by greyish, mottled, poorly drained, soft plinthic B2-horizons Yellowish grey, sandy Orthic A-horizons, overlying sandy or loamy sand, pale, yellow brown, apedal B1-horizons, underlain by greyish, mottled, poorly drained, soft plinthic B2-horizons Greyish brown, sandy loam or sandy clay loam Orthic A-horizons either directly overlying grey, mottled, poorly drained, sandy clay loam or clay loam soft plinthic B-horizons at about mm, or via a transitional, sandy clay loam AB-horizon Dark brownish, sandy loam to sandy clay loam Orthic A-horizons, overlying via a gravel line of iron and manganese nodules, prominent mottled, fine blocky structured, clay loam to clay (pedocutanic) merging into mottled, soft, weathered shale Agricultu ral Potential Land Capability Erodibility No of Units Area (ha) Area (%) High Arable Low High Arable Low Moderate to high Moderate to low Low Moderate to low Arable Low Arable Low Grazing Grazing Lowmoderate Low- Moderate
21 21 Soil Type Code Dominant Soil Form and Family Pn-We Pinedene 2100 Ar ArR My-Bo Ms-Sw Lo-Kd Arcadia 1200 Arcadia 1200 Mayo 1100 Bonheim 1220 Swartland 1121 Mispah 1100 Longlands 1000 Subdominant Soil Form and Family Westleigh 2000, Avalon 2100 Effective Soil Depth (mm) % Clay per horizon A, E, G, B A: B:13-25 Rensburg A: Clay Arcadia 1100, Milkwood 1000 Valsrivier 1122 Swartland 1121 Arcadia 1100 Mayo 1100 Milkwood 1000 Arcadia A: Clay Kroonstad A: B: A: B: A: E: B: Texture Class Loamy sand - sandy clay loam Clay loam Clay loam Loamy sand to sandy clay loam Terrain Gentle midslopes and upper footslopes (1-2% slope) Gently sloping (2-4% slope) midslopes, upper footslopes and isolated crests Gently to moderately sloping (2-5% slope) mainly midslopes with isolated crests and upper footslopes Gentle to moderate sloping midslopes and footslopes (3-7% slope) Moderately steep to steep midslopes and footslopes (8-15% slope) Gentle footslope (1-3% slope) SOIL LEGEND Summarized Description of Dominant Soil Form Very shallow to shallow, black, strongly structured, swelling, calcareous clay (Vertic A-horizons) overlying hard or weathered dolerite with 5-70% exposed rock at places Dark grayish brown, moderate to strongly structured, clay loam A-horizons (Melanic), directly overlying weathered dolerite, or via a thin, strong blocky structured, dark greyish brown, clay loam B-horizon (Pedocutanic); 10-40% exposed rock at places Dark grayish brown, weakly structured, clay loam Orthic A-horizons, directly overlying hard or weathered dolerite, or via a thin, moderate or strong blocky structured, dark grayish brown, clay loam B-horizon (Pedocutanic); 5-70% exposed rock at places Dark grey or grey loamy sand or sandy loam Orhtic A-horizons, over grey, imperfectly drained, loamy sand or sandy loam E-horizons, underlain at by grey, mottled, poorly drained, plinthic B or G- horizons Agricultu ral Potential Low Very low Low Land Capability Grazing Erodibility Greyish brown, loamy sand or sandy loam Orthic A-horizons, either directly overlying greyish, imperfectly drained, sandy clay loam plinthic B1-horizons, or via a loamy sand, pale yellow-brown, apedal B1- horizon. Moderately deep, black, strongly structured, swelling, calcareous clay (Vertic A-horizons) overlying weathered dolerite and shale; isolated dolerite outcrops in places Lowmoderate No of Units Area (ha) Area (%) Grazing Low Grazing Grazing Moderatelow Lowmoderate Lowmoderate Very low Grazing Moderate Low Wetland Moderate
22 22 Soil Type Code Lo1 Lo2 Kd Se-Ka Ka Wo Rg2 Dominant Soil Form and Family Longlands 2000 Longlands 1000 Kroonstad 1000 Sepane 1220 Katspruit 2000 Katspruit 2000 Willowbroo k 2000 Rensburg 2000 Subdominant Soil Form and Family Longlands 1000 Constantia 1100 Kroonstad 1000 Katspruit 1000 Westleigh 1000 Longlands 1000, Katspruit 1000 Willowbrook 2000 Kroonstad 1000 Longlands 1000 Willowbrook 2000 Rensburg 2000 Longlands 1000, 2000 Willowbrook 2000, Arcadia 1200 Effective Soil Depth (mm) % Clay per horizon A, E, G, B A: E: B: A: 6-10 E: 2-8 B: A: 3-8 E: 1-4 G: A: G: B: A: G: A: G: A: G: Texture Class Loamy sand - sandy loam Sandy Sandy Clay loam to clay Sandy clay loam - clay loam Clay loam to clay Clay Terrain Gentle footslope and lower midslope (1% slope) Weakly expressed, almost level, narrow bottomlands (0-1% slope) Gentle footslopes and valley bottoms (1% slope) Gentle footslopes land valley bottoms (1-2% slope) Bottomlands or wet, level, crest areas (0-1% slope) Flat to gently sloping valley bottoms (0-1% slopes) Level (0-2% slope) valley bottoms; includes narrow drainage lines and wide flood plains SOIL LEGEND Summarized Description of Dominant Soil Form Greyish brown loamy sand Orhtic A- horizons, over grey or yellowish grey, imperfectly drained, loamy sand or sandy loam E-horizons, underlain by grey, mottled, soft plinthic B-horizons Dark grey or grey sandy Orthic A-horizons, over grey, imperfectly drained, sandy E- horizons, underlain by grey, mottled, soft plinthic B-horizons Grey, sandy Orhtic A-horizons, underlain by grey, imperfectly drained, sandy E- horizons, underlain by grey, poorly drained, clay G-horizons. Greyish brown, clay loam Orthic A- horizons, directly overlying greyish, massive or weakly structured clay (Ghorizon) or via moderate blocky structured pedocutanic B-horizons with signs of wetness within 500 mm Dark grey or grey, brown mottled, sandy clay loam Orthic A-horizons, grading into grey, calcareous, poorly drained, clay loam G-horizons Dark grey, moderately structured, clay loam, Melanic A-horizons overlying calcareous, grey, poorly drianed clay (Ghorizons) grading in to weathered shale or dolerite Deep, black, strongly structured, swelling, calcareous clay (Vertic A-horizon) overlying grey, poorly drained, gleyed, calcareous clay (G-horizon) Agricultu ral Potential Land Capability Erodibility No of Units Area (ha) Area (%) Low Wetland Low Very low Wetland Lowmoderate Very low Wetland Low Low Very low Low Very low Wetland Wetland Wetland Wetland Lowmoderate Lowmoderate Lowmoderate Lowmoderate
23 23 Soil Type Code Rg3 Un Wb Dominant Soil Form and Family Rensburg 2000 Rensburg 2000 Witbank 1000 Subdominant Soil Form and Family Willowbrook 2000, Katspruit 2000, Dundee, Sepane Dundee Oakleaf Alluvium Effective Soil Depth (mm) % Clay per horizon A, E, G, B A: G: Texture Class Clay loam to clay A: Clay loam A: 5-10 Sandy Q Terrain Level (0-2% slope) valley bottoms; river terraces; wide dry and saturated flood plains; steep river banks with gully erosion in places Mainly riverbed; Steep, incised, rocky land along the Taaibosspruit Concave - excavated gravel pits SOIL LEGEND Summarized Description of Dominant Soil Form Deep, black, strongly structured, swelling, calcareous clay (Vertic A-horizon) overlying grey, poorly drained, gleyed, calcareous clay (G-horizon) Narrow strips of undifferentiated, dark coloured, weak to strongly structured alluvium in places Poorly rehabilitated dump; Yellow brown, yellowish grey and grey, sandy A-horizons underlain by ashy and stony discard material. Agricultu ral Potential Very low Land Capability Wetland Erodibility Low; high at riverbank No of Units Area (ha) Area (%) Low-none Wetland High Very low - none Wilderness Moderate to high No soil - exposed dolerite rock None Wilderness High TOTAL
24 Other soil qualities derived from soil properties The soil qualities derived from the soil properties for each soil type are summarised in Table 3. The soil qualities were rated as high, moderate and low with classification inbetween these. Table 3: Other derived soil qualities Dry land crop Soil Type Irrigation production (Code) potential potential New Cornelia Block 1 Cv Low Low Av Low Low Lo2 Low Low Lo1 Very low Very low Kd/Ka Very low Very low New Cornelia Vaalbank Hu High High Bv High High Av1 Moderate to high Moderate to high Av2 Moderate to low Moderate to low We1 Low Low We3 Moderate to low Moderate to low Pn-We Low Low Ar Moderate-low Low ArR Very low Very low My-Bo Low Low Ms-Sw Very low Very low Lo-Kd Low Very low Lo1 Low Very low Lo2 Very low Very low Kd Very low Very low Se-Ka Low Very low Ka Very low Very low Wo Low Very low Rg2 Very low Very low Rg3 Very low Very low Un None None Wb Very low - none None Q None None 5.3 Soil chemistry The soil analytical results of 20 representative samples, collected from the A-horizon (0-200 mm) and E or B-horizon ( mm) are shown in Table 4. The positions of the sampling points are shown on Figure 3a and coordinates are included in Appendix D.
25 25 The averages of base cations [potassium (K), calcium (Ca) magnesium (Mg) and sodium (Na)] as well as phosphorus and ph were calculated and highlighted in yellow. Table 4: Soil chemical analyses Samp Point Soil Form Hor Depth K Ca Mg Na T.Acid / Acid T.Suur saturat. Resistance mg/kg mg/kg mg/kg mg/kg cmol(+)/kg % ohm P (Bray1) mg/kg ph (H 2O) AS31 Lo2000 A E AY31 Av1100 A B BE25 Av1100 A B BK29 Av1100 A B BM17 Lo2000 A E B BO25 Av1100 A B BS11 Cv1100 A B BU3 Cv1100 A B E BW9 Cv1100 A B CA21 Fw1210 A E Average Soil fertility status The averages of the base cations (K, Ca, Mg, Na) as well as phosphorus and ph (highlighted in yellow, Table 4) were compared to general fertility guidelines (Fertilizer Association of South Africa, 2003) in Table 5. Table 5: Soil fertility compared to broad fertility guidelines Guidelines (mg/kg) Average calculated Low High in Table 4 (mg/kg) Status Potassium (K) <40 > Low Calcium (Ca) <200 > Low Magnesium (Mg) <50 > Low Sodium (Na) <50 > Very low, which is positive Phosphorus (P) <5 > Low Very acid Acid Slightly acid ph(h 2 O) neutral Slightly alkaline Alkaline < >8 5.7 Acid
26 26 The average cation concentration values of K, Ca and Mg are low, which indicates the highly leached status of the sandy soils. The low average Na concentration of 1.2 mg/kg is positive and indicates no accumulation of sodium and implies an absence of sodic soil conditions. The average P concentration of 3.7 mg/kg is low although somewhat higher concentration in the A-horizons occurs at sampling points BE25, BS11 and BU3 (9-13 mg/kg). The somewhat higher values in the A-horizons are probably due to fertilizers applied for former crop farming or to improved grassland and pastures. The average P status of the B-horizon is much lower than the A-horizon due to the immobility of phosphorus. The average ph value of 5.7 with a minimum of 4.89 and maximum of 6.78 indicates slightly acid to acid soil conditions.
27 Land capability and agricultural potential The land capability classification of the Northern and Southern Mining areas and the Infrastructure area were compiled on 3 separate maps, Figures 4a, 4b and 4c respectively. Each figure contains an abbreviated land capability legend. A detailed land capability legend for each of the 3 areas is provided in Tables 6a, 6b and 6c. The land capability and agricultural potential were determined from the soil types and classed according to the following categories: Arable potential o Well drained soils, o Moderately well-drained soils; Grazing potential o Well drained soils, o Moderately well-drained soils, Wetland and riparian zones o Imperfectly drained soils, o Somewhat poorly to poorly drained soils, Wilderness o Eroded areas, o Rehabilitated dumps, and o Disturbed areas Land capability of New Cornelia Block 1 opencast and infrastructure areas The location and extent of land capability classes within the proposed New Cornelia Block 1 opencast and infrastructure areas are shown on Figure 4a. The land capability and agricultural potential are summarised in Table 6a.

28 28
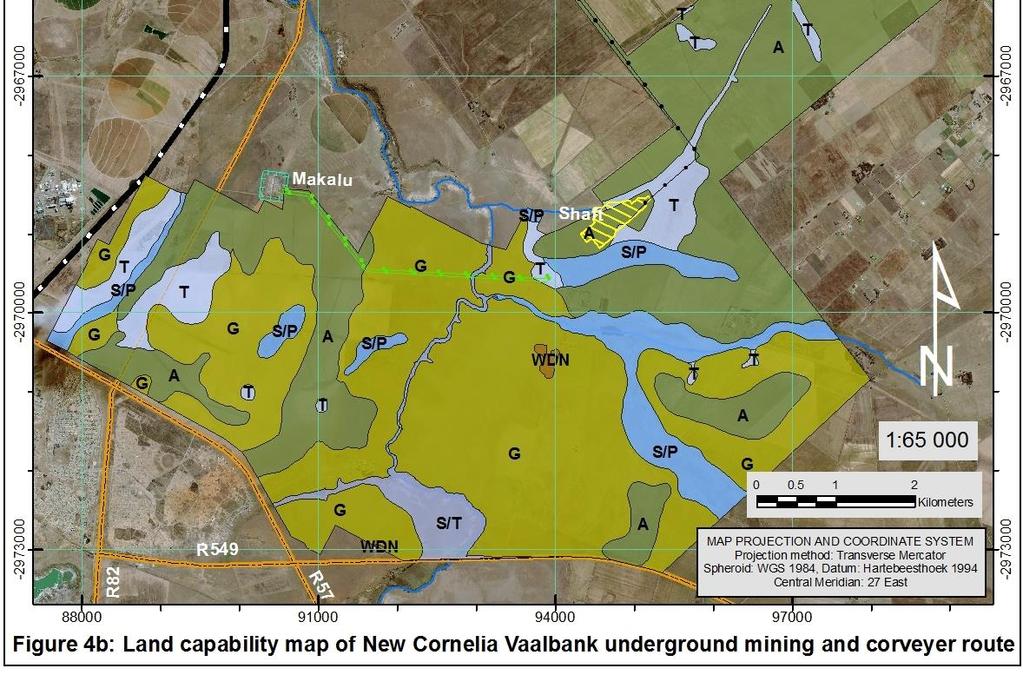
29 29 Table 6a shows the soil types within the New Cornelia Block 1 opencast and infrastructure areas which were grouped into each land capability class, a broad description of the soil type, the agricultural potential, the area and percentage comprised by individual soil types within each land capability class as well as the total per land capability class. Table 6a: Land capability classes and agricultural potential New Cornelia Block 1 opencast and infrastructure areas LEGEND: LAND CAPABILITY Land Capability (Code) Arable (A) Grazing (G) Temporary wetland (TW) Seasonal wetland (SW) Wilderness (WDN) Internal drainage *Soil type code Agricultural potential Broad soil description Area (ha) Well-drained - - No soils in this category 0 0 Moderately well-drained Well-drained Cv Low Imperfectly drained Imperfectly drained Somewhat poorly to poorly Disturbed, eroded or rehabilitated - - No soils in this category 0 0 Av Lo2 Lo1 Kd/Ka Low Low Low Low Area (%) Total 0 0 Soil: Very deep, brownish yellow, sandy soils Deep, brownish yellow, sandy soils underlain by slightly mottled soft plinthite Deep, greyish yellow, sandy soils underlain by slightly mottled soft plinthite Total Deep, greyish yellow to grey, sandy soils underlain by mottled soft plinthite Shallow, grey, sandy soils underlain by gleyed clay Total Total No areas in this category 0 0 Total 0 0 *See soil map, Figure 3a Grand Total Land capability of New Cornelia Vaalbank underground mining area and conveyer route The location and extent of land capability classes within the proposed New Cornelia Vaalbank underground mining area and conveyer route are shown on Figure 4b. The land capability and agricultural potential are summarised in Table 6b.
30 30
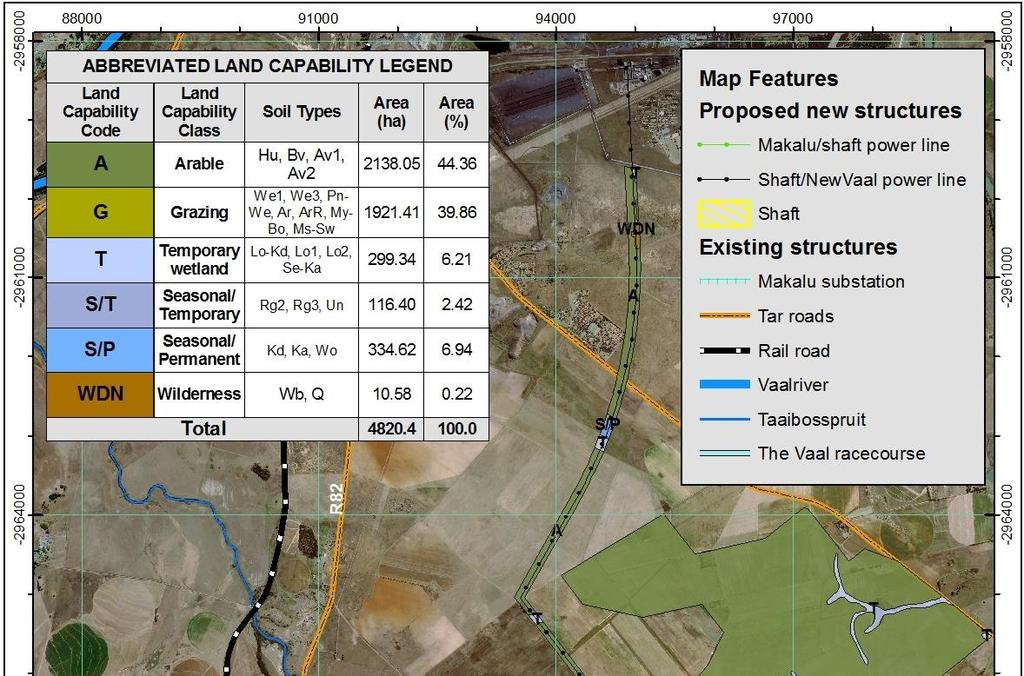
31 31 Table 6b shows the soil types within the New Cornelia Vaalbank underground mining area and conveyer route which were grouped into each land capability class, a broad description of the soil type, the agricultural potential, the area and percentage comprised by individual soil types within each land capability class as well as the total per land capability class. Table 6b: Land capability classes and agricultural potential New Cornelia Vaalbank underground mining area and conveyer route LEGEND: LAND CAPABILITY Land Capability (Code) Arable (A) Grazing (G) Temporary wetland (T) Seasonal/ Temporary wetland (S/T) Seasonal/ Permanent wetland Wilderness (WDN) Internal drainage *Soil type code Agricultural potential Broad soil description Area (ha) Area (%) Well-drained Hu High Reddish brown to red sandy clay loam soils Bv High Reddish brown to red sandy clay loam soils Moderately Moderate to Greyish brown to yellow brown, sandy loam Av1 high to sandy clay loam soils well-drained Well-drained Imperfectly drained Imperfectly drained Somewhat poorly to poorly Somewhat poorly to poorly Rehabilitated dumps Excavated quarries Av2 Ar Ar/R My-Bo Ms-Sw We1 We3 Pn-We Moderate to low Greyish yellow to yellow brown, sandy to loamy sand soils Black, strongly structured, swelling, clay Moderate-low soils Black, strongly structured, swelling, clay Very low soils; 5-70% exposed surface stone Dark grayish brown, moderate to strongly Low structured, clay loam soils; 10-40% exposed surface stone Dark grayish brown, weak to strongly Very low structured, clay loam soils; 5-70% exposed surface stone Greyish brown to grey, mottled, sandy loam Low or sandy clay loam soils Moderate to Greyish brown to grey, mottled, sandy loam Low or sandy clay loam soils Yellow to greyish brown, sandy loam or Low sandy clay loam soils Total Total Dark grey or grey loamy sand or sandy Lo-Kd Low loam spoils Greyish brown to yellowish grey loamy Lo1 Low sand soils Lo2 Very low Dark grey or grey sandy soils Greyish brown to grey, structured clay loam Se-Ka Low soils Rg2 Rg3 Un Very low Very low Low-none Deep, black, strongly structured, swelling clay soils Deep, black, strongly structured, swelling clay soils Incised drainage channel with black strongly structure clay soils Total Total Kd Very low Grey sandy soils Ka Very low Grey sandy soils Wo Low Brown to black, structured clay soils Total Wb Very low - none Greyish yellow to grey sandy soils manmade soil horizons Q None No topsoil Total
32 32 *See soil map, Figure 3a Grand Total
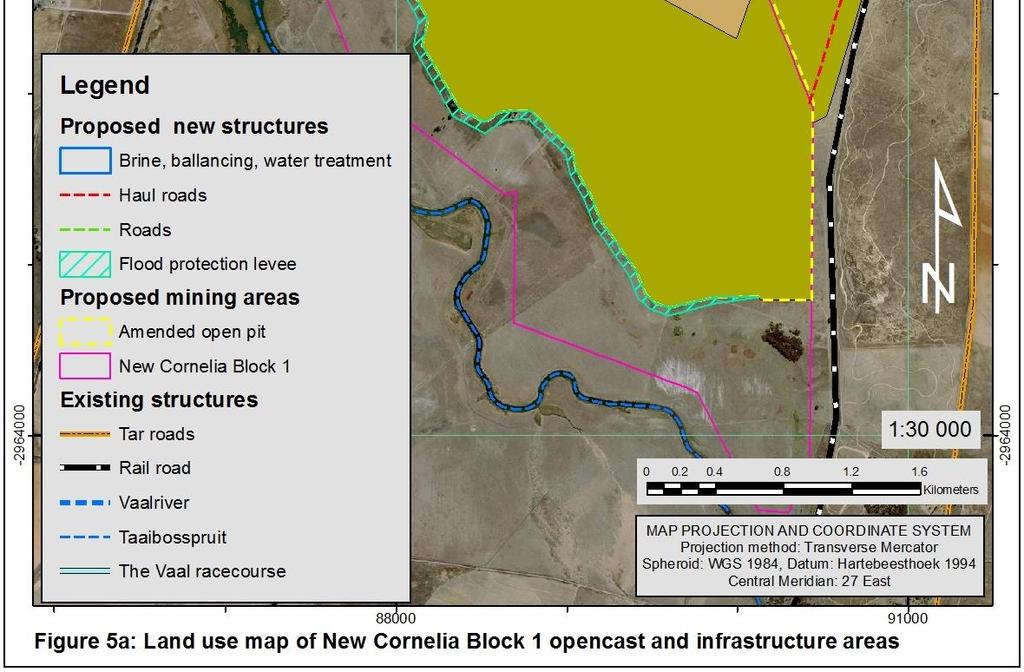
33 Wetland and riparian delineation Land capability was assessed in categories of arable land, grazing land, wetland and riparian zones and wilderness land. Wetland and riparian zones were therefore delineated as part of the land capability assessment based on soil properties by means of systematic auger observations towards wetlands and riparian zones in order to locate the point where soil properties reflect signs of wetness within 500 mm from the surface or where soil, topography and vegetation combined, indicate the boundary of the riparian zone. The soil types associated with wetlands and riparian zones are summarized in Tables 6a and 6b and the locality and extents and are shown on the land capability maps Figures 4a and 4b. A 100 m wetland buffer zone is indicated with a blue line. (See Appendix C for details on soil properties related to wetland zones). 5.6 Pre-mining land use Pre-mining land use within the New Cornelia Block 1 opencast and infrastructure areas The locality and extent of current land uses within the New Cornelia Block 1 opencast and infrastructure areas are shown in Figure 5a and are summarized in Table 7a.

34 34
35 35 Table 7a: Pre-mining land uses within the New Cornelia Block 1 opencast and infrastructure areas Land Use Pre-mining Land Use Area (ha) Area (%) Code G Grazing Commercial cattle farming SM Sand mining (approximate locality and extent) TR Tar road TOTAL Pre-mining land use within the New Cornelia Vaalbank underground mining area and conveyer route The locality and extent of current land uses within the New Cornelia Vaalbank underground mining area and conveyer route are shown in Figure 5b and are summarized in Table 7b. Table 7ba: Pre-mining land uses within the New Cornelia Vaalbank underground mining area and conveyer route Land Use Pre-mining Unit Area (ha) Area (%) Code Land Use Count M Maize SB Soybeans S Sorghum P Pasture G Grazing FL Fallow land T Trees FS Farmstead H Housing R Road V Vacant RD Residential TOTAL


36 36
37 Historical agricultural production Crop yields vary from farm to farm and field to field due to various factors such as soil types and climatic conditions e.g. annual precipitation, temperature, day lengths, heat units etc. No crop farming occurs at New Cornelia Block 1 and the total area is utilized for grazing purposes. Some crop farming could have taken place at some stage although the crop yields would be fairly low due to the very sandy soil texture and subsequent low water holding capacity. Carrying capacity was broadly assessed based on dominant grass species and basal cover during the time of the soil assessment and is summarized in Table 8a. Table 8a: Historical agricultural production New Cornelia Block 1 Derived soil Product Soil Types) potential Grazing - Cattle All soil types (including wetland) Potential Yield (ha/lsu) Low 5-7 Crop farming within the New Cornelia Vaalbank study area occurs mainly on the red sandy clay loam soils and brownish yellow to greyish yellow sandy to loamy sand soils. The brown and black clay soils and grey sandy wetland sections are utilized for grazing purposes. Potential crop yields were estimated based on soil properties and summarised in Table 8b. Table 8b: Historical agricultural production New Cornelia Vaalbank Derived soil Potential Yield Product *Soil Types potential (tons/ha/annum) Hu, Bv, Av1 Moderate to high 5-8 Maize Av2, We1 Moderate to low 2-4 Soybeans Hu, Bv, Av1 Moderate to high Av2, We1 Moderate to low Grazing - Cattle We3, Pn-We, Ar, ArR, My-Bo, Ms-Sw, Lo-Kd, Lo1, Lo2, Se-Ka, Kd, Ka, Wo, Rg2, Rg3 Low-very low 4-7 ha/lsu * See soil map Figure 3b 5.8 Evidence of misuse No evidence of misuse was observed.
38 38 6. PROCEDURES FOR STRIPPING AND HANDLING OF SOIL 6.1 Principles in stripping and handling of topsoil The term topsoil refers to the A and B-horizons of the soil profile as defined in the Taxonomic Soil Classification system for South Africa. The A-horizon comprises the upper part (0-300 mm) of the soil profile and the B-horizon from 300 mm up to the stripping depth specified per soil type indicated in Figure 6. The topsoil and A- and B- horizons are further described in Appendix E in terms of soil stripping, stockpiling and replacing. Stripping, stockpiling and replacing of topsoil has a very high impact on soil, land capability and land use and the procedures followed during execution of these actions directly influences the post-mining land capability and consequently determines the degree of deterioration from pre-mining to post-mining land capability. It also directly determines the possible post-mining land uses. Stripping and stockpiling of topsoil, shaping of spoils and replacing of topsoil should therefore take place according to a plan which should be well managed and progressively adapted according to circumstances. The following should be included in topsoil stripping and stockpiling plans: Prevent stripping and mixing of high quality topsoil (A and B-horizons) with low quality underlying material to ensure sufficient volumes of high quality soil for rehabilitation. The quality of soil earmarked for rehabilitation purposes significantly deteriorates when the high quality topsoil is mixed with the underlying poorer quality material (clay layers, calcrete, plinthite, weathered rock etc). This results in significant deterioration in the quality of soil physical and chemical properties and a decline in soil fertility necessary for revegetation. The deterioration in soil quality also significantly increases the susceptibility of rehabilitated soils for erosion and seal and crust formation. Separate stockpiling of different soil types to obtain the highest postmining land capability. Topsoil quality or potential is not just limited to the grade of soil generally referred to as topsoil but can vary from very high to low due to various properties. Soil properties of different soil types can vary substantial e.g. high quality red and yellow well-drained soils and low quality grey poorly drained wetland soils over very short distances in the same field. Mixing of different soil types result in rapid changes in soil properties and characteristics such as texture, infiltration rates and water holding capacity over short distances after replacement, which will definitely adversely affect the post-mining land capability. Separate stripping, stockpiling and replacing of soil horizons (A and B- horizon) in the original natural sequence to combat hardsetting and compaction, maintain soil fertility and conserve the natural seed source. The higher soil fertility of the A-horizon, especially phosphorus and carbon contents, declines significantly when it is mixed with the B-horizon resulting poorer re-vegetation success. It also increases the susceptibility to compaction and hard setting. The A-horizons also serves as a seed source which will enhance the re-establishing of natural species. The A and B- horizons should be stripped and stockpiled separately and replaced with the A-horizon overlying the B-horizon.
39 39 Contrary to the general perception, separate stockpiling of different soil types and horizons does not have significant cost implications for the mine and only requires planning and continued management. It is therefore crucial to strip according to guidelines and depths as described in the following sections. The soil horizons and properties influencing stripping and stockpiling procedures are discussed in Appendix E. 6.2 Construction phase The erection of mining infrastructure will have impacts on the soil, land capability and land use during the construction phase. The following procedures for topsoil stripping and handling during the operational phase should be followed: Buildings and conveyers. All excess topsoil which might be excavated for the foundations of these structures should be stored for later rehabilitation. Sidings, haul roads and coal stockpiles. Soil pollution should be prevented at all times. Wherever coalliferous material or any material with a potential polluting ability will be dumped and handled, the footprint should be covered with at least 300 mm subsoil or soft overburden material and the edges should be elevated (berm) to prevent pollution beyond the footprint. Discard, tailings and waste dumps. At least 300 mm of topsoil should be removed and stored for later rehabilitation. Borrow pits may not be made on a later stage in order to get topsoil for rehabilitation of the dump. The footprint should be compacted and sealed/lined, it should be free draining and all seepage should be channeled to pollution control dams. Pollution control dams. The A-horizon (0-300 mm) and B-horizon of the topsoil should be stripped and stored separately for later rehabilitation. Coalliferous materials with a potential polluting ability may not be used to stabilize the base or wall embankments of the dam. The base of the dams should be lined. 6.3 Operational phase (Open Pit) In practice, even with optimal rehabilitation procedures applied, deterioration from premining to post-mining land capability is unavoidable. It is therefore crucial to follow the proposed rehabilitation procedures precisely in order to prevent degradation of soil characteristics and to re-establish the highest possible post-mining land capability. The following stripping, stockpiling and replacing procedures needs to be executed precisely: Figure 6 and Table 9 show the soil types in the proposed New Cornelia opencast area that needs to be stripped and stockpiled on 2 separate stockpiles. The boundaries of the soil types that should be stripped at different depths and/or stockpiled separately, as shown in Figures 6, should be surveyed and staked at 50 m intervals before any soil stripping commences. This can be done by the surveyor or soil specialist. The stake points are shown in Figure 6 as yellow dots at intervals of 50 m and the coordinates are provided in Appendix D. The stripping plan, Figure 6 includes small wetland zones. Mining of these areas are subject to authorization of the relevant government departments. The proposed topsoil stockpiles positions, consisting each of a section for the A and B-horizon needs to be surveyed and staked by the mine surveyor. The most suitable stockpile positions should be determined by the mining engineer considering the mining block sequence of the mine plan.
40 The A and B-horizon should be stripped and stockpiled separately as specified in the guidelines for the rehabilitation of mined land (Chamber of Mines of South Africa, 2007). The A and B-horizon sections should be marked with a signboard. The size of the stockpiles should be based on the soil volume per stockpile as indicated in Figures 6 and no height restriction is proposed. Before topsoil can be replaced, the pit should be backfilled to an elevation similar to the pre-mining topography as far as possible with the material available, in order to ensure a continuation of the pre-mining surface drainage pattern. The backfilled surface should be surveyed by a surveyor in order to ensure that it has the correct elevation and slopes, and is free draining. A non free draining surface results in local depressions of periodically saturated zones and increased percolation which usually leads to localised subsidence of underlying spoil material. Slopes of the spoil surface should therefore aim to be similar to the pre-mining surface and should change gradually since abrupt changes in slope gradient increase the susceptibility for erosion initiation. The backfilled surface should first be replaced with soil of the B-horizons. Care should be taken to tip enough soil per square unit to reinstate the total required B-horizon thickness at once. The dumped soil heaps should thus only be levelled to reach the required horizon/soil thickness. This will prevent compaction in the lower profile which cannot be alleviated afterwards. Spreading of soil over far distances and repeated traversing should be avoided. Caterpillar tracked equipment is preferred to use for levelling of the B-horizons due to the large quantities of soil that needs to be handled and less compaction caused by these tracks. Bowl scrapers cause enormous compaction and may not be used. When the roll-over mining system kicks in and the point is reached where soils are stripped and directly replaced, without stockpiling, the following method should be implemented. The A-horizon of 1 mining strip should be stored at the final mining strip and the B-horizon should be tipped and levelled on the area to be rehabilitated (properly levelled spoil surface). The A-horizon of the next mining strip should then be tipped and levelled on top of the replaced B-horizon and the roll-over system can continue like this. The stored A-horizon of the first mining strip should then be replaced on the B-horizon of the last mining strip. After the B-horizon is replaced, the surface should be loosened to a depth of approximately 300 mm with normal agricultural equipment, preferably a multiple teeth implement. This is very important to prevent a compacted layer between the A and B-horizons which will be similar to a plough sole which dramatically reduces the effective soil depth and restrict root development. The A-horizon should then be tipped systematically over the loosened B- horizons surface and spread evenly. Replacing the A-horizon involves much smaller quantities of soil and a combination of a lighter dozer and grader should be used. Graders have the ability to create a more even surface with less traversing than a dozer, without creating too much compaction. The replaced topsoil thickness should progressively be monitored during replacement to verify if it is similar to the replacing depth provided in Figure 6a and 6b and to prevent that shortages of topsoil are not encountered. The soil fertility status should be determined by soil chemical analysis after levelling (before seeding/re-vegetation), and soil amelioration should be done accordingly as recommended by a soil specialist, in order to correct the ph and nutrition status before re-vegetation. The rehabilitated sections should be re-vegetated with a grass mixture dominated by local climax species in early summer to stabilize the soil. A short term fertilizer program should be based on the soil chemical status after the first year in order to maintain the fertility status for 2 to 3 years after 40
41 41 rehabilitation until the area can be declared as self-sustaining. The soil types that should be stripped and stockpiled either separately or together are shown in Figure 6. The figure includes a table that shows the stripping depths, the areas and percentages as well as the total soil volume per soil type based on the stripping depth. It also shows the replacing depth (topsoil thickness) and post-mining land capability class. This was determined by calculating the total soil volume per soil group (stockpile), divided by the original area which was stripped. This implies that if more than 1 soil type, which were stripped at different depths, are stockpiled together, it will be replaced at 1 average depth. It further shows the stake points on soil boundaries at 50 m intervals. The criteria for soil stripping and replacing within the New Cornelia opencast area are summarised in Table 9 for the various soil types. Table 9: Criteria for soil stripping and replacing at New Cornelia Block 1 opencast Legend: Soil stripping depths, volumes, post-mining replacing depths and land capability Soil group and stockpile no. Stockpile 1 (Brownish and greyish yellow, moderately well-drained soils) *Stockpile 2 (Grey, imperfectly to poorly drained wetland soils) Soil Types Strip depth (m) Pre-mining Area (ha) Area (%) Soil volume (m 3 ) Cv Av Lo TOTAL Lo Post-mining Replacing Depth (m) Area (ha) Land capability Grazing Kd/Ka Wetland/ Grazing TOTAL Grand Total *Stripping of the wetland soil units is subject to authorization by the relevant Government authorities


42 Post-mining land capability commitments The post-mining land capability class will mainly be determined by the soil type and the thickness of the soil layer placed back on the spoil surface. Other factors and characteristics that might influence the post-mining land capability is slope, compaction and reduction of soil quality due to contamination of soils by subsoil, soft overburden or spoil material. A post-mining land capability assessment needs to be done progressively (annually) during the operational phase by a soil specialist by means of auger observations at a
SOIL SURVEY FOR PROPOSED WET ASH DISPOSAL FACILITY, HENDRINA POWER STATION, MPUMALANGA PROVINCE
 REPORT for Lidwala Environmental and Planning Servives by the INSTITUTE FOR SOIL CLIMATE AND WATER AGRICULTURAL RESEARCH COUNCIL SOIL SURVEY FOR PROPOSED WET ASH DISPOSAL FACILITY, HENDRINA POWER STATION,
SOIL SURVEY OF PORTIONS 81 AND 82 OFTHE FARM VAALBANK 512JQ, NEAR MAGALIESBURG, SOUTH-WEST OF PRETORIA
 REPORT For Newtown Landscape Architects SOIL SURVEY OF PORTIONS 81 AND 82 OFTHE FARM VAALBANK 512JQ, NEAR MAGALIESBURG, SOUTH-WEST OF PRETORIA By N.M. Mushia, D.G. Paterson and S.D. Mkula Report Number
IOWA FFA STATE SOILS CDE SATURDAY, OCTOBER 13, 2007 AMES, IOWA
 IOWA FFA STATE SOILS CDE SATURDAY, OCTOBER 13, 2007 AMES, IOWA 1. Moderately sloping has what percent slope: a. 9-14% b. 2-5% c. 5-9% d. over 14% 2. Which of the following horizons is the loose underlying
STATEMENT OF PHYSICAL CHARACTERISTICS AND AGRICULTURAL LAND CLASSIFICATION
 STATEMENT OF PHYSICAL CHARACTERISTICS AND AGRICULTURAL LAND CLASSIFICATION BIRKWOOD FARM, ALTOFTS WEST YORKSHIRE Proposed Opencast Extraction of Clay and coal ADAS January 1990 Leeds Regional Office File
2014 Iowa FFA Soil Judging CDE Exam
 2014 Iowa FFA Soil Judging CDE Exam 1. Landscape position is one aspect of evaluating the surface features of a certain tract of land. Identifying the correct landscape position will indicate: a. If the
SCOPING REPORT. On contract research for ILISO CONSULTING
 SCOPING REPORT On contract research for ILISO CONSULTING Proposed Construction of a 65 MW Photovoltaic Power Plant, Duvha Power Station, Mpumalanga Province Soils and Agricultural Potential Scoping Study
Annex 5D. Soil, Land Use and Land Capability Report compiled by TerraAfrica Consult, April 2015
 Annex 5D Soil, Land Use and Land Capability Report compiled by TerraAfrica Consult, April 2015 Environmental Assessment Report for the Kangra Coal (Pty) Ltd Kusipongo Resource Project: I, Mariné Pienaar,
The entire site supports grass on which sheep had been grazing recently.
 PHYSICAL CHARACTERISTICS REPORT FOR LAND AT HORSEHAY A^ Agricultural Land Classification of approximately 14 hectares of land to the southwest of Horsehay was undertaken in November 1989. The site lies
Iowa FFA Soil Career Development Event 2008
 Iowa FFA Soil Career Development Event 2008 1. In Iowa, corn suitability ratings for soil mapping units specifies a. natural weather conditions b. surface and subsurface drainage installed where needed
2017 Iowa FFA Soil Judging CDE Exam
 2017 Iowa FFA Soil Judging CDE Exam 1. Landscape positions vary in soil composition and makeup. What landscape position would be characterized by having strata and lenses of different textures in the profile:
PROPOSED OPEN CAST COAL SITE SEPTEMBER 1992
 AGRICULTURAL LAND CLASSIFICATION AND STATEMENT OF PHYSICAL CHARACTERISTICS SKIERS SPRING, HOYLAND, SOUTH YORKSHIRE PROPOSED OPEN CAST COAL SITE SEPTEMBER 1992 ADAS LEEDS STATUTORY GROUP Job No. 98/92 MAFF
SOILS AND AGRICULTURAL POTENTIAL FOR THE PROPOSED P166 SERVITUDE, MBOMBELA, MPUMALANGA PROVINCE
 REPORT On contract research for Royal Haskoning DHV SOILS AND AGRICULTURAL POTENTIAL FOR THE PROPOSED P166 SERVITUDE, MBOMBELA, MPUMALANGA PROVINCE By F.T. Seabi (Pr. Nat. Sci. 400370/11) & D.G. Paterson
STATEMENT OF PHYSICAL CHARACTERISTICS AND AGRICULTURAL LAND CLASSIFICATION WITTON PARK, COUNTY DURHAM PROPOSED QUARRY EXTENSION DECEMBER 1992

Report on a soil survey and agricultural suitability investigation of the property known as Erf 660, De Doorns.
 De Doorns erf 660 Soil Report 1 Report on a soil survey and agricultural suitability investigation of the property known as Erf 660, De Doorns. by F. Ellis September 2006 CONTENTS 1 INTRODUCTION AND TERMS
PHYSICAL CHAtlACTERISTICS REPORT FOR THE PROPOSED SAND AND GRAVEL SITE AT MANOR FARM, UFFINGTON
 PHYSICAL CHAtlACTERISTICS REPORT FOR THE PROPOSED SAND AND GRAVEL SITE AT MANOR FARM, UFFINGTON Introduction Following the" request for detailed information on the physical characteristics of soil at Manor
2018 Iowa FFA Soil Judging CDE Exam 1. Landscape positions characterizes the location of the soil on the landscape and identifies potential risks.
 2018 Iowa FFA Soil Judging CDE Exam 1. Landscape positions characterizes the location of the soil on the landscape and identifies potential risks. Which landscape position is considered the floodplain
Environmental Impact Assessment for KPSX: Weltevreden
 Environmental Impact Assessment for KPSX: Weltevreden Soil Survey Report Project Number: Prepared for: Billiton Energy Coal South Africa (PTY) Limited (BECSA) January 2015 Digby Wells and Associates (South
AGRICULTURAL LAND CLASSIFICATION AND STATEMENT OF PHYSICAL CHARACTERISTICS
 AGRICULTURAL LAND CLASSIFICATION AND STATEMENT OF PHYSICAL CHARACTERISTICS DALE PIT FARM. HATFIELD VOODHOUSE PROPOSED EXTRACTION OF SAND AHD GRAVEL ADAS April 1989 Leeds Regional office File Ref: 2FCS
2012 FINAL SOILS AREA 2 Envirothon Questions Answer KEY
 2012 FINAL SOILS AREA 2 Envirothon Questions Answer KEY Questions 1-6 to be answered at the soil pit: 1. Soil scientists categorize soils by drainage classes. What is the drainage class of the soil at
Topoclimate Southland Soil Technical Data Sheet No Waiau
 This Technical Data Sheet describes the typical average properties of the specified soil. It is essentially a summary of information obtained from one or more profiles of this soil that were examined and
AGRICULTURAL LAND CLASSIFICATION AND SOIL PHYSICAL CHARACTERISTICS LAND NEAR SHIRE HILL FARM SAFFRON WALDEN ESSEX
 AGRICULTURAL LAND CLASSIFICATION AND SOIL PHYSICAL CHARACTERISTICS LAND NEAR SHIRE HILL FARM SAFFRON WALDEN ESSEX AGRICULTURAL LAND CLASSIFICATION (ALC) AND SOIL PHYSICAL CHARACTERISTICS LAND NEAR SHIRE
AGRICULTURAL LAND CLASSIFICATION
 AGRICULTURAL LAND CLASSIFICATION GOOLE/HOOK LOCAL PLAN SITES SURVEYED FOR BOOTHFERRY BOROUGH COUNCIL'S INDUSTRIAL LAND SUITABILITY STUDY ADAS February 1991 Leeds Regional Office 2FCS 5205 CONTENTS 1. Introduction
 108 40' 29'' W Soil Map Mesa County Area, Colorado 108 36' 55'' W 39 10' 11'' N 39 6' 31'' N 4331700 4332500 4333300 4334100 4334900 4335700 4336500 4337300 4338100 701100 701900 702700 703500 704300 705100
2016 Iowa FFA Soils Evaluation CDE Exam
 2016 Iowa FFA Soils Evaluation CDE Exam 1. Which of the following is true regarding soil horizons? a. A horizon is darker in color and has more organic matter b. B horizon is darker in color and has more
DO YOU KNOW YOUR SOILS? (Rev. 10/11)
") DO YOU KNOW YOUR SOILS? (Rev. 10/11) Circle all the correct answers. 1. What is the layer normally present on the surface of the soil in cropped fields? a. O c. Ap e. B g. R b. A d. E f. C 2. Available
DO YOU KNOW YOUR SOILS? (Rev. 10/11) Circle all the correct answers. 1. What is the layer normally present on the surface of the soil in cropped fields? a. O c. Ap e. B g. R b. A d. E f. C 2. Available
Topoclimate Southland Soil Technical Data Sheet No. 8. Sobig
 This Technical Data Sheet describes the typical average properties of the specified soil. It is essentially a summary of information obtained from one or more profiles of this soil that were examined and
CB1 Moderately undulating landscape with slight gilgai (few inches) formation: broad ridge tops and upper slopes of moderately shallow grey cracking
 formation: broad ridge tops and upper slopes of moderately shallow grey cracking") CB1 Moderately undulating landscape with slight gilgai (few inches) formation: broad ridge tops and upper slopes of moderately shallow grey cracking clays (Ug5.22 and Ug5.23). Associated are: (i) some
CB1 Moderately undulating landscape with slight gilgai (few inches) formation: broad ridge tops and upper slopes of moderately shallow grey cracking clays (Ug5.22 and Ug5.23). Associated are: (i) some
3.44b. Soil Classification AK & BR
 3.44b Soil Classification AK & BR Why look at soil? Because soil and its constituents are the base material for growing trees. History Why a Forestry Commission soil classification? There is a need for
AGRICULTURAL LAND CLASSIFICATION AND STATEMENT OF PHYSICAL CHARACTERISTICS
 AGRICULTURAL LAND CLASSIFICATION AND STATEMENT OF PHYSICAL CHARACTERISTICS SEGHILL, NORTHUMBERLAND PROPOSED VASTE DISPOSAL SITE ADAS January 1989 Leeds Regional Office REF: 3/89 2FCS 4191 lds.rpg3.seghill
5 RESULTS FOR THE REJECT EMPLACEMENT AREA
 SPECIALIST CONSULTANT STUDIES 9b - 21 NARRABRI COAL OPERATIONS PTY LTD of the REA, BSA and Water Pipeline Report No. 674/17 5 RESULTS FOR THE REJECT EMPLACEMENT AREA 5.1 Introduction From the information
2011 Wisconsin Envirothon Soils and Land Use Exam
 2011 Wisconsin Envirothon Soils and Land Use Exam USE THE OCONTO COUNTY SOIL SURVEY TO ANSWER QUESTIONS 1-4 The Pensaukee River Wetland Complex is a mixture of state (Pensaukee Wildlife Area) and privately
Environmental Regulatory Processes relating to the amendment of the Environmental Management Programme for its Elandsfontein Operations
 Environmental Regulatory Processes relating to the amendment of the Environmental Management Programme for its Elandsfontein Operations Soils, Land Use and Land Capability Impact Assessment Project Number:
SUMMARY. alcholnie.doc\ih\jk
 SUMMARY A detailed Statement of Physical Characteristics and Agricultural Land Classification survey of ha of land at Stainton ("Holme Hall Quarry Extension") was carried out in September 1994. At the
AGRICULTURAL LAND CLASSIFICATION AND SOIL PHYSICAL CHARACTERISTICS BIRCH PIT, NEAR COLCHESTER ESSEX
 AGRICULTURAL LAND CLASSIFICATION AND SOIL PHYSICAL CHARACTERISTICS BIRCH PIT, NEAR COLCHESTER ESSEX AGRICULTURAL LAND CLASSIFICATION AND SOIL PHYSICAL CHARACTERISTICS SEMI-DETAILED SURVEY BIRCH PIT, NEAR
Pits 1 & 3 Questions. 7. Subsurface: Texture (5 pts) A. Coarse B. Moderately course C. Medium D. Fine E. Very Fine
 A. Coarse B. Moderately course C. Medium D. Fine E. Very Fine") Minnesota Soils Scorecard Questions for Pits 1-4 Scantron # 105481 Use your soils scorecard to fill out the answers on your scantron Bubble in the front side of the sheet for Pit 1 (# 1-45) and Pit 2 (#51-95)
Minnesota Soils Scorecard Questions for Pits 1-4 Scantron # 105481 Use your soils scorecard to fill out the answers on your scantron Bubble in the front side of the sheet for Pit 1 (# 1-45) and Pit 2 (#51-95)
Agricultural Land Classification and Statement of Physical Characteristics Higbfield Farm Whitley Bridge North Yorkshire October 1996
 Agricultural Land Classification and Statement of Physical Characteristics Higbfield Farm Whitley Bridge North Yorkshire October 1996 Resource Planning Team ADAS Reference: 82/96 Leeds Statutory Group
Horner-McLaughlin Woods: Soil Types
 Horner-McLaughlin Woods: Soil Types Not present at HMW Adrian Muck Conover Loam 0-4% Slopes Houghton Muck Miami Loam 2-6% Slopes Miami Loam 6-12% Slopes Miami Loam 12-18% Slopes t 0 0.125 0.25 Miles Mary
Do Now: From which materials do you think soil is made? Are all soils the same? Think of some ways that they are different?
 Do Now: From which materials do you think soil is made? Are all soils the same? Think of some ways that they are different? Basics Soil is a major component of the biosphere It contains solids, liquids
Land Capability Classifications
 Land Capability Classifications Unit: Soil Science Problem Area: Basic Principles of Soil Science Student Learning Objectives. Instruction in this lesson should result in students achieving the following
MAFF Ministry of Ifinil Agriculture Rsheries and Food
 MAFF Ministry of Ifinil Agriculture Rsheries and Food STATEMENT OF PHYSICAL CHARACTERISTICS AND AGRICULTURAL LAND CLASSIFICATION SHILBOTTLE COLLIERY RECLAMATION SCHEME NORTHUMBERLAND DECEMBER 1994 ADAS
EXPERIMENT 6 PREPARATION OF LAND CAPABILITY CLASS MAP
 EXPERIMENT 6 PREPARATION OF LAND CAPABILITY CLASS MAP Structure 6.0 Objectives 6.1 Intnxluction 6.2 Experiment 6.21 Deciding Factors for Land Capability 6.2.2 Requirements 6.23 Procedure 6.3 Observations
Topoclimate Southland Soil Technical Data Sheet No. 11. Pukemutu
 This Technical Data Sheet describes the typical average properties of the specified soil. It is essentially a summary of information obtained from one or more profiles of this soil that were examined and
Muswellbrook Coal Company No.1 Open Cut Extension Soil Study
 Muswellbrook Coal Company No.1 Open Cut Extension Soil Study November 2001 Table of Contents 1. Introduction... 1 2. Methodology... 1 3. Description of Soil Units Observed... 2 3.1 Yellow Duplex Soils
STATE TAX COMMISSION OF MISSOURI ASSESSOR MANUAL
 STATE TAX COMMISSION OF MISSOURI ASSESSOR MANUAL CHAPTER: REVISION DATE: 10/1/2008 Page 1 of 18 7.3 The purpose of this section of the Assessor s Manual is to supplement the State Tax Commission s published
Soils and Land Use Test
 SOIL PROPERTIES Total Score /50 1) List two of the five main functions of soil. (2 points) Habitat for organisms, Engineering medium, Filters and stores water, Anchor for plants, Cycles nutrients 2) Small
APPENDIX J: SOILS AND AGRICULTURAL POTENTIAL
 APPENDIX J: SOILS AND AGRICULTURAL POTENTIAL REPORT EIA PHASE SOIL, LAND USE, LAND CAPABILITY AND AGRICULTURAL POTENTIAL SURVEY: PROPOSED ESKOM UCG PLANT ON THE FARMS TWEEDEPOORT 54-HS, STRYDKRAAL 53-HS,
Appendix 22 Soils and Land Capability
 Appendix 22 Soils and Land Capability March 2009 March 2009 Table of Contents Page No. 1. INTRODUCTION... 1 2. SOIL PROFILING AND MAPPING... 2 2.1 Soil Survey Methodology... 2 2.2 Soil Landscapes... 3
M AFT Ministry of Ifin&l. Agriculture Rsheries and Food
 ^ M AFT Ministry of Ifin&l. Agriculture Rsheries and Food AGRICULTURAL LAND CLASSIFICATION BARNSLEY UDP (AREA OF SEARCH FOR AIRFIELD) SOUTH YORKSHIRE JANUARY 1995 ADAS Job No:- 9/95 Leeds Statutory Group
Unit II Soil Management
 Unit II Soil Management Lesson 2: Using Soil Survey Manuals Soil survey manuals provide useful information for grassland management. Soil scientists evaluate the soil for chemical and physical properties,
STATEMENT OF PHYSICAL CHARACTERISTICS OLDWICK FARM, WEST LAVANT, WEST SUSSEX
 STATEMENT OF PHYSICAL CHARACTERISTICS OLDWICK FARM, WEST LAVANT, WEST SUSSEX STATEMENT OF PHYSICAL CHARACTERISTICS OLDWICK FARM, WEST LAVANT, WEST SUSSEX 1. BACKGROUND 1.1 This 37.1 ha site was surveyed
HUMBLEBURN OCCS, CRAGHEAD, COUNTY DURHAM SURVEY OF RESTORED LAND OCTOBER RPT Job Number: 73/97 MAFF Reference: EL LURET Job Number: ME3RTP
 HUMBLEBURN OCCS, CRAGHEAD, COUNTY DURHAM SURVEY OF RESTORED LAND OCTOBER 1997 Resource Planning Team Northern Region FRCA, Leeds RPT Job Number: 73/97 MAFF Reference: EL 10387 LURET Job Number: ME3RTP
2016 Area 3 Envirothon Muskingum County Soils Test ANSWER KEY
 2016 Area 3 Envirothon Muskingum County Soils Test ANSWER KEY 1. The majority of the bedrock in Muskingum County is. a. sedimentary bedrock b. glacial bedrock c. igneous bedrock d. metamorphic bedrock
1. Position (2 pts.) 2. Parent Material (2 pts.) 3. Slope Characteristics (2 pts.) 4. Surface Stoniness or Rockiness (2 pts.)
 2. Parent Material (2 pts.) 3. Slope Characteristics (2 pts.) 4. Surface Stoniness or Rockiness (2 pts.)") Maryland Envirothon SOILS Exam Guidance Information (revised 2017) Objective: To test students' knowledge and awareness of basic soil science and its application in wise land-use planning and therefore
Maryland Envirothon SOILS Exam Guidance Information (revised 2017) Objective: To test students' knowledge and awareness of basic soil science and its application in wise land-use planning and therefore
ACRE NOOK EAST QUARRY, CHELFORD, CHESHIRE. Statement of Site Physical Characteristics January 1998
 ACRE NOOK EAST QUARRY, CHELFORD, CHESHIRE Statement of Site Physical Characteristics January 1998 J M LePage Resource Planning Team RPT Reference: 084/97 & 25/RPT/0863 Northern Region FRCA Reference: EL
Topoclimate Southland Soil Technical Data Sheet No. 76. Mossburn
 This Technical Data Sheet describes the typical average properties of the specified soil. It is essentially a summary of information obtained from one or more profiles of this soil that were examined and
SOIL CHARACTERIZATION USING DIAGNOSTIC PROPERTIES
 SOIL CHARACTERIZATION USING DIAGNOSTIC PROPERTIES The following are the characters of the pedologically important properties used in categorizing soils: SOIL CHARACTERIZATION Soil Profile Description:
Soil Horizons cont. Oa- highly decomposed Oi-undecomposed
 Soils Soil Basics Soil Horizons Soil Horizons cont. O Horizon: Or organic layer Organic layer of decomposing plant and animal tissue. Wooded upland areas have thin O horizons Wetlands may have thick O
Examining soils in the field. Examining soils in the field. Environment Agency thinksoils examining soils in the field
 Examining soils in the field thinksoils Examining soils in the field Environment Agency thinksoils examining soils in the field 31 Examining soils in the field 32 Environment Agency thinksoils examining
EDULABZ. Ans. (b) 7. The soft, porous layer with a good water-retaining capacity forms the
 7. The soft, porous layer with a good water-retaining capacity forms the") 3 SOIL I. Multiple choice questions: Tick ( ) the correct choice. 1. The process of soil formation is called (a) conservation (b) weathering (c) erosion (d) none Ans. (b) 2. Soil profile consists of (a)
3 SOIL I. Multiple choice questions: Tick ( ) the correct choice. 1. The process of soil formation is called (a) conservation (b) weathering (c) erosion (d) none Ans. (b) 2. Soil profile consists of (a)
SOIL DATA: Avondale. in Allen, TX. This information was taken from NRCS web soil survey of Collin County, Texas.
 SOIL DATA: Avondale in Allen, TX This information was taken from NRCS web soil survey of Collin County, Texas. United States Department of Agriculture Soil Conservation Service in cooperation with Texas
Swan Coastal Plain - Reading
 Swan Coastal Plain Almost all the soils of the Swan Coastal Plain are formed by material deposited by rivers and wind. The Yilgarn Block, east and south of the scarp bordering the Swan Coastal Plain, rose
Topoclimate Southland Soil Technical Data Sheet No. 23. Waikiwi
 This Technical Data Sheet describes the typical average properties of the specified soil. It is essentially a summary of information obtained from one or more profiles of this soil that were examined and
6 Athlone Street Tel: SWELLENDAM Cell:
 C R LUBBE 6 Athlone Street Tel: 028 514 2359 SWELLENDAM Cell: 082 853 1274 6740 e-mail: macquarrie@vodamail.co.za Attention: Louise Mari van Zyl Cape EA Prac 1 June 2018 P O Box 2070 GEORGE 6530 Dear Ms
CORNFORTH EAST QUARRY COUNTY DURHAM
 CORNFORTH EAST QUARRY COUNTY DURHAM AgricuUural Land Classification (ALC) and Statement of Physical Characteristics Report and Map MARCH 1999 Resource Planning Team RPT Job Number: 5/99 Northern Region
AGRICULTURAL USE & QUALITY OF LAND NEAR MINDALE HOUSE PRESTATYN. Report 762/1
 AGRICULTURAL USE & QUALITY OF LAND NEAR MINDALE HOUSE PRESTATYN Report 762/1 11 th April, 2012 AGRICULTURAL USE & QUALITY OF LAND NEAR MINDALE HOUSE PRESTATYN F W Heaven, BSc, MISoilSci Report 762/1 Ltd
Soil Chemistry. Key Terms.
 Soil Chemistry Key Terms Key Terms in Soil Chemistry Buffering capacity - this is the soil's ability to resist changes in soil ph. Soils with a high buffering capacity require a great deal of amendment
 Cci
Cci Soil Colors, Texture & Structure
 Application Soil Colors, Texture & Structure Limiting conditions Soil color type/depth of system Bedrock type/depth of system Soil texture, structure, percolation rate size and type of system Sara Heger,
3. What are the five master horizons? Give distinguishing features of each. 5. List three means by which plant roots come into contact with nutrients.
 Study Questions Exam 1 1. What are the four general components of soil? 2. Define regolith and solum. 3. What are the five master horizons? Give distinguishing features of each. 4. What is meant by an
Ombrogenous Peat Swamps and Development
 Ombrogenous Peat Swamps and Development 1. Background 1.1. Formation of ombrogenous peat swamps Formation of ombrogenous peat is a geogenic process that results in the accumulation of plant debris in an
Humisphere SOIL RECONNAISSANCE MISSION TO 3 ESTATES IN TANZANIA. Ir. J.H.M. (Hans) Scholten
 Scholten") Humisphere SOIL RECONNAISSANCE MISSION TO 3 ESTATES IN TANZANIA Ir. J.H.M. (Hans) Scholten September 2012 CONTENT 1. INTRODUCTION 3 2. SOIL INFORMATION OBTAINED 3 3. SOILS OF KWAMDULU ESTATE. 4 3.1 Soils..
Humisphere SOIL RECONNAISSANCE MISSION TO 3 ESTATES IN TANZANIA Ir. J.H.M. (Hans) Scholten September 2012 CONTENT 1. INTRODUCTION 3 2. SOIL INFORMATION OBTAINED 3 3. SOILS OF KWAMDULU ESTATE. 4 3.1 Soils..
DIRT! APES Laboratory Activity
 Name: Part I: Soil Texture DIRT! APES Laboratory Activity Can one determine the texture of soil by examining the particles found in a particular sample? The purpose of this activity is to determine the
a. OVERALL PROFILE DEPTH: Assess the depth to the first restrictive layer, which can be a tree root, a rock or an
 OBSERVING SOIL PROCEDURE Using a shovel, soil probe, or soil auger, collect a soil profile. (Go as deep as you can with the equipment). Arrange the soil you remove from the ground on newspaper or in a
EARTH SCIENCE CONCEPTS -Geologic time scale
 EARTH SCIENCE CONCEPTS -Geologic time scale -Plate Tectonics -Earthquakes *result of vibrations (often due to plate movement) deep in the Earth that release energy *often occur at transform boundaries
Loam: About 40% sand, 40% silt, 20% clay. Mixture of pore sizes to balance water retention and aeration. Considered the best soil for growing crops.
 Soil Characteristics Soil is formed from a combination of two Primary sources: Weathering of Parent Rock ( ) = material introduced by plants, animals, and decomposers Minor sources: Nutrients incorporated
In 1983, the town evacuated and purchased by government for $36 million
 1 2 3 4 5 6 7 8 9 Introduction to Environmental Geology, 5e Chapter 17 Soil and Environment Weathering: summary in haiku form Rocks brought to surface decompose to sediment and that's weathering. Case
Terminology & Soil Science. Andy Spetch
 Terminology & Soil Science Andy Spetch 1 Presentation Soil Profile Soil Structure Soil Texture Compaction Cation Exchange Capacity Soil ph Nutrients / Organic Matter / EC / PTE s 2 What is Soil: A blend
Understanding Soils. 1. What is Soil? 2. What does soil do for us?
 Understanding Soils 1. What is Soil? Soil: (i) The unconsolidated mineral or organic material on the immediate surface of the earth that serves as a natural medium for the growth of land plants. (ii) The
ASCE - Philadelphia. Soils & Stormwater Management. Matthew C. Hostrander, CPSS, SEO Soil Scientist. Gilmore & Associates, Inc.
 ASCE - Philadelphia Soils & Stormwater Management Matthew C. Hostrander, CPSS, SEO Soil Scientist Gilmore & Associates, Inc. Course Overview COURSE OUTLINE Soil Science Fundamentals Discuss United States
Problem soils & its management. Satira Udomsri, LDD
 Problem soils & its management Satira Udomsri, LDD Kingdom of Thailand Location: Southeast Asian mainland 5 o -20 o N 97 o -105 o E Area total: land: water: Capital: 513,120 sq km 510,890 sq km 2,230 sq
Soil Physical Properties
 Soil Physical Properties ESRM 311 SEFS 507 Some examples of mineral soil development eg, Rock Weathering Types of Weathering Physical/Mechanical Chemical Biological Photo by D Vogt CO 2 + H 2 O H 2 CO
Tools to facilitate the use of Soil Maps in Emilia-Romagna region (Italy) Paola Tarocco
 Paola Tarocco") Tools to facilitate the use of Soil Maps in Emilia-Romagna region (Italy) Paola Tarocco Soil maps Vs Thematic maps Soil maps are not easy to manage. Legends are usually based on soil classifications (e.g.
Tools to facilitate the use of Soil Maps in Emilia-Romagna region (Italy) Paola Tarocco Soil maps Vs Thematic maps Soil maps are not easy to manage. Legends are usually based on soil classifications (e.g.
Reference Card S-2, Side A: Delineating Horizon Boundaries
 Reference Card S-2, Side A: Delineating Horizon Boundaries Distinguishing Soil Horizons Soil horizons are delineated based on differences in: Texture Color Structure and Consistence Redoximorphic Features
Soil resources in upper Basho Valley.
 Soil resources in upper Basho Valley. Åge A. Nyborg, 2007 Norwegian Forest and Landscape Institute. Soil management challenges in Upper Basho Valley Low nutrient content, low organic matter content, deficient
Unearthing problem soils in the Lachlan Valley
 Vol 24, No 1, page 32 February-March, 2003 The Australian Cottongrower Unearthing problem soils in the Lachlan Valley By Edward Cay and Stephen Cattle, The University of Sydney and Australian Cotton CRC
York Potash Project Mine, MTS and MHF Environmental Statement, Part 2 Chapter: 16 Land Use and Soils Appendix 16.5 Outline Soil Management Plan
 York Potash Project Mine, MTS and MHF Environmental Statement, Part 2 Chapter: 16 Land Use and Soils Appendix 16.5 Outline Soil Management Plan Document title: Status: Draft Report Date: 21 August 2014
THE TENNESSEE VEGETABLE GARDEN
 THE BACKYARD SERIES BACKYARD VEGETABLES W 346-A THE TENNESSEE VEGETABLE GARDEN SITE SELECTION AND SOIL TESTING Natalie Bumgarner, Assistant Professor and UT Extension Residential and Consumer Horticulture
Soils, Land Capability, and Land Use Assessment for the Environmental Impact Assessment for Lanxess Chrome Mining
 Soils, Land Capability, and Land Use Assessment for the Environmental Impact Assessment for Lanxess Environmental Impact Assessment Project Number: Prepared for: Lanxess (Pty) Ltd March 2015 Digby Wells
2 Older farm homes on the land
 2 Older farm homes on the land LAND RANCHES EXCHANGES This ranch consists of 70 +/_ acres of level farmland. Prime 13700 POWERHOUSE RD POTTER VALLEY agricultural land at an attractive price. This property
LANDPKS TEACHING MANUAL
 LANDPKS TEACHING MANUAL IMPLICATIONS FOR LAND DEGRADATION and RESTORATION FOR THE LandPKS LandInfo MODULE Contents: A description of LandPKS application indicators Indicators and how they impact land degradation
MAFF I^inistry of IfiriEE Agriculture Fisheries and Food
 MAFF I^inistry of IfiriEE Agriculture Fisheries and Food AGRICULTURAL LAND CLASSIFICATION BROOMY HOLM FARM, EDMONDSLEY, CO DURHAM PROPOSED GOLF COURSE DECEMBER 1993 ADAS Leeds Statutory Group JobNo:- 168/93
Grade. % of Survey Area 1. Staplehay. 2 3a. 3a 3b Non Ag Organ Ag Bldgs. 1 Non Ag Urban
 ^ ( ^ ^fcj 2JiOc^ TAUNTON LOCAL PUW FIRST ALTE31ATI0N AOtECULTURAL LAND CLASSIFICATION OF ALTERNATIVE SITES R^»rt of Survey 1. Introduction Agricultural Land Classification surveys were carried out at
Soil Maps for Production Agriculture. Jarrod O. Miller, Extension Agronomist
 Soil Maps for Production Agriculture Jarrod O. Miller, Extension Agronomist Origination of Soil Mapping Originally mapped by Division of Soils Federal Bureau of Soils Soil Conservation Service (SCS) started
SOIL SURVEY REPORT ON SENCE de LIEU, PAARL
 SOIL SURVEY REPORT ON SENCE de LIEU, PAARL April 2016 Report compiled by: B Schloms Pr. Sci. Nat. (registration Number 400059) Contents 1 Terms of reference 2 Allocation of responsibilities 3 Description
Investigation of soil ph variability. Andrew Harding Peter Ciganovic
 Investigation of soil ph variability Andrew Harding Peter Ciganovic June 2011 Disclaimer Rural Solutions SA and its employees do not warrant or make any representation regarding the use, or results of
Soil Notes. General Soil Information
 Soil Notes General Soil Information Definition Soil relatively thin surface layer of the Earth s crust consisting of mineral and organic matter that is affected by agents such as weather, wind, water,
2014 Envirothon Georgia Soil Study Guide
 2014 Envirothon Georgia Soil Study Guide In addition to materials in this document, 2014 Georgia Envirothon contestants are responsible for materials found in the following documents: From The Surface
Custom Soil Resource Report for Craighead County, Arkansas
 United States Department of Agriculture Natural Resources Conservation Service A product of the National Cooperative Soil Survey, a joint effort of the United States Department of Agriculture and other
Soils and the Environment. A Summary of RI Envirothon Study Materials Compiled by Sally Paul
 Soils and the Environment A Summary of RI Envirothon Study Materials Compiled by Sally Paul Why Soils Food and water resources Disposing of waste Support for human structures Growing timber and fibers
Historic soils of NSW
 Historic soils of NSW This project was initiated by the NSW branch of the Australian Society of Soil Science (ASSSI) for the Sydney 2004 Supersoil conference but not completed until after the conference.