Whitehurst Freeway Deconstruction Feasibility Study
|
|
|
- Lucas Black
- 5 years ago
- Views:
Transcription


1 Whitehurst Freeway Deconstruction Feasibility Study Draft Existing Conditions Report Prepared By: For: District Department of Transportation District of Columbia October 2005
2 TABLE OF CONTENTS 1. INTRODUCTION PREVIOUS STUDIES EXISTING CONDITIONS EXISTING TRANSPORTATION FEATURES Major Roadways in the Study Area Public Transportation TRAFFIC VOLUMES SPEED AND TRAVEL TIMES ORIGIN DESTINATION PATTERNS IN THE STUDY AREA Data Collection for Origin-Destination Survey Data Processing for Origin-Destination Survey Trip Matrices and Origin-Destination Surveys findings SAFETY PARKING MODELING OF EXISTING CONDITIONS EXISTING LEVELS OF SERVICE LAND USE AND LAND VALUE OVERVIEW Purpose Organization of this Section LAND USE AND ZONING Land Use Description Land Use Regulation and Control Market Profile Recent, Current, and Planned Projects Infill and Redevelopment Potential LAND VALUATION, TAXES, AND FINANCING MECHANISMS Description of Real Estate Taxing Value Capture Financing Mechanisms Conclusion and Findings of Land Valuation and Funding Mechanisms CASE STUDY PROJECTS FROM PORTLAND, SAN FRANCISCO, AND BOSTON BACKGROUND ON THE CASE STUDIES PORTLAND S HARBOR DRIVE Project Description and Related Outcomes Land Use and Development Land Valuation Institutional and Financial Mechanisms SAN FRANCISCO S EMBARCADERO FREEWAY Project Description and Related Outcomes Land Use and Development Land Valuation Institutional and Financial Mechanisms BOSTON S CENTRAL ARTERY i Whitehurst Freeway Deconstruction Feasibility Study October 2005
3 Project Description and Related Outcomes Land Use and Development Property Valuation Institutional and Financial Mechanisms CONCLUSIONS AND FINDINGS FOR CASE STUDIES LIST OF FIGURES Figure 1-1. Study Area Figure 2-1. Georgetown Waterfront Study (1975) Study Area Figure 2-2. Whitehurst Freeway Corridor System Modification Study (1985) Figure 2-3. Report from Committee of Figure 3-1. Study Area Intersections Figure 3-2. Existing (2005) Peak Period Lane Configurations Figure 3-3. Public Transit Figure Existing Weekday Peak Hour Volumes Figure Existing Weekday Peak Hour Pedestrian Volumes Figure 3-6. Existing (2005) Peak Hour Volumes and Average Daily Traffic at Key Locations Figure 3-7. Average Annual Weekday Volumes at Potomac River Crossings Figure 3-8. Weekday Hourly Distribution of Vehi cular Trips Whitehurst Freeway3-13 Figure 3-9. Weekday Hourly Distribution of Vehicular Trips K Street Figure Weekday Hourly Distribution of Vehicular Trips M Street Figure Weekday Hourly Distribution of Vehicular Trips Whitehurst Freeway and M Street Figure Travel Speed in Study Area (AM) Figure Travel Speed in Study Area (PM) Figure License Plate Survey Locations for Origin-Destination Study Figure AM License Plate Distribution Figure PM License Plate Distribution Figure Observed Queues at Studied Intersections Figure Parking Inventory Figure 4-1. Relationship Between Land Use, Land Value, and Transportation Figure 4-2. C & O Ship Canal (1860 and 2005) Figure 4-3. Whitehurst Freeway (above), Lower K Street /Water Street Figure 4-4. Study Area Land Use Classification Figure 4-5. New Residences Adjacent to the Whitehurst Freeway Figure 4-6. Whitehurst Study Area Zoning Classification Figure 4-7. Map of Current and Planned Development Projects Figure 4-8. Harbourside Site Plan Figure 4-9. GSA West Heating Plant Site Figure Ice House Site Figure District Real Property Tax Revenue Figure Distribution of Property Values Figure 5-1. Portland s Harbor Drive (1974) Figure 5-2. Map of Portland s RiverPlace Development Area (2004) ii Whitehurst Freeway Deconstruction Feasibility Study October 2005
4 Figure 5-3. RiverPlace Area in 1998 and Figure 5-4. Embarcadero Freeway (1969) Figure 5-5. Embarcadero Area Before (1988) and After Removal (2003) Figure 5-6. San Francisco Waterfront and Embarcadero Area (2003) Figure 5-7. The Former Central Artery (I-93) Figure 5-8. Leather District loft conversion to luxury housing Figure 5-9. New England Aquarium Expansion Figure Office Conversion to Luxury Housing Figure Causeway Street Figure Property Valuation Figure Greenway MBTA Stations with Quarter-Mile Waling Radius LIST OF TABLES Table 3-1. AM Peak Period Travel Times Table 3-2. PM Peak Period Travel Times Table 3-3. Total Origin-Destination Trips During the AM Peak Hours (6:45 AM 9:15 AM) Table 3-4. Total Origin-Destination Trips During the AM Peak Hours (6:45 AM 9:15 AM) as Percentage of Exit Volumes Table 3-5. Total Origin-Destination Trips During the PM Peak Hours (3:00 PM 5:30 PM) Table 3-6. Total Origin-Destination Trips During the PM Peak Hours (3:00 PM 5:30 PM) as Percentage of Exit Volumes Table 3-7. Crash Data Table 3-8. On-Street Parking on K Street Table 3-9. CORSIM Calibration Result Table Existing AM Peak Hour Levels of Service (LOS) Table Existing PM Peak Hour Levels of Service (LOS) Table 4-1 Zoning Classification Table 4-2 Current and Planned Projects Table 4-3 Property Tax Classification and Rates Table 4-4 Total Property Valuation and Property Taxes (FY2005) Table 4-5 Top Property Values (Year 2005) Table 4-6 Retail Market Profile (2004) APPENDICES A. Traffic Count Data B. Daily Counts C. Recorded Speeds For Studied Segments In The Study Area D. Unadjusted Origin Destination Matrices From The Origin Destination Study E. Crash Data F. Description of Level Of Service and Delay iii Whitehurst Freeway Deconstruction Feasibility Study October 2005
5 1. INTRODUCTION The District Department of Transportation (DDOT) is conducting a study to determine whether or not it is feasible to remove the Whitehurst Freeway and to assess the impacts associated with its removal. This freeway is a physical barrier separating Georgetown from the waterfront. The consulting firm DMJM Harris, Inc. (Consultant) is conducting the study with assistance from DDOT staff. In this report the team of Consultant and DDOT staff is referred to as the Study Team. The purpose of the Whitehurst Freeway Deconstruction Feasibility Study is to determine whether or not it is feasible to remove the Whitehurst Freeway. The goal of the study is to evaluate the feasibility of removing the Whitehurst Freeway to provide better access to Georgetown and to the future waterfront park and to provide traffic relief to M Street NW during time periods when M Street NW operates at congested levels. The study objectives are the following: Accommodate future traffic volumes without significant deterioration in peak period traffic operations. Improve traffic operations on M Street NW during time periods when M Street NW operates at congested levels. Improve pedestrian access to Georgetown businesses and parking facilities and to the future waterfront park. Improve transit operations. Improve vehicular access to Georgetown businesses and parking facilities and to the future waterfront park. Improve urban design and visual environment by minimizing the presence of visual barriers at the waterfront. Avoid adverse effects to water resources. Minimize disruption to existing land uses. Maximize public participation to develop transportation improvements that are supported by the community. Minimize impacts on historic structures. The study area, shown in Figure 1-1, focuses on the Whitehurst Freeway and is bounded by the following roadways: Potomac River on the south extending up to Virginia Avenue and 23 rd Street on the southeast K Street on the southeast of 26 th Street Foxhall Road on the west Reservoir Road on the north, west of Wisconsin Avenue M Street on the northeast of Wisconsin Avenue 19th Street on the east 1-1 Whitehurst Freeway Deconstruction Feasibility Study October 2005
6 Thomas Jefferson St. Reservoir Rd Foxhall Rd 35 th St 34 th St Q St Q St Q St P St P St Wisconsin Ave MacArthur Blvd Canal Rd 44 th St Canal Rd Georgetown University 37 th St Prospect St NW 35 th St 34 th St 33 rd St M St 31 st St 30 th St 29 th St 28 th St Rock Creek Pkwy 26 th St 25 th St M St 24 th St 23 rd St 22 nd St 21 st St 20 th St 19 th St Francis Scott Key Bridge 29 Whitehurst Fwy Grace St South St Whitehurst Fwy K (Lower) St 4 To K (Lower) 27 th St Pennsylvania Ave I St Potomac River Virginia Ave Pkwy I St L St New Hampshire Ave M Foggy Bottom- GWU H St I St George Washington University 29 L St Farragut West M 23 rd St Legend M Subway Station Figure 1-1 Study Area N Whitehurst Freeway Deconstruction Feasibility Study October 2005 Page 1-2
7 The study is being conducted with assistance from area residents. The Study Team held meetings with area residents to discuss study issues and the potential impacts of deconstructing the Whitehurst Freeway. Area residents provided additional input via and regular correspondence. Input from residents was helpful in the identification of key transportation issues noted in this report and potential traffic impacts due to the removal of the Whitehurst Freeway. This report summarizes the assessment of existing conditions and identifies constraints that affect the potential deconstruction of Whitehurst Freeway. The existing conditions section of this report includes a description of the major roadways in the study area, origin-destination patterns, information on traffic volumes and levels of service at critical intersections. It also describes the conditions of existing pedestrian facilities, parking regulations and public transportation. This report also includes a section that summarizes information on existing land use and land values of the properties in the study area. The last section of this report presents a summary of the findings of three case studies where a freeway was deconstructed. 1-3 Whitehurst Freeway Deconstruction Feasibility Study October 2005
8 2. PREVIOUS STUDIES In the past, different studies involving the Whitehurst Freeway were undertaken by the District of Columbia Department of Transportation (DDOT) and other government agencies. Most of the studies suggested implementing modifications to the existing Whitehurst Freeway Structure. The three previous studies are: National Capital Planning Commission - Georgetown Waterfront Study (1975) Whitehurst Freeway Corridor System Modification Study (1985) The Study Conducted for Committee of 100 by Joseph Passonneau and Partners (1990) National Capital Planning Commission Georgetown Waterfront Study (1975) The goal of this study was to preserve and strengthen Georgetown as a viable community by providing a good circulation system for vehicles and pedestrians. As shown in Figure 2-1, the boundaries of the study area were M Street in the north, Potomac River in the south, Rock Creek in the east and the Georgetown University entrance in the west. This study was focused on improvements in the overall Georgetown Area. The study report suggested some improvements to vehicular circulation along the study corridor. There were no alternatives suggested to the existing Whitehurst Freeway structure. This study proposed new land uses and suggested new potential for additional growth. This study also proposed a new circulation plan for vehicles and pedestrians in the Georgetown Area. Whitehurst Freeway Corridor System Modification Study (1985) The District of Columbia Department of Public Works initiated the Whitehurst Freeway Corridor Study to develop and evaluate alternatives for modifying the transportation system in the study corridor and to assess the traffic, technical, cost and environmental impacts of the alternatives. This study included an Environmental Impact Statement (EIS) report for the selected alternative. Three ground rules were established by the District of Columbia Department of Public Works. These ground rules are: 1. The alternatives are to accommodate present travel demand while minimizing the generation of additional traffic. 2. Through traffic in adjacent residential neighborhood is to be controlled and reduced where possible. 3. A potential waterfront park along Georgetown shore must be accommodated. 2-1 Whitehurst Freeway Deconstruction Feasibility Study October 2005

9 Georgetown Waterfront Figure 2-1 N Whitehurst Freeway Deconstruction Feasibility Study October 2005 Study Area (1975) Page 2-2
10 Four alternatives were evaluated during this process. The selected alternative was a combination of rehabilitation and no build alternative in which modifications would be made to the existing structure and roadway connections as shown in Figure 2-2. The Study conducted for Committee of 100 by Joseph Passonneau and Partners (1990) The study was initiated to propose new alternatives to Whitehurst Freeway and to review the alternatives suggested in the 1985 EIS report. This study proposed three alternatives for the Whitehurst Freeway. The selected alternative included an Avenue alternative with 6- lanes at grade on K Street as shown in Figure 2-3. This alternative was rejected because it recommended the construction of a tunnel underneath the historic C & O canal. The National Park Service strongly opposed this alternative. 2-3 Whitehurst Freeway Deconstruction Feasibility Study October 2005

11 Figure 2-2 Whitehurst Freeway Corridor System Modification Study (1985) Selected Alternative A Modified N Whitehurst Freeway Deconstruction Feasibility Study October 2005 Page 2-4

12 Figure 2-3 Recommended Alternative in the Study Conducted for Committee of 100 by Joseph Passonneau & Partners N Whitehurst Freeway Deconstruction Feasibility Study October 2005 Page 2-5
13 3. EXISTING CONDITIONS 3-1. EXISTING TRANSPORTATION FEATURES The Study Team conducted an extensive data collection effort to gain an understanding of existing conditions in the study area. In addition to collecting data for the quantitative assessment of existing conditions, the Study Team conducted field evaluations throughout the study area during peak and off-peak hours to further assist in the assessment of existing conditions. This section of the report summarizes the data collected for the study MAJOR ROADWAYS IN THE STUDY AREA The study area is located in Northwest Washington, DC as is shown in Figure 1-1. The following are the major roadways in the study area: Whitehurst Freeway K Street M Street Canal Road Wisconsin Avenue While some of the studied roadways continue beyond the above terminals, their associated characteristics will only be described within these limits. Figure 3-1 shows the intersections in the study area. The existing lane configuration for the study intersections is shown in Figure Whitehurst Freeway The Whitehurst Freeway 1 is a four lane elevated roadway classified as freeway. 2 This facility runs east-west through the study area. It was built in the 1940 s to connect the Key Bridge to a citywide freeway system which was never built. There are two lanes in each direction on Whitehurst Freeway. It is a 3/4-mile long section with signals at each end; therefore, it functions more as an elevated arterial street than a freeway. No parking is allowed on the Whitehurst Freeway at any time. There is a concrete barrier in the middle throughout the length of the Whitehurst Freeway. The posted speed limit is 35 mph. There are two intersections at each end: Canal Road/M Street and Whitehurst Freeway on the west end and 27 th Street and Whitehurst Freeway/K Street on the east end. At the Canal Road/M Street and Whitehurst Freeway intersection, the left turn movement is not 1 All streets in the study area are located in the northwest quadrant of the District. Therefore, throughout this report where the NW designation is omitted, it should be understood that the street is located in the northwest quadrant of the District. 2 All roadway classifications were taken from the District of Columbia Functional Classification Map, February 5, Whitehurst Freeway Deconstruction Feasibility Study October 2005
14 Thomas Jefferson St. 40 Q St Foxhall Rd Reservoir Rd 35 th St 34 th St P St Q St Q St P St MacArthur Blvd. Canal Rd th St 42 1 Canal Rd Georgetown University 37 th St 2 Prospect St NW 3 35 th St 34 th St rd St 6 7 M St Georgetown Park Wisconsin Ave 8 31 st St th St 29 th St th St 13 Pkwy Rock Creek 26 th St 25 th St M St 24 th St 23 rd St 22 nd St st St 20 th St 19 th St Francis Scott Key Brg 29 Whitehurst Fwy Grace St South St To K (Lower) 33 Whitehurst Fwy K (Lower) St th St Pennsylvania Ave Diagonal On Ramp from NB Potomac River Fwy Whitehurst freeway Diagonal On Ramp to SB Potomac River Fwy I St Potomac River Virginia Ave Pkwy I St L St New Hampshire Ave M Foggy Bottom- GWU H St I St George Washington University L St Farragut West M 23 rd St Legend 1 Study Intersection M Subway Station Figure 3-1 Study Area Intersections N Whitehurst Freeway Deconstruction Feasibility Study October 2005 Page 3-2
15 27 th St 23 rd St Canal Road M Street PM Foxhall Rd Canal Rd AM AM PM PM Canal Rd Georgetown University Dr Canal Rd M St M St Key Bridge 34 th St M St M St 33 rd St Potomac St M St Wisconsin Ave M St 31 st St M St M St Thomas Jefferson St M Street th St M St M St 29 th St Pennsylvania Ave 28 th St Pennsylvania Ave M St 24th St 23 rd St M St M St 22 nd St New Hampshire Ave M St 21 st St M St M St 20 th St 19 th St M St L Street K Street th St L St Pennsylvania Ave 24 th St L St 23 rd St L St L St 22 nd St New Hampshire Ave 21 st St L St 20 th St L St 19 th St L St Wisconsin Ave K St 31 st St K St K St Thomas Jefferson St K Street Foxhall Rd th St K St K St 29 th St K St Potomac Pkwy 27 th St 26 th St K St K St 25 th St Pennsylvania Ave 24 th St K St K St 21 st St K St K St 20 th St 19 th St K St Foxhall Rd Reservoir Rd 41 Foxhall Rd 44 th St Foxhall Road 42 MacArthur Blvd Foxhall Rd 44 Reservoir Rd Wisconsin Ave 45 Q St Wisconsin Ave Wisconsin Ave 46 Wisconsin Ave Q St 47 Wisconsin Ave P St 48 PM PM 27 th Street 27 th St I St LEGEND 9 Intersection Number AM Movement permitted only during AM Peak Hour PM Movement permitted only during PM Peak Hour MacArthur Blvd Figure Virginia Ave 23 rd St Virginia Ave Virginia Ave 52 Virginia Ave Virginia Ave Diagonal On Ramp from NB Potomac River Fwy Diagonal On Ramp to SB Potomac River Fwy Whitehurst Fwy Key Bridge Eastbound Ramp to Whitehurst Fwy Existing (2005) AM and PM Peak Period Lane Configurations N Virginia Ave Note: Refer Figure 3-1 for location of intersection corresponding to the intersection number Whitehurst Freeway Deconstruction Feasibility Study October 2005 Page 3-3
16 allowed from westbound Canal Road to the Whitehurst Freeway. Pedestrian activity is moderate at the two intersections at each end of the Whitehurst Freeway K Street K Street is primarily a two way principal arterial 3 running east-west through the study area. In the western section of the study area from Wisconsin Avenue to 27 th Street, Lower K Street is a two lane minor arterial with two lanes with all way stops controlled intersections. Parking is allowed on both sides in sections from 30 th Street to Wisconsin Avenue. From 27 th Street to 21 st Street, K Street is a four-lane divided roadway with access and exit ramps to the Washington Circle and parking is not allowed at any time. In the eastern end of the study area, there are a total of four lanes on K Street from 21 st Street to 12 th Street with limited access one-way service roads. Parking is allowed during the off-peak hours along the right side of the K Street service roads. Service roads are provided in the north and south sides of K Street east of 21 st Street in the study area. Parking is not allowed on the main K Street roadway from 27 th Street to 19 th Street, and most left turns are prohibited during the AM and PM peak periods. Most right-turn-onred maneuvers are limited at all times from K Street and K Street service roads in the study area. Many parking garage entrances and exits are accessible from the service roads in this section. The speed limit on all sections of K Street in the study area is 25 mph Wisconsin Avenue Wisconsin Avenue is a two-way minor arterial 1 running north-south through the study area from K Street to Reservoir Road. Wisconsin Avenue has two lanes in each direction. Between K Street and M Street parking is allowed on the east side of the roadway and limited parking is available on the west side. Between M Street and Reservoir Road, parking is allowed during the off-peak periods only. The speed limit is 25 mph M Street M Street is a two-way principal arterial 1 running east-west between 28 th Street/ Pennsylvania Avenue and Canal Road/Whitehurst Freeway in the central section of the study area. M Street has three lanes in each direction with parking allowed on both sides of the roadway during off-peak hours. Most of the intersections along M Street experience heavy pedestrian volumes. Illegal parking and high loading-unloading activity often cause delays on this street. Most of the land use along M Street is commercial. Most of the intersections along M Street in the study area are signalized. The speed limit is 25 mph. 3 All roadway classifications were taken from the District of Columbia Functional Classification Map, February 5, Whitehurst Freeway Deconstruction Feasibility Study October 2005
17 Canal Road Canal Road is a two-way principal arterial running east-west. There are two lanes in each direction between Foxhall Road and the Whitehurst Freeway. An exclusive left turn lane is provided for westbound traffic at the intersection of Canal Road and Foxhall Road. The posted speed limit is 35 miles per hour (mph). In the section west of Foxhall Road, Canal Road runs as one-way inbound (eastbound) between the hours of 6:00 AM - 10:15 AM, and one-way outbound (westbound) from 2:45 PM to 7:15 PM. There are no shoulders or parking in this section of the road PUBLIC TRANSPORTATION The Washington Metropolitan Area Transit Authority (WMATA) provides extensive bus and rail service in the study area. As shown in Figure 3-3, nine WMATA routes (Routes 38B, 30, 32, 34, 35, 36, G2, L1, D5, L2, H1, N3, and N7) provide service within the study area. Other agencies providing transit service in the study area are Georgetown Metro Connection, Georgetown University Transportation Shuttle, George Washington University Transportation Shuttle and the Downtown Circulator as shown in Figure 3-3. There are two routes that use the Whitehurst Freeway; Law Center line from Georgetown University and George Washington University Shuttle WMATA As shown in Figure 3-3, nine WMATA routes (Routes 38 B, 30, 32, 34, 35, 36, G2, L1, D5, L2, H1, N3, and N7) provide service within the study area primarily along K Street, M Street and Pennsylvania Avenue. The average headway for most of the WMATA buses is 15 to 30 minutes Georgetown Metro Connection In addition, Georgetown Metro Connection, Route 1 Wisconsin Avenue Line and Route 2 M Street Line, operate along the major corridors in the study area. The average headway for these buses is 10 minutes Georgetown University Transportation Shuttle The Georgetown University Transportation Shuttle provides service to and from the university campus. Law Center Line, Arlington Line and Rosslyn Line are the three shuttle routes that serve the study area. 1 4 Routes and headways based on WMATA schedules published on March, Georgetown University Transportation Shuttle schedules published on January, Whitehurst Freeway Deconstruction Feasibility Study October 2005

 27 th St Pennsylvania Ave I St Rock Creek Pkwy Virginia Ave 26 th St Potomac River I St Fwy 25")


18 Reservoir Rd Q St Foxhall Rd P St Q St Q St P St MacArthur Blvd Canal Rd 44 th St Canal Rd Georgetown University 37 th St Prospect St NW Francis Scott Key Brg 35 th St 34 th St rd St Potomac St Whitehurst Fwy M St Georgetown Park Grace St Wisconsin Ave 31 st St South St Thomas Jefferson St Whitehurst Fwy K (Lower) St 30 th St 29 th St 28 th St To K (Lower) 27 th St Pennsylvania Ave I St Rock Creek Pkwy Virginia Ave 26 th St Potomac River I St Fwy 25 th St M St L St 24 th St New Hampshire Ave M Foggy Bottom- GWU H St 23 rd St 22 nd St I St 29 George Washington University 21 st St 20 th St L St 19 th St Farragut West M LEGEND WMATA 38 B Metro Bus Pennsylvania Avenue Line Routes 30, 32, 34, 35, 36 L1 Metro Bus D5 Metro Bus L2 Metro Bus H1 Metro Bus N3 Metro Bus D3, D6 Metro Bus Georgetown University Transportation Shuttle Law Center Line Arlington Line Rosslyn Line Dupont Circle Line Georgetown Metro Connection Route 1 Wisconsin Avenue Line Route 2 M Street Line Figure 3-3 M George Washington University Shuttle Downtown Circulator Subway Station Public Transit N Whitehurst Freeway Deconstruction Feasibility Study October 2005 Page 3-6
19 Georgetown University Transportation Shuttle The Georgetown University Transportation Shuttle provides service to and from the university campus. Law Center Line, Arlington Line and Rosslyn Line are the three shuttle routes that serve the study area George Washington University Shuttle George Washington University also provides transit service within the study area. Buses operate every 5-7 minutes from both the campuses (Foggy Bottom Campus and Mount Vermon Campus) Downtown Circulator The recently started Downtown Circulator operates in a circular manner on Wisconsin Avenue, Lower K Street, Washington Circle and Pennsylvania Avenue. The Circulator operates from 7:00 AM to 9:00 PM. The average headway between circulator buses is 5 to 10 minutes TRAFFIC VOLUMES In order to evaluate existing traffic conditions throughout the study area, the Study Team collected turning movement counts at the following intersections: 1. Foxhall Road and Canal Road 2. Canal Road and Southern Entrance to Georgetown University 3. M and Francis Scott Key Memorial Bridge 4. M and Wisconsin Avenue 5. M and 24 th Street 6. M and 23 th Street 7. L and 24 th Street 8. L and 23 th Street 9. K Street and Wisconsin Avenue 10. K Street and 31 st Street 11. K Street and 29th Street 12. K Street and 26 th Street 13. Pennsylvania Avenue and 24 th Street Additionally, the Study Team collected intersection counts at key locations throughout the study area from recent studies conducted by the District Department of Transportation. 5 Routes and headways based on WMATA schedules published on March, Georgetown University Transportation Shuttle schedules published on January, Whitehurst Freeway Deconstruction Feasibility Study October 2005
20 Counts were taken during the months of January, February and March No traffic was counted during holiday weeks or while District public schools and universities were not in session. The turning movement traffic counts on all the study intersections were treated as raw volumes. Because of existing public and private parking locations throughout the study area, there were minor discrepancies in the overall balance of traffic volumes. In order to improve the modeling of existing traffic conditions, the Study Team applied standard traffic engineering techniques to adjust the turning movement volumes at intersections where minor unjustified imbalances were found. Figure 3-4 presents the existing 2005 balanced AM and PM weekday peak hour turning movement counts at all 54 intersections (Figure 3-1 presents the location of the intersections shown in Figure 3-4). Pedestrian counts are presented in Figure 3-5 for weekdays. The pedestrian high pedestrian volumes are found along M Street, especially at the M Street and Wisconsin Avenue intersection. On the eastern side of the study area, there are also high pedestrian volumes along L Street and K Street. Appendix A presents raw vehicular and pedestrian volumes. Figure 3-6 shows the summary of traffic data for key links within the study area and the average daily traffic at key locations. As Figure 3-6 indicates, the Whitehurst Freeway carries approximately 2,000 vehicles per hour in the peak direction during the AM and PM peak hours. The Whitehurst Freeway carries 33,000 vehicles per day. M Street immediately west of Wisconsin Avenue carries approximately 1,200 vehicles per hour in the peak direction during the AM and PM peak hours and 26,000 vehicles per day. The traffic volumes on Lower K Street east of Wisconsin are approximately 300 vehicles per hour in the peak direction during the AM and PM peak hours and 13,000 vehicles per day. Figure 3-7 shows the average annual bi-directional volumes for the bridges in the vicinity of the study area. Currently, the Key Bridge is carrying 66,000 vehicles per day as compared to 100,000 vehicles per day for Theodore Roosevelt Bridge. The bridges on the Potomac River are currently operating at capacity during the peak periods. The Study Team collected automated Average Daily Traffic (ADT) counts over a oneweek period in September 2005 at the following three locations: Whitehurst Freeway ( between Key Bridge Ramp and Potomac Expressway Ramp) M Street ( East of Key Bridge and M Street intersection) K Street ( between 31 st Street and Thomas Jefferson Street) The Whitehurst Freeway carries approximately 33,000 vehicles per day during a typical weekday. As shown in Figure 3-8, on a typical weekday 40 percent of the total eastbound daily traffic traverses the Whitehurst Freeway between the hours of 7:00 AM and 10:00 AM. The average daily traffic in the eastbound direction is 13,400 vehicles. The Whitehurst Freeway carries approximately 500 vehicles per hour in the eastbound direction during the rest of the day on a typical weekday. On a typical weekday 29 percent of the total westbound daily traffic traverses the Whitehurst Freeway between the 3-8 Whitehurst Freeway Deconstruction Feasibility Study October 2005
21 Canal Road M Street (1343) Foxhall Rd Canal Rd 1290 (N/A) 1585 (1222) N/A (2236) Canal Rd 2 Canal Rd 2710 (1343) 20 (128) Georgetown University Dr. 88 (101) 1565 (3330) 3 Canal Rd 1020 (803) 1690 (540) 20 (3) 9 (48) Whitehurst Fwy 540 (2083) 8 (28) 209 (156) 10 (26) 1093 (1345) M St 4 M St 432 (115) 806 (892) Key Bridge 875 (680) 1380 (783) 228 (691) 1107 (1662) M St 1807 (842) 5 (56) 875 (811) 11 (2) 25 (16) 34 th St 28 (34) 0 (3) 432 (1511) 3 (5) M St 634 (361) 1190 (460) 9 (38) 33 rd St 32 (30) 16 (114) 4 (8) 65 (25) 406 (1401) 5 (2) M St 1140 (458) 16 (10) 39 (74) 4 (6) 31 (45) Potomac St 1 (6) 5 (20) 430 (1298) 9 (13) M St 804 (690) 358 (33) 92 (153) 312 (247) 458 (250) Wisconsin Ave 47 (46) 121 (77) 34 (45) 232 (203) 301 (943) M St 119 (105) 1098 (690) 79 (33) 13 (48) 91 (68) 61 (43) 31 st St 14 (46) 27 (77) 18 (45) 55 (40) 525 (1052) 66 (34) 10 M St 1177 (784) Thomas Jefferson St 34 (52) 142 (53) 670 (1056) 11 M St 54 (50) 1053 (810) 175 (77) 17 (38) 128 (49) 116 (76) 30 th St 51 (80) 686 (975) 96 (112) 12 M St 33 (42) 1077 (811) 39 (25) 0 (8) 0 (25) 0 (26) 29 th St 37 (50) 67 (86) 35 (45) 35 (199) 796 (1109) 67 (46) Penn. Ave 13 5 (17) 1122 (855) 0 (0) 184 (155) 28 th St 5 (8) 3 (6) 12 (10) 12 (120) 284 (617) Penn. Ave 14 M St 36 (86) 118 (120) 24 th St 77 (65) 201 (159) 119 (54) 692 (863) 160 (100) 15 M St 163 (147) 750 (746) 23rd St 947 (870) 254 (570) M Street 16 M St 22 nd St 91 (160) 742 (530) 308 (220) 1110 (1280) 17 M St 40 (86) 481 (255) New Hampshire 170 (360) Ave 68 (25) 1278 (1054) 18 3 (30) 367 (555) 21 st St 1343 (1047) 438 (364) M St 19 M St 20 th St 329 (140) 827 (640) 301 (93) 1452 (1271) (119) 712 (790) 19 th St 1593 (1245) 165 (283) M St Penn. Ave 120 (24) 1010 (508) 109 (830) 7 (26) 80 (264) 47 (176) 25 th St 6 (6) 0 (5) 2 (5) 13 (18) L St 16 (0) 75 (11) 525 (470) L St 131 (71) 864 (504) 1 (60) 121 (215) 97 (76) 24th St 237 (108) 151 (55) L St 1044 (626) 37 (31) 548 (1099) 379 (230) 23rd St 244 (189) 178 (69) 788 (625) L St 232 (126) 282 (144) 240 (48) L Street 22 nd St New Hampshire Ave 366 (342) 116 (51) 274 (0) 1098 (680) 176 (214) 614 (625) 232 (294) 21 st St L St 171 (72) 1029 (614) 20 th St 985 (555) 623 (169) L St (710) 161 (164) 452 (764) 410 (408) 19 th St L St 28 K St 22 (170) 62 (48) 0 (2) 130 (143) 43 (31) 295 (228) Wisconsin Ave 0 (63) 1 (70) 1 (7) 159 (189) 124 (106) 61 (20) K Street K St 11 (39) 301 (297) 10 (3) 80 (28) 0 (1) 30 (65) 31st St 0 (0) 3 (2) 3 (1) 77 (67) 378 (217) 11 (12) K St 36 (124) 315 (411) 0 (0) Thomas Jefferson St 182 (113) 496 (418) K Street Foxhall Rd 30 th St K St 314 (651) 8 (8) (785) 24 (28) 92 (125) 50 (2) 143 (176) Foxhall Rd MacArthur Blvd 8 (7) 7 (27) 4 (8) 0 (5) 706 (369) 23 (24) 55 (11) 44 th St 999 (834) 586 (388) K St Foxhall Road 11 (104) 284 (750) (796) MacArthur Blvd 21 (74) 3 (22) 587 (547) Foxhall Rd 29 th St 186 (41) 754 (211) 1585(1222) K St 145 (840) 142 (265) 44 To Freeway 0 (100) 0 (4) From Freeway 1398 (282) 121 (321) 649 (466) 40 (20) Reservoir Rd 27th St Wisconsin Ave 31 (26) 214 (182) 445 (132) 0 (0) 114 (24) 611 (689) 96 (139) 0 (42) 309 (1427) 327 (149) 240 (775) K St 1657 (1160) 45 Q St Wisconsin Ave 827 (573) 7 (7) 121 (68) 245 (261) 26 th St 819 (2391) 643 (843) 36 (70) K St 1124 (790) 533 (370) Wisconsin Ave (183) 833 (651) Wisconsin Ave 25 th St 12 (18) 18 (18) 140 (773) 679 (1634) 216 (384) 5 (5) Q St Penn. Ave 1101 (877) 83 (195) 11 (26) 80 (416) 17 (9) 24 th St 158 (107) 287 (114) 2 (8) 95 (58) 485 (307) K St K St 1032 (691) 16 (99) 0 (160) 628 (632) 102 (157) 317 (280) 82 (120) 21 st St 27 th Street 161 (170) 679 (1620) 0 (13) K St K St 1402 (1128) 20 th St 184 (186) 1758 (453) 375 (159) 262 (220) 878 (1541) K St 1403 (1089) 374 (212) 105 (220) 408 (785) 48 (13) 19 th St 1035 (1541) 0 (9) (108) 560 (526) 22 (16) 20 (23) 560 (195) 90 (47) Foxhall Rd 242 (108) 594 (490) 52 (87) 86 (133) 168 (434) 152 (197) Reservoir Rd Virginia Ave 58 (65) 463 (529) (58) 568 (585) Wisconsin Ave 26 (65) 324 (323) 116 (102) 85 (168) P St (269) N/A (841) 424 (274) 266 (1251) 27 th St 91 (361) I St LEGEND 9 Intersection Number Traffic Movement 403 (189) AM Peak Hour Volume (PM Peak Hour Volume) Figure (65) 424 (274) 27 th St 91 (361) 0 (669) Virginia Ave 51 Virginia Ave 10 (24) 404 (1529) 23 rd St 82 (55) 1218 (441) 37 (38) 40 (24) 17 (19) Virginia Ave 52 Virginia Ave 78 (32) 46 ( (201) 369 (1484) 35 (45) 23 rd St 71 (64) 1300 (496) Virginia Ave (603) 577 (350) 448 (740) DiagonalOnRampfrom NBPotomacRiverFwy Whitehurst freeway 327 (1477) Diagonal On Ramp to SB Potomac River Fwy 1913 (2554) 2255 (1463) 406 (413) Key Bridge Eastbound Ramp to Whitehurst Fwy Note: Refer Figure 3-1 for location of intersection corresponding to the intersection number Existing (2005) AM and PM Peak Hour Traffic Volumes Whitehurst Freeway Deconstruction Feasibility Study N October 2005 Page 3-9
22 1 0 (2) 0 (0) 3 (14) Foxhall Rd and Canal Rd 0 (0) 2 Canal Road Georgetown University Drwy and Canal Rd 8 (6) 9 (0) 0 (0) 3 6 (10) 23 (15) 0 (0) Whitehurst Fwy, M St and Canal Rd 0 (0) 4 15 (0) 0 (0) 16 (0) M St and Key Bridge 5 21 (38) 60 (110) 59 (110) 71 (134) M St and 34 th St 6 33 (62) 137 (265) 62 (120) 50 (100) M St and 33 rd St M Street 7 M St and Potomac St (265) 168 (310) 215 (407) 248 (470) 8 (98) 53 (276) 39 (515) M St and Wisconsin Ave 105 (341) 9 40 (76) 42 (79) 66 (122) 57 (109) M St and 31 st St 10 3 (2) 123 (335) M St and Thomas Jefferson St 7 (14) 11 M St and 30 th St 12 M St, 29 th St and Penn Ave 15 M St and 23 rd St 16 M St and 22 nd St M Street 17 M St and New Hampshire Ave 18 M St and 21 st St 19 M St and 20 th St 20 M St and 19 th St 21 L St, Penn Ave and 25 th St L Street 22 L St and 24 th St 20 (38) 31 (57) 26 (49) 27 (48) 19 (35) 29 (53) 17 (33) 79 (152) 115 (115) 64 (64) 64 (64) 115 (115) 136 (127) 85 (71) 94 (83) 137 (95) 100 (384) 110 (340) 94 (384) 70 (356) 226 (288) 284 (144) 264 (600) 280 (216) 236 (652) 244 (392) 272 (188) 382 (428) 420 (451) 301 (316) 255 (311) 328 (407) 111 (0) 0 (0) 113 (0) 0 (0) 512 (356) 74 (40) 172 (124) 58 (68) L Street K Street 23 L St and 23 rd St 24 L St, 22 nd St and New Hampshire Ave 25 L St and 21 st St 26 L St and 20 th St 27 L St and 19 th St 28 K (Lower) St and Wisconsin Ave 29 K (Lower) St and 31 st St 30 K (Lower) St and Thomas Jefferson St 31 K (Lower) St and 30 th St 32 K St and 29 th St 136 (264) 22 (80) 66 (68) 114 (116) 326 (248) 26 (304) 126 (592) 156 (368) 188 (220) 148 (192) 376 (244) 224 (348) 184 (424) 162 (384) 232 (344) 344 (576) 667 (576) 1070 (985) 661 (497) 1019 (1200) 48 (88) 7 (22) 21 (61) 39 (73) 66 (53) 11 (16) 25 (55) 10 (15) 66 (127) 20 (37) 106 (198) 20 (37) 31 (58) 26 (48) 27 (49) 81 (155) 1 (1) 33 K St, Whitehurst Fwy and 27 th St 34 K St and 26 th St K St 35 and 25 th St 36 K Street Penn Ave and 24 th St 37 K St and 21 st St 38 K St and 20 th St 39 K St and 19 th St 40 Foxhall Rd Foxhall Rd and Reservoir Rd 44 Wisconsin Ave and Reservoir Rd Wisconsin Ave 45 Wisconsin Ave and Q St 92 (83) 7 (31) 37 (53) 39 (30) 7 (14) 108 (118) 77 (100) 214 (180) 322 (219) 322 (486) 214 (387) 10 (10) 120 (120) 80 (80) 80 (80) 335 (290) 502 (256) 514 (207) 195 (464) 263 (750) 460 (510) 460 (402) 443 (948) 6 (7) 2 (1) 9 (5) 16 (11) 2 (10) 5 (61) 12 (68) 24 (35) 0 (0) 59 (43) 46 Wisconsin Ave and Q St 13 (24) Wisconsin Ave 47 Wisconsin Ave and P St 27 th Street th and I St 179 (113) 76 (173) 42 (76) 49 Virginia Ave 27 th and Virginia Ave rd and Virginia Ave LEGEND 9 Intersection Number 0 (2) 0 (2) 0 (8) 7 (0) 0 (4) 233 (77) 170 (136) 10 (25) AM (PM) Pedestrian Counts 0 (0) 0 (0) 0 (1) 16 (35) 179 (182) 0 (1) Figure 3-5 Existing (2005) AM and PM Peak Period Pedestrian Volumes N Whitehurst Freeway Deconstruction Feasibility Study October 2005 Page 3-10
 66.0 Francis Scott Key Bridge 35 th St (1463) (413) 2255 406 34 th St 49.")
 St Lower K St Thomas Jefferson St. 496 (418) 13.")
 32.")
 577 (350) Whitehurst Fwy 327 (1477) Diagonal On Ramp to SB Potomac River Expressway 23 rd St LEGEND Intersection 123 (456) 22.")
23 Reservoir Rd 19.0 Foxhall Rd 35 th St 34 th St Q St Q St Q St (842) P St P St MacArthur Blvd Canal Rd 22.3 (813) 0 (2236) (0) 44 th St 44.4 Canal Rd Georgetown University 37 th St 2710 Prospect St NW (2554) 66.0 Francis Scott Key Bridge 35 th St (1463) (413) th St rd St Whitehurst Fwy 25.7 Grace St Wisconsin Ave 439(1311) 1176(644) 1002 (2267) 2096 (953) 33.0 M St South St 31 st St Whitehurst Fwy K (Lower) St Lower K St Thomas Jefferson St. 496 (418) (535) 30 th St 448 (740) 29 th St 833 (625) 1149 (878) 28 th St To K (Lower) Diagonal On Ramp from NB Potomac River Expressway 27 th St Rock Creek Pkwy Pennsylvania Ave I St th St Potomac River Virginia Ave I St 25 th St 819 (2391) (1160) M St L St 24 th St New Hampshire Ave 971 H St 23 rd St (1017) 22 nd St I St George Washington University 21 st St th St 19 th St L St 1140(1761) 1777(1301) 1519 (603) 577 (350) Whitehurst Fwy 327 (1477) Diagonal On Ramp to SB Potomac River Expressway 23 rd St LEGEND Intersection 123 (456) 22.0 Flow of Traffic AM (PM) Volume Counts Average Annual Weekday Bi-Directional Volumes Expressed in thousands (Year 2002) 13.0 Average Annual Weekday Bi-Directional Volumes Expressed in thousands (Year 2005) Figure 3-6 Existing (2005) Peak Hour Volumes and ADT at Key Locations N Whitehurst Freeway Deconstruction Feasibility Study October 2005 Page 3-11
24 66, , ,000 Key Bridge Theodore Roosevelt Bridge Memorial Bridge Potomac River 14 th St. Bridge 73,000 LEGEND - Permanent Traffic Count Location 20,000 - Average Annual Weekday Volumes (Year 2002) Source - website Figure 3-7 Average Annual Weekday Volume N Whitehurst Freeway Deconstruction Feasibility Study October 2005 Page 3-12
25 Figure 3-8. Weekday Hourly Distribution of Vehi cular Trips Whitehurst Freeway Whitehurst Freeway Eastbound Volume vs Time of Day 2500 Volume (vehicles per hour) Sun Mon Tues Wed Thurs Fri Sat 0 0:00 2:00 4:00 6:00 8:00 10:00 12:00 14:00 16:00 18:00 20:00 22:00 Time of Day Whitehurst Freeway Westbound Volume vs Time of Day 2500 Volume (vehicles per hour) Sun Mon Tues Wed Thurs Fri Sat 0 0:00 2:00 4:00 6:00 8:00 10:00 12:00 14:00 16:00 18:00 20:00 22:00 Time of Day 3-13 Whitehurst Freeway Deconstruction Feasibility Study October 2005
26 hours of 4:00 PM and 7:00 PM. The average daily traffic in the westbound direction is 19,400 vehicles. As Figure 3-8 indicates, traffic volumes on the Whitehurst Freeway are low during the weekends. The daily traffic volume on K Street east of Wisconsin Avenue on a typical weekday is 13,000 vehicles, and on M Street east of the Key Bridge the daily traffic volume is 49,800 vehicles. As shown in Figure 3-9, K Street carries less than 600 vehicles per hour during any time of the day due to the lack of connection to Canal Road from K Street. The pattern of utilization of this street, however, is different from the pattern of the Whitehurst Freeway. The street has relatively constant utilization throughout the day. M Street east of the Key Bridge carries approximately 1,800 vehicles in the eastbound direction during the AM peak hour and 2,300 vehicles in the westbound direction during the PM peak hour. On a daily basis, M Street carries 20,500 vehicles in the eastbound direction and 29,200 vehicles in the westbound direction. During off-peak hours, M Street carries significantly high volumes, as shown in Figure The utilization pattern of M Street is different from the utilization pattern of the Whitehurst Freeway. M Street is more evenly utilized throughout the day. As Figure 3-11 indicates, during off peak hours when M Street is congested due to high volumes, the Whitehurst Freeway carries relatively low volumes in both directions. The detailed daily counts are provided in Appendix B SPEED AND TRAVEL TIMES In order to gain an understanding of driving patterns and to gather information needed in the development of the traffic model for the study area, the Study Team collected information on speed and travel times on key corridors. The Study Team collected the data on travel times and delay on March 1 to March 3, Study Team data collectors drove the Whitehurst Freeway, M Street and Lower K Street several times in each direction during both the AM and PM peak hours, and recorded the elapsed travel times at predetermined travel points and the distance between the selected travel points. For the travel time runs, the data collectors were instructed to drive at the same speed as most of the vehicles traversing the study area. Thus, in some sections of the critical corridors, the data collectors traveled at speeds above the speed limit. The Study Team calculated average speed for each roadway segment as well as an overall average speed for the corridor using the data collected on travel times and distances between time points. Table 3-1 and Table 3-2 present travel time for the key routes in the study area. Figures 3-12 and 3-13 present travel speeds for the key corridors segments for AM and PM peak hours, respectively Whitehurst Freeway Deconstruction Feasibility Study October 2005
27 Figure 3-9. Weekday Hourly Distribution of Vehicular Trips K Street K Street Eastbound Volume vs Time of Day Volume (vehicles per hour) Sun Mon Tues Wed Thurs Fri Sat 0 0:00 2:00 4:00 6:00 8:00 10:00 12:00 14:00 16:00 18:00 20:00 22:00 Time of Day K Street Westbound Volume vs Time of Day Volume (vehicles per hour) Sun Mon Tues Wed Thurs Fri Sat 0 0:00 2:00 4:00 6:00 8:00 10:00 12:00 14:00 16:00 18:00 20:00 22:00 Time of Day 3-15 Whitehurst Freeway Deconstruction Feasibility Study October 2005
28 Figure Weekday Hourly Distribution of Vehicular Trips M Street M Street Eastbound Volume vs Time of Day Volume (vehicles per hour) Sun Mon Tues Wed Thurs Fri Sat 0 0:00 2:00 4:00 6:00 8:00 10:00 12:00 14:00 16:00 18:00 20:00 22:00 Time of Day M Street Westbound Volume vs Time of Day Volume (vehicles per hour) Sun Mon Tues Wed Thurs Fri Sat 0 0:00 2:00 4:00 6:00 8:00 10:00 12:00 14:00 16:00 18:00 20:00 22:00 Time of Day 3-16 Whitehurst Freeway Deconstruction Feasibility Study October 2005
29 Figure Weekday Hourly Distribution of Vehicular Trips Whitehurst Freeway and M Street Whitehurst Fwy and M Street - Eastbound Volume vs Time of Day 2500 Volume (vehicles per hour) WFWY_WKND AVG WFWY_WKDY AVG WFWY_FRI M ST_WKND AVG M ST_WKDY AVG M ST_FRI 0 0:00 2:00 4:00 6:00 8:00 10:00 12:00 14:00 16:00 18:00 20:00 22:00 Time of Day Whitehurst Fwy and M Street - Westbound Volume vs Time of Day 2500 WFWY_WKND AVG Volume (vehicles per hour) WFWY_WKDY AVG WFWY_FRI M ST_WKND AVG M ST_WKDY AVG M ST_FRI 0 0:00 2:00 4:00 6:00 8:00 10:00 12:00 14:00 16:00 18:00 20:00 22:00 Time of Day 3-17 Whitehurst Freeway Deconstruction Feasibility Study October 2005
30 Roadway and Direction M Street Table 3-1. AM Peak Period Travel Times Segment Foxhall and Canal Road Washington Circle and New Hampshire Avenue Eastbound Westbound (min:sec) (min:sec) 9:01 10:09 Whitehurst Freeway Foxhall and Canal Road K Street and 19 th Street 7:55 5:07 Lower K Street Wisconsin Avenue K Street and 27 th Street 2:45 1:34 Appendix C presents a list of recorded speeds for all analyzed segments within the study area. Roadway M Street Table 3-2. PM Peak Period Travel Times Eastbound Westbound Segment (min:sec) (min:sec) Foxhall and Canal Road Washington Circle and New 14:34 17:43 Hampshire Avenue Whitehurst Freeway Foxhall and Canal Road K Street and 19 th Street 7:31 15:27 Lower K Street Wisconsin Avenue K Street and 27 th Street 4:00 1:50 Appendix C presents a list of recorded speeds for all analyzed segments within the study area. The main findings of the travel time survey for AM and PM peak periods are: Speeds on the eastbound Whitehurst Freeway during the AM peak hours are greater than 20 mph near the Key Bridge but are reduced significantly as vehicles approach the traffic signal at 27 th Street. Vehicles on Canal Road east of Foxhall Road travel at speeds greater than 20 mph during the AM peak period. Travel speeds on M Street during the AM peak period are greater than the speeds during the PM peak period. During the PM peak period, the average speed of westbound Whitehurst Freeway traffic is less than 10 mph. Westbound vehicles travel at speeds greater than 20 mph on westbound Canal Road west of the Whitehurst Freeway during the PM peak period. The average travel speed for eastbound traffic (off-peak direction) on the Whitehurst Freeway and K Street during the PM peak period is below 20 mph on these two roadways. Vehicles travel at slow speeds in the eastbound and westbound direction on M Street during the PM peak period ORIGIN DESTINATION PATTERNS IN THE STUDY AREA In order to gain an understanding of existing traffic patterns in the study area, the Study Team conducted a comprehensive assessment of origins and destinations for vehicles entering and exiting the study area during the AM and PM peak period. The origindestination survey helped identify the travel patterns of all vehicles entering the study area during the peak hours Whitehurst Freeway Deconstruction Feasibility Study October 2005
31 Reservoir Rd Foxhall Rd 35 th St 34 th St Q St Q St Q St P St P St Canal Rd MacArthur Blvd 44 th St Georgetown University Canal Rd 37 th St Prospect St NW 35 th St 34 th St rd St Whitehurst Fwy Grace St Wisconsin Ave M St South St 31 st St Thomas Jefferson St. 30 th St 29 th St 28 th St Rock Creek Pkwy 26 th St Pennsylvania Ave 25 th St M St L St 24 th St 23 rd St 22 nd St 21 st St 20 th St L St 19 th St To K (Lower) 29 K (Lower) St Francis Scott Key Bridge Lower K St Whitehurst Fwy 27 th St I St Potomac River Virginia Ave I St New Hampshire Ave H St I St George Washington University 23 rd St LEGEND Intersection Speed in miles per hour > 20 Figure 3-12 Existing (2005) Travel Speeds for AM Peak Period N Whitehurst Freeway Deconstruction Feasibility Study October 2005 Page 3-19
32 Reservoir Rd Foxhall Rd 35 th St 34 th St Q St Q St Q St P St P St Canal Rd MacArthur Blvd 44 th St Georgetown University Canal Rd 37 th St Prospect St NW 35 th St 34 th St 33 rd St Wisconsin Ave M St 31 st St 30 th St 29 th St 28 th St Rock Creek Pkwy 26 th St 25 th St M St 24 th St 23 rd St 22 nd St 21 st St 20 th St 19 th St 29 Whitehurst Fwy Grace St South St Thomas Jefferson St. Pennsylvania Ave L St L St To K (Lower) 29 Francis Scott Key Bridge Lower K St K (Lower) St Whitehurst Fwy 27 th St Potomac River I St I St Virginia Ave Fwy New Hampshire Ave H St I St George Washington University 23 rd St LEGEND Intersection Speed in miles per hour > 20 Figure 3-13 Existing (2005) Travel Speeds for PM Peak Period N Whitehurst Freeway Deconstruction Feasibility Study October 2005 Page 3-20
33 DATA COLLECTION FOR ORIGIN-DESTINATION SURVEY The data collection effort for the origin-destination survey encompassed the following tasks: 1. Recording vehicle license plates at all major entry and exit points for the Whitehurst Freeway: survey personnel (surveyors) recorded license plate data, state and number, onto tape recorders at the locations shown in Figure 3-14 on February 15, Recording of missed vehicles: if a surveyor could not get the license plate of a vehicle, he/she was instructed to note the vehicle as a missed to have control totals that could be used for the expansion of the survey data. 3. Transcription of license plate records: surveyors entered the state and license plate data for each location onto a computerized database DATA PROCESSING FOR ORIGIN-DESTINATION SURVEY Study Team staff used the license plate database to match entering and exiting vehicles. The Study Team made the assumptions in the database matching process that missed vehicles would have the same travel patterns as vehicles for which origin-destination matches were found. In the first step of the license plate matching process, the Study Team developed a raw origin-destination trip matrix based on exiting license plates that matched entering license plates. This raw origin-destination matrix excluded unmatched vehicles and missed vehicles. In the second step, the Study Team used the data to determine a total origindestination trip matrix for all the vehicles entering and exiting the study area TRIP MATRICES AND ORIGIN-DESTINATION SURVEYS FINDINGS Tables 3-3 and 3-4 present the results of the vehicle matching for the study area during the AM peak hour. The matrix of origins and destinations shown in Table 3-3 are the totals for all vehicles and include adjustments to account for unmatched and missed vehicles (the unadjusted raw origin-destination matrices are included in Appendix D). The main findings of the origin-destination survey results for the AM peak period are: 31 percent of the eastbound traffic enters the Whitehurst Freeway from the Key Bridge. 30 percent of vehicles destined to eastbound K Street enter the Whitehurst Freeway via the ramp from the Key Bridge. 37 percent of the eastbound traffic that enters the Whitehurst Freeway from Canal Road is destined to the southbound Potomac Expressway. Only 13 percent of the eastbound traffic that enters the Whitehurst Freeway from the Key Bridge is destined to the southbound Potomac Expressway. 83 percent of the eastbound traffic that enters the Whitehurst Freeway from the Key Bridge is destined to points east on K Street Whitehurst Freeway Deconstruction Feasibility Study October 2005
34 33 rd St 31 st St 30 th St Francis Scott Key Bridge Whitehurst Fwy M St Whitehurst Fwy K (Lower) St Pennsylvania Ave 27 th St 35 th St 34 th St Wisconsin Ave 29 th St 28 th St Rock Creek Pkwy Canal Rd A B 29 Georgetown Park Grace St South St Thomas Jefferson St. F E To K (Lower) C D 26 th St I St Potomac River Virginia Ave Figure 3-14 License Plate Survey Locations for Origin-Destination Study N LEGEND F License Plate Survey Location- Inbound and outbound during AM and PM peak periods Whitehurst Freeway Deconstruction Feasibility Study October 2005 Page 3-22
35 Table 3-3 Total Origin and Destination Trips During AM Peak Hour Destination Origin Location Eastbound Whitehurst Freeway to Eastbound K- Street Eastbound Whitehurst Freeway to Southbound 27th Street Eastbound Whitehurst Freeway Diagonal Off Ramp going towards Southbound Potomac Expressway Westbound Westbound Whitehurst Freeway Whitehurst Freeway to Westbound Canal to Eastbound Canal Road Road Total D (OUT) C (OUT) F (OUT) A (OUT) A (OUT) A (IN) Eastbound Canal Road going towards Whitehurst Freeway B (IN) Northbound Key Bridge On Ramp to Eastbound Whitehurst Freeway D (IN) Westbound K-Street towards Westbound Whitehurst Freeway E (IN) Northbound Potomac Expressway Diagonal On Ramp to Westbound Whitehurst Freeway Total Note: 1. The trips shown on this table include adjustments to the raw matching data to account for license plates that were not adequately documented in the data collection process and license plates that were not adequately matched in the database matching process. Whitehurst Freeway Deconstruction Feasibility Study 3-23 October 2005
36 Table 3-4 Origin and Destination Trips During AM Peak Period As Percentage of Exit Volumes Destination Origin Location Eastbound Whitehurst Freeway to Eastbound K- Street Eastbound Whitehurst Freeway to Southbound 27th Street Eastbound Whitehurst Freeway Diagonal Off Ramp going towards Southbound Potomac Expressway Westbound Westbound Whitehurst Freeway Whitehurst Freeway to Westbound Canal to Eastbound Canal Road Road D (OUT) C (OUT) F (OUT) A (OUT) A (OUT) A (IN) Eastbound Canal Road going towards Whitehurst Freeway 70% 73% 90% B (IN) Northbound Key Bridge On Ramp to Eastbound Whitehurst Freeway 30% 27% 10% D (IN) Westbound K-Street towards Westbound Whitehurst Freeway 26% 57% E (IN) Northbound Potomac Expressway Diagonal On Ramp to Westbound Whitehurst Freeway 74% 43% Total 100% 100% 100% 100% 100% Whitehurst Freeway Deconstruction Feasibility Study 3-24 October 2005
37 Only three percent of the eastbound vehicles entering the Whitehurst Freeway from Canal Road are destined to southbound 27 th Street. Only four percent of the eastbound vehicles entering the Whitehurst Freeway from the Key Bridge are destined to southbound 27 th Street. As shown in Figure 3-15, a majority of eastbound vehicles entering the Whitehurst Freeway from Canal Road have Maryland license plates. 12 percent of the traffic entering from Canal Road have DC license plates. Tables 3-5 and 3-6 present the results of the vehicle matching for the study area during the PM peak hour. The matrix of origins and destinations shown in Table 3-5 includes the adjustments to account for unmatched and missed vehicles 1. The main findings of the origin-destination survey results for the PM peak period are: 79 percent of the traffic that enters the Whitehurst Freeway from westbound K Street exits to westbound Canal Road. 92 percent of the traffic that enters the Whitehurst Freeway from northbound Potomac Expressway exits to westbound Canal Road. Only 16 percent of the westbound exiting traffic is destined to eastbound Canal Road (most of these vehicles are destined to the Key Bridge). 48 percent of the eastbound traffic enters from the Key Bridge. 46 percent of the eastbound traffic that enters from the Key Bridge is destined to points west on K Street. 40 percent of the eastbound traffic that enters from the Key Bridge is destined to southbound 27 th Street. 63 percent of all westbound trips entered the Whitehurst Freeway from westbound K Street. As shown in Figure 3-16, Maryland license plates were the most prevalent on the Whitehurst Freeway during the PM peak period. 61 percent of vehicles exiting the study area via westbound Canal Road had Maryland license plates SAFETY In order to assess safety conditions in the study area, the Study Team obtained crash data from DDOT for major intersections in the study area, for the years 2000 to Based on the information summarized in Table 3-7, there were a total of 218 reported crashes in the study area involving 56 injuries. More than 80 percent of the reported crashes and injuries occurred on M Street. There were six head on collisions in the study area, four occurred on M Street itself. The high number of crashes on M Street can be attributed in part to the high volume of traffic, parking and loading activity, and the high pedestrian activity. As the information in Table 3-7 indicates, the intersection of M Street and Wisconsin Avenue experienced the highest number of crashes in the study area, with 147 during the four analyzed years. Side-swiped and rear end were the most common types of crashes at 3-25 Whitehurst Freeway Deconstruction Feasibility Study October 2005
38 Figure 3-15 AM License Plate Distribution (Other) N Whitehurst Freeway Deconstruction Feasibility Study October 2005 Page 3-26
39 Table 3-5 Origin and Destination Trips During PM Peak Hour Destination Origin Location Eastbound Whitehurst Freeway to Eastbound K- Street Eastbound Whitehurst Freeway to Southbound 27th Street Eastbound Whitehurst Freeway Diagonal Off Ramp going towards Southbound Potomac Expressway Westbound Westbound Whitehurst Freeway Whitehurst Freeway to Westbound Canal to Eastbound Canal Road Road Total D (OUT) C (OUT) F (OUT) A (OUT) A (OUT) A (IN) Eastbound Canal Road going towards Whitehurst Freeway B (IN) Northbound Key Bridge On Ramp to Eastbound Whitehurst Freeway D (IN) Westbound K-Street towards Westbound Whitehurst Freeway C (IN) Northbound Rock Creek Parkway going towards westbound Whitehurst Freeway E (IN) Northbound Potomac Expressway Diagonal On Ramp to Westbound Whitehurst Freeway Total Note: 1. The trips shown on this table include adjustments to the raw matching data to account for license plates that were not adequately documented in the data collection process and license plates that were not adequately matched in the database matching process. Whitehurst Freeway Deconstruction Feasibility Study 3-27 October 2005
40 Table 3-6 Origin and Destination Trips During PM Peak Period As Percentage of Exit Volumes Destination Origin Location Eastbound Whitehurst Freeway to Eastbound K- Street Eastbound Whitehurst Freeway to Southbound 27th Street Eastbound Whitehurst Freeway Diagonal Off Ramp going towards Southbound Potomac Expressway Westbound Westbound Whitehurst Freeway Whitehurst Freeway to Westbound Canal to Eastbound Canal Road Road D (OUT) C (OUT) F (OUT) A (OUT) A (OUT) A (IN) Eastbound Canal Road going towards Whitehurst Freeway 42% 38% 78% B (IN) Northbound Key Bridge On Ramp to Eastbound Whitehurst Freeway 58% 62% 22% D (IN) Westbound K-Street towards Westbound Whitehurst Freeway 60% 82% C (IN) Northbound Rock Creek Parkway going towards westbound Whitehurst Freeway 6% 4% E (IN) Northbound Potomac Expressway Diagonal On Ramp to Westbound Whitehurst Freeway 34% 14% Total 100% 100% 100% 100% 100% Whitehurst Freeway Deconstruction Feasibility Study 3-28 October 2005
41 Figure 3-16 PM License Plate Distribution (Other) N Whitehurst Freeway Deconstruction Feasibility Study October 2005 Page 3-29
42 Table 3-7 Summary of Crash Data Intersection Total Number of Crash Types Crashes (Injuries) ( ) Wisconsin Avenue 147 (28) Right - 8 and Left - 6 M Street Right Turn - 6 Rear End - 38 Side Swiped - 57 Head On - 4 Parked - 12 Fixed - 2 Pedestrian - 5 Other - 1 Key Bridge 34 (10) Right - 1 and Left - 3 M Street Right Turn - 2 ** Rear End - 14 Side Swiped - 9 Fixed - 1 Pedestrian - 2 Other - 2 Whitehurst Freeway 28 (11) Right - 2 and Left - 1 K Street / 27th Street Right Turn - 1 Rear End - 11 Side Swiped - 6 Head On - 2 Fixed - 2 Ran Off Road - 1 Non Collision - 1 Other - 1 Whitehurst Freeway 9 (7) Rear End - 2 and Side Swiped - 4 Canal Road Ran Off Road - 1 Fixed - 2 ** Includes the accidents occurred at the intersection of Northbound Key Bridge and Whitehurst Freeway ramp. Complete DDOT Accident Summary Reports can be found in Appendix E Whitehurst Freeway Deconstruction Feasibility Study 3-30 October 2005
43 this intersection. The number of head-on collisions was four at this intersection. The crashes due to parked vehicles in the roadway are twelve. No parking is allowed during the AM and PM peak period along M Street. The high number of crashes at this intersection indicates that infrastructural enhancements may be needed to improve the safety of traffic operations. Measures to reduce the number of vehicles that traverse M Street would help improve safety of traffic operations at this intersection. Thirty four crashes were reported at the intersection of the Key Bridge and M Street, with 14 rear end and nine side-swiped crashes. The crash data at this intersection also includes the crashes occurring at the intersection of the Key Bridge and the Whitehurst Freeway on ramp. Most of the crashes occurred at this location are due to a sharp northbound right turn in the middle of the Key Bridge going towards eastbound Whitehurst Freeway 6. This location is dangerous for pedestrians traversing the Key Bridge on the sidewalk on the east side of the bridge; as drivers hesitate to stop in the middle of the bridge to yield to pedestrians. Twenty-eight crashes were reported at the Whitehurst Freeway and 27 th Street intersection, with rear end and sideswipes as the most common types. Two head-on collisions were also reported at the Whitehurst Freeway and 27 th Street intersection. Because of complicated geometry, this intersection is susceptible to crashes. Nine crashes were reported at the Whitehurst Freeway and Canal Road intersection. Sideswipe was the most common type of crash at this intersection. Pedestrian crashes occurred at the intersections of Wisconsin Avenue and M Street, and Key Bridge and M Street. Based on pedestrian observations and counts, a relatively high number of pedestrians use these intersections. While no pedestrian crashes were reported at the other critical intersections in the study area, pedestrian safety issues were observed at some of these intersections. The primary issue observed was right-turning vehicles not yielding to pedestrians 7. Detailed crash data is presented in Appendix E QUEUES AT CRITICAL INTERSECTIONS The Study Team collected information on existing queues the number of vehicles lined up at an intersection during the red phase of a traffic signal at critical intersections in the study area. This information was needed to adequately develop a computerized simulation model of existing traffic conditions. The Study Team observed AM and PM peak hour queues for each of the approaches of all the critical intersections inside the study area. The Study Team calculated the maximum queues for all of the approaches. Figure 3-17 summarizes the observed maximum queues for all the critical intersections. The longest queues observed during the AM peak hours were at the following locations: Eastbound Canal Road at Foxhall Road 7 A motorcycle driver was killed recently (Summer 2005) as a result of a crash at the intersection of the Key Bridge and the on-ramp to the Whitehurst Freeway Whitehurst Freeway Deconstruction Feasibility Study October 2005
44 1 Q St Foxhall Rd NB SB EB WB NB SB EB WB Reservoir Rd 35 th St 34 th St P St Q St 6 Q St P St NB SB EB WB N/A NB SB EB WB N/A NB SB EB WB NB SB EB WB NB SB EB WB NB SB EB WB N/A NB SB EB WB N/A MacArthur Boulevard Canal Rd 44 th St 2 Canal Rd NB SB EB WB N/A NB SB EB WB N/A 3 N/A 2 Georgetown University 37 th St NB SB EB WB NB SB EB WB Prospect St NW 3 Francis Scott Key Brg 35 th St 4 34 th St 5 29 NB SB EB WB 25 N/A 16 7 NB SB EB WB 3 N/A rd St M St Whitehurst Fwy Georgetown Park Grace St NB SB EB WB NB SB EB WB Wisconsin Ave 7 31 st St South St Thomas Jefferson Street Whitehurst Fwy K (Lower) St NB SB EB-1 WB NB SB EB WB th St NB SB EB WB K St EB-2 8 WB 5 29 th St 4 28 th St To K (Lower) 27 th St Pennsylvania Ave 8 Potomac River I St Virginia Ave 26 th St Pkwy I St 25 th St M St L St 24 th St New Hampshire Ave 9 Foggy Bottom- GWU H St 23 rd St 22 nd St I St George Washington University 21 st St th St L St 19 th St Farragut West Pennsylvania Ave 23 rd St Rock Creek Parkway Legend Figure NB SB WB EB N/A Study Intersection AM Peak Maximum Queue (no. of vehicles) PM Peak Maximum Queue (no. of vehicles) Northbound Southbound Westbound Eastbound Not Applicable Queues at Critical Intersections N Whitehurst Freeway Deconstruction Feasibility Study October 2005 Page 3-32
45 Northbound Key Bridge at Canal Road Southbound 34 th Street at M Street Southbound Wisconsin Avenue at M Street Eastbound Whitehurst Freeway/K Street at 27 th Street As shown in Figure 3-17, queues during the PM peak hours are longer than the queues observed during the AM peak period. During the PM peak period, the longest queues on M Street and the Whitehurst Freeway are in the westbound direction. The longest queues observed during the PM peak hours were at the following locations: Westbound Whitehurst Freeway at Canal Road Eastbound Canal Road at Key Bridge Westbound M Street at 34 th Street Southbound 34 th Street at M Street Westbound M Street at Wisconsin Avenue Southbound Wisconsin Avenue at M Street Westbound K Street at 27 th Street The Study Team used the queuing information to develop the existing conditions traffic model. The queues of the traffic simulations were compared with the observed queues. Where the Study Team found significant discrepancies between modeled conditions and observed conditions, the input data used to set up the model was thoroughly examined to eliminate the possibility of errors in the development of the model. After errors were ruled out, discrepancies were reconciled by making adjustments to the traffic model parameters so the model more accurately replicates observed traffic conditions PARKING The study team performed an inventory of parking facilities in Georgetown and collected information on parking restrictions on M Street and K Street. As shown in Figure 3-18, there are a significant number of parking facilities between M Street and K Street. Parking restrictions on M Street are different from the parking restrictions on K Street. On M Street, two hour parking is allowed on both the sides of the street during off peak hours. However no parking is allowed on either side of the street between 7:00 AM and 9:30 AM and from 4:00 PM until 6:30 PM. Parking utilization is very high on M Street during off peak hours. During peak hours, parking on side streets that intersect M Street is allowed. Most streets in the north-south direction between M Street and K Street have one hour on-street parking. As shown in Table 3-8, on street parking restrictions on K Street vary significantly. There are 229 on-street parking spaces available on the section of K Street between 30 th Street and the Key Bridge (western terminus of K Street/Water Street) Whitehurst Freeway Deconstruction Feasibility Study October 2005
46 Canal Road 35 th St 34 th St rd St M St Georgetown Park Wisconsin Ave st St th St th St 28 th St Rock Creek Parkway 26 th St Grace St 154 Pennsylvania Ave Francis Scott Key Brg 180 Whitehurst Fwy South St Whitehurst Fwy K (Lower) St 291 To K (Lower) 405 Wisconsin Ave 31 st St 27 th St Thomas Jefferson St 30 th St Virginia Ave I St K (Lower) St Legend Figure Number of Parking Spaces in Garage Removal of Parking Spaces due to proposed Waterfront Park Metered Parking During Off Peak Hours No Parking Metered Parking All Day Parking Inventory N Whitehurst Freeway Deconstruction Feasibility Study October 2005 Page 3-34
47 Table 3-8. On-Street Parking on K Street From To Parking Spaces Parking Restriction 34 th Street Key Bridge Back-In Two-Hour Meters Reserved Parking for Government Vehicles 33 rd Street 34 th Street Parallel Metered with Three-Hour Limit Back-In Three-Hour Meters Potomac 33 rd Street 18 Parallel Metered with Two-Hour Limit Street Cecil Place Potomac Street 7 26 Parallel Metered with Two-Hour Limit Back-In Two-Hour Meters Wisconsin Avenue Cecil Place 6 32 Parallel Metered with Two-Hour Limit Back-In Two-Hour Meters 31 st Street Wisconsin 25 Parallel Metered with Two-Hour Limit Avenue Thomas 31 st Street 15 Parallel Metered with Two-Hour Limit Jefferson Street 30 th Street Thomas Jefferson Street 5 Off-Peak Only Parallel Metered with Two- Hour Limit 3-8. MODELING OF EXISTING CONDITIONS Simulation modeling is used in transportation engineering as an analysis tool to assess existing conditions and evaluate future alternatives over a specific period of time. The computerized transportation model attempts to simulate the traffic conditions along the described roadway links coded into the model. The model parameters can be used to evaluate each intersection, link and the entire study area. For this feasibility study, the Study Team developed simulation models for the existing AM and PM peak hours in CORSIM. CORSIM is a stochastic microscopic simulation program capable of modeling individual vehicle interactions on complex roadway networks. CORSIM uses inputs such as lane assignments and geometries, intersection turning movement volumes, vehicle speeds, percentages of vehicles by type, and pre-timed and/or actuated signal timing to produce output that contains measures of effectiveness commonly used in the traffic engineering profession, including total delay, stopped delay, and queue lengths. The CORSIM models used in this study cover all roadway segments in the study area. The base existing AM and PM peak hour models were completed in CORSIM and calibrated to field data. The Study Team used the information on corridor travel speeds and queues to develop the existing conditions models. The existing peak hour CORSIM models were simulated five consecutive times with randomly selected seed values. Calibration tables were completed comparing the results 3-35 Whitehurst Freeway Deconstruction Feasibility Study October 2005
48 from the existing CORSIM simulation models to the existing travel times. As Table 3-9 shows, the existing conditions peak models adequately replicate the travel speeds observed in the field EXISTING LEVELS OF SERVICE The Consultant used the COSRIM traffic modeling/analysis program to evaluate existing traffic conditions in the study area. For the evaluation, the Consultant entered existing traffic volumes, lane configurations, pedestrian volumes and signal timings into CORSIM to develop a base case, existing conditions model. SYNCHRO was used to assist in the development of a model that accurately replicates signal timings for all study area intersections. The Consultant used the CORSIM software results to calculate levels of service (LOS) and the delay per vehicle for the intersections in the study area. The LOS evaluation uses a six-letter grade scale (A to F) to rank the overall traffic handling ability of an intersection or a network based on delay per vehicle. LOS A indicates excellent traffic operations with minimal delays. LOS F represents failing conditions with long delays. Levels of service E and F are generally considered undesirable. Appendix F provides a description of the different levels of service and their associated delays for both signalized and unsignalized intersections. As shown in Table 3-10, during the AM peak hour, several intersections in the study area are operating at level of service (LOS) E or worse. The intersections operating at LOS E or worse during the AM peak hour are: M Street and 34 th Street L Street and 20 th Street Pennsylvania Avenue and 24 th Street K Street and 20 th Street Foxhall Road and Reservoir Road Wisconsin Avenue and Reservoir Road Wisconsin Avenue and Q Street As Table 3-10 indicates, the other studied intersections in the study area are operating at LOS D or better during the AM peak hour. As shown in Table 3-11, during the PM peak hour, several intersections in the study area are operating at level of service (LOS) E or worse. The intersections operating at LOS E or worse during the PM peak hour are: Canal Road/ M Street and Whitehurst Freeway M Street and Key Bridge M Street and 34 th Street 3-36 Whitehurst Freeway Deconstruction Feasibility Study October 2005
49 M Street and 33 rd Street M Street and Potomac Street M Street and Wisconsin Avenue M Street and 31 st Street M Street and Thomas Jefferson Street K Street and Wisconsin Avenue K Street and 27 th Street Foxhall Road and Reservoir Road As Table 3-11 indicates, the other studied intersections in the study area are operating at LOS D or better during the PM peak hour Whitehurst Freeway Deconstruction Feasibility Study October 2005
50 Eastbound Street Name Whitehurst Freeway M Street Lower K Street From Intersection of Foxhall Rd & Canal Rd Intersection of Foxhall Rd & Canal Rd Wisconsin Avenue Table 3-9 Calibration Results for AM and PM Peak Hour Models AM Peak Hour To Intersection of K St & 19th St Intersection of New Hampshire Washington Circle Intersection of 27th & K St Actual Average Model Model - Actual % difference Travel Time in Sec. Travel Time in Sec Westbound Street Name From To Whitehurst Freeway M Street Lower K Street Intersection of K St & Intersection of Foxhall 19th St Rd & Canal Rd Intersection of New Hampshire Avenue & Intersection of Foxhall M St Rd & Canal Rd Intersection of 27th & K St Wisconsin Avenue Actual Average Model Model - Actual % difference Travel Time in Sec Travel Time in Sec Eastbound Street Name Whitehurst Freeway M Street Lower K Street From Intersection of Foxhall Rd & Canal Rd Intersection of Foxhall Rd & Canal Rd Wisconsin Avenue To Intersection of K St & 19th St Intersection of New Hampshire Washington Circle Intersection of 27th & K St PM Peak Hour Actual Average Model Model - Actual % difference Travel Time in Sec. Travel Time in Sec Westbound Street Name From To Whitehurst Freeway M Street Lower K Street Intersection of K St & Intersection of Foxhall 19th St Rd & Canal Rd Intersection of New Hampshire Avenue & Intersection of Foxhall M St Rd & Canal Rd Intersection of 27th & K St Wisconsin Avenue Actual Average Model Model - Actual % difference Travel Time in Sec Travel Time in Sec Whitehurst Freeway Deconstruction Feasibility Study 3-38 October 2005
51 Table 3-10 Existing Level Of Service - AM Peak Hour No Intersection Delay 1 Sec/Veh 1 Foxhall Road and Canal Road 12.9 B 2 Canal Road and Georgetown Univ. Dr. 0.4 A 3 Canal Road, Whitehurst Freeway and M St 19.5 B 4 M St and Key Bridge 31.1 C 5 M St and 34th St 80.9 F 6 M St and 33rd St 17.8 B 7 M St and Potomac St 7.1 A 8 M St and Wisconsin Avenue 27.2 C 9 M St and 31st St 8.0 A 10 M St and Thomas Jefferson St 9.8 A 11 M St and 30th St 9.7 A 12 M St, 29th St and Penn Ave 4.3 A 13 Pennsylvania Avenue and 28th St 7.7 A 14 M St and 24th St 15.2 B 15 M St and 23rd St 8.6 A 16 M St and 22nd St 8.7 A 17 M St and New Hampshire Ave 15.9 B 18 M St and 21st St 12.7 B 19 M St and 20th St 15.3 B 20 M St and 19th St 14.4 B 21 L St and 25th St and Penn. Ave B 22 L St and 24th St 13.8 B 23 L St and 23rd St 9.9 A 24 L St and 22nd St 26.6 C 25 L St and 21st St 10.3 B LOS 2 Whitehurst Freeway Deconstruction Feasibility Study 3-39 October 2005
52 Table 3-10 (Continued) Existing Level Of Service - AM Peak Hour No Intersection Delay 1 Sec/Veh 26 L St and 20th St 70.7 E 27 L St and 19th St 19.5 B 28 K St and Wisconsin Avenue 24.4 C (STOP Controlled) 29 K St and 31st St 6.9 A (STOP Controlled) 30 K St and Thomas Jefferson St 16.1 C (STOP Controlled) 31 K St and 30th St 8.2 A (STOP Controlled) 32 K St and 29th St 0.4 A (STOP Controlled) 33 K St / Whitehurst Freeway and 27th St 31.0 C 35 K St and 25th St 6.4 A 36 Pennsylvania Ave and 24th St 69.8 E 37 K St and 21st St 9.7 A 38 K St and 20th St 68.7 E 39 K St and 19th St 24.8 C 40 Foxhall Road and Reservoir Road 67.1 E 41 Foxhall Road and 44th Street 15.1 B 42 Foxhall Road and MacArthur Road 13.9 B 44 Wisconsin Avenue and Reservoir Road 50.8 F (STOP Controlled) 45 Wisconsin Avenue and Q Street (WB leg) F 46 Wisconsin Avenue and Q Street (EB leg) 29.5 C 47 Wisconsin Avenue and P Street 6.9 A 48 27th Street / I Street and Virginia Avenue 33.4 C 51 Virginia Avenue and 23rd Street ( NB leg) 7.6 A 52 Virginia Avenue and 23rd Street (SB leg) 9.2 A LOS 2 Note: 1. The values reported in the table are the average of 5 runs. 2. LOS is calculated based on the Highway Capacity Manual (HCM) 2000 methodology. Whitehurst Freeway Deconstruction Feasibility Study 3-40 October 2005
53 Table 3-11 Existing Level Of Service - PM Peak Hour No Intersection Delay 1 Sec/Veh LOS 2 1 Foxhall Road and Canal Road 24.6 C 2 Canal Road and Georgetown Univ. Dr. 1.8 A 3 Canal Road, Whitehurst Freeway and M St 99.4 F 4 M St and Key Bridge F 5 M St and 34th St F 6 M St and 33rd St F 7 M St and Potomac St F 8 M St and Wisconsin Avenue F 9 M St and 31st St F 10 M St and Thomas Jefferson St 69.4 E 11 M St and 30th St 51.5 D 12 M St, 29th St and Penn Ave 38.9 D 13 Pennsylvania Avenue and 28th St 19.2 B 14 M St and 24th St 17.3 B 15 M St and 23rd St 16.5 B 16 M St and 22nd St 15.0 B 17 M St and New Hampshire Ave 9.7 A 18 M St and 21st St 9.8 A 19 M St and 20th St 19.9 B 20 M St and 19th St 18.2 B 21 L St and 25th St and Pennsylvania. Ave B 22 L St and 24th St 37.6 D 23 L St and 23rd St 13.5 B 24 L St and 22nd St 25.1 C 25 L St and 21st St 25.3 C Whitehurst Freeway Deconstruction Feasibility Study 3-41 October 2005
54 Table 3-11 (Continued) Existing Level Of Service - PM Peak Hour No Intersection Delay 1 Sec/Veh LOS 2 26 L St and 20th St 16.4 B 27 L St and 19th St 16.9 B 28 K St and Wisconsin Avenue 58.1 F (STOP Controlled) 29 K St and 31st St 28.2 D (STOP Controlled) 30 K St and Thomas Jefferson St 11.5 B (STOP Controlled) 31 K St and 30th St 4.6 A (STOP Controlled) 32 K St and 29th St 0.8 A (STOP Controlled) 33 K St / Whitehurst Freeway and 27th St F 35 K St and 25th St 64.1 E 36 Penn Ave and 24th St 88.0 F 37 K St and 21st St 23.9 C 38 K St and 20th St 20.3 C 39 K St and 19th St 15.0 B 40 Foxhall Road and Reservoir Road 87.4 F 41 Foxhall Road and 44th Street 10.1 B 42 Foxhall Road and MacArthur Road 4.6 A 44 Wisconsin Avenue and Reservoir Road 1.5 A (STOP Controlled) 45 Wisconsin Avenue and Q Street (WB leg) 15.6 B 46 Wisconsin Avenue and Q Street (EB leg) 14.6 B 47 Wisconsin Avenue and P Street 10.2 B 48 27th Street / I Street and Virginia Avenue 40.8 D 51 Virginia Avenue and 23rd Street ( NB leg) 9.5 A 52 Virginia Avenue and 23rd Street (SB leg) 5.8 A Note: 1. The values reported in the table are the average of 5 runs. 2. LOS is calculated based on the Highway Capacity Manual (HCM) 2000 methodology. Whitehurst Freeway Deconstruction Feasibility Study 3-42 October 2005
55 4. LAND USE AND LAND VALUE 4 1. OVERVIEW Along with the engineering and traffic issues associated with the potential removal of the Whitehurst Freeway, the Whitehurst Freeway study is examining the economic development, land use, and land value impacts which could be expected if the Freeway were removed. The study area for purposes of economic development, land use, and land values is approximately 205 acres in size (including four acres which comprise the C&O Canal). The land use study area is irregularly shaped and is bounded by the Potomac River on the south; Foxhall Road and Canal Road on the west; M Street on the north; and 24 th Street on the east PURPOSE This section of the Existing Conditions Report outlines the current land use, zoning, and property value conditions in the study area. Fully understanding these conditions is important because they provide the baseline for evaluating the development and finance implications of the various Whitehurst Freeway alternatives. In particular: 1. Economic Development. One reason to consider modifying the Whitehurst Freeway is to promote high quality, high value, pedestrian friendly development between the Potomac River and M Street. The study must therefore evaluate the potential for additional development, compared to that which has already occurred or is in the near term pipeline. 2. Value Capture. One strategy for funding public improvements is to use the projected induced growth in property values or tax revenue increment to help pay for the improvement in question. This strategy is known as value capture. To estimate the potential growth that might occur with or without the Whitehurst Freeway, the study must first determine the current levels of assessed valuation and local tax revenues, as well as the current trend. The interplay among land use, transportation, and land value conditions is illustrated in Figure Whitehurst Freeway Deconstruction Feasibility Study October 2005

56 Figure 4 1. Relationship Between Land Use, Land Value, and Transportation ORGANIZATION OF THIS SECTION The remainder of this section is comprised of two subsections: a narrative description of land use and zoning conditions in the study area an evaluation of land valuation and tax revenues in the study area, and the potential applicability of tax increment financing mechanisms LAND USE AND ZONING This subsection identifies existing land use and zoning conditions in the study area. Existing land use information was developed through site visits, interviews, examination of recent aerial photographs, and other secondary sources of information LAND USE DESCRIPTION The community of Georgetown predates the District of Columbia. Georgetown's founding and evolution are historically oriented to the Potomac River. The area was settled in 1703, platted in 1751, and incorporated in The town flourished as a tobacco port until silting of the Potomac River early in the 19th Century caused a decline in port activity. Construction commenced of the Chesapeake and Ohio (C&O) Canal in The C&O Canal, shown in Figure 4 2, maintained an association with the river through barge traffic up until the end of the 19th century, when railroads began to steadily replace canal shipping. Today, residential and commercial 4 2 Whitehurst Freeway Deconstruction Feasibility Study October 2005
 Source: C & O Canal At Georgetown by Paul McGehee Source: DMJM Harris, 2005 The Whitehurst Freeway was built in 1948, above what is known as Lower K Street.")

57 developments that preserve the character of historic buildings have been built abutting the canal, and a national bicycle and pedestrian path runs along its edge. Figure 4 2. C & O Ship Canal (1860 and 2005) Source: C & O Canal At Georgetown by Paul McGehee Source: DMJM Harris, 2005 The Whitehurst Freeway was built in 1948, above what is known as Lower K Street. The Freeway and Lower K Street thus share the same 70 foot right of way. The Whitehurst Freeway, shown in Figure 4 3, visually separates the majority of the study area from the waterfront. South of the K Street, along the riverfront, most land was privately owned until the 1960 s, when it was acquired for a larger freeway that was never built. 1 Proposals for housing, retail and commercial projects were later advanced, including the large scale Washington Harbour development, which was built in the mid 1980 s. In 1985, a proposal was accepted to dedicate the remainder of the Georgetown shoreline (from 31 st Street to the Key Bridge) as a waterfront park. Twenty years later, in 2006, these plans will come to fruition when the National Park Service begins construction of the Georgetown Waterfront Park. Land on the north side of the Whitehurst Freeway/K Street corridor is privately owned for the most part. The principal exception, aside from streets and sidewalks, is the C&O Canal and its towpath. The area between M Street and the corridor consists predominantly of moderate density development in small to medium scale structures. The existing land use pattern is a diverse mixture of commercial, residential, institutional, and recreational uses. These uses are not evenly distributed across the study area, but tend to occur in clusters of varying size, each characterized by one or two dominant use types. 1 Although the freeway was not built, asphalt was actually laid along the shoreline. 4 3 Whitehurst Freeway Deconstruction Feasibility Study October 2005

58 Figure 4 3. Whitehurst Freeway (above), Lower K Street /Water Street A vibrant commercial main street with shops, restaurants, and entertainment venues is located along M Street. As shown in Figure 4 4, the general land use pattern between M Street and the C&O Canal is one of commercial use and low density. As one descends the hill from the C&O Canal to K Street, the densities and scales diversify, as small and mid scale residential properties, including traditional row houses, mixed with larger scale commercial development. At the middle section of the study area, where the Whitehurst Freeway, Rock Creek Parkway, the Potomac River Freeway, and the local street system converge, much of the land remains vacant. At the eastern end of the study area within the Foggy Bottom neighborhood much of the land use is comprised of higher density residential housing, hotels, commercial/office uses, and part of the George Washington University campus. Rapid changes in land use have occurred throughout the study area in recent years, with intense development activity occurring south of M Street. This has included rehabilitation and new infill construction within five to ten feet of the Whitehurst freeway, as shown in Figure 4 5 In addition to the extensive historic building stock, the key land use features of the study area include: Parks Rock Creek Park, the Georgetown Canal Trail, C&O Canal, Francis Scott Key Park and the Capital Crescent Trail. 4 4 Whitehurst Freeway Deconstruction Feasibility Study October 2005


59 Figure 4 4. Study Area Land Use Classification Source: District Planning GIS, March Note: The map reflects general land use conditions in the study area. As such, planned unit developments (PUDs) such as the Washington Harbour complex may have density that is greater than that reflected in the generalized land use classification. Figure 4 5. New Residences Adjacent to the Whitehurst Freeway 4 5 Whitehurst Freeway Deconstruction Feasibility Study October 2005
60 Harbor Parking This large, rectangular surface lot of 450 parking stalls has its entrance at Wisconsin Avenue and extends west along Lower K Street to the Key Bridge. This undeveloped land, site of the future Georgetown Waterfront Park, is owned by the National Park Service. Washington Harbour a large multi use complex including restaurants, offices, shops and residential uses, located on the riverfront, south of the Whitehurst Freeway/K Street corridor and east of Wisconsin Avenue. The Ritz Carlton complex a mixed use development including hotel, retail, residential, and cinema components. Jefferson Court (1025 Thomas Jefferson Street) an 8 story, 300,000 square foot, office building. The building houses the Georgetown BID, Urban Land Institute, and professional services. Waterfront Center (1622 Wisconsin Avenue) a large, terraced office building. The building houses US News & World Report, the AD Agency, the non profit organization The Waterfront Center, and professional services. Cady s Alley (also known as Design Center West) a 120,000 square foot retail and residential historic redevelopment located on M Street, between 33 rd and 34 th Street, NW. Thompson s Boathouse located southeast on the small peninsula created by the confluence of Rock Creek and the Potomac River LAND USE REGULATION AND CONTROL With respect to planning controls and policies, as reflected in the zoning map displayed in Figure 4 6, most of the land in the study area is zoned for low to medium density mixed residential and commercial uses. Lands zoned for high density, mixed residential and commercial uses, have the highest valuation and are concentrated in the portion of the study area between 30 th and 31 st Streets, south of the C&0 Canal. In general, the blocks south of M Street are zoned as W 1, W 2, and W 3 (mixed use waterfront categories of ascending density). Zoning at the far eastern end of the study area is primarily GOV (Government Use) along Rock Creek Park, R 5 B, R 5 D, R 5 E (medium, moderate, and high density residential), and CR (mixed residential, retail, offices and light industrial) east of Rock Creek Park. A concentration of land zoned C 2 C (commercial business center, high density) is located along M Street in the north Foggy Bottom neighborhood. 4 6 Whitehurst Freeway Deconstruction Feasibility Study October 2005

61 Figure 4 6. Whitehurst Study Area Zoning Classification Source: District Planning GIS, March Notes: The existing zoning map does not show the most current update in land uses. For example, the new Georgetown Waterfront Park that is planned is not shown because ownership of the parcels was recently transferred from the District to National Park Service. The zoning map has not been updated by the District of Columbia. Note also, that federal and district land owners are exempt from applicable zoning regulations, and land uses can also be permitted through conditional use permits and other mechanisms. Table 4 1 presents descriptions of the zoning classifications shown in Figure 4 6 The study area s rich history is reflected in the Georgetown Historic District, the first such district established in Washington, DC, and one of the first in the nation. The Historic District, which includes the study area, is roughly bounded by Reservoir Road, NW, and Dumbarton Oaks Park on the north; Rock Creek Park on the east; the Potomac River on the south; and Glover Archbold Parkway on the west. Listed on the National Register of Historic Places in 1967, the nomination for the Georgetown Historic District was updated in Permission to build, remodel, demolish, or subdivide must be sought from the Permit Processing Center of the D.C. Department of Consumer and Regulatory Affairs (DCRA). The DCRA cannot issue a permit until it receives confirmation of project design approval from the D.C. Historic Preservation Review Board (HPRB) and from the U.S. Commission of Fine Arts (CFA). 4 7 Whitehurst Freeway Deconstruction Feasibility Study October 2005
62 Table 4 1: Zoning Classification Zoning Classification Code Acres Remarks Community Business Center Low Moderate density C 2 A 8 Non residential max FAR 1.5 Community Business Center High density C 2 C 12 Non residential FAR is 2.0 Mixed Residential, retail, offices and Light Industrial Uses CR 6 Residential recreation space is required Government GOV 26 Row Dwellings & Flats R % lot occupancy for church and public school use Moderate Density Apartments Houses R 5 B 10 Medium High Density Apartments Houses R 5 D 3 High Density Apartments Houses R 5 E max FAR for apartment houses and hotels River RIVER 0 Medium Density Residential/Limited Office SP max FAR for residential Low Density Mixed Residential Commercial W 1 42 Non residential FAR limited to 1.0 Medium Density Mixed Residential Commercial W 2 26 Non residential FAR limited to 2.0 High Density Mixed Residential Commercial W 3 11 Non residential FAR limited to 5.0 Source: District of Columbia, Office of Zoning, 2005 Note: FAR refers to the floor area ratio, that is the building s gross floor area divided by the net lot area. The new Georgetown Waterfront Park that is planned is not indicated in the zoning classification. The CFA has jurisdiction over projects visible from public space including from streets, sidewalks, parks, and public alleys. Work that is not visible from public space is reviewed only by HPRB. The CFA delegates primary review of Georgetown projects to its Old Georgetown Board (OGB), and the Commission makes a final determination after having received the OGB recommendation. A D.C. Historic Preservation Office (HPO) staff member typically provides comment on projects at the monthly OGB hearing and then approves permits after the CFA has done so. The OGB and HPRB obtain the input from Georgetown property owners and neighbors through the Citizens Association of Georgetown (CAG) and the Georgetown Advisory Neighborhood Commission (ANC). In the eastern section of the study area within historic Squares 1, 4, and 5 1, there are several National Register eligible historic or archaeological sites that date to both prehistoric and historic times. The primary sites are: The GSA s West Heat Plant, located at 29 th and K Streets, is considered to be a contributing property to the Georgetown Historic District. The historic Peter House site, located southeast of the Whitehurst Freeway/27th Street intersection, between 27th Street and the Potomac Freeway. The Cammack and Decker Lime Works, located between the Rock Creek Parkway and 27th Street, south of the overhead eastbound ramp connecting the Whitehurst Freeway to the southbound Potomac Freeway. 1 Source: Kennedy Center Environmental Assessment, Chapter 3, Affected Environment (2004). 4 8 Whitehurst Freeway Deconstruction Feasibility Study October 2005
63 The Hayman Brewery/Arlington Bottling Company site is located just northeast of the Whitehurst Freeway/27th Street intersection. In the remaining study area, there are several historic sites with some listed in the National Register of Historic Places. 1 These sites are: Dodge Warehouses (3205 K Street) are Federal era warehouses on the waterfront and date from 1813 to 1824, built on foundations of earlier stone warehouses. Joseph Carlton House ( Potomac Street) was built in 1794 for Georgetown s first postmaster. Brickyard Hill House a historic landmark was built in 1800 and was owned by Georgetown s first mayor. It is located on the site of the Ritz Carlton Hotel complex. Buildings that are listed on the National Register of Historic Places are: Grace Protestant Episcopal Church (1041 Wisconsin Avenue NW, D.C.). Vigilant Firehouse (1066 Wisconsin Avenue NW, D.C.) was built in 1844 and is the oldest remaining firehouse in the District of Columbia. Potomac Masonic Lodge No. 5 (1212 Wisconsin Avenue NW, D.C.). Bomford Mill (3261 K Street NW, D.C.) built on the site of 1832 flour mill and used as a cotton mill during the Civil War period. Old Stone House (3051 M Street NW, D.C.) was built in 1765 and is the oldest remaining home in Georgetown. Forest Marbury House (3350 M Street NW, D.C.). Georgetown Market (3276 M Street NW, D.C.). City Tavern (3206 M Street NW, D.C.). Chesapeake and Ohio National Historic Park MARKET PROFILE Washington, DC is in the midst of a development boom unparalleled in the city s history. As of 2004 over $29 billion worth of development projects had recently been completed, were under construction, were planned to begin construction, or had been proposed as potential development projects in the District. 2 Projects are being built in every ward of the District and in every market sector. While the rest of the nation s cities are facing office vacancy rates approaching 20 percent, the District's commercial office market, which accounts for more than 60 percent District Marketing Center, Development Center annual report (2005). 4 9 Whitehurst Freeway Deconstruction Feasibility Study October 2005
64 of real property tax collections, had a vacancy rate of 5.6 percent in the fourth quarter of For the second year in a row, the Association of Foreign Investors in Real Estate (AFIRE) ranked the District as the best city for commercial real estate investment for 2004 in the nation. 1 On the residential side, the District has also maintained a strong demand for high quality property. This high level of demand has contributed to double digit growth rates in annual assessments and has prompted a significant level of new residential construction, rehabilitation and renovations. The housing produced downtown, in much of Northwest D.C., and in Capitol Hill consists primarily of market rate, unsubsidized units and is likely to be new construction, adding to the supply of high end housing and demonstrating increasing interest in city living among middle and upper income households." 2 Overall, the District sustains a very strong real estate market. Emerging Trends in Real Estate (2005), an annual report produced by Lend Lease Real Estate Investments and PricewaterhouseCoopers, ranked D.C. as the top market in the U.S. for the third consecutive year. Washington is positioned to retain its edge over many other real estate markets in the nation. The Study Team contacted developers, real estate brokers, and the DC Assessor s Office for their perspective on the market in the District and the Georgetown study area market. 3 A number of market observers point out that some key fundamentals affecting the District's real estate markets remain strong. While it may not be prudent to assume that the very high rates of growth in prices and the value of transactions experienced over the past three years can be sustained for long, there is considerable uncertainty about how much of a slowdown will occur and when it will take place. A sharp increase in interest rates would contribute to such a slowdown, and other factors such as slow growth in employment and income could adversely affect the markets as well. 4 A summary of pertinent market trends is as follows: 5 Washington, D.C., southern California, and New York are the best metro areas for investment. Other regional markets languish. For the third consecutive year, the District is the country s number one real estate market for investment, development, supply/demand balance, and homebuilding. Baby boomers continue to influence market trends as they shy away from 1 Association of Foreign Investors in Real Estate (AFIRE), September/October Fannie Mae Foundation, Housing in the Nation's Capital (2003). 3 Interviews that were conducted by Mark Gander, DMJM Harris, in February 2005 include: Eastbanc Inc., Trammel Crow Company; and the District Assessor s Office. 4 District Marketing Center, March District Marketing Center, March 2005; Pricewaterhousecoopers Market Trends, Whitehurst Freeway Deconstruction Feasibility Study October 2005
65 suburban perimeters and look toward vibrant urban areas with amenities, highquality urban design and infrastructure, good schools, and shopping and retail within walking distance of home. The trend towards more mixed use town center and compact developments, infill residential, and condominium conversions, loft rehabs, townhouses, and adaptive use projects will continue. Based on the Study Team s discussions with local developers and brokers, the study area mixes office, retail and residential uses in a very efficient manner. This mixed use pattern is reinforced by geography. The absence of a Metro stop has limited Georgetown s ability to attract high density office development. So do the stringent building height restrictions and development review that give Georgetown quainter environment than the neighboring West End and Central Business District submarkets. Several brokers indicated that most sites are small by conventional development standards; to achieve higher lease rates and sale prices, developers turn to high end retail, hotel, and residential uses, with signature quality and premium amenities. 1 That said, Georgetown has 2.69 million square feet of office space three percent of the District s office market with over half located in the study area. Lease rates for premium class A office space within the study area average between $32 to $39 per square foot, only slightly lower than comparable space located in nearby Golden Triangle neighborhood (served by a Metro station). Georgetown offers a rich, historical character that encourages innovative, high quality design. According to real estate brokers, the high lease rates in the study area are the product of the overall quality of retail offerings in the area. Demand over the past year has remained fairly constant, with a steady net absorption of approximately 24,000 square feet per quarter. The direct vacancy rate of 2.0 percent is the lowest in the entire Metropolitan Area. Inventory has remained essentially unchanged for the past decade as space constraints impeded large scale office development. 2 The bulk of available space in the study area is in Class B buildings, and comprises relatively small spaces. Average full service asking rates for Class B space remain around $32 per square. In 2004, several large tenants renewed or expanded in the submarket. Among them were the law firms of Foley Lardner and Collier Shannon, both anchor tenants in Washington Harbour. Other significant office tenants in Georgetown include the law firms of Swidler Berlin and Kattin Muchin Zavis, as well as U.S. News & World Report and Georgetown University. 3 1 The preceding discussion is drawn from discussion with the Trammel Crow Company, February However, the new Class A Harbourside development broke ground in late 2004, adjoining Washington Harbour on Lower K Street; see discussion below. 3 DC Marketing Center, March 2005; Trammel Crow Companies, March Whitehurst Freeway Deconstruction Feasibility Study October 2005
66 Overall, Georgetown and the study area can expect to remain among the most stable office submarkets in the Metropolitan Area. The disciplined development and improving economy and job market should keep vacancy rates low until the delivery of new space. Georgetown has a strong ability to attract and retain tenants who enjoy the retail amenities and easy accessibility that will add to the submarket s long term stability. A summary of study area market trends is as follows: The area will continue as a vibrant and active place seven days a week. Georgetown will continue to remain a prime retail and high end residential location, and a magnet for boutique and specialty retailers. Under current conditions, development activity in the general study area will be limited and most real estate markets and sectors will remain stable. The reason is the limited supply of developable land: most of the recently available quality sites have been developed in the past three to five years or are now under construction (see below). The same is true with respect to converting developed land to higher or more intense use RECENT, CURRENT, AND PLANNED PROJECTS This sub section describes some of the larger development projects in or adjacent to the study area that are recently completed, currently under construction, or planned for the near future. The location, scale and timing of these projects has an important bearing on the interplay between traffic, land use and associated land values that will be analyzed in the Future Conditions Report of the Whitehurst Freeway Deconstruction Feasibility Study. Commercial, residential and recreational development projects that have been completed or are currently under construction are summarized in Table 4 2. The location of these developments is presented in Figure 4 7. The Kennedy Center and Waterview Complex projects, while not directly in the study area, are in adjacent locations with significant transportation and development implications for the study area. A summary of these six projects is as follows: Kennedy Center The Federal Highway Administration, in partnership with the John F. Kennedy Center for the Performing Arts, the District of Columbia Department of Transportation, the National Park Service, the National Capital Planning Commission, and the Commission of Fine Arts, is proposing to improve access to the Kennedy Center. The proposed action would include both transportation and urban design improvements Whitehurst Freeway Deconstruction Feasibility Study October 2005

67 Table 4 2: Current and Planned Projects Project Description Total Sq. Ft. Major Use Hotel Rooms Office Sq. Ft. Residential Units Status Performing 1 Kennedy Center n/a Arts Center Planned Georgetown 2 Waterfront Park 1,500,000 Park Planned 3 Four Seasons Hotel 120,000 Hotel Under Construction/ renovation Harbourside South Building / Under 4 House of Sweden 69,000 Office 0 40,500 0 Construction Harbourside North Building / Under 5 Coal & Ash site 166,000 Office 0 132, Construction 6 Waterview Complex 1,300,000 Office/ mixed , Source: Washington, DC Marketing Center (March 2005) Figure 4 7. Map of Current and Planned Development Projects Under Construction 4 13 Whitehurst Freeway Deconstruction Feasibility Study October 2005
68 The goals of the project are to: Enhance vehicular access by remedying conditions that can create congestion and delay. Of particular concern is the connection between Rock Creek Parkway and the Potomac River Freeway and the intersections of both of these roads with Ohio Drive. Establish linkages between the Kennedy Center and the city, including Georgetown, the National Mall, the Foggy Bottom neighborhood, and President s Park. Improve the setting of the Kennedy Center as a national monument, particularly its connection to the riverfront. Enhance the aesthetic quality of the Foggy Bottom neighborhood. The Kennedy Center Draft Environmental Assessment was completed in 2004, and a final environmental impact determination is pending. The Kennedy Center improvements would provide better pedestrian and bicycle trail connectivity to the Thompson Boathouse and the Georgetown Waterfront Park. Georgetown Waterfront Park A new National Park Service park has been planned along the riverfront for many years. Construction was scheduled to begin in The 19 acre park is bounded by the Potomac River and Lower K/Water Street, from the Francis Scott Key Bridge to 31st Street. The park is intended to be passive in nature, and its design would complement the varied edge of the waterfront between Washington Harbor and the Key Bridge. Four Seasons Hotel This luxury hotel is located at the mouth of Georgetown at 2800 Pennsylvania Avenue, NW, backing up against Rock Creek Park and the C&O Canal. A major renovation and expansion that started in August 2004 is scheduled for completion in Harbourside South: House of Sweden Two projects, known as Harbourside South and North, are being developed immediately east of the Washington Harbour complex, between 30 th Street and Rock Creek. The site plan is shown in Figure 4 8.The Swedish National Property Board is constructing a new five story mixed use office and residential project to be named "House of Sweden". It is located on the waterfront between Washington Harbour and Thompson s Boat House Whitehurst Freeway Deconstruction Feasibility Study October 2005

69 Figure 4 8. Harbourside Site Plan The Embassy of Sweden will be the principal tenant, occupying approximately 40,000 square feet in the 69,000 square foot building. Occupancy is anticipated by June Harbourside North: Coal and Ash Site This six story building began construction in 2004, with occupancy anticipated in spring The development will feature over 130,000 square feet of office space on the first five floors, luxury residential units on the top floor, and underground parking. The building is located north of the House of Sweden, with pedestrian walkways and gardens between the two buildings (see the site plan, Figure 4 8). Harbourside will demolish the existing Coal and Ash House, remediate any hazardous waste conditions on site, and create and maintain a public park connecting the Capital Crescent Trail with the Georgetown Waterfront Park. With this project, the Georgetown Waterfront Park will have a pedestrian link to the C&O Canal National Historic Park and the east side of Rock Creek. Waterview Complex The Waterview Complex is located on the Virginia side of the Potomac River, on 4 15 Whitehurst Freeway Deconstruction Feasibility Study October 2005
70 a 2.2 acre site at 1 9 th and North Lynn Streets in Rosslyn, adjacent to Potomac Tower. Waterview is a large (1.3 million gross square foot) mixed use project, containing: a 600,000 square foot, 24 story office building; a 220 room luxury hotel; and 60 condominium apartments in two towers atop a four story podium (plus an additional three layers below ground). The podium will house enclosed parking, 7,500 square feet of retail, and a variety of public spaces. In addition to these current or planned projects, there are several recently completed commercial and residential projects in the study area. A review of these projects provides important information about existing land use dynamics and their relationship with traffic and land values. These recent projects are summarized as follows: The Ritz Carlton Hotel & Residences, Loews Cineplex Theater (2003) Millennium Georgetown Development LLC, in association with local developer Eastbanc, has redeveloped 2.1 acres of property along K Street, including a 17 story brick smokestack that has been a Georgetown landmark since The main project components are a 450 space public parking garage, 100,000 square feet of condominium apartments, a 125 room hotel, a 2,200 seat 14 screen multitheater art cinema and 75,000 square feet of retail space. The site occupies the entire square bounded by Wisconsin Avenue to the west, the K Street to the south, 31st Street to the east, and South Street to the north Water Street (2004) Known as the PEPCO Condominium Project, this project, developed by the Eastbanc Company, includes 72 luxury residential condominiums along the Potomac River and the C&O Canal INFILL AND REDEVELOPMENT POTENTIAL Based on the Study Team s discussion with developers and real estate brokers knowledgeable of the study area, the infill and redevelopment potential is limited under current conditions. Some of the recently available supply of infill and redevelopment sites has been, or will soon be developed. Other potential development sites could become apparent based on the outcome of transportation designs that consider a potential deconstruction of the Whitehurst Freeway. The following two additional sites should be noted: GSA West Heating Plant Building (1948) 4 16 Whitehurst Freeway Deconstruction Feasibility Study October 2005

71 The five acre, six story West Heating Plant, shown in Figure 4 9, is located at th Street, just north of the Whitehurst Freeway westbound on ramp near the eastern end of the study area. The original boilers in the West Heating Plant have been modified and augmented over the years. Today the long term use of the facility is uncertain due to the completion of a new GSA office building complex and facilities located two miles east that would supply heat to federal buildings. The West Heating Plant is not listed within the D.C. Inventory of Historic Sites as an Individual Landmark, but it is located within the Georgetown Historic District. Figure 4 9. GSA West Heating Plant Site Ice House Building (1937) This building, shown in Figure 4 10, is located near the western end of the study area, at 3401 Lower K Street with the C&O Canal at the rear. This commercial structure, dating only to 1937, is occupied by numerous short term, five year lessees, including a light manufacturer, exercise gym, and office/storage space used by the GSA (Figure 4 9). Acquisition of the building and its demolition is proposed by the National Park Service in its Waterfront Park Plan (1987). The site could accommodate public destination type development which complements the Waterfront Park LAND VALUATION, TAXES, AND FINANCING MECHANISMS The Study Team collected data on real property assessment values and associated property taxes in the study area to establish a base frame of reference for current conditions and trends. This sub section describes the District s current tax increment 4 17 Whitehurst Freeway Deconstruction Feasibility Study October 2005

72 financing mechanism and its potential applicability to the improvements associated with any future Whitehurst Freeway modifications. Figure Ice House Site DESCRIPTION OF REAL ESTATE TAXING The District of Columbia, like many other local jurisdictions throughout the United States, taxes real property based on 100 percent of its assessed valuation. The real property tax is the second largest source of tax receipts for the District government, accounting for 22.4 percent of its total local source General Fund revenues in fiscal year The District's real property tax system differs from that of other jurisdictions in two ways. First, the District's system divides properties into three tax classes, depending on the use of the real property. As shown in Table 4 3, 1 each class is taxed at a different rate. And second, the District has an extraordinarily large proportion of real property that is exempt from paying the District's real property tax roughly 38 percent by total assessed value. Tax exempt properties primarily include those owned by the federal government, foreign governments, non profit organizations, educational institutions, the District government itself, and other locally tax exempt entities. As shown in Figure 4 11, inflation adjusted property tax revenues accruing to the District peaked in the early 1990 s, and only recently began to rise past the levels of the mid 1980 s. 1 In 2002, the District increased the number of property classes from two to three, adding Class Whitehurst Freeway Deconstruction Feasibility Study October 2005

73 Property assessments in District neighborhoods have risen significantly in recent years, reflecting both a strong real estate market and the recent elimination of a triennial assessment system that had caused assessments to fall below actual market values. Table 4 3: Property Tax Classification and Rates Description Class 1 improved residential real property that is occupied and is used exclusively for non transient residential dwelling purposes. Class 2 commercial property. Class 3 unimproved or abandoned property. Rates $0.96 per $100 of assessed value. Note: For Class 1 residential real property that is owner occupied, the first $38,000 of assessed value is exempt from tax. $1.85 per $100 of assessed value. $5.00 per $100 of assessed value. Source: DC Code Citation: Title 47, Chapters Figure District Real Property Tax Revenue Adjusted for Inflation (in 1996 Dollars) Source: District Office of Tax and Revenue Table 4 4 indicates the total value of taxable property within the boundaries of the study area. Assuming the most recent year, FY2005, as the base year, the assessed value of all land in the study area is $2.9 billion, generating $33.2 million in annual property taxes based on tax roll data from the District Assessor s Office, Division of Real Property Assessment. Overall, the average valuation per property in the study area is $900,418. As also shown in the table, the study area contributes approximately 3.3 percent of the District of Columbia s total annual property taxes This is attributable to the number of higher valued properties and a strong real estate market in the study area. As shown in Figure 4 12, the higher valued properties in the study area are located along the Potomac riverfront area Whitehurst Freeway Deconstruction Feasibility Study October 2005

74 Table 4 5 highlights some of the properties shown in Figure 4 12 by listing the top property values in the study area. The Washington Harbour parcels at K Street represent the highest valued property in the study area, followed by the Watergate Hotel complex, and offices along Thomas Jefferson Street. Table 4 4: Total Property Valuation and Property Taxes (FY2005) Area Total Valuation Annual Property Taxes Study Area $2,968,018,123 $33,199,100 District of Columbia $136,191,353,776 $1,017,653,000 Study Area Contribution 2.2% 3.3% Source: District Office of Tax and Revenue, 2005 Figure Distribution of Property Values 4 20 Whitehurst Freeway Deconstruction Feasibility Study October 2005
75 Table 4 5: Top Property Values (Year 2005) Address Property Valuation 3000 K STREET NW (Washington. Harbour) $183,355, VIRGINIA AVENUE NW $ 87,076, E STREET NW $ 86,722, VIRGINIA AVENUE NW $ 80,890, THOMAS JEFFERSON STREET NW $ 72,203, PENNSYLVANIA AVENUE NW $ 50,740, THOMAS JEFFERSON STREET NW $ 49,907, THOMAS JEFFERSON STREET NW $ 35,573, WISCONSIN AVENUE NW $ 29,631, THOMAS JEFFERSON STREET NW $ 29,289, TH STREET NW $ 27,342, TH STREET NW $ 25,436, K ST REET NW $ 25,136, K STREET NW $ 21,940,440 Source: District Office of Tax and Revenue, 2005 Additional important statistics pertaining to the land valuation of the study area are as follows: Total valuation of land in the study area is $370 per square foot, compared to $217 per square foot in Georgetown and $180 per square foot in the District of Columbia. From 1998 to 2005, 104 percent appreciation in total land valuation (in real value terms) occurred in the study area, a strong 10.7 percent average annual rate of growth. During the same period of 1998 to 2005, a steady increase occurred in the ratio of improvement value to total assessed value. This indicates that land is becoming more valuable and productive. Market profile data, summarized in Table 4 6, indicates that the study area generates $280.5 Billion in annual retail sales transactions. Retail sales transactions in the study area are strong with M Street providing the majority of traditional and high end clothing and merchandise retail establishments. Significant sales transactions are also generated by the Washington Harbour restaurants and Watergate Hotel complex. Another key retail generating use is the cineplex theater. Additional important statistics pertaining to the land valuation of the study area are as follows: 4 21 Whitehurst Freeway Deconstruction Feasibility Study October 2005
76 Total valuation of land in the study area is $370 per square foot, compared to $217 per square foot in Georgetown and $180 per square foot in the District of Columbia. From 1998 to 2005, 104 percent appreciation in total land valuation (in real value terms) occurred in the study area, a strong 10.7 percent average annual rate of growth. During the same period of 1998 to 2005, a steady increase occurred in the ratio of improvement value to total assessed value. This indicates that land is becoming more valuable and productive. Market profile data, summarized in Table 4 6, indicates that the study area generates $280.5 Billion in annual retail sales transactions. Retail sales transactions in the study area are strong with M Street providing the majority of traditional and high end clothing and merchandise retail establishments. Significant sales transactions are also generated by the Washington Harbour restaurants and Watergate Hotel complex. Another key retail generating use is the cineplex theater. Table 4 6: Retail Market Profile (2004) Supply (Retail Sales) Total Retail Trade (NAICS 44 45) $191,559,258 Total Food & Drink (NAICS 722) $88,895,281 TOTAL $280,454,539 Source: Business data provided by InfoUSA, Omaha NE Copyright 2004, all rights reserved. ESRI forecasts for VALUE CAPTURE FINANCING MECHANISMS Value capture finance is a strategy for funding public improvements by capitalizing upon the anticipated stream of future incremental tax revenues that the improvements are expected to generate. In theory, public infrastructure improvements stimulate real estate development that increases property values, incomes, and, consequently, revenues. Such a financing approach could potentially be applied to the proposed Whitehurst Freeway deconstruction, since it is expected that this project would enhance property values by creating river views, river access, a more attractive pedestrian environment, and other amenities, all of which would support higher rental and sales prices. In addition, depending on the revised roadway design, new developable land may become available for commercial and residential development. The new revenues generated in the process could be captured to help fund the Whitehurst project and related improvements Whitehurst Freeway Deconstruction Feasibility Study October 2005
77 A form of value capture finance that is practiced in the District and in 48 states is tax increment financing, or TIF. Under this model, a municipality defines a TIF district and undertakes the public improvements needed to encourage economic development. These improvements may include not only transportation projects, but a variety of other typical public investments. 1 Incremental real property taxes and incremental sales tax revenues produced by a project may be used to repay its TIF bond issues. Future property taxes and retail sales tax transactions within the TIF district are divided into two components: the base (the aggregate amount collected in year zero ) and the increment. In most TIF jurisdictions, including the District, the increment includes revenues attributable to the appreciation in existing property as well as new development. The tax increment is then dedicated, in whole or in part, to fund the public improvements; typically this is done by using the multi year stream of incremental revenues to pay debt service on a TIF Bond. These bonds are often structured as special revenue bonds, which do not require a pledge of the municipality s full faith and credit and fall outside the municipality s general obligation debt ceiling. At the conclusion of the financing term, the carve out of TIF revenues ends and the full annual tax yield of the TIF district start to flow to the general fund. The District's Tax Increment Finance program was established in 1998 and has been reauthorized through a number of temporary acts beginning in District legislation to permanently reauthorize the TIF Act and refine certain provisions is expected to be enacted in Key provisions of the DC TIF program include: The aggregate principal amount of TIF bonds, other than refunding bonds, shall not exceed $300 million. All TIF bonds issued pursuant to the original Act must have been issued before January 1, The current TIF authorization ceiling of $300 million has been reached, but is expected to be increased to $600 million as part of the 2005 TIF reauthorization. The District s TIF program can use both the property tax and the District s sales tax; this is a relatively unusual provision among US TIF statutes. Since on average approximately 60 percent of DC property taxes are pledged for repayment of the District s general obligation bond indebtedness, the capacity for new TIF borrowing based on incremental real property taxes may be limited in cases where there is modest growth in new development. 1 TIF bonds can be issued to finance eligible development costs such as soft costs, property assemblage, rehabilitation of existing structures, and costs of public works and infrastructure. 2 The TIF Act exists parallel to the Downtown Retail Incentive Act, which also authorizes the use of TIF to promote retail development Downtown and in District neighborhoods Whitehurst Freeway Deconstruction Feasibility Study October 2005
78 Incremental retail sales taxes also incur a prior obligation to use ten percent of the food and beverage sales tax revenues in the District to support the convention center bonds. Under the DC TIF program to date, TIF bonds have been issued for projects that would result in a significant increase in sales and property tax revenues. All of DC's TIF projects approved thus far are expected to repay their bonds with new revenue generated directly from the project in question CONCLUSION AND FINDINGS OF LAND VALUATION AND FUNDING MECHANISMS The study area has seen a substantial increase in prices and value of property transactions in both the residential and commercial real estate markets. This trend is expected to remain stable, as well as the trend in retail sales transactions. Under existing conditions, there is limited redevelopment or infill capacity remaining in the study area. Consequently, application of TIF funding for the Whitehurst Freeway deconstruction would rely primarily on the appreciation of the existing property tax base. The same assumption is applicable with regard to the growth in the volume of retail sales activity in the study area being limited to the growth in existing retail establishments, as opposed to significant new retail growth occurring from new establishments Whitehurst Freeway Deconstruction Feasibility Study October 2005
79 5. CASE STUDY PROJECTS FROM PORTLAND, SAN FRANCISCO, AND BOSTON This report draws upon the experiences from other cities that have removed or deconstructed major waterfront highways. The case study cities are arranged chronologically, starting with Portland, Oregon one of the first cities to remove a highway in the United States and culminating with the largest and most recent project, the waterfront portion of Boston s Big Dig BACKGROUND ON THE CASE STUDIES In all three case study projects, the action to redesign, remove or deconstruct a highway was undertaken as part of a more elaborate initiative to invigorate and renew a waterfront, create a new or enhanced public realm, and promote economic development. In two of the cities, Portland and San Francisco, the barrier freeway was removed but not replaced by a new roadway. The vehicular traffic was redistributed to a new or upgraded network of surface streets that accommodated the anticipated volumes. In Boston, where the old Central Artery carried I 93 the only north south interstate highway traversing the city the freeway was replaced and expanded underground, with the number of on and off ramps in the downtown significantly reduced. Together these case studies provide valuable input on the relationship between highway deconstruction and waterfront land value. They offer additional lessons as well, as the District considers the feasibility of removing the Whitehurst Freeway. Among these lessons are the importance of transit in the creation of a high value added downtown waterfront; the importance of replacing the freeway footprint with a pedestrian friendly environment, and the potential role of special institutional or financial mechanisms in implementing the long term plan for place making in the freeway corridor PORTLAND S HARBOR DRIVE PROJECT DESCRIPTION AND RELATED OUTCOMES In 1974 the four lane Harbor Drive expressway, shown in Figure 5 1, was removed from the Portland s southern waterfront along the Willamette River to create Waterfront Park. The new park and master plan established the framework and development trajectory for the signature RiverPlace (1987) residential and commercial development projects along the river. Subsequently, extensive planning and development efforts have occurred along the north and south sides of the Willamette River as Portland continues to reclaim and improve its riverfront area. 5 1 Whitehurst Freeway Deconstruction Feasibility Study October 2005

80 Figure 5 1. Portland s Harbor Drive (1974) LAND USE AND DEVELOPMENT The RiverPlace project and the surrounding 73 acre Waterfront Park, shown in Figure 5 2, are located adjacent to the Willamette River. Above all else, Portland s Central City Plan Fundamental Design Guidelines (1978) call for an integration with the Willamette River: The river is the Central City s most significant geographic feature and acts as the binding element, the Guidelines state. The river is also a center for activity; important to Portland s overall economic health and livability. The river s importance is measured not just as a working river, but also in terms of its aesthetic, recreational, and tourism potential. 1 The specific river oriented design guideline that helped RiverPlace s developers create its form states: Integrate the river as an important design consideration into the projects which are located along or near the edge of the Willamette River, through means such as the composition of architectural and landscape elements, location of windows, doors and attached outdoor areas, and offering access ways for the pedestrian to, along, and from the water s edge. 2 1 City of Portland, Central City Plan Fundamental Design Guidelines (1978). 2 Ibid, (1978). 5 2 Whitehurst Freeway Deconstruction Feasibility Study October 2005
 After the deconstruction of Harbor Drive and the formulation of a master plan to guide new development, a key agency involved in waterfront")
81 Figure 5 2. Map of Portland s RiverPlace Development Area (2004) After the deconstruction of Harbor Drive and the formulation of a master plan to guide new development, a key agency involved in waterfront renewal was the Portland Development Commission (PDC). The PDC acquired 73 acres of undeveloped waterfront land between the Marquam and Hawthorne Bridges in The highly visible site was Portland s last centrally located vacant tract of significant size. Over the next five years, the PDC completed more than $6 million in infrastructure development and improvements, including public streets, riverfront and park expansion, marina basin dredging, and enhanced pedestrian access. The city and the local utility company were also key players in waterfront renewal efforts. The Pacific Power & Light utility company assisted by shutting down its on site steam plant and agreeing to relocate a major substation to the southwest corner of the development area. This action enabled the PDC to construct a marina basin enclosed by a floating breakwater and fishing pier, a five acre terraced meadow, swimming beach, and a half mile extension of the riverfront esplanade. The financing for infrastructure improvements for the RiverPlace project was secured through city issued bonds, while the city had been assembling various parts of the site itself since The RiverPlace project began in 1983 when the PDC sponsored a nationwide design competition for a ten acre parcel of the South Waterfront Development Area. Phase I of 5 3 Whitehurst Freeway Deconstruction Feasibility Study October 2005
82 RiverPlace was completed in The city s share of Phase I funding was provided largely through tax increment financing (TIF). This phase included 158 condominium units, the 75 room RiverPlace Alexis Hotel, a public marina with 200 spaces for large sailboats and light watercraft, a floating restaurant, specialty shops along the esplanade, and an athletic facility sized to serve both RiverPlace and the surrounding community. All docking spaces, retail shops, and restaurants were immediately leased. The following year, a four story, 40,000 square foot office building was constructed, as were 32 condominium units and below grade, hidden parking. RiverPlace s Phase II, which began in summer 1988, included a 300 space public parking garage with six street level retail spaces forming the base for 108 rental apartments of middle income housing. In 1994, the Commission received approval from the Oregon Department of Environmental Quality to market additional RiverPlace land to meet increasing housing demand. The Commission approved a plan to develop 182 townhomes, which were completed and opened in The townhomes the first to be built in Portland s downtown core were quickly leased. In total, the 10.5 acre RiverPlace project shown as before and after in Figure 5 3 and in Figure 5 2 includes 480 condominium, townhome, and rental units. RiverPlace also includes 26,000 square feet of retail and nearly 42,000 square feet of office space. Almost 60 percent of the parking at RiverPlace is underground and all residential parking is underground or otherwise hidden behind vine covered facades or retail shops. All told, the RiverPlace project represents a reintegration with Portland s urban and river fabric, a 25 year turnaround from four lane freeway to a thriving downtown neighborhood LAND VALUATION The waterfront park and RiverPlace project are located in what is called the Downtown Waterfront Urban Renewal Area. The area is considered to be one of Portland s most successful examples of urban renewal and tax increment financing. Since its creation in 1974, assessed land values have increased an average of 10.4 percent annually, from a total of $466 million to more than $1.6 billion (2003). 1 Recent planning and investment proposals in Portland are focused on additional redevelopment of the riverfront. The proposed tax increment financing to be applied to these new areas totals $500 million INSTITUTIONAL AND FINANCIAL MECHANISMS One of the primary institutional entities in the development and waterfront renewal was and will continue to be the Portland Development Commission (PDC). The PDC facilitates public private partnerships, and provides planning, marketing, and financial 1 Portland Development Commission, Annual Report (2005). 5 4 Whitehurst Freeway Deconstruction Feasibility Study October 2005
, as a mechanism to raise private funds for maintenance, programming, and routine improvements of its waterfront and downtown")
83 Figure 5 3. RiverPlace Area in 1998 and 2001 investment assistance primarily through the use of property based, tax increment financing. Alongside TIF, Portland has used business improvement districts (BIDs), as a mechanism to raise private funds for maintenance, programming, and routine improvements of its waterfront and downtown development areas. Portland s BIDs consist of quasi public special districts which raise funds through property special assessments, exactions in development agreements, and negotiated development contributions SAN FRANCISCO S EMBARCADERO FREEWAY PROJECT DESCRIPTION AND RELATED OUTCOMES Like many other ill planned urban highways of the post World War II era, San Francisco s double decked Embarcadero Freeway (Route 480) was built along the city s downtown wharves, as the evolution of marine cargo technology was rendering those old 5 5 Whitehurst Freeway Deconstruction Feasibility Study October 2005
84 piers obsolete. Like similar freeways in other cities, the Embarcadero Freeway, shown in Figure 5 4, cut the city off from its waterfront and hastened its decline. In the 1960 s, the elevated Embarcadero became one of the first freeways in the nation to be halted by citizen protest. At that time, it functioned as an extended off ramp that connected downtown to the Bay Bridge. For years afterward, the city tried with little success to have the freeway removed. The October 17, 1989, Loma Prieta earthquake wreaked havoc throughout the San Francisco Bay Area, but in the process provided San Francisco a once in a lifetime opportunity to reclaim and revitalize its isolated and neglected downtown waterfront. The Freeway sustained significant damage in the quake and was demolished in With the removal of the freeway, San Francisco gained dozens of acres for redevelopment along the central Embarcadero, which lies directly in front of the landmark Ferry Building and adjacent to Embarcadero Center and the downtown business district. The before and after photographs shown in Figure 5 5 clearly display the function of the old Embarcadero and an economic and physical barrier. The privately and publicly funded projects along the waterfront and adjacent blocks include mixed use development, parks and open space, a new surface roadway for automobiles, two new trolley lines, and a seven mile long waterfront promenade overlooking San Francisco Bay LAND USE AND DEVELOPMENT The demolition of the Freeway was the turning point event in the City s waterfront land use plan. Started in 1990 and completed in 1997, that plan recommended the redevelopment of 7.5 miles of San Francisco s bayfront, beginning with the restoration of the landmark 1898 Ferry Building. With the Port Authority in need of a new office before redevelopment could take place, it made sense to first redevelop the adjacent Pier 1 building and prepare it for the Port Authority s use. 1 In 1998, AMB Properties was selected to develop the property in exchange for a 50 year ground lease, with the port authority leasing back 52,000 square feet. Pier 1 is a pioneering waterfront redevelopment project, with an innovative use of structural and energy efficient technologies. Additional publicly and privately funded projects are being carried out under the terms of the Northeast Waterfront Survey Plan, which was prepared by the San Francisco Redevelopment Agency, the city planning department, the Port of San Francisco, and a Citizens Advisory Group. The iconic projects are the restoration of the Ferry Building itself, the pedestrian and transit plaza in front of it, and the planned Ferry Terminal behind it, on the Bay. 1 Historic and background information obtained by personal communication with SF Planning Department personnel and SF Port Authority Finance Director, Christina Olson, February Whitehurst Freeway Deconstruction Feasibility Study October 2005
 and After Removal (2003) The following is a summary")


85 Figure 5 4. Embarcadero Freeway (1969) Figure 5 5. Embarcadero Area Before (1988) and After Removal (2003) The following is a summary description of some of the other completed, soon to becompleted, and proposed projects along the downtown waterfront that became possible due to the deconstruction of the elevated freeway. The quantity of these projects demonstrates the scope of the investment that was undertaken to renew the waterfront. 5 7 Whitehurst Freeway Deconstruction Feasibility Study October 2005
86 Embarcadero Promenade, Roadway, and Trolley Lines: In 1999, new projects included a seven mile waterfront pedestrian promenade, surface level roadway, and a trolley line that operates along the Embarcadero from Second and King Street (near the new Giants baseball park) past the Ferry Building to Fisherman's Wharf. South Embarcadero (from China Basin at the foot of Second Street to the foot of Folsom Street, three blocks south of the Ferry Building): This section of waterfront promenade and vehicular roadway was completed in The waterfront promenade is already a favorite with walkers, joggers and bicyclists. A $200 million extension of the Muni Metro transit system (which currently ends at the underground Embarcadero station beneath the foot of Market Street) was completed. Modern trolleys now run down the light rail median in the South Embarcadero's vehicular roadway, linking China Basin and the South Beach neighborhood to the Muni Metro lines and BART stations under the foot of Market Street. Central Embarcadero (from Folsom Street to the foot of Broadway near North Beach and Chinatown). Construction of this section of the waterfront promenade, vehicular roadway, and trolley median was completed in The five year old Pier 7, located just north of the Ferry Building, was the first pier to be built in San Francisco since the 1940s. Extending 845 feet into San Francisco Bay, the recreation and fishing pier is now lined with streetlights, park benches, and overlooks. North Embarcadero (from the foot of Broadway to Fisherman's Wharf). Lined by palms, this section of the waterfront promenade and vehicular roadway was completed in A historic trolley, known as the "F Line," runs from Fisherman's Wharf, along the waterfront, and then three miles up Market Street to Castro Street. Redevelopment of the Waterfront Piers: Recently, the Port of San Francisco prepared a Waterfront Land Use Plan (2004) for the underused waterfront piers. Steuart Street Adaptive Reuse of Historic Buildings: The east side of Steuart Street between Mission and Folsom streets (once known as the East Street Row) was one of the few parts of downtown San Francisco that escaped destruction in the fire after the 1906 earthquake. Today, it is lined with historic buildings that have been renovated into offices, hotels, and restaurants. A few sensitively designed infill buildings have been constructed along this street, which is located one block inland from the Embarcadero. The Gap Headquarters, Facing the Embarcadero: The Gap built its new signature 440,000 square foot, 17 story, $90 million headquarters at the northwest corner of Folsom and Steuart streets, overlooking the Embarcadero. The Transbay Terminal Redevelopment Project: The 66 acre redevelopment site is possible because of the removal of the freeway. The area contains a mix of uses including 5 8 Whitehurst Freeway Deconstruction Feasibility Study October 2005
87 office, light industrial, warehouses, and some residential, as well as an aging regional bus terminal that is slated for replacement by a new multimodal transportation facility and substantial new commercial and residential uses. The project will be assisted through the use of property based tax increment financing, and several joint development initiatives. The scope of these projects demonstrates that the post Freeway renewal strategy for the Embarcadero rests on large scale infrastructure improvements that recast the entire downtown shoreline as a high value, mixed use environment, with a ripple effect extending many blocks inland as shown in Figure 5 6. The twin themes of this long term reinvestment program are the public realm and mass transit. San Francisco is creating a central and highly accessible public destination, where high value residential and commercial development will thrive LAND VALUATION As more development projects are completed, the "whole" of San Francisco's waterfront is becoming greater than the sum of its individual parts. 1 These projects have unified and enhanced other development and open space activities that were completed in a piecemeal manner before and after the earthquake. Considering San Francisco s post dot.com economic malaise, one might surmise the paucity of demand for most real estate products would be keeping construction cranes idle. But as recent, current, and planned major waterfront development projects illustrate, the city s waterfront continues to undergo a dramatic transformation. There s a tremendous amount of actual construction activity underway right now along San Francisco s shoreline, observes Elliot Stein, senior managing director at the locally based Sedway Group consulting division of CB Richard Ellis. And there s a lot more on the way. 2 Overall, land values in the Embarcadero corridor have appreciated more than 300 percent over the past ten years INSTITUTIONAL AND FINANCIAL MECHANISMS Following the Port Commission s 1997 Waterfront Land Use Plan, the Port alone is guiding privately managed developments representing investments amounting to well over $1 billion. Since the Port owned a sizeable supply of real estate within the Embarcadero, they were one of the key entities that initiated and bolstered the development dynamics along the waterfront and extended inland as well. Other agencies that had a key role were the SF Redevelopment Agency that leveraged its property based tax increment financing resources with public private investment. SF Planning 1 Personal Communication, Jesse Blout, SF Economic Development Director, February 22, Personal Communication, Elliot Stein, Director, Sedway Group, February 9, Personal Communication, Alex Tharayil, Deputy Director, San Francisco Assessor s Office, February 23, Whitehurst Freeway Deconstruction Feasibility Study October 2005
 Department provided the oversight of the development approval process and provided coherence to the various initiatives through planning workshops")
88 Figure 5 6. San Francisco Waterfront and Embarcadero Area (2003) Department provided the oversight of the development approval process and provided coherence to the various initiatives through planning workshops and official planning documents BOSTON S CENTRAL ARTERY PROJECT DESCRIPTION AND RELATED OUTCOMES Boston s Central Artery Ted Williams Tunnel Project (widely known as the Big Dig ), 5 10 Whitehurst Freeway Deconstruction Feasibility Study October 2005
89 is the largest single urban public works project in US history. 1 It currently stands at 96 percent completion. While the national audience understandably sees the Big Dig as an interstate highway and tunnel project, it is also a city building project of massive scale. 2 The most visible of the project s city building goals was to eliminate the Central Artery viaduct and boat sections as a barrier between Downtown Boston and its waterfront. 3. Bostonians hated the elevated Central Artery since it was built in 1959, before the days of environmental impact statements and litigious public process. Construction crews had blasted a path through downtown, displacing 20,000 people and demolishing 1,000 buildings in the process. The scale of the barrier they created can be seen in Figure 5 7. Boston s central waterfront is well over a mile long, with extensive land and wharf space seaward of the Central Artery alignment. As in Georgetown, structures on the landward side of the Central Artery once pressed right up against the viaduct. The space beneath the viaduct was more unfriendly than Georgetown s, criss crossed with on and off ramps and in some segments closed to pedestrians. Alongside the financial district, the viaduct transitioned to a tunnel, its boat section creating a lengthy gash in the urban street network. Today, the viaduct and boat section are gone; the new underground I 93 roadway is in operation; and construction of the Rose Kennedy Greenway a 27 acre park and boulevard environment atop the Artery roof has begun LAND USE AND DEVELOPMENT In the downtown corridor, the opportunity for joint development on the Big Dig owned real estate is limited. 4 In 1990, the state and City agreed that of the 27 acres of land to be created in the Greenway, 75 percent would be dedicated to open space. 5 The 25 percent available for development consists of several parcels in the North End, Chinatown, and North Station / Bullfinch Triangle neighborhoods. These parcels, which are intended to 1 The total project cost will exceed $15 billion. While the federal government will have paid well over half the cost, making it the largest federal aid highway project, the local share is by far the largest ever. 2 The principal highway mobility goals were to enhance north south capacity, safety, and throughput on I 93 (the Central Artery) by widening and rebuilding it underground; to create direct east west access from the Massachusetts Turnpike to the Port of Boston and Logan Airport (by extending I 90 under Boston Harbor to East Boston); and to reduce the flow of regional traffic on downtown and neighborhood streets. 3 Other city building objectives included opening up the South Boston Waterfront for dense, mixed use development; rejuvenating North and South Stations as centers of downtown activity; and building a network of waterfront and neighborhood parks. The Big Dig also included, as companion and/or mitigation measures, a series of MBTA capacity enhancements and extensions. 4 In other parts of the City South Boston, Charlestown, and South Bay the Big Dig created much more extensive development parcels. These fall outside the scope of this case study discussion. 5 The definition of open space includes civic venues such as an indoor botanical garden, Boston historic museum, and neighborhood YMCA Whitehurst Freeway Deconstruction Feasibility Study October 2005
 The development opportunity created on private land alongside the Greenway is far more dramatic.")
90 help re knit the neighborhood fabric with housing, retail, and community uses, have been offered to developers through a competitive RFP process. Figure 5 7. The Former Central Artery (I 93) The development opportunity created on private land alongside the Greenway is far more dramatic. Several diverse examples tell the story: Atlantic Avenue, from Congress Street to Northern Avenue. This key block fronts on the future Greenway, with the waterfront directly behind. It consists of three separate development projects. At the northern end is Independence Wharf, a once decrepit office building renovated as Class A space. In the center is 500 Atlantic Avenue, a hotelcondominium retail project wrapped around a Big Dig vent building. 1 At the southern end is Russia Wharf, a set of three historic buildings owned by Equity Office Investments, which will renovate the existing space and add a series of towers above, creating a hotel office condominium retail project of over a million square feet. Broad, Batterymarch, India, and Franklin Streets. These historic streets, on the landward side of the Greenway, typify the downtown areas formerly cut off from the waterfront. They are now undergoing numerous infill and adaptive reuse projects, both residential and commercial. 1 The vent towers were built on land owned by Boston Edison (now NStar), which retained the development rights Whitehurst Freeway Deconstruction Feasibility Study October 2005
.")
91 The Leather District. This compact area of 19 th century lofts adjoins the southern end of the Greenway. The Big Dig has reconnected these streets to South Station and brought the waterfront within comfortable walking distance (if not direct view). The key development trend in the Leather District is the conversion of loft space from low end office and commercial uses to market rate condominiums, as shown in Figure 5 8 Wharf District. At the mid point of the Greenway corridor is a cluster of land uses dominated on the water side by the New England Aquarium, Long Wharf Marriott, Long Wharf ferry terminal, and Christopher Columbus Park; and on the land side by Quincy Market and the Custom House blocks. 1 In the 1990 s the Aquarium decided to remain on Central Wharf, weather the Big Dig construction period, and expand its facilities; its first phase is now complete (Figure 5 9). The rejuvenation of the building stock in this area is Figure 5 8. Leather District loft conversion to luxury housing evidenced by two projects: the development of two large waterfront restaurants on the ground level of 255 State Street; and the conversion of 199 State the end bay of a historic wharf building that almost touched the viaduct from throw away office and storage space to luxury apartments (Figure 5 10). Causeway Street. At the northern end of the Greenway, the new Central Artery crosses beneath Causeway Street, emerging onto the city skyline s new icon, the Zakim Bridge. Causeway Street, long obscured by two viaducts (the Central Artery and the MBTA s Green Line) is now open to the sky, with the rediscovered Charles River waterfront behind. In the same block as North Station and Boston Garden is Strada 234, a former bakery loft building redeveloped as office space on the lower floors and luxury residences on the six upper floors (Figure 5 11). Immediately next door, the underused Hoffman Building will be redeveloped as 260 units of luxury housing, with street retail Hoffman Building and a new wharf. 1 Quincy Market, opened in the late 1970 s, was the Rouse Company s prototypic festival marketplace development and is one of Boston s principal destinations. Increased synergy between Quincy Market and the waterfront was a specific objective in eliminating the elevated Central Artery Whitehurst Freeway Deconstruction Feasibility Study October 2005


92 Figure 5 9. New England Aquarium Expansion Figure Office Conversion to Luxury Housing Figure Causeway Street Strada 234 and Hoffman Buildings; North Station behind and waterfront to right Whitehurst Freeway Deconstruction Feasibility Study October 2005
93 PROPERTY VALUATION It is widely understood in the Boston real estate community that the replacement of the old Central Artery by the Greenway, and the reconnection of the financial district, Quincy Market, and other parts of downtown with the waterfront, represent a transformative event on property values in this corridor. From the wharves on the seaward side of the alignment, to a depth of several blocks on the landward side, this public investment is already being priced into both land and building stock. This view was reinforced in a 2004 analysis by the Boston Globe, which used both Assessing Department data and stakeholder interviews to examine 45 commercial properties adjoining the Greenway corridor. In the aggregate, from 1988 (when the Big Dig began and investors could rely on its eventual completion) to 2003, these properties increased in assessed valuation by 79 percent nearly double the city wide average of 41 percent for the same period (see Figure 5 12). 1 While some of these properties show artificially large increases because they were placed in service during this period, the aggregate increase is all the more noteworthy because it occurred in the face of two pervasively negative factors: the general recession in office rental values that occurred throughout downtown Boston in the 1990s (accounting for the several blue colored properties in Figure 5 12 that actually lost value), and the disruption of the Big Dig construction period itself. As part of this Report, the Study Team conducted interviews with four key stakeholders who are experts in Greenway corridor real estate. 2 These interviews echoed the Globe analysis on several key points: The recovery in downtown office values is happening in the Greenway corridor before it happens elsewhere. 3 1 For Property Owners, Parks Mean Profits (Thomas C. Palmer, Jr.), Boston Globe, June 14, The following were interviewed by Alden S. Raine of DMJM Harris between February 22 and 27, 2004: Peter Shields, Sr. Vice President in the Boston office of Equity Office Properties, which recently acquired two landmark Greenway properties: Rowe s Wharf (the waterfront s first large scale, mixeduse project, developed in the 1980s), and Russia Wharf (see Figure B3); Robert Beal, Chair of The Beal Companies (also the long time chair of the Massachusetts Development Finance Agency, the state s principal quasi public economic development corporation); Roger Berman, Principle of The Berman Company, a major building owner and redeveloper in the Leather District. Thomas Nally, Director of Planning for the Artery Business Committee (the principal association of corridor property owners). 3 A recent sale illustrates this point. Marketplace Center, a retail and office project originally built into the curve of the Central Artery viaduct, forms the hinge between Quincy Market and the Greenway. The building was recently sold for $141 million, 40 percent more than its 2003 assessed value; there were 22 bids over $130 million. Industry experts called this sale indicative of what to expect for Greenway commercial properties in general, for those which had been directly impacted by the viaduct in particular. (Boston Globe, March 11, 2005; see also Figure B11.) 5 15 Whitehurst Freeway Deconstruction Feasibility Study October 2005
94 Office and hotel space that was most directly impacted by the Artery viaduct i.e., space that looked out on the Artery from the second through sixth floors is undergoing the greatest increase in value. 1 The attraction of the Greenway as a prospective residential address is exceeding industry expectations. As noted earlier, many Greenway loft buildings are being converted from high vacancy Class B office space to luxury apartments. 2 For new construction, Greenway views are turning out to be competitive with water views in attracting new residential investment. Street level retail and restaurant space that used to lie in the shadow of the Artery viaduct is being refurbished and re tenanted at a rapid pace. In addition, buildings that were designed with blank walls facing the Artery at street level are expected to be redesigned to capture the value created by future pedestrian traffic. While the impact of these changes on corridor property values is clear, all of the experts interviewed for this case study identified one other key locational discriminator: mass transit. While most of the Greenway corridor does not have lengthwise transit service like that found on the Embarcadero, it is transit rich nonetheless. The Greenway is intersected by MBTA transit lines at South Station (Metro, BRT, AMTRAK, commuter rail, intercity bus); North Station (Metro, commuter rail); Haymarket (Metro); and Aquarium (Metro). There are regional ferry terminals at Long Wharf (Aquarium) and Rowes Wharf (financial district). In conjunction with the Big Dig, North, South, and Aquarium Stations were rebuilt and their peak load capacities expanded. Every development project or major property sale cited in this report is located within a quartermile (five minute) walk of at least one transit station (see Figure 5 13) INSTITUTIONAL AND FINANCIAL MECHANISMS No single institutional, financing, or regulatory district has been put in place to govern the Greenway/Downtown Waterfront corridor. To understand how land use and the public realm are managed, it is helpful to divide the discussion into the Greenway proper and its wider corridor of wharves and city blocks. With respect to the Greenway proper: The surface of the now underground I 93 Central Artery is owned by the state. Once the Massachusetts Turnpike Authority (the agency in charge of the Big Dig) 1 A property owner interviewed for this case study estimated that lower and mid level office space facing the Greenway is now renting for $8 to10 per square foot more than it would have if the office recession were ending but the Artery were still in place. 2 One of the property owners stated that one time Class B office space which had been barely rentable at $10 per square foot (i.e., a capitalized value of under $100) is selling for $400 to 500 per square foot as residential condominiums Whitehurst Freeway Deconstruction Feasibility Study October 2005

95 Figure Property Valuation 5 17 Whitehurst Freeway Deconstruction Feasibility Study October 2005

96 Figure Greenway MBTA Stations with Quarter Mile Waling Radius has finished constructing the basic elements of the Greenway, the streets and sidewalks will be turned over to the City and the park spaces retained by the state. The Greenway will then be programmed and maintained by a public private partnership known as the Greenway Conservancy. Established by Memorandum of Understanding rather than by legislation, the Conservancy will be funded by the Turnpike, the City, and private fund raising. The Conservancy is explicitly not a Business Improvement District, and while abutting property owners are expected to provide a significant share of funding, their contributions will not take the form of a mandatory assessment Whitehurst Freeway Deconstruction Feasibility Study October 2005
97 The Turnpike Authority s disposition of its joint development parcels is governed by the project s environmental approvals and corresponding City zoning. The proceeds will be used to help fund Greenway expenses. With respect to the corridor as a whole: There is no special land use or tax increment district. A substantial public consensus exists as to the scale, mix, and quality of development in the Greenway corridor. All major development in Boston is regulated concurrently by the City and state. 1 In this case, the joint review is guided by three well established planning regimes: the City s zoning for the Greenway and contiguous areas (adopted in the 1990 s); the state s 1990 Tidelands Development regulations (which govern the wharves, water sheet, and filled land on the seaward side of the Greenway); and a Parking Freeze covering all of downtown Boston, which severely limits the commercial parking supply and reinforces the traditionally high transit mode split CONCLUSIONS AND FINDINGS FOR CASE STUDIES In each of the case studies reviewed for this Existing Conditions Report, a major metropolitan city set out to reinvent its downtown waterfront through a far reaching and multifaceted investment plan. Each of the three case studies represents a package of transformative projects, in which the deconstruction of the barrier freeway was an indispensable but not sufficient condition for reconnection and renewal. Each of these three cities replaced its barrier freeway with a new surface environment characterized by public parks and welcoming streets and sidewalks. Transit was an essential component in San Francisco and Boston, where the waterfront renewal zones were already transit rich and became more so. In Portland, transit improvements are an essential ingredient in the later rounds of waterfront development. Each waterfront corridor had significant underutilized land and building stock available for development when the freeway was gone and waterfront land values were unleashed. Each city used some form of structured land use regime to ensure that it got the kind of waterfront development it wanted. The cities vary widely, however, in the degree to which they have used public land disposition and public finance mechanisms like TIF to stimulate development. A key finding was that the positive impacts of freeway deconstruction were felt on both 1 The Massachusetts Environmental Policy Act (MEPA) review process and the Boston Redevelopment Authority s Major Project Review process are usually conducted together. While each level of government retains its own jurisdiction, the proponent prepares a consolidated EIR/PIR document which is scoped and reviewed collaboratively Whitehurst Freeway Deconstruction Feasibility Study October 2005
98 sides of the demolished freeway. In Boston and San Francisco, particularly, there was an immediate rush to upgrade, re tenant, and convert existing buildings on the landward side of the former freeway corridor. This landside effect would be very important for Georgetown, where most of the developable land on the water side of the Whitehurst/K Street corridor has either been developed already (Washington Harbour and the new Harbourside buildings) or is off limits to development (the Waterfront Park). In all three cities, land values in the freeway/waterfront corridor appreciated dramatically, but it is difficult to isolate the effects of freeway deconstruction from those of transit improvements, the new public realm, and, where applicable, public economic development tools. Without question, the freeway removal launched the renewal process, created higher valued properties, and induced development. But in these three cities, at least, the land appreciation windfall has also reflected the synergistic effects of a growing economy, the other public interventions, and, once begun, the domino effect in the real estate market. Based on the Study Team s case study research, the key findings can be summarized as follows: Removing a freeway that separates the downtown from the waterfront has supported increased property values and new or infill development. In general, freeway removal served as a transformative catalyst for waterfront renewal and other public/private investments. Successful waterfront renewal programs have also placed a high value on the public realm the streets, sidewalks, parks, and other connective places that are open and accessible to all. The design quality of the new public realm, and the avoidance of excessive regional through traffic on surface streets, appear to be key factors in private reinvestment and development decisions. The same is true with respect to high quality mass transit in the affected corridor including water transit, where applicable. The reclamation of the waterfronts has created a redevelopment domino effect. The success of the early projects made them precursors for a new wave of development, characterized by historic preservation and high quality mixed use new development. Within the existing building stock, space in the lower floors of buildings along the alignment is especially likely to increase in per square foot rental or sales value. A supportive public policy environment was critical in all three cities including, to varying degrees, public or quasi public development entities, 5 20 Whitehurst Freeway Deconstruction Feasibility Study October 2005
99 focused planning and regulatory policies, and public private governance and funding mechanisms. Federal and state capital grant funding was needed to realize the freeway deconstruction projects and related highway and transit investments Whitehurst Freeway Deconstruction Feasibility Study October 2005
100
101
102
103
104
105
106
107
108
109
110
111
112
113
114
115
116
117
118
119
120
121
122
123
124
125
126
127
128
129
130
131
132
133
134
135
136
137
138
139
140
141
142
143
144
145
146
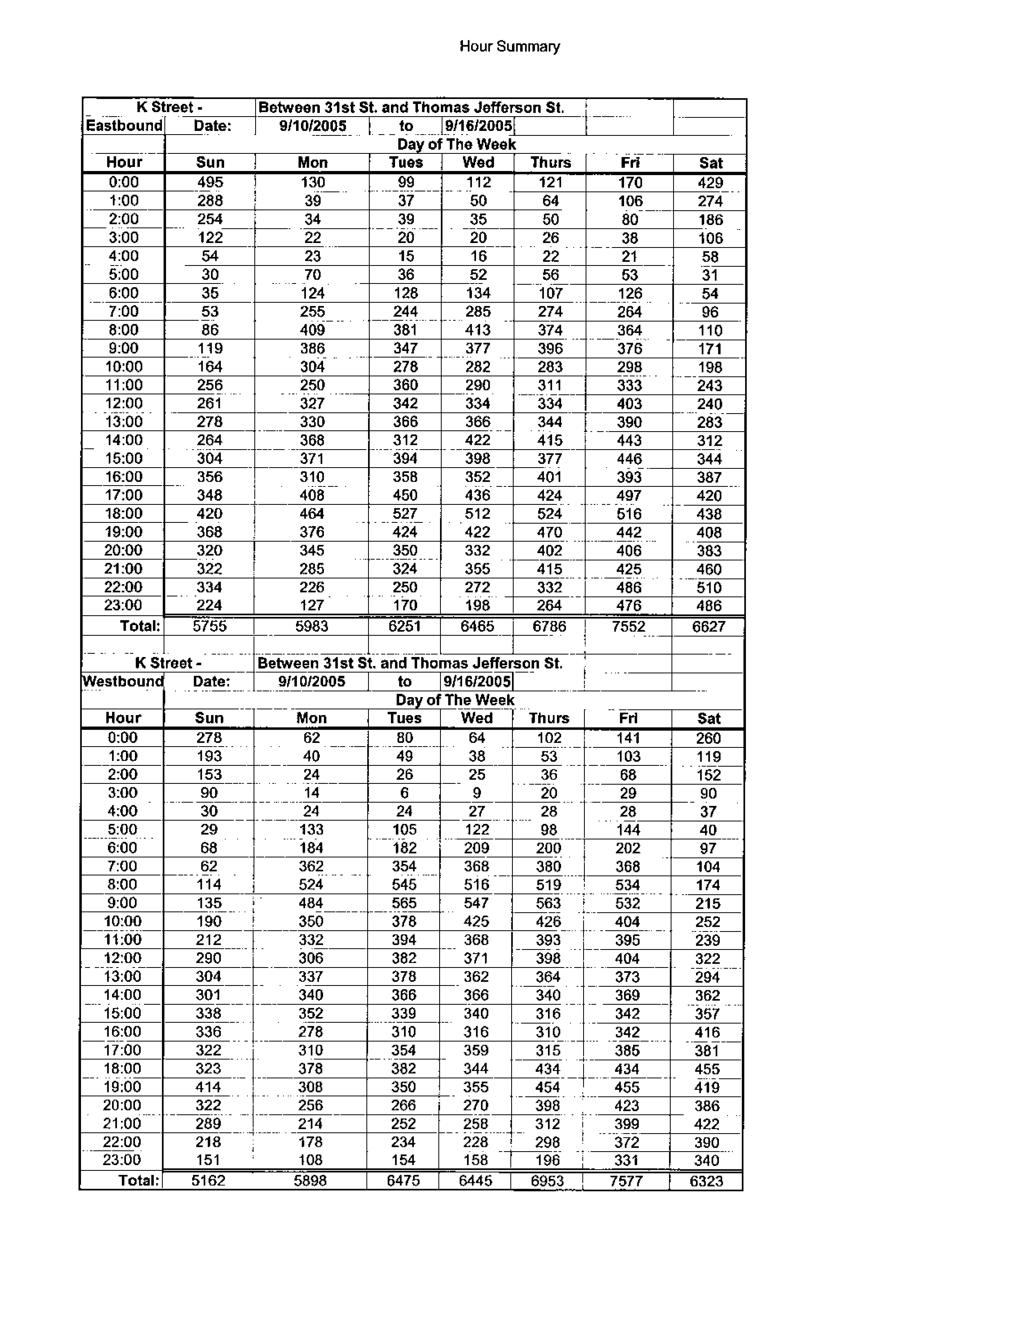
147
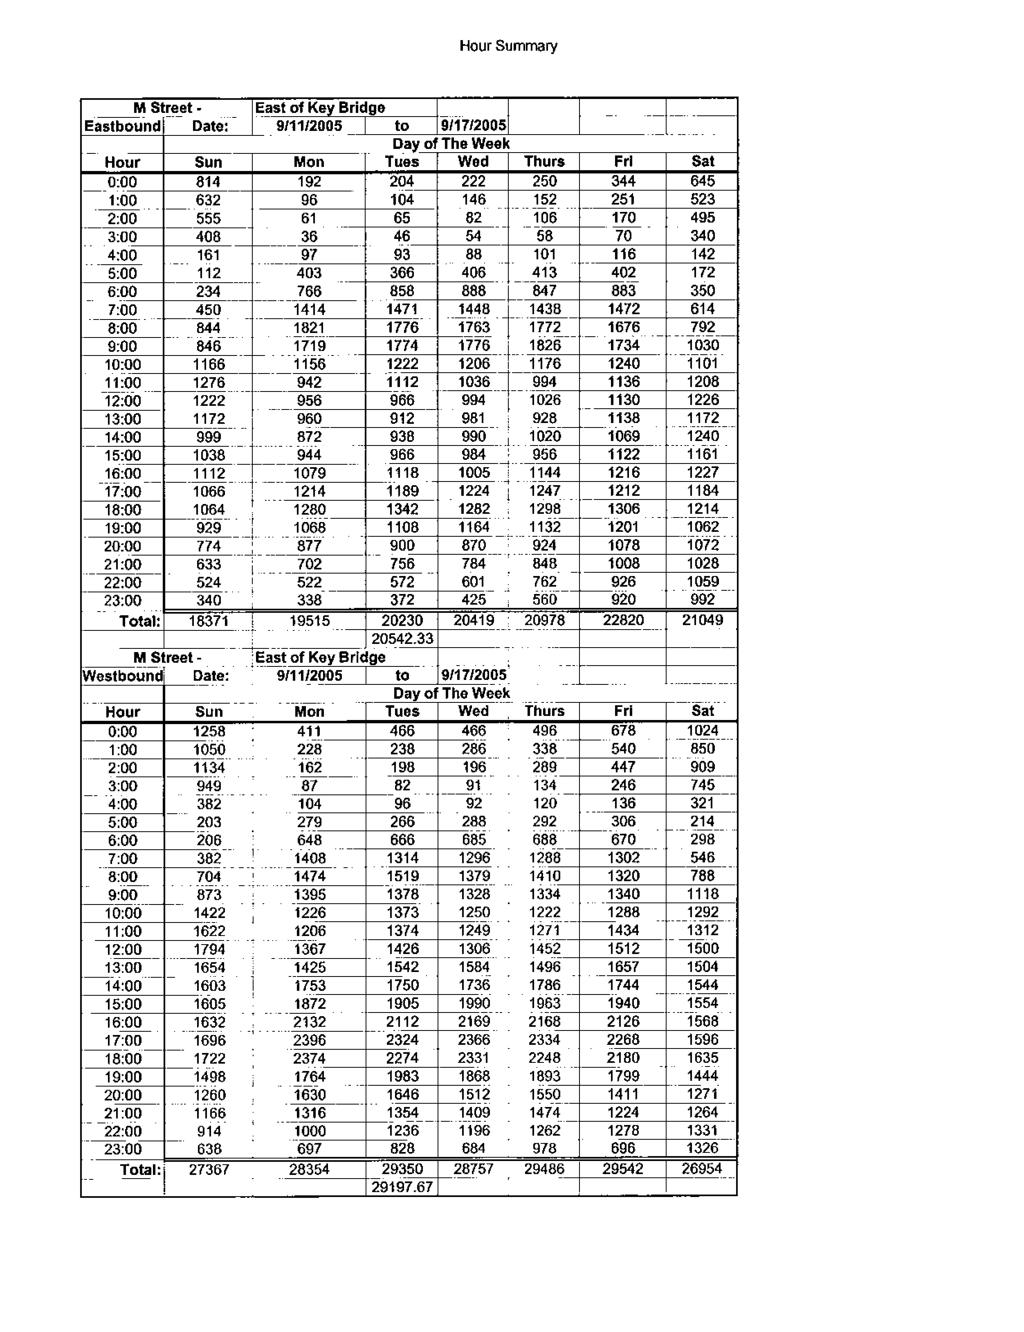
148
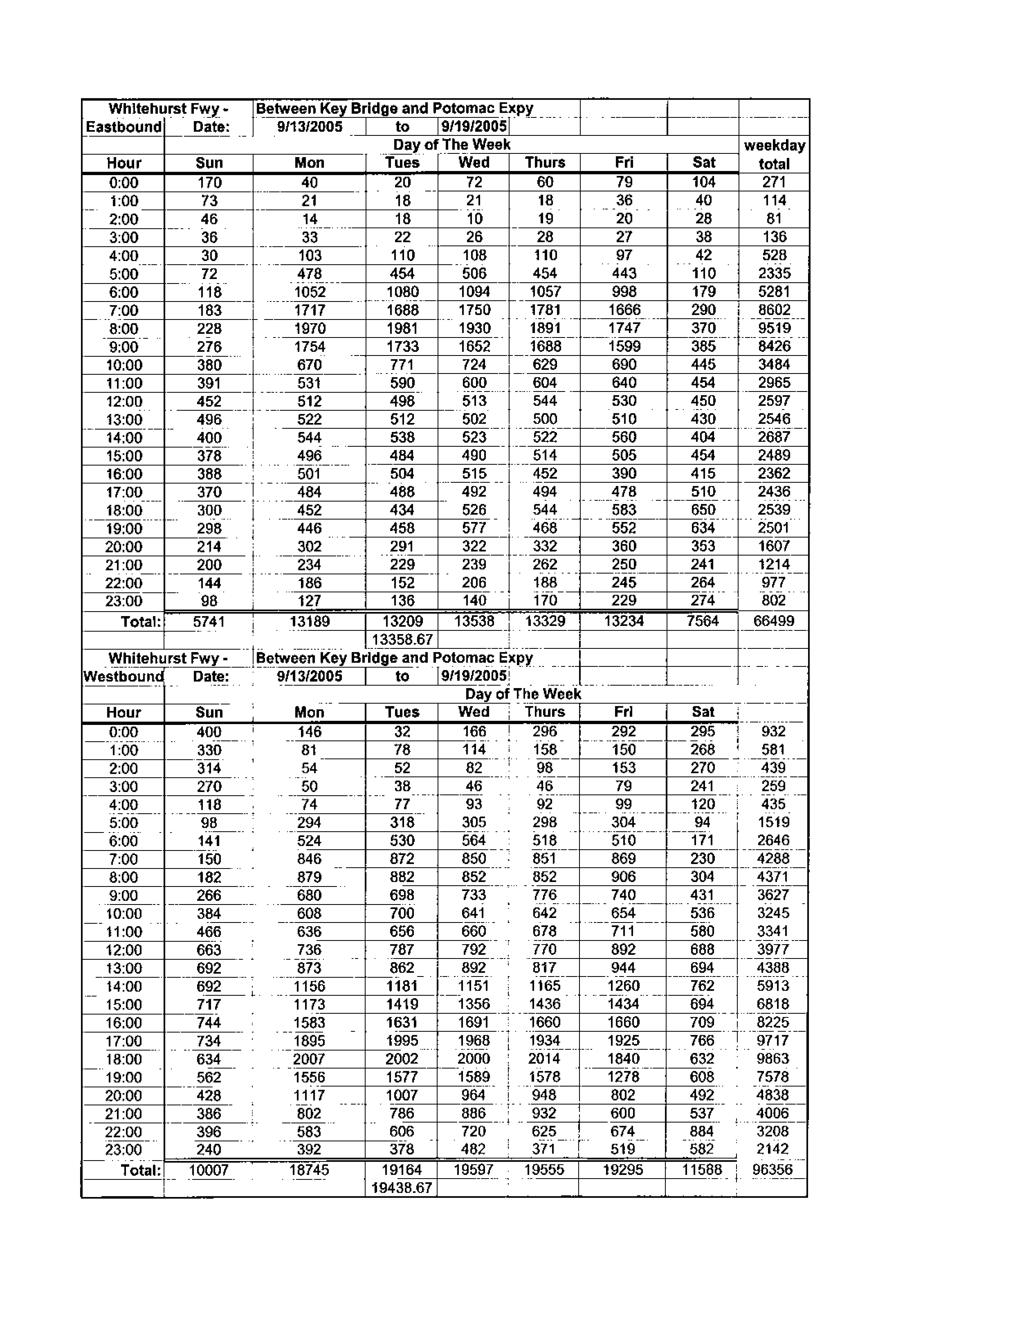
149
150
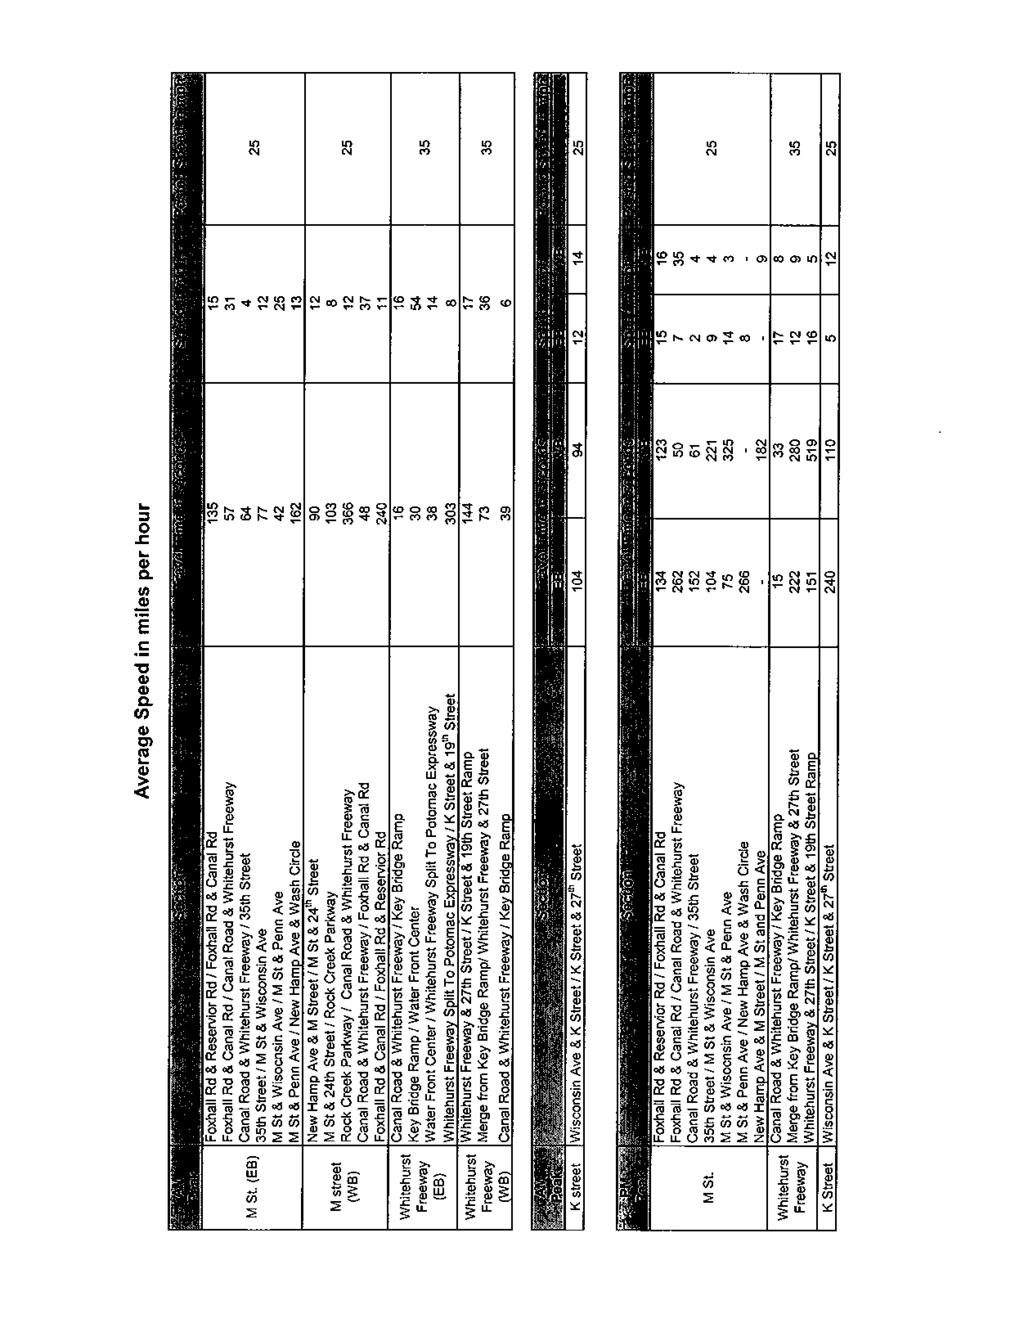
151
152
153
154
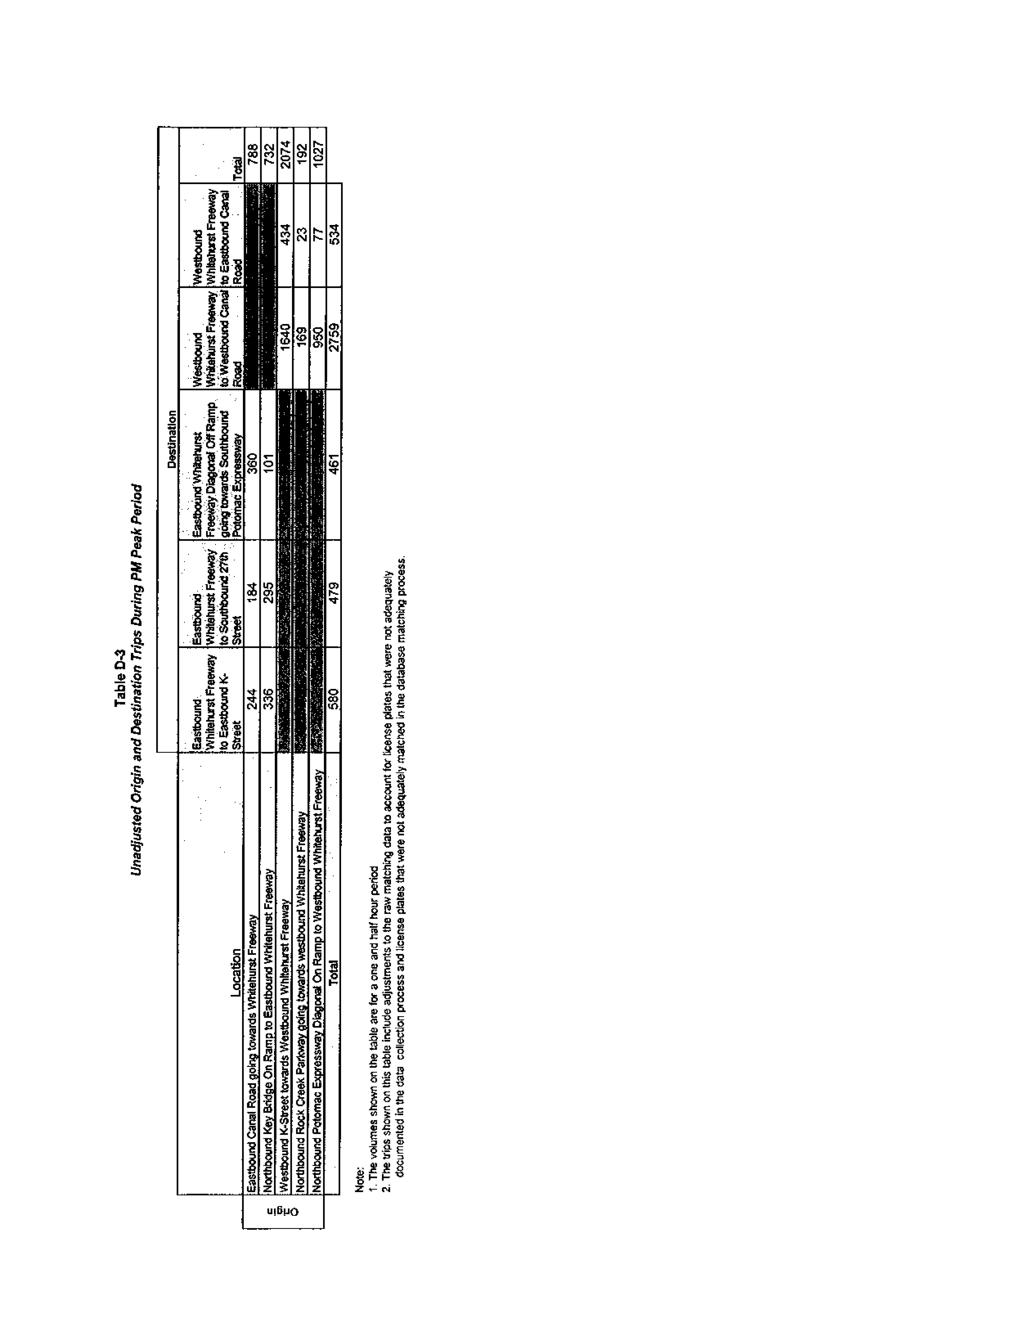
155
Existing Transportation System 5-1
 5-1 The Jackson County transportation system is served by several modes of transportation including streets and highways, multi-modal, non-motorized, rail, and aviation. While the focus of the transportation
4.11 TRAFFIC Existing Conditions Existing Project Site. Existing Street System
 4.11 TRAFFIC This traffic and circulation section is based on a Traffic Impact Study conducted by Linscott Law & Greenspan Engineers, which is provided in full in Appendix F. This traffic analysis has
Public input has been an important part of the plan development process.
 Lakewood s Comprehensive Plan recognizes that transportation helps shape the community, and that the way the community provides for the safe and efficient movement of people affects the character of the
Midtown Corridor Alternatives Analysis. Appendix A - Initially Considered Alternatives Screening
 Midtown Corridor Alternatives Analysis Appendix A - Initially Considered Alternatives Screening Arterial BRT on Lake Street - Overall Rating: RATING Metropolitan Council recommendations stated in the Transportation
PREPARED FOR: PLATTEVIEW ROAD CORRIDOR STUDY EXECUTIVE SUMMARY
 PREPARED FOR: PLATTEVIEW ROAD CORRIDOR STUDY EXECUTIVE SUMMARY SEPTEMBER 2016 Introduction The Platteview Road Corridor Study was led by the Metropolitan Area Planning Agency (MAPA) with assistance from
112th Avenue Light Rail Options Concept Design Report JUNE 2010 PREPARED FOR PREPARED BY TBG PGH
 112th Avenue Light Rail Options Concept Design Report JUNE 2010 PREPARED FOR PREPARED BY TBG060310124909PGH C ontents Introduction 1 Project Overview 1 Public Involvement and Technical Coordination 4 Description
NORTH, NORTH REDWOOD BOULEVARD CORRIDOR STUDY
 BOULEVARD CORRIDOR STUDY Southern Central Northern STUDY AREA OPPORTUNITIES AND CONSTRAINTS BOULEVARD CORRIDOR WORKSHOP Constraints Wetlands For illustrative purposes only BINFORD RD RUSH LANDING RD BOULEVARD
Transportation Improvements
 Transportation Improvements 0 0 Volume II of the Final EIS for the DHS Headquarters consolidation at St. Elizabeths includes analysis to transportation improvements for the DHS Headquarters Consolidation
Eastern Terminus TECHNICAL MEMORANDUM CENTRAL BROWARD EAST-WEST TRANSIT ANALYSIS BROWARD COUNTY, FLORIDA
 Eastern Terminus TECHNICAL MEMORANDUM CENTRAL BROWARD EAST-WEST TRANSIT ANALYSIS BROWARD COUNTY, FLORIDA FINANCIAL PROJECT ID NUMBER 411189-2-22-01 FLORIDA DEPARTMENT OF TRANSPORTATION DISTRICT 4 Prepared
The transportation system in a community is an
 7 TRANSPORTATION The transportation system in a community is an important factor contributing to the quality of life of the residents. Without a sound transportation system to bring both goods and patrons
BACKGROUND, GOALS, STUDY AREA, EVALUATION CRITERIA, ORGANIZATION
 CHAPTER 1 BACKGROUND, GOALS, STUDY AREA, EVALUATION CRITERIA, ORGANIZATION 1.0 INTRODUCTION The Executive Office of Transportation and Public Works Office of Transportation Planning (Planning) initiated
Connecting Key Activity Centers with High Quality Bus Service
 Connecting Key Activity Centers with High Quality Bus Service Lessons Learned from the DC Circulator Transit Development Plan April 15, 2011 1 DC Circulator Transit Development Plan Ten-year plan for development
master plan of highways bus rapid transit amendment
 Scope of Work master plan of highways bus rapid transit amendment September 2011 Montgomery County Planning Department M-NCPPC MontgomeryPlanning.org 1 Scope of Work master plan of highways bus rapid transit
RESOLUTION NO. R Refining the route, profile and stations for the Downtown Redmond Link Extension
 RESOLUTION NO. R2018-32 Refining the route, profile and stations for the Downtown Redmond Link Extension MEETING: DATE: TYPE OF ACTION: STAFF CONTACT: Capital Committee Board PROPOSED ACTION 09/13/2018
PROPOSED IMPROVEMENTS
 IV. PROPOSED IMPROVEMENTS The proposed improvements for each alternative carried forward are discussed below. A. FUNCTIONAL CLASSIFICATION AND ROADWAY CROSS-SECTIONS The classifications of the roadways
Northwest Rail Corridor and US 36 BRT Development Oriented Transit Analysis 4.4 STATION AREA FINDINGS
 4.4 STATION AREA FINDINGS Each station is different, and each one requires a separate set of recommendations based on the vision for the site. This section outlines an initial TOD strategy and recommendations
NORTH-SOUTH CORRIDOR STUDY EXECUTIVE SUMMARY. Executive Summary
 Executive Summary Background As congestion continues to affect mobility in the region, the Ozarks Transportation Organization (OTO) is particularly concerned with traffic movement. The North-South Corridor
East Corridor Final Environmental Impact Statement
 East Corridor Final Environmental Impact Statement Alternatives Considered Operating Plan The requirements for opening day operations versus year 2030 are based on ridership and operations. Opening day
University Parkway Corridor Plan. Public Workshop Sept. 18, 2017
 University Parkway Corridor Plan Public Workshop Sept. 18, 2017 AGENDA 1. Overview of Process 2. Study Area 3. Components of the Plan 4. What We Know 5. What We Have Heard 6. Tonight s Input 7. Next Steps
Economic Development & Housing Council Committee Comprehensive Plan Update September 20, 2005
 1 Economic Development & Housing Council Committee Comprehensive Plan Update September 20, 2005 Purpose To update the Committee on the ForwardDallas! Plan, including: Status Anticipated Products Public
510 Highways, Streets & Roads Comprehensive Plan Section 510
 511 510 Comprehensive Plan Section 510 Highways, streets, and roads provide for the movement of people and goods from one place to another. These public ways form a network that defines the relationship
Transit Implementation Strategy Westside Study Group Meeting
 Westside Study Group Meeting February 27, 2012 The Portland Streetcar Passing Through a Park Near Portland State University Westside Study Group Meeting February 27, 2012 1. TIA Update 2. TIS Process To-Date
2040 Long Range Transportation Plan
 2040 Long Range Transportation Plan Adopted: April 15, 2013 APPENDIX D HIGHWAY NEEDS PLAN PROJECTS FREDERICKSBURG Existing and Committed Projects Fall Hill Avenue/Mary Washington Blvd. (Fredericksburg)
Reclaiming Old West Broad Street: I-16 Ramp Removal Study
 Reclaiming Old West Broad Street: I-16 Ramp Removal Study Community Meeting Summary July 15, 2014 The first community meeting for Phase II of the I-16 Ramp Removal Study was held on July 15, 2014, at the
Definitions. Average Daily Traffic Demand (ADT): The actual number or projected number of cars that pass a point in a 24-hour period.
: The actual number or projected number of cars that pass a point in a 24-hour period.") Definitions Access Management: A combination of physical techniques and transportation policies used to control the flow of traffic between roads and the surrounding lands. Alternative City Form Scenarios:
Definitions Access Management: A combination of physical techniques and transportation policies used to control the flow of traffic between roads and the surrounding lands. Alternative City Form Scenarios:
METRO Gold Line BRT CBAC Meeting. August 23, 2018
 METRO Gold Line BRT CBAC Meeting August 23, 2018 1 Today s Topics Introductions Corridor Management Committee Update Public Engagement Update History of Alignment Project Scope Discussions Upcoming CBAC
2.0 PURPOSE AND NEED. 2.1 Purpose. 2.2 Need Traffic Congestion in and around Downtown Derry
 2.0 PURPOSE AND NEED Taking into consideration agency and public input, the purpose and need for the Project was identified early in Project planning. As noted in Appendix A, for purposes of meeting the
ARGENTA TRAIL (CSAH 28/63) REALIGNMENT SOUTH PROJECT (CP 63-25)
 REALIGNMENT SOUTH PROJECT (CP 63-25)") ARGENTA TRAIL (CSAH 28/63) REALIGNMENT SOUTH PROJECT (CP 63-25) Preliminary Design Report February 2015 Prepared For: City of Inver Grove Heights Dakota County Prepared By: Kimley-Horn and Associates,
ARGENTA TRAIL (CSAH 28/63) REALIGNMENT SOUTH PROJECT (CP 63-25) Preliminary Design Report February 2015 Prepared For: City of Inver Grove Heights Dakota County Prepared By: Kimley-Horn and Associates,
Memorandum CITY OF DALLAS
 Memorandum DATE September 23, 2016 CITY OF DALLAS TO The Honorable Members of the Transportation and Trinity River Project Committee: Lee M. Kleinman (Chair), Deputy Mayor Pro Tem Erik Wilson (Vice-Chair),
Request for Statement of Interest in Implementation of the Roosevelt Road Redevelopment Plan
 425 Hillside Avenue Request for Statement of Interest in Implementation of the Roosevelt Road Redevelopment Plan I. INTRODUCTION The is seeking the services of a qualified consulting firm to prepare plans
Southern Gateway Project and Public Green
 Southern Gateway Project and Public Green Transportation and Trinity River Project Committee May 23, 2016 Purpose of Presentation Provide the history and an overview of the Southern Gateway Project (SGP)
Ashland BRT Environmental Assessment: logos of CTA, CDOT, Chicago Department of Housing and Economic Development
 Ashland BRT Environmental Assessment: logos of CTA, CDOT, Chicago Department of Housing and Economic Development Overview The Chicago Transit Authority (CTA), in partnership with the Chicago Department
Planning Districts INTRODUCTION
 INTRODUCTION To facilitate detailed examination of development prospects for all areas of the community, Delano has been divided into 14 planning districts. The location of these planning districts is
WHAT IS THE PURPOSE OF THE OPEN HOUSE?
 WHAT IS THE PURPOSE OF THE OPEN HOUSE? OPEN HOUSE PURPOSE The purpose of the open house is to provide an update on the study process and introduce the preliminary concept alternatives. The open house provides
DRAFT ETC Master Plan. Appendix D Land Uses and Demographics
 DRAFT ETC Master Plan Appendix D Land Uses and Demographics DRAFT ETC Master Plan Figure D 1. Existing Land Uses... D 3 Figure D 2. Future Land Uses... D 5 Figure D 3. Transportation Analysis Zones...
Population and Demographics Alternatives Development Design Criteria Stormwater Management Guidelines Alternative 1: No Build
 Table of Contents Executive Summary... 1 Introduction... 1 Purpose and Need... 1 Alternatives Development... 2 Impacts and Costs... 2 Next Steps... 3 Findings Report... 5 Purpose and Need... 5 Introduction...
DOWNTOWN JACKSONVILLE MASTER PLAN S T R E E T H I E R A R C H Y
 DOWNTOWN JACKSONVILLE MASTER PLAN S T R E E T H I E R A R C H Y Gateway Intra-District Business Inter-District 44 CELEBRATING THE RIVER: A PLAN FOR DOWNTOWN JACKSONVILLE The Transportation Network This
1351 Wisconsin Ave NW Georgetown theater
 1351 Wisconsin Ave NW Georgetown theater Turn-key retail opportunity Newly renovated 7,870 SF space over two levels Perfect for dining, fashion or fitness Iconic building features restored neon sign, grand
Georgetown Business Improvement District. Request for Proposals. Georgetown Gateways Project
 Georgetown Business Improvement District Request for Proposals Georgetown Gateways Project November 2016 1 Contents Project Overview... 3 Project Goals... 6 Primary Gateway Site Descriptions... 7 Gateway
LOS ANGELES MISSION COLLEGE MASTER PLAN Master Plan DESIGN & DEVELOPMENT PRINCIPLES
 LOS ANGELES MISSION COLLEGE MASTER PLAN DESIGN & DEVELOPMENT PRINCIPLES 34 Quality Learning Along the Arroyo PROGRAM SUMMARY BY PROJECT The following are program summaries for each of the projects planned
Alaskan Way, Promenade, and Overlook Walk Final EIS Appendix D - Supplemental Draft EIS Comments and Responses October 2016.
 B-001-001 The use of Columbia Street for two-way transit was a decision made by King County Metro as part of its Southwest Transit Pathway evaluation. This project is separate from AWPOW. B-001-002 Modeling
A. INTRODUCTION B. PROJECT LOCATION
 Chapter 1: Project Description A. INTRODUCTION The Lower Manhattan Development Corporation (LMDC), a subsidiary of the New York State Urban Development Corporation, doing business as the Empire State Development
MODEL ACCESS MANAGEMENT PLAN MINNESOTA TRUNK HIGHWAY 7 COMPREHENSIVE PLAN AMENDMENT (HUTCHINSON SEGMENT)
") MODEL ACCESS MANAGEMENT PLAN MINNESOTA TRUNK HIGHWAY 7 (HUTCHINSON SEGMENT) COMPREHENSIVE PLAN AMENDMENT INTRODUCTION. The purpose of this plan is to provide consistent access management in the Trunk
MODEL ACCESS MANAGEMENT PLAN MINNESOTA TRUNK HIGHWAY 7 (HUTCHINSON SEGMENT) COMPREHENSIVE PLAN AMENDMENT INTRODUCTION. The purpose of this plan is to provide consistent access management in the Trunk
REPORT TO PLANNING COMMISSION
 CITY OF Meeting Date: October 25, 2011 Agenda Item: Community Development Department Planning Division P. O. Box 151560, San Rafael, CA 94915-1560 PHONE: (415) 485-3085/FAX: (415) 485-3184 Case Numbers:
Blue Line LRT Extension
 v e Noble Pkwy Noble Pkwy Xerxes Ave N Shingle Creek Penn Ave N Penn Ave N Fremont Ave N Lyndale Ave N S Washington Ave University Ave NE Blue Line LRT Extension LIGHT RAIL PLATFORM AND STATION DESIGN
STAFF RECOMMENDATION
 STAFF RECOMMENDATION NCPC File No. 1476 JOHN F. KENNEDY CENTER FOR THE PERFORMING ARTS ACCESS IMPROVEMENTS, PLAZA AND BUILDINGS 2700 F Street, NW Washington, DC Submitted by the Federal Highway Administration
Welcome. Comprehensive Plan & Transportation Plan Open House November 7, 2012
 Welcome Comprehensive Plan & Transportation Plan Open House November 7, 2012 Agenda Proposed future land use plan Comprehensive Plan strategies Traffic forecasts Future traffic operations Possible future
This Review Is Divided Into Two Phases:
 Semiahmoo Town Centre Review The purpose of this review: To review the Semiahmoo Town Centre Concept Plan, originally approved in 1993, to ensure that this centre will continue to serve the needs of South
Date: April 10, 2017 City Council Work Session April 24, 2017: Status Report on the Comprehensive Plan Update and Transportation Master Plan
 AGENDA REPORT To: From: By: Honorable Mayor and City Council Members Warren Hutmacher, City Manager Sharon Ebert, Director Community Development Date: April 10, 2017 Agenda: City Council Work Session April
Subject: City of Richfield Cedar Avenue Corridor Plan Comprehensive Plan Amendment, Review File No
 Committee Report Business Item No. 2017-21 Community Development Committee For the Metropolitan Council meeting of January 25, 2017 Subject: City of Richfield Cedar Avenue Corridor Plan Comprehensive Plan
FANSHAWE PARK ROAD/RICHMOND STREET INTERSECTION IMPROVEMENTS. PUBLIC INFORMATION CENTRE 2 June 16, 2016
 FANSHAWE PARK ROAD/RICHMOND STREET INTERSECTION IMPROVEMENTS Municipal Class Environmental Assessment PUBLIC INFORMATION CENTRE 2 June 16, 2016 ACCESSIBILITY Under the Accessibility Standards 2015 for
Issues Requiring Future Study
 Issues Requiring Future Study Transportation planning is an ongoing process that tends to identify new issues as it finds solutions for others. Some issues are so complex that a solution to one problem
BALLARD TO DOWNTOWN SEATTLE
 TRANSIT EXPANSION STUDY BALLARD TO DOWNTOWN SEATTLE 05/30/2014 FINAL FINAL REPORT This page intentionally left blank Table of Contents Executive Summary... 1 1 Introduction... 1 2 Previous Studies and
Vision & Land Use. Discussion. Historic Preservation Plan. Foggy Bottom Campus Plan:
 Vision & Land Use Foggy Bottom Campus Plan: 2006-2025 Historic Preservation Plan Discussion Community Meeting Presentation August 2, 2006 Presentation Format Overview Sherry Rutherford, GW Foggy Bottom
ITEM #8. Regional Smart Growth Program. Regional Smart Growth Program. Presentation Overview. Coast Highway Vision and Stategic Plan.
 Regional Smart Growth Program Economic Development Commission What is Smart Growth? Adopted as part of the Regional Comprehensive Plan (RCP) RCP provides vision for region based on Smart Growth and sustainability
CHARLES PUTMAN CHARLES PUTMAN AND ASSOCIATES, INC
 MEMORANDUM CHARLES PUTMAN & ASSOCIATES, INC. LAND DEVELOPMENT CONSULTANTS PLANNING ZONING PERMITTING 4722 NW Boca Raton Boulevard, Suite C-106 Boca Raton, Florida 33431 Phone: 561/994-6411 FAX: 561/994-0447
New York Avenue Streetscape and Trail Project Public Meeting #1 Summary
 New York Avenue Streetscape and Trail Project Public Meeting #1 Summary I. King Jordan Student Academic Center (SAC) Gallaudet University, Washington, DC February 23, 2017 Table of Contents 1.0 Introduction...
South Fulton Parkway Transit Feasibility Study
 South Fulton Parkway Transit Feasibility Study Study Purpose To conduct a high level assessment of potential transit improvements in the South Fulton Parkway Corridor through the evaluation of various
ARLINGTON COUNTY, VIRGINIA
 ARLINGTON COUNTY, VIRGINIA County Board Agenda Item Meeting October 15, 2005 DATE: September 28, 2005 SUBJECT: Request to Advertise the adoption of the 2005 Clarendon Sector Plan C. M. RECOMMENDATION:
ANC 2A Presentation. November 9, 2006
 ANC 2A Presentation November 9, 2006 Introduction & Overview Applicants Boston Properties and KSI Services (project developers) The George Washington University (land owner) 2.66 acre site (former GW hospital
2290+ STADIUM VILLAGE STATION ABOVE FIELD) (T.O "
 (T.O") 1 + PROPOSED o.8 UROU 3 15 + 32+ 32 CROSS-OVER PROPOSED o.8 PROPOSED o.8 CROSS-OVER DOUBLE at H ia ha LR w 1:1 33 + 3 5+ 33 34 h:\projects\\hi-mu\layou\feasibiliy SUDY\Enhanced\_alignment_comparison.dgn
1 + PROPOSED o.8 UROU 3 15 + 32+ 32 CROSS-OVER PROPOSED o.8 PROPOSED o.8 CROSS-OVER DOUBLE at H ia ha LR w 1:1 33 + 3 5+ 33 34 h:\projects\\hi-mu\layou\feasibiliy SUDY\Enhanced\_alignment_comparison.dgn
PLAN ELEMENTS WORKSHOP. April 5, 2016
 PLAN ELEMENTS WORKSHOP April 5, 2016 needs more housing. But there is no one-size fits-all solution. Every neighborhood has its own character. In some places, density is not only appropriate it is badly
Evaluation of Strobe Lights in Red Lens of Traffic Signals
 36 TRANSPORTATION RESEARCH RECORD 1495 Evaluation of Strobe Lights in Red Lens of Traffic Signals BENJAMIN H. COTTRELL, JR. Strobe lights are used as a supplement to the red lens to draw the attention
Planning & Zoning Board Meeting. DRAFT Comprehensive Transportation Plan Update, February 23, 2018 version
 Planning & Zoning Board Meeting DRAFT Comprehensive Transportation Plan Update, February 23, 2018 version May 10, 2018 Overview Overview of Agency Comments Overview of proposed modifications to the Draft
\JIL1 u ) i r. [ouu r fo. /~ap< s 4^ (*7 S (0. uul ooo
 i r. [ouu r fo. /~ap< s 4^ (*7 S (0. uul ooo") \JIL1 u ) [ouu r fo i r /~ap< s 4^ (*7 I S (0 uul ooo B ML000776E Consulting Engineers Land Surveyors * Professional Planners James P. Kovacs, P.E., L.S. Henry J. Ney, P.E. Peter R. Gallo, P.E. Andre Groenhoff
\JIL1 u ) [ouu r fo i r /~ap< s 4^ (*7 I S (0 uul ooo B ML000776E Consulting Engineers Land Surveyors * Professional Planners James P. Kovacs, P.E., L.S. Henry J. Ney, P.E. Peter R. Gallo, P.E. Andre Groenhoff
178 Carruthers Properties Inc.
 178 Carruthers Properties Inc. Planning Rationale for 178 Carruthers Avenue Site Plan Control Application June 2014 Table of Contents 1.0 Introduction 2.0 Overview of Subject Property 3.0 Current Zoning
Corridor Vision. 1Pursue Minnehaha-Hiawatha Community Works Project. Mission of Hennepin County Community Works Program
 1Pursue Minnehaha-Hiawatha Community Works Project Minnehaha-Hiawatha Community Works is a project within the Hennepin Community Works (HCW) program. The mission of the HCW program is to enhance how the
South Davis County COMMUNITY SPOTLIGHT
 South Davis County COMMUNITY SPOTLIGHT Davis/SLC Community Connector Bus Rapid Transit line connecting SLC & Davis County RTP Phase 1 Project Generate 3,100 average weekday riders Relieve congestion on
DRAFT Civic Center Station Area Plan. Executive Summary
 DRAFT Civic Center Station Area Plan Executive Summary This project is funded in part through the Metropolitan Transportation Commission s Station Area Planning Program. The preparation of this report
Creating Complete Roadway Corridors:
 Creating Complete Roadway Corridors: The AASHTO Guide to Transportation Landscape Architecture and Environmental Design NCHRP Project 15-33 Status Report AASHTO Standing Committee on Design Technical Committee
Tysons Circulator Study: Process and Preliminary Results Summary. March 2012
 Tysons Circulator Study: Process and Preliminary Results Summary March 2012 Background: 1. The Comprehensive Plan for the Tysons Corner Urban Center calls for a System of Circulators in Tysons Corner to:
Linking Land Use and Transportation
 Linking Land Use and Transportation NJ s Experience January 18, 2006 NYMTC - PFAC Mark Stout Planning & Development New Jersey Department of Transportation Where We Are Los Angeles, CA San Francisco, CA
I-84 HARTFORD PROJECT HARTFORD, CONNECTICUT DRAFT PURPOSE AND NEED STATEMENT
 I-84 HARTFORD PROJECT HARTFORD, CONNECTICUT DRAFT PURPOSE AND NEED STATEMENT October 2016 I. PROJECT BACKGROUND AND HISTORY The City of Hartford is the capital of Connecticut, and the largest employment
HIGHWAY INFLUENCES ON REGIONAL DEVELOPMENT. Tony Hartzel, TxDOT Northeast Texas Public Information Mgr.
 HIGHWAY INFLUENCES ON REGIONAL DEVELOPMENT Tony Hartzel, TxDOT Northeast Texas Public Information Mgr. Feb. 2, 2018 Highways and Redevelopment Central Expressway LBJ Freeway 2 What is Dallas CityMAP? Process
MONTGOMERY COUNTY METRO STATION AREA DESIGN CHARRETTE
 MONTGOMERY COUNTY METRO STATION AREA DESIGN CHARRETTE Shady Grove Metro Station Area Charrette Closing Presentation October 25-28, 2000 MONTGOMERY COUNTY, MD M-NCPPC Design Collective, Inc. Architects
North Macadam Transportation Development Strategy Summary of Past Studies DRAFT
 North Macadam Transportation Development Strategy Summary of Past Studies DRAFT Several previous studies were reviewed to gain an understanding and document the recent transportation issues in the North
PROJECT BACKGROUND. Preliminary Design Scope and Tasks
 PROJECT BACKGROUND Preliminary Design Scope and Tasks The purpose of this Study is the development of preliminary designs for intersection improvements for Trunk Highway (TH) 36 at the intersections of
Transportation. Strategies for Action
 Transportation A major priority for the Overlake Neighborhood is to develop a multimodal transportation system. To achieve this system, a balance has to be found among travel, circulation and access needs;
Olde Towne Vision Plan
 Olde Towne Vision Plan Introduction In 2016, the City of Bellevue will complete its move of City offices from Olde Towne Bellevue to its new municipal complex on Wall Street. The City intends to sell its
What s Up Next In The Seattle Squeeze. PSRC Transportation Policy Board April 11
 What s Up Next In The Seattle Squeeze PSRC Transportation Policy Board April 11 1 Current construction Alaskan Way Viaduct removal Removes the viaduct (including foundations and ramps) and restores the
Atlanta BeltLine. Subareas 9 & 10. Master Plan Updates. March 26, Washington Park Jamboree 1
 Atlanta BeltLine Subareas 9 & 10 Master Plan Updates March 26, 2018 Washington Park Jamboree 1 22 miles, connecting 45 neighborhoods 22 MILES of transit 46 MILES of streetscapes and complete streets 33
STAFF SUMMARY FOR S17-02 SPECIAL USE PERMIT APPLICATION
 APPLICATION SUMMARY Case Number: S17-02 Request: STAFF SUMMARY FOR S17-02 SPECIAL USE PERMIT APPLICATION SUP application in order to develop a convenience food store. Applicant: Property Owner(s): Cindee
C. Westerly Creek Village & The Montview Corridor
 C. Westerly Creek Village & The VISION Community Vision When the goals of the city are achieved Westerly Creek Village, a distinctive community defined by Montview Boulevard and Westerly Creek, is a strong
Lake Oswego to Portland Transit Project. Lessons Learned. John Cullerton Senior Project Manager, URS 2012 APTA/TRB Light Rail Conference
 Lake Oswego to Portland Transit Project Lessons Learned John Cullerton Senior Project Manager, URS 2012 APTA/TRB Light Rail Conference Overview Project Location and Context Corridor History and Project
SW Ecodistrict A VISION PLAN FOR A MORE SUSTAINABLE FUTURE June 25, 2013
 Urban Land Institute The Past, Present and Future of Sustainable Urbanism in Southwest DC SW Ecodistrict A VISION PLAN FOR A MORE SUSTAINABLE FUTURE June 25, 2013 Study Area The National Mall DOE FAA FAA
CHAPTER 7: Transportation, Mobility and Circulation
 AGLE AREA COMMUNITY Plan CHAPTER 7 CHAPTER 7: Transportation, Mobility and Circulation Transportation, Mobility and Circulation The purpose of the Transportation, Mobility and Circulation Chapter is to
December 1, 2014 (revised) Preliminary Report -- Thomas Jefferson Site Evaluation
 Preliminary Report -- Thomas Jefferson Site Evaluation") December 1, 2014 (revised) TO: FROM: RE Arlington County Board Thomas Jefferson Site Evaluation Working Group by Carrie Johnson, Chair Preliminary Report -- Thomas Jefferson Site Evaluation The Thomas
December 1, 2014 (revised) TO: FROM: RE Arlington County Board Thomas Jefferson Site Evaluation Working Group by Carrie Johnson, Chair Preliminary Report -- Thomas Jefferson Site Evaluation The Thomas
City of Farmington. Downtown Plan. Amendment to the 1998 Master Plan Adopted October 11, 2004
 City of Farmington Amendment to the 1998 Master Plan Adopted October 11, 2004 Introduction Planning Background 1 Scope and Components of the Plan Amendment 2 Concept Introduction 3 Plan Concepts 3 Conceptual
Secrest Short Cut and Monroe Expressway Small Area Plan AUGUST 29, 2018
 Secrest Short Cut and Monroe Expressway Small Area Plan AUGUST 29, 2018 Background and Process Monroe Expressway will be open by the end of 2018 Union County and Indian Trail identified a need to revisit
DOWNTOWN REDMOND LINK EXTENSION SEPA Addendum to the East Link Project Final Environmental Impact Statement
 DOWNTOWN REDMOND LINK EXTENSION 2018 SEPA Addendum to the East Link Project Final Environmental Impact Statement AUGUST 2018 Downtown Redmond Link Extension SEPA Addendum to the 2011 East Link Project
4/8/2015 Item #10D Page 1
 MEETING DATE: April 8, 2015 PREPARED BY: Christy Villa, Associate Civil Engineer DEPT. DIRECTOR: Glenn Pruim DEPARTMENT: Public Works CITY MANAGER: Larry Watt SUBJECT: NORTH COAST HIGHWAY 101 STREETSCAPE
Bypass #16 - Bend Parkway (new alignment for US 97) (MP )
 (MP )") Bypass #16 - Bend Parkway (new alignment for US 97) (MP 134.76-141.83) Description: The Parkway is on new alignment for US 97 through Bend. US 97 is a Statewide Highway on the National Highway System that
Bypass #16 - Bend Parkway (new alignment for US 97) (MP 134.76-141.83) Description: The Parkway is on new alignment for US 97 through Bend. US 97 is a Statewide Highway on the National Highway System that
Executive Summary. NY 7 / NY 2 Corridor
 Executive Summary NY 7 / NY 2 Corridor Transportation and Land Use Study December 2005 Prepared for: Town of Colonie Capital District Transportation Committee Prepared by: Introduction: Land use decisions
Citizen Concerns I-16/I-75 Interchange Design
 Citizen Concerns I-16/I-75 Interchange Design Project # NH-IM-16-1(92), NH-IM-16-1(131), NH-IM-75-2(177), & NM-16-1(104) P.I. # 311000, 311005, 311400, & 311410 Shirley Hills & North Highlands Neighborhood
PROJECT STATEMENT LOCATION/DESIGN PUBLIC HEARING. 19 th AVENUE NORTH EXTENSION PROJECT FROM SPRINGDALE DRIVE TO NORTH 2 ND STREET/U.S.
 PROJECT STATEMENT LOCATION/DESIGN PUBLIC HEARING 19 th AVENUE NORTH EXTENSION PROJECT FROM SPRINGDALE DRIVE TO NORTH 2 ND STREET/U.S. 67 HEARING LOCATION: ERICKSEN COMMUNITY CENTER 1401 11 TH AVENUE NORTH
Pelham Replacement Project: Campus Plan Amendment Remaining Residential/Campus Life Gross Floor Area (GFA) Under 2000 Campus Plan
 Under 2000 Campus Plan") : Campus Plan Amendment Remaining Residential/Campus Life Gross Floor Area (GFA) Under 2000 Campus Plan Total GFA under 2000 Campus Plan (Academic/Administrative & Residential/Campus Life) 320,000 Academic/Administrative
: Campus Plan Amendment Remaining Residential/Campus Life Gross Floor Area (GFA) Under 2000 Campus Plan Total GFA under 2000 Campus Plan (Academic/Administrative & Residential/Campus Life) 320,000 Academic/Administrative
MAIN STREET ECONOMIC DEVELOPMENT STRATEGY
 MAIN STREET ECONOMIC DEVELOPMENT STRATEGY A PATHWAY TO A BETTER POUGHKEEPSIE DRAFT Working Paper #2: Planning Strategies Submitted December 1 st, 2015 to the City of Poughkeepsie LAND USE LAW CENTER PACE
4.1 Build Alternative 1 Construction Phasing
 SECTION 4 Implementation Plan This section discusses potential segmentation of the build alternatives into multiple projects for implementation of improvements to the NSH from Rabbit Creek Road to 36th
St. Clair Avenue West Area Transportation Master Plan
 1 (Between Keele Street and Old Weston Road) Public Information Centre 1 December 2, 2015 2 Welcome Welcome to the first Public Information Centre for the St. Clair Avenue West Area. The panels will present
City of Toronto. Emery Village Transportation Master Plan
 City of Toronto Emery Village Transportation Master Plan May 2009 Emery Village Transportation Master Plan Toronto, ON May 2009 Consulting Inc. 100 York Blvd., Suite 300 Richmond Hill, ON L4B 1J8 Tel: