Landscape Biodiversity Planning & Design System. Technical Report
|
|
|
- Griffin Holt
- 5 years ago
- Views:
Transcription

1 Landscape Biodiversity Planning & Design System Technical Report Spring 2013

2 2000 Olympic Village, Newington at Homebush Bay, NSW, Australia


3 AECOM Executive Summary The landscape biodiversity planning system is an approach for planning, designing, and communicating the biodiversity and habitat benefits of a project. This landscape-based system can help guide habitat preservation, restoration, urban form, and landscape enhancements in urban or rural settings including urban forests, private and public realm landscapes, and community open space networks. This approach is proving to be a valuable tool for AECOM s sustainable communities and conservation development projects when there is a need to demonstrate measurable habitat benefits. Elements of the system have been applied in infill master planning efforts in urban environments in Singapore and Portland, Oregon, USA; greenfield conservation development projects in Toronto and California; and large-scale strategic planning efforts for municipalities and utilities. Leading sustainable communities are increasingly embracing native biodiversity within the built environment. While traditional regulatory drivers may focus on minimizing impacts to protected species and sensitive ecosystems, new approaches seek more comprehensive strategies. As land planners, we are often required to demonstrate how land development projects can not only protect, but improve local ecology. This is especially important in sensitive exurban locations at the urban fringe. While these sites may not be pristine natural areas, they often include remnant natural ecosystems, agricultural lands, or other natural resource management history, and are often the focus of land conservation efforts, greenbelts, or other urban growth management initiatives. The system can be a useful tool for quantitatively demonstrating the benefits of smart growth and conservation development as a means of enhancing biodiversity, ecosystem services, and achieving the conservation vision for these sensitive locations. This issue is not unique to greenfield locations, urban areas are also the focus of biodiversity improvement efforts. These projects often have goals surrounding providing equitable access to nature; balancing high density living while maintaining a connection with nature; maximizing benefits major infrastructure upgrades; climate change adaptation; are associated with popular design trends including biophilic design and Coastal Dune Management, Perth, Australia Landscape Biodiversity Planning and Design System C


4 Existing Condition LBI Score: 0.89/5 Final Concept LBI Score: 1.93/5 LBI Scores LBI Scores Score 1 Score 1 Score 2 Score 2 Score 3 Score 3 Score 4 Score 4 Score 5 Score 5 Landscape Biodiversity Index scoring for existing and planned landscapes in Portland, OR. A more than 100% increase in both landscape biodiversity and residential population density was demonstrated. biomimicry; or as a part of rating systems such as the living building challenge. Many of the recent high-profile sustainable urban development concepts, including the 2008 Beijing and 2012 London Olympics, have developed unique architectural identities and the highest performing sustainability concepts by rigorously designing for ecology and biodiversity in very urban contexts. This system was originally developed in response to the need for a quantitative measurement protocol for biodiversity as a part of sustainable communities planning efforts using AECOM s Sustainable Systems Integration Model (SSIM TM ). SSIM efforts address the multiple themes of sustainability (e.g. transportation, energy, water, landscape, social, etc), and include quantitative measurements of a variety of sustainability performance indicators such as greenhouse gas emissions, energy and water use, hydrologic indicators, etc. The landscape biodiversity planning and design system and Landscape Biodiversity Index (LBI) now allows us to address biodiversity in a quantitative way along with these other indicators. Such quantitative measurements allow projects to develop detailed, comprehensive, and defensible estimates of performance of design solutions in terms of both benefits and costs. The LBI scoring system and measurement protocol tracks performance of multiple indicators (typically up to 10 or more) of landscape biodiversity. Indicators include the structural and pattern characteristics of landscapes such as priority species, habitat quality, connectivity, and total habitat area. Indicator importance weighting, measurement metrics, performance thresholds, and scoring criteria are defined by the planning team and calibrated for each project context and local ecology. Scoring criteria are based on habitat requirements of target species, local ecosystem characteristics, policies, empirical data when available, or other built or natural landscape characteristics. Because the system is calibrated for local ecology and priorities, it can be applied anywhere and performance relative to local biodiversity is assessed. In other words, the LBI emphasizes how well a project protects and enhances its local biodiversity. LBI scores are evaluated using a combination of Excel and GIS-Based calculations. Index scores and maps can be a powerful tool for evaluating alternative scenario performance, plan refinement, and external communication of project benefits. Indicator weighting and performance thresholds can also be adjusted based on stakeholder input, making the tool useful for project negotiations and gaining stakeholder buy-in. The first step in applying the system involves site calibration to determine priority areas for preservation, to frame goals for biodiversity enhancement, and to calibrate LBI scoring criteria to local ecology and priorities. At this point the system can be used to identify areas for preservation, management priorities, or inform the development of conceptual landscape design concepts. A second step can include developing alternative design and/ D Landscape Biodiversity Planning and Design System
5 AECOM Overarching Landscape Ecology Indicators Indicator Categories Sample Metrics Assumption 1 2 Habitat Area % project area preserved area of landscape within development The total amount of landscape area is the foundation for biodiversity. More landscape area is assumed to indicate more potential for biodiversity, whether it is preserved, restored, or provided through cultural landscapes. The amount of preservation, outside of a planned development footprint, is often an early conservation in land use planning. Landscape footprint within a development is often an important consideration that is closely related to many other community sustainability indicators and urban design considerations. Percent landscape area on parcels and within land uses is often required by codes and is also a foundation for potential biodiversity in more urban areas. 3 4 Habitat Variety % area priority habitats avoided % historic habitat types present Priority habitats, often guided by regulatory priorities, cultural preferences, or management practices, are often the most important biodiversity indicator considered. The variety of native habitat types, often relative to historical site conditions or other benchmarks, provide an indication of the overall level of biodiversity that may exist at the site. 5 6 Habitat Quality % structural layers present in landscapes # target plant species within structural layers Whether plants are native or non-native, the presence or absence of the vegetation and ecosystem structural layers, as compared to layers present in native ecosystems, is assumed to indicate value for native biodiversity. For example, in forests, layers could include canopy, sub-canopy, understory, and ground cover. Hydrological, physiographic, soil or other structural layers may also be considered. Layers may be emphasized that support target species. The existing or planned plant species composition, often relative to the species composition of structural layer in a native ecosystem benchmark, is assumed to indicate overall biodiversity. Plant species are emphasized because they can be controlled and measured in both existing and planned landscapes, whereas presence of faunal species cannot be measured as concretely in planned landscapes. Target species may be emphasized within layers. 7 Habitat Patch/ Corridor Size and Shape 8 habitat patch area habitat corridor width Larger patches have less edge relative to area, providing more interior habitat conditions for native biodiversity. Larger patches provide more area for natural processes such as succession, disturbance, dispersal, or continuous areas of natural habitat structure and larger populations of species, all important indicators of higher biodiversity. Corridors provide movement and migration of species between patches. As corridors become wider they exhibit greater interior conditions and the ecological characteristics of a patch, allowing species adapted to interior habitat conditions to move and migrate Habitat Connectivity distance gap between patch or corridor network consistency Habitat patches or corridors that are closer in proximity to others are assumed to indicate higher biodiversity for both habitats. Visual continuity, species mobility characteristics, dispersal strategies, and adjacent land use character can also impact biodiversity benefits of habitat proximity. This indicator addresses the ability of species to move between habitat patches and between corridor segments. The biodiversity value of habitat areas can be increased or decreased depending on the quality of habitats in its broader network. In other words, a low quality habitat patch or corridor that is near a high quality patch or corridor is assumed to be more valuable than if the same patch or corridor were near a another low quality patch or corridor. This indicator also addresses the ability of species to move along networks of habitat stepping stones or corridors. Additional Potential Landscape Ecology Metrics Structural Metrics priority species / habitats structural quality population size rarity cultural value / mgn t capability re-creatability endemism species richness Pattern Metrics ecosystem benchmark habitat type balance connectivity within habitat type connectivity across habitat type off-site connectivity ecotones preserved natural processess accomodated matrix interactions priorities Sample landscape biodiversity indicators and metrics. These and others can combined into the Landscape Biodiversity Index Landscape Biodiversity Planning and Design System E


6 or program scenarios and comparing LBI performance for each. Many projects seek to create a plan that achieves improved biodiversity value relative to the existing condition, a historic natural condition, or a business as usual development benchmark scenario. A final step can include assessing and optimizing cost/benefit relationships, selecting and documenting a preferred program scenarios, crafting detailed landscape designs or design guidelines that achieve LBI performance targets, and creating implementation and monitoring plans. In design projects, the LBI can help create and implement high performance landscape master plans and ecological enhancement strategies. In policy projects, the LBI can be used as a basis for decision support tools or design guidelines for individual parcels, land uses, or zones to achieve a desired level of biodiversity performance across an entire community, planning area, or region. The LBI can also be used as a standard to compare performance between multiple projects across municipalities, regions, or globally. An important benefit of the LBI is that it allows many opportunities for calibration of metrics for specific contexts considering the wide variety of conservation priorities, local ecosystem characteristics, and project economics. This detailed approach can provide defensible measurements and guide design strategies to improve project performance, help communicate project benefits, and can ultimately support wider implementation of conservation development, smart growth, large-scale landscape, and sustainable communities projects. JVC Master Plan, Guadelajara, Mexico. Urban form creates an ecological transition, gateway and overall focus on the adjacent National Park. F Landscape Biodiversity Planning and Design System

7 AECOM Conservation development framework assessment using the Landscape Biodiversity Index. Past applications range in scale from 10 s to 10,000 s of hectares. Landscape Biodiversity Planning and Design System G

8 H Civano Landscape Master Plan Biodiversity - project Planning by Andres and Duany, Design Stefanos SystemPolyzoides, and William McDonough and others


9 AECOM Landscape Biodiversity Planning and Design System Introduction Many leading sustainable communities are embracing native biodiversity within the built environment. Traditional regulatory drivers may focus on minimizing impacts to protected species and sensitive ecosystems. This system is designed to address these drivers, but also expands them to achieve more comprehensive biodiversity strategies that demonstrate enhancement in addition to minimizing negative impacts. This is especially important in increasingly sensitive exurban, or greenfield, development locations at the urban fringe. While these sites may not be pristine natural areas, they typically include a combination of remnant natural ecosystems, agricultural lands, or other natural resource management history, and are often the focus of land conservation efforts, greenbelts, or other urban growth management initiatives. This issue is not unique to greenfield locations, urban areas are also the focus of biodiversity improvement efforts for a variety of reasons including: providing equitable access to nature; balancing high density living while maintaining a connection with nature; or associated with architectural trends including biophilic design, biomimicry, or rating systems such as the living building challenge. Many of the recent high-profile sustainable urban development concepts, including the 2008 Beijing and 2012 London Olympics, have The landscape biodiversity planning system assesses the value of existing, preserved, and new landscapes for biodiversity potential. Ecosystems Prairie HIlly Scrub Savanna Riparian Forest Emergent Wetland Landscape Biodiversity Planning and Design System 1

10 developed unique architectural identities and the highest performing sustainability concepts by rigorously designing for ecology and biodiversity in very urban contexts. The system was developed in response to the need for a quantitative measurement protocol for biodiversity as a part of sustainable communities planning efforts using AECOM s Sustainable Systems Integration Model (SSIMTM). SSIMTM efforts address the multiple themes of sustainability -- transportation, energy, water, landscape, social, and so forth -- and include quantitative measurements of a variety of sustainability performance indicators such as greenhouse gas emissions, energy and water use, hydrologic indicators, etc. The landscape biodiversity planning and design system and associated Landscape Biodiversity Index (LBI) allows biodiversity to be measured in a quantitative way along with these other indicators. Such quantitative measurements allow projects to develop detailed and defensible estimates of sustainability performance in terms of both benefits and costs. The system and LBI can assist in designing and comparing performance of alternative biodiversity strategies in landscape designs, biodiversity policies, or landscape master plans for neighbourhoods, communities, or municipalities. At the community planning level, the LBI helps determine the total amount and appropriate design of habitat to include on individual parcels, in the public realm, or in conservation areas to achieve a desired level of performance across an entire community. At the site design scale, the LBI can help prioritize specific plant species, landscape patterns or the structural design characteristics needed to achieve habitat and biodiversity objectives in landscape designs. The system and index are landscape based, focusing on the ecological and biodiversity characteristics of historic, existing, or planned landscapes as habitat for both flora and fauna. The system emphasizes biodiversity in terms of native biodiversity and ecosystems, although non-native biodiversity may also provide benefits in some situations. The system also emphasizes the role of landscape US Census Bureau, Washington DC pattern in providing biodiversity supporting functions including dispersal, habitat connectivity, predator/pray relationships, migration, potential habitat sinks, and natural processes like seasonal flooding and succession. In order to emphasize native biodiversity and local ecology, a key characteristic of the methodology is that it requires calibration according to specific project goals and local ecological characteristics. Depending on local priorities and characteristics, in addition to species richness or habitat value, biodiversity strategies can also be calibrated to emphasize 2 Landscape Biodiversity Planning and Design System

11 AECOM other important ecosystem services cobenefits such as carbon sequestration, water quality improvement, local climate control/ urban heat island mitigation, or other sociocultural benefits. Assumptions Some overarching assumptions of the system are that landscapes increase and sustain biodiversity by providing ecosystem characteristics for both flora and fauna that: Natural Areas upland native forest native lowland forest emergent freshwater wetland lake HABITAT STRUCTURE provide habitat for cover, foraging, and other life history characteristics including key species interactions; facilitate species movement, migration, dispersal, succession, and establishment within and through a landscape; Park Landscapes + = HABITAT PATTERN PLANNED LANDSCAPE BIODIVERSITY PERFORMANCE provide natural patterns and processes that species are adapted to including seasonal flooding, habitat structure, habitat adjacencies, shading and light; or sequestration forest passive landscape reduce threats to wildlife survival including habitat sinks, invasive species, inappropriate land uses adjacent to habitat, and light pollution. The system assess these characteristics within any type of landscape from natural to urban, and bridges landscape design themes including preservation, restoration of native ecosystems, non-native landscapes, or contemporary architectural landscapes that utilize native or non-native plants. Urban Landscapes path architectural native landscape elevated greenery bio-swale While the system may be used to target particular habitats, species, or overall biodiversity, it emphasizes plant species and landscape attributes as the primary units of measurement and assumed indicators of overall floral and faunal biodiversity. This is because landscape attributes can be consistently measured from existing condition, This landscape biodiversity planning and design system considers all types of landscapes from natural to constructed Landscape Biodiversity Planning and Design System 3
 attributes: habitat types, habitat structure, and")


12 can be controlled during the design and planning process, and can be most easily measured and monitored after implementation. The system assumes two primary categories of landscape attributes as the key indicators of overall biodiversity potential: Structural (vertical) attributes: habitat types, habitat structure, and plant species composition Alternative 1 Alternative 2 Suitability +++ Pattern (horizontal) attributes: the total amount of habitat and the shape, size, and connectivity of habitat Site 1 Site 2 Additional attributes are hybrids and consider a combination of pattern and structural indicators. The attributes and indicators are described in the table on the following page. Projects may choose to measure all or a select number of indicators depending on project priorities. ++ The system is not designed to for measuring biodiversity in terms of maximizing total species richness, although that attribute may be emphasised, rather, it places value on how close a landscape resembles local native ecosystems; how well connected the landscape is to other landscapes and habitats; and/or the presence of an any culturally or environmentally important species or habitats. Therefore, an essential principle of the system is that biodiversity of a planned or preserved landscape is measured relative to a local native ecosystem biodiversity benchmark. By calibrating the system to the local ecosystems, it can be a useful tool to compare the native biodiversity value between project Region 1 Region 2 The LBI is most suited for comparing alternatives for a single site. Regional calibration could allow effective use at the city or regional scale to compare projects within or between regions. + 4 Landscape Biodiversity Planning and Design System
13 AECOM Overarching Landscape Ecology Indicators Indicator Categories Sample Metrics Assumption 1 2 Habitat Area % project area preserved area of landscape within development The total amount of landscape area is the foundation for biodiversity. More landscape area is assumed to indicate more potential for biodiversity, whether it is preserved, restored, or provided through cultural landscapes. The amount of preservation, outside of a planned development footprint, is often an early conservation in land use planning. Landscape footprint within a development is often an important consideration that is closely related to many other community sustainability indicators and urban design considerations. Percent landscape area on parcels and within land uses is often required by codes and is also a foundation for potential biodiversity in more urban areas. 3 4 Habitat Variety % area priority habitats avoided % historic habitat types present Priority habitats, often guided by regulatory priorities, cultural preferences, or management practices, are often the most important biodiversity indicator considered. The variety of native habitat types, often relative to historical site conditions or other benchmarks, provide an indication of the overall level of biodiversity that may exist at the site. 5 6 Habitat Quality % structural layers present in landscapes # target plant species within structural layers Whether plants are native or non-native, the presence or absence of the vegetation and ecosystem structural layers, as compared to layers present in native ecosystems, is assumed to indicate value for native biodiversity. For example, in forests, layers could include canopy, sub-canopy, understory, and ground cover. Hydrological, physiographic, soil or other structural layers may also be considered. Layers may be emphasized that support target species. The existing or planned plant species composition, often relative to the species composition of structural layer in a native ecosystem benchmark, is assumed to indicate overall biodiversity. Plant species are emphasized because they can be controlled and measured in both existing and planned landscapes, whereas presence of faunal species cannot be measured as concretely in planned landscapes. Target species may be emphasized within layers. 7 Habitat Patch/ Corridor Size and Shape 8 habitat patch area habitat corridor width Larger patches have less edge relative to area, providing more interior habitat conditions for native biodiversity. Larger patches provide more area for natural processes such as succession, disturbance, dispersal, or continuous areas of natural habitat structure and larger populations of species, all important indicators of higher biodiversity. Corridors provide movement and migration of species between patches. As corridors become wider they exhibit greater interior conditions and the ecological characteristics of a patch, allowing species adapted to interior habitat conditions to move and migrate Habitat Connectivity distance gap between patch or corridor network consistency Habitat patches or corridors that are closer in proximity to others are assumed to indicate higher biodiversity for both habitats. Visual continuity, species mobility characteristics, dispersal strategies, and adjacent land use character can also impact biodiversity benefits of habitat proximity. This indicator addresses the ability of species to move between habitat patches and between corridor segments. The biodiversity value of habitat areas can be increased or decreased depending on the quality of habitats in its broader network. In other words, a low quality habitat patch or corridor that is near a high quality patch or corridor is assumed to be more valuable than if the same patch or corridor were near a another low quality patch or corridor. This indicator also addresses the ability of species to move along networks of habitat stepping stones or corridors. Additional Potential Landscape Ecology Metrics Structural Metrics priority species / habitats structural quality population size rarity cultural value / mgn t capability re-creatability endemism species richness Pattern Metrics ecosystem benchmark habitat type balance connectivity within habitat type connectivity across habitat type off-site connectivity ecotones preserved natural processess accomodated matrix interactions priorities Landscape Biodiversity Planning and Design System 5
 meters 0 10 20 30 40 50 100 The LBI scoring system is applied to all landscape areas, regardless of landcover type.")
14 INDEX SCORES lake architectural native wetland path architectural native landscape elevated greenery bio-swale Habitat Structure Metrics Score 1 Score 2 + = Score 3 Habitat Pattern Metrics Score 4 Score 5 ecosystem planning area landscape type biodiversity score (ibp) meters The LBI scoring system is applied to all landscape areas, regardless of landcover type. Scoring considers pattern and structural attributes that are calibrated for the project based on target local ecosystems or habitats. alternatives; between different projects within an ecoregion; or possibly even across regions. To date, the system has been applied primarily to compare project alternatives for single project sites. Many of the indicators are based on the widely accepted principles of landscape ecology and conservation biology presented in Landscape Ecology Principles in Landscape Architecture and Land-Use Planning (Dramstad et al. 1996). A Landscape Biodiversity Index (LBI) has been developed to systematically measure performance according to the indicators. Because this is a planning tool, and projects may not built at the time of assessment, the measurement is based on potential rather than actual biodiversity present, with the exception of baseline measurements of existing and historic site conditions which measure exiting landscape attributes. Structural and pattern scoring criteria and performance metrics for indicators, described in detail in the following pages, are defined, or calibrated, for the project area by the planning team based on measurements of existing ecosystems either performed through field measurements; based on project precedents; found in empirical literature; or based on expert opinion. LBI scores of 1 (lowest biodiversity potential) to 5 (highest biodiversity potential) are possible for each indicator and are weighted and assessed for each landscape area of a project. Since LBI scoring criteria and thresholds are based on specific, defined pattern and structural attributes, and are calibrated based on existing and target native ecosystems or species for a the project area, the approach can effectively compare biodiversity potential between plan scenarios. The following pages describe the LBI metrics and general performance measurement protocols. While there are more nuanced details of project calibration, performance measurement, and alternative approaches to planning steps have not been included, the following tables outline the general performance metrics and scoring system. These aspects are more fully described in project documentation materials that may be available upon request. The metrics tables are 6 Landscape Biodiversity Planning and Design System


15 AECOM Attribute Performance Measurement Habitat Priorities 1 These indicators are used to value existing habitats for preservation or for prioritizing target habitat characteristics of planned landscapes. Priorities are established by the project team for each of the criteria. Priority categories are weighted and assigned to habitat types. Priorities are considered when establishing targets for habitat variety in the following attribute categories. Indicators Metric Performance Thresholds target species, structural quality, rarity, cultural value, spp. richness, re-creatability, endemism Criteria Importance Weighting target species a% structural quality b% rarity c% cultural value d% SPP. species richness e% re-creatability f% endemism g% target species structural quality rarity cultural value re-creatability endemism species richness Notes Landscape Biodiversity Planning and Design System 7


16 Attribute Habitat Variety 2 Performance Measurement The type and area of each habitat or ecosystem, either existing or planned, is measured. Historic, e.g. pre-settlement, habitat types that may no longer occur on the site may also be mapped and used as a benchmark. For scoring to be effective, all landscapes, even architectural landscapes or monocultures, must be placed into a habitat type category. The variety and area of habitats created or preserved relative to the benchmark occurrence is measured. Indicators Metric Performance Thresholds variety and area of habitat types Criteria Importance Weighting % target variety 1/5 % target variety 2/5 % target variety 3/5 type 1 (e.g. floodpalin forest) type 2 (e.g. prairie) type 3 (e.g. savanna) type 4 (e.g. upland forest) type 5 (e.g. shrubland) % target variety 4/5 % target variety 5/5 Notes 8 Landscape Biodiversity Planning and Design System


17 AECOM Attribute Performance Measurement Habitat Quality: Structural Layers 3 The structure of landscapes, whether it be existing, planned, or historic, can be systematically measured. This attribute is primarily used to assess the structural diversity of designed or planned landscapes, but may also used assess the structural quality of existing landscapes and suitability for preservation. Structural measurements are compared to native ecosystem types that most closely resemble the landscape of interest. The percentage of structural layers present in the landscape is measured. Native ecosystem benchmark structural measurements may be determined by literature review or field measurements. Planned landscapes must be designed to a level of detail sufficient to assess these structural attributes or they must be specified in design guidelines. The systems may also be applied to wetland or water body types. Indicators Metrics Performance Thresholds presence of structural layers in habitat types Vegetation Structure : type 4 - dryland forest example <e% e%-f% f%-g% g%-h% h%-100% canopy sub-canopy understory shrub layer croundcover intact soil structure key natural process yes/no yes/no yes/no yes/no yes/no yes/no yes/no Notes Landscape Biodiversity Planning and Design System 9

18 Attribute Performance Measurement Habitat Quality: Plant Species Composition 4 The species composition of structural layers in the landscape of interest is measured for plant species composition relative to the native ecosystem benchmark for the structural layer. Plant species are the preferred indicator to measure as opposed to faunal species because plant species can be more easily controlled and measured in plans for future landscapes. Indicators Metrics Performance Thresholds plant species composition within structural layers Plant Species Composition: Understory Layer - Type 4 >a% of plant species composition <a% a-b% b-c% c-d% d-100% a-b% of plant species composition b-c% of plant species composition c-d% of plant species composition d-100% of plant species composition Notes 10 Landscape Biodiversity Planning and Design System


19 AECOM Attribute Performance Measurement Habitat Area 5 The total area of each structural score category is measured across the parcels of the project area for the existing, planned, or historic benchmark condition. Preserved landscapes are measured separately from planned new landscapes. Indicators Metrics Performance Thresholds precent preserved or created landscape area % project area preserved vs developed preservation / open spacearea LBI score % area of landscape within developement area development area LBI score % landscaped area % landscaped area % landscaped area % landscaped area % landscaped area Notes Landscape Biodiversity Planning and Design System 11

20 Attribute Habitat Shape and Size 6&7 Performance Measurement Habitat Shape: Patches are assumed to be less than 2x wide as long and include a higher proportion of interior conditions. Corridors are assumed to be more than 2 times longer than they are wide and provide a higher ratio of edge conditions compared to interior conditions. (Specifically, patch width at narrowest point is no less than the square root of ½ of the width at the widest point.) Habitat Size: Size criteria and thresholds are calibrated based on local ecological characteristics, requirements of target species, or keystone habitat variables such as canopy height or canopy tree diameter. The size threshold relationships indicated below are often used, however they may be adjusted based on specific site conditions or available empirical literature. Indicators Metrics Performance Thresholds habitat patch size; habitat corridor width patch size <w² meters w²-x² meters x²-y² meters y²-z² meters >z² meters corridor width < w/ 2 meters w/ 2 to x/ 2 meters x/ 2 to y/ 2 meters y/ 2 to z/ 2 meters > z/ 2 meters Notes 12 Landscape Biodiversity Planning and Design System


21 AECOM Attribute Habitat Connectivity 8&9 Performance Measurement Spacing thresholds may be based on data from empirical literature. Spacing thresholds can also be based on assumed widths of sidewalks, roads, and other features that will likely bisect habitat areas. Visual continuity, species mobility characteristics, dispersal strategies, and adjacent land use character can also become the basis for habitat separation performance. Network consistency performance scores are measured by considering the score of adjacent patches or corridors. Cumulative low scores of the nearest adjacent areas reduces the value of the area of interest in terms of it s network, stepping stone, or linkage value. Indicators Metrics Performance Thresholds spacing between patch or corridor; network consistency (quality of habitat along a network of habitat areas) patch or corridor spacing network consistency <s >s-t distance from adjacent patch or corridor w-4 w-3 w-2 >t-u >u-v >v w-1 w decending network score trend Notes Landscape Biodiversity Planning and Design System 13


22 Attribute Performance Measurement Ecosystem Type Pattern 10 The spatial pattern of habitat types is also considered when prioritizing habitat locations. The presence of ecotones along the boundaries between ecosystem or habitat types; the inclusion of corridors or patches that transect across multiple ecosystem/habitat types; and ensuring that the layout of habitat types provides broader connectivity within the regional patch-corridor matrix is also considered. Additionally, the character of the surrounding land use matrix, and its effects such as light, noise, pets, roadways, etc., are important in locating the habitat network. The level of occurrence of these indicators is measured and importance is weighted based on project priorities. Indicators Metrics Performance Thresholds habitat type connectivity, adjacent land use, ecotones, off-site connections Criteria: Type Pattern % achieved habitat type diversity b% connectivity w/in type c% connectivity cross type d% ecosystem benchmark habitat type diversity connectivity within habitat type connectivity across type off-site connectivity e% ecotones preserved/ connected e% target landscape process flows f% adjacent land use suitibility g% weighted total type-pattern achievement average % off-site connectivity ecotones preserved natural processes accomodated matrix interactions weighed Notes 14 Landscape Biodiversity Planning and Design System
23 AECOM Sample Landscape Biodiversity Index (LBI) Scoring Threshold Metrics (thresholds calibrated based on ecological context) Indicator Importance Weight? LBI Indicators Score 1 Score 2 Score 3 Score 4 Score 5 weight 1&2: Habitat type variety/priority score >a% of target variety/priority a%-b% of target variety/ priority b%-c% of target variety/ priority c%-d% of target variety/ priority d%-100% of target variety/ priority weight 3: Habitat structural layers >e% of structural layers present e%-f% of structural layers present f%-g% of structural layers present g%-h% of structural layers present h%-100% of structural layers present weight 4: Plant species composition >i% of target species i%-j% of target species j%-k% of target species k%-l% of target species l%-100% of target species weight 6: Patch size <w² meters w²-x² meters x²-y² meters y²-z² meters >z² meters weight weight 7: Corridor width 8: Patch/corridor spacing < w/ 2 meters w/ 2 to x/ 2 meters x/ 2 to y/ 2 meters y/ 2 to z/ 2 meters > z/ 2 meters <s meters s-t meters t-u meters u-v meters >v meters weight 9: Network consistency adjacent habitat area score is 1 and weighted average of structure and pattern indicator scores is 1 adjacent habitat area score is 2 & weighted average of structure and pattern indicator scores 2 or adjacent habitat area score is 1 and weighted average of structure and pattern indicator scores is 3 adjacent habitat area score is 3 & above cumulative is 3 or adjacent habitat area score is 1 and above cumulative is 4 or adjacent habitat area score is 2 and weighted average of structure and pattern indicator scores is 5 adjacent habitat area score is 4 & above cumulative is 4 or adjacent habitat area score is 3 and weighted average of structure and pattern indicator scores is 5 adjacent habitat area score is 5 & weighted average of structure and pattern indicator scores is 5 weight 10: Ecosystem pattern achievement weighted average % of metrics <m% weighted average % of metrics = m%-n% weighted average % of metrics = n%-o% weighted average % of metrics = o%-p% weighted average % of metrics = q%-100% summary 5: Total area score indicator weighted average of scored areas/total project area indicator weighted average of scored areas/total project area indicator weighted average of scored areas/total project area indicator weighted average of scored areas/total project area indicator weighted average of scored areas/total project area This is a sample of the scoring rules used in the LBI. Scenario measurement and scoring is assessed using a combination of GIS and Excel-based tools. Other scoring rule categories used in the LBI include rules for larger community and regional open space. Landscape Biodiversity Planning and Design System 15


 Measure existing, historic or other relevant benchmark LBI scores 4)")

24 followed by general description of the system application process for projects. Application Applying the landscape biodiversity planning system includes the following analysis and planning steps. While this discussion focuses on performance measurement, it ideally includes a parallel design process to ensure that performance is maximized and the most efficient and appropriate strategy is implemented. Step 1) Site Assessment The process begins by building an understanding and inventory of local biodiversity and ecosystems. Both existing and historic ecosystems, sometimes know as pre-settlement ecosystems, are evaluated. Considering climate change, it may also be appropriate to consider future change to local ecosystems and species range shifts. These ecosystem and habitat benchmarks provide a framework for preservation, restoration, landscape design strategies, and performance measurement. Local landscape ecosystem maps, structural profiles, and species richness levels as show on the adjacent page are valuable tools for project benchmarking and + 1) Site Assessment of site conditions and local ecosystem attributes 2) Calibrate LBI scoring system based on local ecosystem attributes and project goals 3) Measure existing, historic or other relevant benchmark LBI scores 4) Measure alternative master plan scenarios for how well they preserve existing biodiversity and establish new habitats. lake architectural native wetland path architectural native landscape elevated greenery bio-swale native dryland forest elevated greenery ) If multi parcel planning project, measure LBI score of design guideline strategies for development parcels and public realm. 6) If specific site design is created, measure actual scores of landscape design and preservation solutions. 16 Landscape Biodiversity Planning and Design System


.")
25 AECOM species richness scenario 1 scenario 2 scenario 3 scenario 4 scenario 5 landform low medium-low medium medium-high high floodplain landscape ecosystems species richness alluvial plain gently sloped desert plain transitional uplands rugged highlands LBI preservation score Baseline ecosystem attributes such as species richness, landforms or landscape ecosystems are benchmarks for applying the system. The above sub-regional scale diagrams and conceptual LBI scores for open space scenarios were adapted from analysis done for Superstition Vistas Regional Growth Scenarios, AZ, USA. Gray areas indicate development footprints of growth scenarios. (source: org/wp-content/uploads/environment_edaw_2009.pdf). Ecosystem map and structural profiles for the Yongsan Park Ideas Competition, Seoul, Korea Landscape Biodiversity Planning and Design System 17

26 LBI calibration. More basic levels of inventory and mapping may also be appropriate depending on the level of information available and project priorities. Ecosystem mapping is performed at multiple spatial scales, from regional to local, in order to understand the nested hierarchy of processes and patterns occurring across the site and influencing biodiversity. Priority species, habitats, or ecosystems including culturally significant features are also identified. These maps and profiles become the basis for design strategies and model calibration. Step 2) LBI Model Calibration Based on the structural and pattern attributes of the local ecosystems, habitats and target species, the LBI scoring system is calibrated for the project by determining scoring thresholds (scores 1 through 5) for the metrics listed on the previous pages. All or a select number of indicators may be assessed for projects depending on the level of effort that the project desires to support. Performance thresholds can be based on empirical research, local best practices, or may be developed specifically for a site based on expert opinion. Because empirical research is often rare for many target habitats and regions, thresholds can be based on assumed keystone structural, pattern, or process attributes of local ecosystems or land use forms. For example, corridor width thresholds could be based on a native forest tree crown width and height (as was done for the Jurong Lake and Portland applications); edge effect distances may be known for some target species; a natural process such flood regimes and natural floodplain terracing structure; or even typical widths of habitat connectivity barriers including roads or sidewalks. Using the keystone habitat attribute of forest canopy tree crown radius of 6 meters, as was done at Jurong Lake, pattern indicators thresholds based on multiples of 6 were used to indicate the number of trees wide habitat patches or corridors were and the amount of interior vs. edge conditions for biodiversity. Different sets of thresholds for each indicator may also be developed for major land use categories. For example, different design constraints, ecological functions, implementation practices, or property rights may occur in conservation areas, pubic realm and parks, or on private parcels and score thresholds may be adjusted accordingly. For example, major open space areas tend to provide larger more contiguous habitats and higher functioning ecosystems, providing a more significant contribution to regional biodiversity. On private parcels, habitats may be smaller, more fragmented, and more architectural in character, and scoring may be adjusted accordingly. Some value may also be added for smaller habitats in developed areas that may be of higher socio-cultural value because of improved interaction with nature may result in increased conservation behaviour. The diagrams on the following pages describe some of the LBI scoring thresholds that were used for the Jurong Lake application. Calibrating the LBI for a project area requires assessment of the ecological role that the area plays within the broader region, especially considering habitat connectivity, regional rarity of ecosystems, and community access to nature. 18 Landscape Biodiversity Planning and Design System

27 AECOM Step 3) Existing Condition LBI Baseline Measurement A goal of many projects is to create a plan that achieves improved biodiversity and ecosystem function from the baseline existing condition. This baseline LBI score, or other benchmarks including the historic native ecosystem condition, or a business as usual scenario are typically used as benchmarks by which achievement of performance goals are measured. Therefore, one key performance indicator of projects tends to be: Key Performance Indicator: Percent change in the overall LBI for onsite habitats compared to the historic natural (pre-settlement), existing site, or business as usual master plan condition. The first step in calibrating the LBI and establishing biodiversity performance targets includes a relative biodiversity valuation process for the existing condition (i.e. measurement of the baseline LBI score) to determine priority areas for preservation, to frame goals for biodiversity enhancement, and to measure project improvement. The existing condition benchmark analysis involves performing an inventory of all areas of the site and scoring each area based on the scoring criteria included on the previous pages. The baseline LBI score for a site provides an indication of its existing relative value to biodiversity. Generally, urban sites with little or no valuable habitat will have LBI scores of between 0 and 1, whereas a natural site in a wilderness location could achieve a LBI Case Study: Jurong Lake District, Singapore The Jurong Lake District in Singapore was the initial project where the LBI was developed and applied (at the time the LBI was called the Index of Biodiversity Potential - IBP). The LBI was part of an AECOM led comprehensive sustainability planning effort for the District. The 300+ ha site included a small amount of existing wetland and secondary forest habitats and was envisioned by the client to be a global exemplar for sustainable development. The LBI process supported development of the overall master plan and park scenarios, a biodiversity target of a 25% improvement from the existing condition, and parcel-level LBI design guidelines for landscapes to be designed by future developers. The recommendations also supported the idea of a broader biodiversity network within Singapore, with Jurong Lake acting as a key urban biodiversity hotspot. The recommendations included guidelines for habitat area allocations on parcels, target habitat types, plant lists, and contemporary landscape architectural habitat enhancements at ground level and on green roofs. Providing habitat on the project s green roofs and through an elevated eco-grid, similar to New York s high line, was also considered, but these measures were found to be logistically unfeasible and more costly compared to ground-level habitat investments. The project also includes a major urban park with very high levels of biodiversity and multiple ecosystem services. Landscape Biodiversity Planning and Design System 19

28 score of 5. While the assessment of the existing condition is dependent on how the planning team defines scoring criteria, it is useful as a baseline for plan alternatives; however, if the protocol and criteria were standardized across a municipality or region, the LBI process can effectively compare the performance among different projects. In this and the following steps, LBI scores for areas of the plan may be mapped through a combination of on-site measurements, GIS, aerial photo analysis, and Excel-based calculations. Step 4) LBI Scoring of Plan Alternatives Once the LBI score is measured for the existing site condition, plan alternatives are created and impacts or preservation of existing condition LBI score areas are measured. Design typologies for new landscapes, that may include architectural strategies or ecological restoration, are developed, their spatial extent is planned, and LBI performance is measured for one or several scenarios. Often, a business as usual scenario is developed as a benchmark to demonstrate the improvement in performance of other more ecological robust scenarios. Areas of landscape typologies may be planned at a general level across land use types, parcels, or districts of a planning area in this early stage of master planning (e.g. at a basic level, the overall land area planned for coverage of each type of landscape, or at a more detailed level, the spatial layout of landscape types across parcels may be performed at this stage). Step 5) Parcel/Land Use Category LBI Score Targets and Guidelines (if applicable) Detailed landscape planning for individual parcels or land use categories may be performed, or guidelines for landscapes may be created. At Jurong Lake, rather than performing detailed parcel landscape design, parcel guidelines requireing total amounts of landscape coverage and target LBI scores were determined, and the LBI metrics were used as design guidlines that future developers can follow during detailed design. Such guidelines could play a similar role in municipal biodiversity policies or codes. Step 6) Detailed measurement of landscape design solutions If detailed landscape design is performed, LBI measurement of the design can be performed as is show in the Portland Integrating Habitats project on the following pages. Measurements are made using a combination of GIS and hand measurements. Native plant landscape at Millenium Park, Chicago IL 20 Landscape Biodiversity Planning and Design System

29 AECOM In 2008, Portland Metro (Portland, OR, USA) held the Integrating Habitats design competition. Participants created habitat design strategies for a number of typical land uses across the City. The AECOM team examined a typical city block and developed the strategy on the following page. LBI measurements were performed to evaluate performance between the existing condition (below) and final concept (next page). Existing Site Condition Score Existing Condition LBI Score: 0.89/5 Landscape Types Hardscape General Landscape Primary Habitat LBI Scores Score 1 Score 2 Score 3 Score 4 Score 5 Landscape Types LBI Scores Landscape Biodiversity Planning and Design System 21

30 The AECOM entry, Growing Together, took the People s Choice award and second place overall. The LBI assessment indicated more than a 100% improvement in biodiversity potential from the existing condition. Despite more than doubling the human population density. A key lesson of this case study is that biodiversity enhancement and density increases can be accomplished simultaneously. Integrating habitats into urban areas may become more important as the world s population becomes more urban and overall cultural connections with nature widen. Growing Together : Portland Metro Integrating Habitats Competition Entry Score Final Concept LBI Score: 1.93/5 Landscape Types Hardscape General Landscape Primary Habitat LBI Scores Score 1 Score 2 Score 3 Score 4 Score 5 Landscape Types LBI Scores 22 Landscape Biodiversity Planning and Design System
 meters 0 10 20 30 40 50 100 150 200 ecosystem planning area Lakeside: Elevated Greenery Lakeside: Landscape Major Open Space Lake landscape type Landscape Area: Habitat")
31 AECOM developed space lake architectural native wetland path architectural native landscape elevated greenery bio-swale native dryland forest elevated greenery ecosystem planning area landscape type biodiversity score (ibp) meters ecosystem planning area Lakeside: Elevated Greenery Lakeside: Landscape Major Open Space Lake landscape type Landscape Area: Habitat Landscape Area: Typical Landscape Landscape Area: Community Agriculture Landscape Area: High Carbon Sequestration Forest Hardscape biodiversity score (ibp) IBP Score 1 IBP Score 2 IBP Score 3 IBP Score 4 IBP Score 5 Conceptual section diagrams of landscape types and LBI scores for developed landscape and open space (next page) planning areas Landscape Biodiversity Planning and Design System 23
32 major open space sequestration forest passive landscape upland native forest native lowland forest emergent freshwater wetland lake ecosystem planning area landscape type biodiversity score (ibp) Step 7) Implementation and Verification Following construction, landscapes can be measured to ensure that performance metrics have been achieved. Overall biodiversity measurements could then be performed and achievement verified. Discussion We are excited to promote wider application of the system and LBI for planning and measuring project biodiversity performance. To our knowledge, no other projects have attempted to quantitatively assess biodiversity strategies at this level. Currently, many of the metrics, thresholds, and assumed performance benefits are not yet supported by focused scientific studies, but instead are based on sound landscape ecology principles; relevant supporting science when possible; our experience on projects and project analogs done by others; and measurements of local native ecosystems. Rapidly accelerating habitat loss, habitat fragmentation, and climate change are combining to drive a paradigm shift in biodiversity conservation strategies across the globe. Changes to ecosystems, especially changes to biota, hydrology, temperature, and storm patterns, are some of the direct impacts that many communities and biodiversity will face. Smarter community and regional land use design strategies that maintain and restore more robust habitat diversity and connectivity can help sustain biodiversity and ecosystem services as they are increasingly impacted by climate and land use change. This system and other new strategies for ecological infrastructure are helping to future proof communities for emerging environmental challenges and create more vibrant built and natural environments. 24 Landscape Biodiversity Planning and Design System
33 AECOM Precedent Biodiversity Planning Approaches Tools to measure and evaluate biodiversity within planning and design projects are critical for targeting and evaluating landscape options that may optimize biodiversity performance. AECOM s research into the current availability of biodiversity planning tools within development contexts yielded few precedents. The majority of research conducted has been within the realm of landscape ecology and conservation biology, and has focused largely on conservation in areas void of development or on specific protected species, rather than for comprehensive biodiversity or ecosystem preservation. Urban biodiversity tools tend to provide qualitative, policy guidance rather than specific guidelines or metrics for assessing design performance. For valuable examples of how comprehensive biodiversity performance may be considered and measured see: Natural Capital Project Matrix Matters: Biodiversity Research for Rural Landscape Mosaics UK Forestry Commission Biodiversity in Fragmented Landscapes Evaluating Biodiversity in Fragmented Landscapes: Applications of Landscape Ecology Tools ASLA Sustainable Sites Initiative Living Building Challenge Convention on Biological Diversity International Association for Landscape Ecology California Natural Communities Conservation Planning Landscape Ecology Principles in Landscape Architecture and Land Use Planning Portland Metro Nature in Neighbourhoods Singapore Index on Cities Biodiversity The Singapore Index on Cities Biodiversity (Singapore Index) is a tremendous example of a municipal to national-scale biodiversity planning and performance assessment framework. The Singapore Index focuses on evaluating existing ecological conditions as the basis for biodiversity performance targets, and policy level activities within cities and towns. The approach can also be used as a high-level design and planning framework for targeting broad-scale landscape structural guidelines and habitat connectivity. The Singapore Index was an important consideration in developing the LBI. However, we found that the Index was not suitable to quantify and compare biodiversity more specific design scenarios on smaller project sites. Therefore, one of our goals in developing the LBI was to create an approach for biodiversity design oriented projects that may fit within a broader regional or municipal framework, such as the Singapore Index. For additional information see: gettinginvolved/cbi.shtml Landscape Biodiversity Planning and Design System 25
;")
.")
, Mike Sands (Prairie Crossing), and the Singapore")


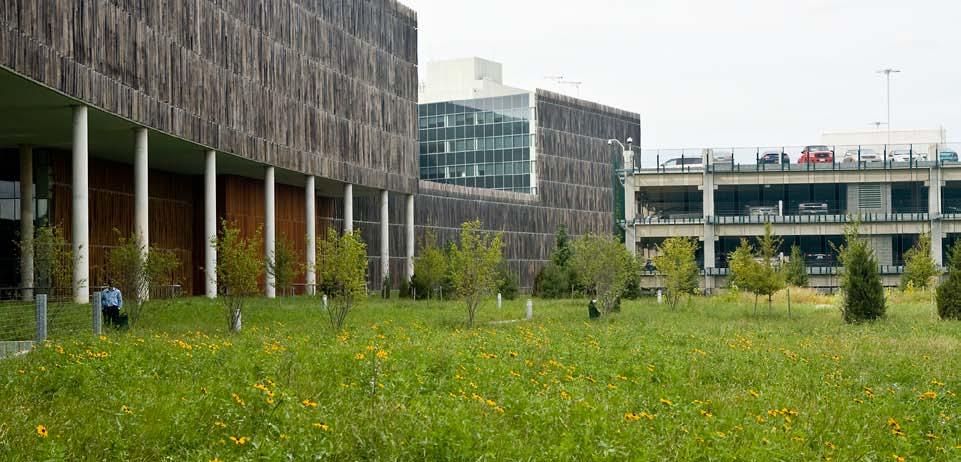
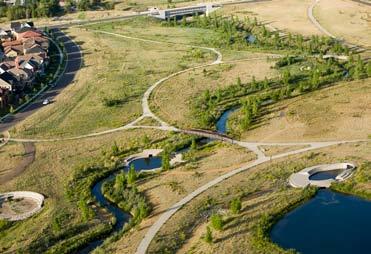
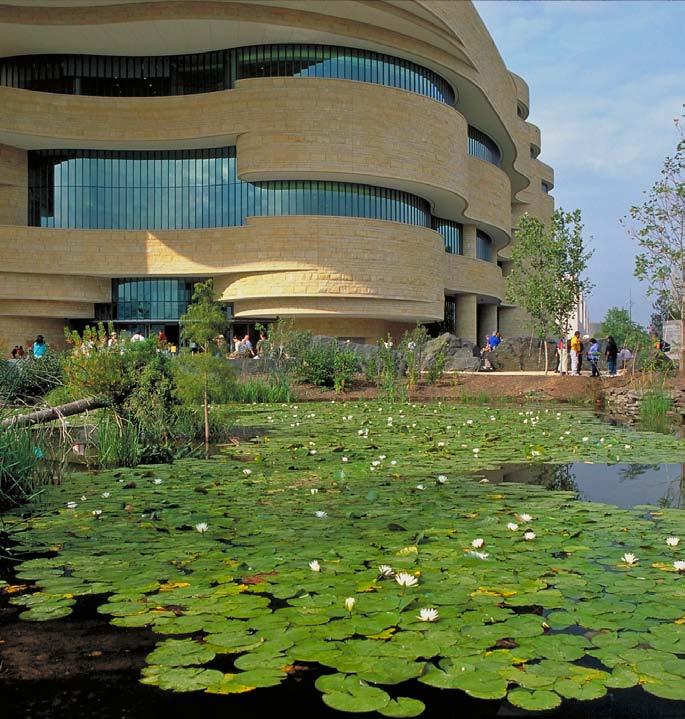
34 This document was prepared by Isaac Brown at AECOM in San Francisco, CA with contributions from Shaun O Rourke (Boston Architectural College - Urban Landscape Lab); David Gallacher and The Soe (AECOM Singapore); Claire Bonham-Carter and Chiaki Nakajima (AECOM San Francisco). Special thanks to Gary Grant from Green Roof Consultancy Limited (2012 London Olympics), Michael Boland (The Presidio Trust), Mike Sands (Prairie Crossing), and the Singapore Urban Redevelopment Authority and the National Parks Board for their generous contributions to this document. Cover Images: (Front) Echinacea pallida; Stapleton Central Park + Greenways, Denver, CO; US Census Bureau, Washington DC; National Museum of the American Indian, Washington, DC (Back) Back Cover Images: ; US Census Bureau, Washington DC; Kunshan Ma An Shan Road Landscape Design, Kunshan, China; Jinji Lake Waterfront Redevelopment + Landscape Master Plan, Suzhou, China; The Children s Hospital at Fitzsimons, Aurora, CO For more information contact: Isaac Brown isaac.brown@aecom.com San Francisco
Great Lakes Conservation Blueprint for Terrestrial Biodiversity on the Canadian Shield
 Great Lakes Conservation Blueprint for Terrestrial Biodiversity on the Canadian Shield Bonnie L. Henson 1, Kara E. Brodribb 2 and John L. Riley 3 1 Ontario Ministry of Natural Resources 2,3 The Nature
Key Elements of Successful Conservation Planning. John Paskus October 17, 2013 Pierce Cedar Creek Institute Michigan Natural Features Inventory
 Key Elements of Successful Conservation Planning John Paskus October 17, 2013 Pierce Cedar Creek Institute Michigan Natural Features Inventory What is Conservation Planning? Pressey et al (2008): The process
Lecture: Landscape Ecology
 Borderland: Border Landscapes Across Europe 2013 Lecture: Landscape Ecology Dr Iwona Markuszewska Department of Landscape Ecology iwmark@amu.edu.pl Presentation schedule: Landscape ecology as a scientific
BRE Strategic Ecological Framework LI Technical Information Note 03/2016
 BRE Strategic Ecological Framework Technical Information Note 03/2016 September 2016 Contents 1. Introduction 2. Aims of BRE s Strategic Ecological Framework 3. How SEF is different from previous approaches
Landscape Ecology and EA in Ontario:
 Landscape Ecology and EA in Ontario: Bridging Gaps in Biodiversity Assessment Christina Rehbein, Dr. Scott Mitchell & Dr. Mike Brklacich Carleton University OAIA 2017 18 October 2017 Biodiversity and EA
Conservation Corridor Planning and Green Infrastructure Themes
 Conservation Corridor Planning and Green Infrastructure Themes Prepared by the Green Infrastructure Center Inc. and the Northern Virginia Regional Commission February 22, 2011 Brief Overview Project Background
Phase I Ecological Network Report Terms of Reference
 Phase I Ecological Network Report Terms of Reference INTRODUCTION In 2007, the City of Edmonton created a new Natural Area Systems Policy (C-531) and a strategic plan, Natural Connections. Together, these
Landscape Conservation Design April, 2014
 Designing Sustainable Landscapes in the Northeast A project of the North Atlantic Landscape Conservation Cooperative & Northeast Climate Science Center Landscape Conservation Design April, 2014 Conceptual
Overview of Southwestern Pennsylvania Commission s (SPC) 2040 Long Range Transportation Plan (LRTP)
 2040 Long Range Transportation Plan (LRTP)") Overview of Southwestern Pennsylvania Commission s (SPC) 2040 Long Range Transportation Plan (LRTP) Presented to Pennsylvania Agency Coordination Meeting May 27, 2015 Doug Smith & Ryan Gordon 1 Southwestern
Overview of Southwestern Pennsylvania Commission s (SPC) 2040 Long Range Transportation Plan (LRTP) Presented to Pennsylvania Agency Coordination Meeting May 27, 2015 Doug Smith & Ryan Gordon 1 Southwestern
Building a green infrastructure concept and process in the Gauteng City Region, South Africa. Kerry Bobbins Researcher GCRO
 Building a green infrastructure concept and process in the Gauteng City Region, South Africa Kerry Bobbins Researcher GCRO kerry.bobbins@gcro.ac.za IGU Regional Conference Krakow, Poland 1 18 22 August
Florida Forever Conservation Needs Assessment Overview Maps
 Florida Forever Conservation Needs Assessment Overview Maps Prepared by Florida Natural Areas Inventory, The maps in this document are derived from the Florida Forever Conservation Needs Assessment, an
GREEN NETWORK APPLICATIONS IN ESTONIA
 GREEN NETWORK APPLICATIONS IN ESTONIA Kalev Sepp, Tuuli Veersalu, Martk Külvik Estonian University of Life Sciences 1 WHY? BACKGROUND - POLITICAL By adopting the Pan-European Biological and Landscape Diversity
Road Ecology in Practice: Building Resiliency of Urban Ecosystems through Informed Road Network Planning
 Road Ecology in Practice: Building Resiliency of Urban Ecosystems through Informed Road Network Planning Outline What is road ecology? Why is road ecology important? TRCA and road ecology application Peel
I ll be talking about the Designing Sustainable Landscapes project today. This is a large integrated modeling effort our group at UMass has been
 1 I ll be talking about the Designing Sustainable Landscapes project today. This is a large integrated modeling effort our group at UMass has been working on for the past 5 years, in close collaboration
Introduction. Introduction
 Introduction Introduction I MAGINE that in the next 10 to 20 years, we can begin to reshape Grounds to reflect the civic intent and environs created by Thomas Jefferson s Academical Village. Through a
Blue/Green Infrastructure Study Accomack County, VA
 Blue/Green Infrastructure Study Accomack County, VA Draft Asset Maps March 8-9, 2010 Green Infrastructure Center, Inc. 2 Overview What is Green and Blue Infrastructure Project Timeline & Tasks Literature
THE LANDSCAPE ECOLOGICAL ASSESSMENT MODEL AND ITS APPLICATIONS
 The 5 th International Conference of the International Forum on Urbanism (IFoU) 2011 National University of Singapore, Department of Architecture Global Visions: Risks and Opportunities for the Urban Planet
GIS to Estimate Archaeological Site Loss and Develop Conservation Strategies
 GIS to Estimate Archaeological Site Loss and Develop Conservation Strategies Terry Jackson Office of Decision Support Systems Planning and Environmental Management Division Georgia Department of Community
Green Infrastructure Policies and Ordinances
 Green Infrastructure Policies and Ordinances October 23, 2013 By Karen Firehock, Green Infrastructure Center 2013 Georgia Urban Forest Council s 23 rd Annual Conference The mission of the nonprofit Green
50-year Water & Wetland Vision for England WORKSHOP DETAILS
 50-year Water & Wetland Vision for England Workshop 3: Wetland vision maps; your feedback on draft maps, methodology and ways forward 7 th December 2006 WORKSHOP DETAILS Theme 1: Methodology and prioritisation
A Network Theory Framework for Urban Cultural Heritage Conservation. Manal Ginzarly LEMA, Université de Liège
 A Network Theory Framework for Urban Cultural Heritage Conservation Manal Ginzarly LEMA, Université de Liège Objective Develop an ecological approach to the integration of heritage conservation and urban
Appendix E: Illustrative Green Infrastructure Examples
 Appendix E: Illustrative Green Infrastructure Examples Integrating LID into San Francisco s Urban Landscape Figure E. High-density Residential Figure E. Low-density Residential Figure E. Mixed Use 7 Figure
Scorecard. WaterQuality. Appendix B USEPA WATER QUALITY SCORECARD APPENDIX B
 Appendix B USEPA WATER QUALITY SCORECARD EPA 231B09001 October 2009 http://www.epa.gov WaterQuality Scorecard Incorporating Green Infrastructure Practices at the Municipal, Neighborhood, and Site Scales
2.0 A FRAMEWORK FOR SUSTAINABLE GROWTH CONTENTS
 2-2 A Framework for Sustainable Growth 2.0 A FRAMEWORK FOR SUSTAINABLE GROWTH CONTENTS 2.1 MANAGING SUSTAINABLE GROWTH THE VISION TO 2031 2.2 GOALS AND OBJECTIVES 2.2.1 Protecting the Natural Environment
CONTENTS 2.0 A FRAMEWORK FOR SUSTAINABLE GROWTH 2.1 MANAGING SUSTAINABLE GROWTH THE VISION TO GOALS AND OBJECTIVES 2.3 MARKHAM STRUCTURE
 2 A Framework for Sustainable Growth 2.0 A FRAMEWORK FOR SUSTAINABLE GROWTH CONTENTS 2.1 MANAGING SUSTAINABLE GROWTH THE VISION TO 2031 2.2 GOALS AND OBJECTIVES 2.2.1 Protecting the Natural Environment
Appendix 1 Structure plan guidelines
 Appendix 1 Structure plan guidelines This appendix forms part of the regional policy statement [rps]. 1.1. Introduction Structure plans are an important method for establishing the pattern of land use
Mosaic of patches Agents of patch formation: Environmental constraints (Abiotic) Biotic processes Disturbances (natural and human induced)
 Biotic processes Disturbances (natural and human induced)") Landscape: Mosaic of patches Agents of patch formation: Environmental constraints (Abiotic) Biotic processes Disturbances (natural and human induced) Concepts for Quantification of a Landscape Landscape
Landscape: Mosaic of patches Agents of patch formation: Environmental constraints (Abiotic) Biotic processes Disturbances (natural and human induced) Concepts for Quantification of a Landscape Landscape
Countywide Green Infrastructure
 Montgomery County s Countywide Green Infrastructure F U N C T I O N A L M A S T E R P L A N The Maryland National Capital Park and Planning Commission INFRASTRUCTURE An underlying base or foundation especially
Consequences of Landscape Patterns on Flows of Energy, Nutrients, Organisms
 Consequences of Landscape Patterns on Flows of Energy, Nutrients, Organisms Consequences of Landscape Patterns on Flows of Energy, Nutrients, Organisms Questions: How does landscape structure influence
CALGARY: City of Animals Edited by Jim Ellis
 CALGARY: City of Animals Edited by Jim Ellis ISBN 978-1-55238-968-3 THIS BOOK IS AN OPEN ACCESS E-BOOK. It is an electronic version of a book that can be purchased in physical form through any bookseller
Cotswolds AONB Landscape Strategy and Guidelines. June 2016
 Cotswolds AONB Landscape Strategy and Guidelines June 2016 Cotswolds AONB Landscape Strategy and Guidelines Introduction The evolution of the landscape of the Cotswolds AONB is a result of the interaction
Western City District What we heard
 What we heard Vision to 2056 and Priorities Governance and implementation Infrastructure and funding The protection of the natural landscape including biodiversity and the Metropolitan Rural Area for food
3. Highway Landscaping Assessment
 Guidelines for Highway Landscaping 3-1 3. Highway Landscaping Assessment 3.1 Introduction This section outlines the steps necessary to assess the highway landscaping component of a state highway construction
Rochford District Council Allocations Development Plan Document: Discussion and Consultation Document Sustainability Appraisal
 Option SWH1 Balanced Communities Option SWH1 1 To ensure the delivery of high quality sustainable communities where people want to live and work Will it ensure the phasing of infrastructure, including
Executive Summary. Essential Connectivity Map (Figure ES-1)
") Executive Summary The California Department of Transportation (Caltrans) and California Department of Fish and Game (CDFG) commissioned the because a functional network of connected wildlands is essential
Executive Summary The California Department of Transportation (Caltrans) and California Department of Fish and Game (CDFG) commissioned the because a functional network of connected wildlands is essential
National Association of Conservation Districts. Kris Hoellen Vice President, Sustainable Programs The Conservation Fund September 19, 2013
 National Association of Conservation Districts Kris Hoellen Vice President, Sustainable Programs The Conservation Fund September 19, 2013 Our Mission The Conservation Fund forges partnerships to conserve
The urban block as a potential for sustainable urban design
 The Sustainable City X 69 The urban block as a potential for sustainable urban design M. Oikonomou Department of Urban Planning and Regional Development, Aristotle University of Thessaloniki, Greece Abstract
Green Infrastructure. by Karen Engel, NYS DEC. NYS Department of Environmental Conservation
 Green Infrastructure by Karen Engel, NYS DEC What is Green Infrastructure? For some it s all about water Green Infrastructure techniques use soils and vegetation to infiltrate, evapotranspirate, and/or
Arlington, Virginia is a worldclass
 EXECUTIVE S U M M A RY Arlington maintains a rich variety of stable neighborhoods, quality schools and enlightened land use policies, and received the Environmental Protection Agency s highest award for
Section 3b: Objectives and Policies Rural Environment Updated 19 November 2010
 Page 1 of Section 3b 3b RURAL ENVIRONMENT 3b.1 Introduction The Rural Environment comprises all the land outside of the Residential, Town Centre and Industrial Environments. Most land within the District
Green Star Change in Ecology Calculator Guide
 Green Star Change in Ecology Calculator Guide Date Issued: May 2014 CHANGELOG Version Release Date Description of Changes 1.0 August 2010 Release 2.0 June 2012 Updated for Green Star - Communities 3.0
Historic Asset Management A Decision Support Process for Balanced Consideration of Mission Utility, Historic Value, and Facility Condition
 Historic Asset Management A Decision Support Process for Balanced Consideration of Mission Utility, Historic Value, and Facility Condition Joe Lockerd; Cardno TEC Kurt Schweigert; Cardno TEC Adriane Fowler
ROLE OF LANDSCAPE CONSERVATION COOPERATIVES IN EVERGLADES RESTORATION
 ROLE OF LANDSCAPE CONSERVATION COOPERATIVES IN EVERGLADES RESTORATION GEER April 2017 Steve Traxler 1, Todd Hopkins 1, Beth Stys 2 1 US Fish and Wildlife Service 2 Florida Fish & Wildlife Conservation
A Joined-up Regional Landscape: A Roadmap to connect the parts
 Breaking the Barriers: Engineering Solutions to Ecological Problems A Joined-up Regional Landscape: A Roadmap to connect the parts Associate Professor Darryl Low Choy Urban Research Program Outline Nature
Article 6 Tree Protection
 Article 6 Tree Protection 8.1 Purpose 8.2 Applicability 8.2.1 General Provisions 8.2.2 Exemptions 8.3 Permitting Procedure 8.4 Planting Procedure 8.5 Performance Guarantee Required for Belated Planting
Animating the Rideau Canal December 2013
 Executive Summary Animating the Rideau Canal December 2013 Why study the Rideau Canal? The Rideau Canal has been an important part of Ottawa throughout its history, and has shaped and been shaped by the
NEW REGIONAL OFFICIAL PLAN HIGH LEVEL PROCESS & FRAMEWORK
 NEW REGIONAL OFFICIAL PLAN HIGH LEVEL PROCESS & FRAMEWORK Why A New Official Plan Originally the role of Regionally Planning and content of Regional Official Plan (1970s) primarily focused on protecting
A global view of integrated closure and legacy planning
 18 September 2013 A global view of integrated closure and legacy planning Mine Closure 2013, Eden Project, Cornwall Dr. William Adams General manager, Legacy and Closure A changing business climate The
Southwest Florida Water Management District Conservation Land Acquisition Project Boundary Review Ecological GIS Decision Support System Final Report
 Southwest Florida Water Management District Conservation Land Acquisition Project Boundary Review Ecological GIS Decision Support System Final Report Introduction By: Tom Hoctor, Ph.D. Director, Center
Working Group Meeting
 April 4,, 2017 Parks Operations Bldg Working Group Meeting Arts Districts Overview Stormwater/RPA/Stream Considerations First Principles Agenda 7:00pm 7:05pm 7:10pm 7:40pm 8:30pm 9:40pm 9:45pm Welcome
SAN RAFAEL GENERAL PLAN 2040 INTRODUCTION AND OVERVIEW
 SAN RAFAEL GENERAL PLAN 2040 INTRODUCTION AND OVERVIEW Steering Committee Presentation February 14, 2018 Purpose of General Plan Guide land use and development decisions Coordinate transportation, infrastructure,
RECREATION, OPEN SPACE AND GREENWAYS ELEMENT GOALS, OBJECTIVES, AND POLICIES
 RECREATION, OPEN SPACE AND GREENWAYS ELEMENT GOALS, OBJECTIVES, AND POLICIES GOAL R-1: DEVELOP A RECREATION, OPEN SPACE AND GREENWAYS SYSTEM AS AN INTEGRAL COMPONENT OF AN OVERALL, COUNTY-WIDE ECONOMIC
Natural Elements Potential in Urban Landscape
 MDS1123 Natural Elements Potential in Urban Landscape By: Khairul Kamarudin Being outside in natural surroundings is good for us, for our health benefit... Stress relief, improvement in mood states accompanied
Building Ecological Solutions to Coastal Community Hazards: Guidance and NJ Coastal Community Assistance
 Building Ecological Solutions to Coastal Community Hazards: Guidance and NJ Coastal Community Assistance Stacy Small-Lorenz National Wildlife Federation Restore America s Estuaries Summit New Orleans,
The Salt Marsh Advancement Zone Assessment of Connecticut
 The Salt Marsh Advancement Zone Assessment of Connecticut Front cover image: Salt marsh advancement zones in Stratford, CT from the Comprehensive Map Book of Stratford, CT. Table of Contents Introduction...
Minnesota Department of Natural Resource - Natural Resource Guidance Checklist Conserving Natural Resources through Density Bonuses
 Minnesota Department of Natural Resource - Natural Resource Guidance Checklist Conserving Natural Resources through Density Bonuses NRDB Why Use Density Bonuses & This Checklist Local units of government
TOPIC PAPER 2: Links to other sustainability tools
 TOPIC PAPER 2: INTRODUCTION 1.1 Landscape Character Assessment can inform a range of other sustainability tools and methodologies. Equally these other tools may assist in reaching decisions concerning
IMPLEMENTING SOMERSET COUNTY S INVESTMENT FRAMEWORK
 IMPLEMENTING SOMERSET COUNTY S INVESTMENT FRAMEWORK SMART CONSERVATION THROUGH SMART GROWTH NJ LAND CONSERVATION RALLY March 22, 2014 Laurette Kratina, PP, AICP, Supervising Planner Somerset County Planning
LANDSCAPE SCALE PLANNING AND SITING FOR SHALE DEVELOPMENT
 LANDSCAPE SCALE PLANNING AND SITING FOR SHALE DEVELOPMENT An Energy by Design approach to reducing the overall environmental footprint. MICHELLE MCGREGOR SR. OIL & GAS DEVELOPMENT ADVISOR Agenda Introduction
Wetland Design Manual. A1: Vision, core outcomes and aspirational outcomes
 Wetland Design Manual A1: Vision, core outcomes and aspirational outcomes Table of contents Introduction 5 Vision 6 Core outcomes 7 Effective pollutant removal and flow management... 7 Community safety...
Elderberry Walk. Developer HAB Housing
 Case studies Elderberry Walk Developer HAB Housing Development of 161 new homes on the former Dunmail Primary School site, focused around a central green street, with retained trees, new multifunctional
3. Neighbourhood Plans and Strategic Environmental Assessment
 1. Introduction This report sets out a draft Screening Determination for the Preston Parish Council s Neighbourhood Plan and has been prepared by rth Hertfordshire District Council. The purpose of the
GREEN INFRASTRUCTURE PLANNING GUIDE
 GREEN INFRASTRUCTURE PLANNING GUIDE Authors: C Davies, R MacFarlane, C McGloin, MRoe. Abbreviation Green Infrastructure is frequently abbreviated to as GI and Green Infrastructure Planning as GIP. Contents
Ipswich Issues and Options for the Ipswich Local Plan Review, August 2017, Public Consultation
 Ipswich Issues and Options for the Ipswich Local Plan Review, August 2017, Public Consultation Having reviewed the issues and options documents, the Society has made the following response: Part 1 Strategic
2011 ASLA Design Awards
 2011 ASLA Design Awards Interstate 70 Mountain Corridor Aesthetic Guidance Honor Award Design Workshop, Aspen / THK Associates, Inc. / CH2MHill Planning and Urban Design Project Title: Interstate70 Mountain
DUBLIN DOCKLANDS MASTER PLAN AND RELATIONSHIP WITH OTHER PLANS
 .1 National Policy and Programmes.1.1 Sustainable Development A Strategy for Ireland, 1997.1.2 National Climate Change Strategy, 2007-2012.1. National Development Plan 2007-201.1.4 National Spatial Strategy,
4 Sustainability and Growth Management
 4 Sustainability and Growth Management Introduction Traditionally, has assumed growth and development with limited consideration for the long-term negative social, environmental or economic impacts on
Toronto Complete Streets Guidelines
 Toronto Complete Streets Guidelines 108 110 7.1 Green Infrastructure Design Principles 112 7.2 Context-Sensitive Green Streets 114 7.3 Key Green Street Elements Green infrastructure refers to natural and
Creating Complete Roadway Corridors:
 Creating Complete Roadway Corridors: The AASHTO Guide to Transportation Landscape Architecture and Environmental Design NCHRP Project 15-33 Status Report AASHTO Standing Committee on Design Technical Committee
General Manager of Planning, Urban Design and Sustainability
 ADMINISTRATIVE REPORT Report Date: May 2, 2017 Contact: Katherine Isaac Contact No.: 604.873.7167 RTS No.: 10847 VanRIMS No.: 08-2000-20 Meeting Date: May 16, 2017 TO: FROM: SUBJECT: Vancouver City Council
UNIVERSITY TOWN NEIGHBOURHOODS 5.2 ECO-CORRIDOR MELBOURNE CAMPUS MASTER PLAN 2014
 5.2 ECO-CORRIDOR 37 ECO-CORRIDOR EXISTING CONDITIONS & VISION NEIGHBOURHOOD VISION Investment in the Eco-corridor Neighbourhood will signify the University s commitment to supporting local ecology and
Urban Design Manual PLANNING AROUND RAPID TRANSIT STATIONS (PARTS) Introduction. Station Study Areas
 Introduction. Station Study Areas") 111111 PLANNING AROUND RAPID TRANSIT STATIONS (PARTS) Introduction The ION rapid transit system will link Waterloo, Kitchener and Cambridge through a central transit corridor (CTC). There are a number
111111 PLANNING AROUND RAPID TRANSIT STATIONS (PARTS) Introduction The ION rapid transit system will link Waterloo, Kitchener and Cambridge through a central transit corridor (CTC). There are a number
Official Plan Review
 Official Plan Review Summary Report - The Built Environment August 2014 Part 1: Introduction Planning for a healthy, prosperous and sustainable community is an important goal for our municipality. From
2.0 A FRAMEWORK FOR SUSTAINABLE GROWTH CONTENTS
 2-2 A Framework for Sustainable Growth 2.0 A FRAMEWORK FOR SUSTAINABLE GROWTH CONTENTS 2.1 MANAGING SUSTAINABLE GROWTH THE VISION TO 2031 2.2 GOALS AND OBJECTIVES 2.2.1 Protecting the Natural Environment
TRANSPORTATION AND LAND USE
 CHAPTER 10 TRANSPORTATION AND LAND USE Transportation and land use are intimately linked. The expansion of a highway typically spurs housing, employment growth and land development in the communities that
THE CORPORATION OF THE CITY OF WINDSOR Office of the City Solicitor Planning Department
 THE CORPORATION OF THE CITY OF WINDSOR Office of the City Solicitor Planning Department REPORT TO THE CITY OF WINDSOR PLANNING ADVISORY COMMITTEE DATE OF REPORT: August 19, 2010 SUBJECT: Official Plan
Potential Solutions to Transportation-Wildlife Conflicts An Overview. Tony Clevenger WTI Montana State University
 Potential Solutions to Transportation-Wildlife Conflicts An Overview Tony Clevenger WTI Montana State University Effects on wildlife Habitat loss Wildlife mortality Decrease habitat quality Habitat fragmentation
Tri-County Transportation & Land Use Study. Steering Committee Meeting May 14, 2009
 Tri-County Transportation & Land Use Study Steering Committee Meeting May 14, 2009 Agenda Recap of Study Goals and Objectives Update on CV Land Use Model: Business as Usual (BAU) Growth Scenario Pros vs
THREE-STEP DESIGN PROCESS FOR OPEN SPACE SUBDIVISIONS
 00216106.DOC NMA/RRK 1/30/14 THREE-STEP DESIGN PROCESS FOR OPEN SPACE SUBDIVISIONS Open space subdivisions, sometimes called cluster developments, maintain a significant portion of a development site in
New-Cast Mixed-use Development Proposal King Street West, Newcastle, Ontario
 URBAN DESIGN BRIEF New-Cast Mixed-use Development Proposal King Street West, Newcastle, Ontario TABLE OF CONTENTS: 1.0 Executive Summary 2.0 Creating Vibrant and Sustainable Urban Places: Excerpts from
TRCA Field Staking Protocol December 2016
 Page 1 of 6 TRCA Field Staking Protocol December 2016 This Protocol describes TRCA staff s current practice for field staking the physical top of bank, the physical toe of slope, and the limit of existing
Table of Contents TABLE OF CONTENTS SECTION TITLE PAGE
 TABLE OF CONTENTS SECTION TITLE PAGE 1 INTRODUCTION AND OVERVIEW 1-1 1.1 Purpose and Need 1-1 1.2 Goals and Objectives 1-3 1.3 Overview of the Planning Process 1-5 1.4 Federal and State Requirements and
OUR GREATER SYDNEY A metropolis of three cities. OVERVIEW. connecting people. DRAFT Greater Sydney Region Plan
 OUR GREATER SYDNEY 2056. A metropolis of three cities. OVERVIEW. connecting people. DRAFT Greater Sydney Region Plan October 2017 This document is an overview of the draft Greater Sydney Region Plan. To
This page has been intentionally left blank.
 This page has been intentionally left blank. Chapter 3 3-2 3. Employment 3.A Niagara Economic Gateway 3.A.1 General The Niagara Economic Gateway comprises: a) The Gateway Economic Zone which includes all
Green Infrastructure for Resiliency
 Green Infrastructure for Resiliency Climate Resilience Webinar Series Kendra J. Briechle U.S. Department of Housing and Urban Development Disclaimer This presentation is intended to provide communities
8.0 Design and Form of Development 43/
 42/ 8.0 Design and Form of Development 43/ Rothwells Farm, Golborne/ Development Statement Figure 7. Site Constraints Key 44/ Site Boundary 360 Bus Route/Stops Existing Trees Underground Water Pipe Sensitive
LANDMAP Methodology Overview
 LANDMAP Methodology Overview June 2017 Jill Bullen, Senior Landscape Specialist jill.bullen@cyfoethnaturiolcymru.gov.uk 0300 065 4706 (Please note this is an information document and not a training presentation)
Smart City Governance URBIS Solutions. David Ludlow, Assoc. Professor European Smart Cities University of the West of England, Bristol
 Smart City Governance URBIS Solutions David Ludlow, Assoc. Professor European Smart Cities University of the West of England, Bristol Integrated smart city model Smart Mobility Services focused on decreasing
City of Surrey Ecosystem Management Study. Integration of ecological processes with land use
 City of Surrey Ecosystem Management Study Integration of ecological processes with land use Natural areas in Surrey are changing as the City grows and evolves. Many important natural areas remain or may
Abu Dhabi Public Realm Design Manual
 Abu Dhabi Public Realm Design Manual Application for the 2011 ISOCARP Award for Excellence Explanatory Report July 2011 Abu Dhabi Urban Planning Council (UPC) Abu Dhabi, United Arab Emirates (UAE) 1. Project
Stormwater Standards. Clackamas County Service District No. 1. Planting Guide for Buffers
 Stormwater Standards Clackamas County Service District No. 1 APPENDIX B Planting Guide for Buffers Table of Contents Appendix B - Planting Guide for Buffers... Page B.1 General... 1 B.1.1 Introduction...
Green Infrastructure. NYS Department of Environmental Conservation
 Green Infrastructure Green infrastructure is an interconnected network of natural areas and open spaces that sustains ecosystems. Benedict, M.A. and E.T. McMahon. 2006. Green Infrastructure Linking Landscapes
Objectives and Strategies for the Integration of Recreation, Parks and Open Space in Regional Plans
 BULLETIN 2 Objectives and Strategies for the Integration of Recreation, Parks and Open Space in Regional Plans TABLE OF CONTENTS Introduction 3 Land-use Framework Outcomes 1 4-8 Land-use Framework Outcomes
Prioritizing Tidal Wetlands: A Landscape Approach
 Prioritizing Tidal Wetlands: A Landscape Approach Laura Brophy Director, Estuary Technical Group Institute for Applied Ecology Corvallis, OR College of Earth, Ocean and Atmospheric Sciences, Oregon State
INTEGRATING PROTECTED AREAS INTO THE WIDER LANDSCAPE, SEASCAPE AND RELATED SECTORS. An Overview
 INTEGRATING PROTECTED AREAS INTO THE WIDER LANDSCAPE, SEASCAPE AND RELATED SECTORS An Overview USING AN EXAMPLE FROM NORTHEAST US Relationship of IPAWLS guide to other planning and assessment processes
Presentation to Parks and Open Space Advisory. Committee September 22, 2016
 Flood Planning & Preliminary Design Services for South St. Vrain Creek Restoration at Hall Ranch Presentation to Parks and Open Space Advisory Prepared for: Boulder County, Colorado Committee September
B4. Te tiaki taonga tuku iho - Natural heritage
 B4. Te tiaki taonga tuku iho - Natural heritage Tuia I runga, tuia i raro, tuia ki te waonui a Tiriwa Bind the life forces of heaven and earth to the great realm of Tiriwa B4.1. Issues Auckland s distinctive
Chapter 5: Natural Resources and Environment
 NATURAL RESOURCES AND ENVIRONMENT 5-1 5 Chapter 5: Natural Resources and Environment BACKGROUND AND INTENT Urban expansion represents the greatest risk for the future degradation of existing natural areas,
Inspiring Technovation
 1 2 Table of content List of table and figures... Executive summary... 1. Introduction... 2. Material and methods... 3. Results... 3.1 Today s facts about Versailles: a diagnostic approach... 3.1 Vision
Peninsular Florida Landscape Conservation Cooperative. Marine and Estuarine Priority Resources and Conservation Targets
 Peninsular Florida Landscape Conservation Cooperative Marine and Estuarine Priority Resources and Conservation Targets Why are we here today? Workshop Goals: Develop a list of potential conservation targets